 Daniel R. Lammel
 Tobias Arlt
 Ingo Manke4
 Matthias C. Rillig
- 1Institut für Biologie, Freie Universität Berlin, Berlin, Germany
- 2Berlin-Brandenburg Institute of Advanced Biodiversity Research, Berlin, Germany
- 3Technical University Berlin, Berlin, Germany
- 4Helmholtz-Zentrum Berlin, Berlin, Germany
Soil carbon is essential for soil and ecosystem functioning. Its turnover and storage in soil are multifaceted processes that involve microbial activity in complex physical matrices. Biological litter, which include plants, animals, and microorganisms, is decomposed in soil stimulating soil biota (archaea, bacteria, fungi, protists, and animals) activity and yielding soil organic matter (SOM). Such decomposition processes are influenced by local physico-chemical characteristics including the spatial distribution of aggregates and pores. More refined analytical tools are needed to better understand these processes, especially considering the spatial 3D structure of soil matrices. Using synchrotron radiation (X-ray) micro computerized tomography (SR-μCT), we tested different contrast agents (staining methods) based on silver (Ag), eosin (Br based), and liquid and gaseous iodine (I) in order to spatially image biological material and SOM in soil samples. We also performed K-edge SR-μCT for the Ag and I2 treatments and conventional μCT for additional soil samples applying the I2 treatment. Our results indicated that I2 was the most efficient contrast method for SR-μCT imaging of soil samples. I2 qualitatively improved the images, but mainly, by using the K-edge SR-μCT, this method provided a powerful tool to determine the spatial location of SOM. We acknowledge that the use of SR-μCT is an expensive technique to study soil samples, which comes with bottlenecks in terms of access to facilities and measurement time. Nevertheless, we show that the I2 treatment improved soil images also using standard μCT. In conventional μCT the I2 treatment improved the visualization of biological material and consequently improved the qualitative analysis of fine plants roots and micro-fauna (Collembola). This improvement may have a positive implication in soil biology, by improving a non-destructive method to detect fungi (SR-μCT), soil fauna (conventional μCT) and roots in undisturbed soil samples. An unexpected finding was that the I2 treatment also stained the plastic sample containers (nylon and polyimide), indicating the potential for the I2 staining procedure to be applied for the detection of plastic pollution in soil samples.
Introduction
Soil organic matter (SOM) is essential to improve soil and ecosystem functioning. The concepts of soil quality and capability (Bouma et al., 2017; Bünemann et al., 2018) imply the capacity of a soil to sustain diverse functions, including biomass production, organic carbon (C) storage, and the promotion of biodiversity. From this perspective, SOM is a key component, because it is an important source of C and also of a variety of organic material (including nitrogen and metal-compounds) that can be used as energy and a nutrient source to support the soil microbiota and the consequent food chain. In this context, for example, low SOM can serve as a limitation, usually yielding lower biological diversity and biomass (plants, fauna, and microbiota) (Nielsen et al., 2011; Luo et al., 2018). On the other hand, soils with higher SOM usually have higher biodiversity, biomass and more diverse ecosystem functions (Xu et al., 2013; Bastida et al., 2016; Luo et al., 2018; Tian et al., 2018). Currently, SOM is receiving increasing attention due to the potential of soils to store carbon C and reduce atmospheric CO2 levels, while at same time improving soil fertility (Lammel et al., 2017; Garratt et al., 2018).
Soil organic matter is not only important because of the role that it plays in soil carbon and nitrogen cycles, but also because SOM affects soils in three important ways: it acts as a substrate for microbial activity, as an agent to bind different mineral fractions in soil aggregates, and as an agent to change soil physical-chemical characteristics by improving mineral nutrient storage, water storage, and chelating pollutants (Cotrufo et al., 2015; Han et al., 2016; Zheng et al., 2016). Thus, SOM usually increases soil fertility and improves soil structure by increasing aggregation, porosity, and resistance to erosion (Zheng et al., 2016; Totsche et al., 2018). Consequently, SOM shapes habitats for soil biodiversity and improves plant growth, thus affecting the whole associated food web (Lammel et al., 2015; Laliberté et al., 2017; Baveye et al., 2018).
Soil carbon turnover and storage in soil are complex processes that involve microbial activity in complex physical matrices (Baveye et al., 2018; Totsche et al., 2018). Depending on the local physical-chemical characteristics of the soil, biological litter (that includes dead tissue from plants, animals, and microorganisms) is decomposed in the soil, stimulating the activity and diversity of biota, including bacteria, fungi, protists, and soil fauna, and yielding SOM (Cotrufo et al., 2015). In our article, we differentiate biological material as the organisms' tissues that can be morphologically recognized in the soil samples and SOM as the amorphous decomposed material that cannot be related to its biological origin anymore. During SOM turnover and storage in soil, the spatial distribution of C in the aggregates and pores is critical for biological activity and soil structure (Van Loo et al., 2014; Steffens et al., 2017; Tecon and Or, 2017; Totsche et al., 2018). On the other hand, the SOM position is associated with the attachment of mineral particles forming the aggregates and pores themselves (Totsche et al., 2018). This also includes plant residues and fungal hyphae, which may foster soil aggregation and thus pore properties (Oades and Waters, 1991). The pores vary in size from few nm to mm, and their size regulates water, solute and air diffusion rates. The pore size also compartmentalizes biotic habitats, as for example some bacterial cells can occupy pores with <1 μm, while fungal hyphae usually have diameters of 5–10 μm and thus need more space (Tecon and Or, 2017; Totsche et al., 2018). In addition, the spatial location of SOM will make it available or unavailable for microbial activity (Tecon and Or, 2017; Totsche et al., 2018).
To gain a better understanding of the interaction of SOM with biotic and abiotic factors, better analytical tools are needed, especially considering the spatial 3D structure of the soil matrices (Baveye et al., 2018). Among the diverse techniques that are currently used (for details see the review from Baveye et al., 2018), one of the more promising techniques entails micro-computerized X-ray tomography (μCT). It serves as a powerful tool to analyze soil structure, including aggregates and porosity (Zabler et al., 2008; Peth et al., 2014; Couradeau et al., 2018; Quigley et al., 2018; Totsche et al., 2018). The μCT technique may also be used as a non-destructive method to analyze the soil biota, for example, detecting fine roots and micro-fauna (Mooney et al., 2012; Guimarães et al., 2017). Thus, μCT is an important technique that can be coupled with other methods, such NanoSIM and SEM, to better elucidate the interface of physical, chemical, and biological aspects of the soil (Baveye et al., 2018; Schlüter et al., 2019). Previous studies have investigated the use of contrast agents to locate SOM and for qualitative analysis of biological material using μCT (Boyde et al., 2014; Peth et al., 2014; Van Loo et al., 2014; Li et al., 2015). The principle is that organic matter has strong affinity for some heavy elements and that these elements (with Z > 30) increase the X-ray attenuation, thus improving imaging contrast (Van Loo et al., 2014). Among the most effective agents for soil, silver (Ag) stands out (Van Loo et al., 2014; Niehaus et al., 2016). Several other heavy metals bind with SOM, such as Cu, Co, Fe, Mn, Mo, and Zn, but since they naturally occur in soil, they should be avoided as contrast agents to reduce confounding effects. Other efficient agents include lead (Pb) and osmium (Os) tetroxide (Peth et al., 2014; Rawlins et al., 2016), but these are more toxic materials whose use should be avoided when possible (Van Loo et al., 2014). Iodine (I) is another important staining agent for organic matter in soil and its gaseous form I2 has been recently reported as an effective contrast for μCT of animal specimens (Boyde et al., 2014; Li et al., 2015). Eosin (Br based) was likewise reported as a highly effective enhancer for μCT of human tissues (Busse et al., 2018), but both gaseous I2 and eosin, have not been tested in soil samples yet. In addition, the use of some heavy metals enables K-edge measurements. Every element has a K-edge energy value that excites the K-shell electron of an atom. When an atom is stimulated with that specific energy, there is an abrupt change in the X-ray attenuation value, thus allowing the detection of that specific element. Thus, K-edge μCT measurements allow the spatial imaging of specific elements, such as the contrast agents Ag and I, and thus improve the indirect detection of organic material in the soil samples (Peth et al., 2014; Egan et al., 2015).
New advances in μCT image resolution, coupled or not with K-edge measurements, enable greater accuracy to locate and image SOM and biological material in soil, such as plant material and fungal hyphae. The best resolution of μCT can be achieved by using synchrotron radiation (SR). However, access to SR-μCT is still restricted to a few facilities worldwide and thus measurement time is limited due to sharing the facility with other research fields. Since time and access to the facilities is limited, the report of new technical improvements is highly relevant and in turn can benefit other researchers in the environmental sciences. Likewise, this may contribute to a better understanding of the interaction between SOM, soil organisms, like fungi, the soil matrix and associated biological processes (Lehmann and Rillig, 2015; Tecon and Or, 2017; Totsche et al., 2018).
While standard μCT mainly allows the qualitative evaluation of biological material in the samples, such as morphological aspects of specimens (Mooney et al., 2012; Boyde et al., 2014; Busse et al., 2018), the K-edge SR-μCT can generate quantitative information about the SOM distribution (Peth et al., 2014; Rawlins et al., 2016). Qualitative improvement of the images by contrast agents may favor better root and soil organism detection by improving the attenuation density of the biological material (e.g., root) in relation to the soil pore space (Mooney et al., 2012). The K-edge SR-μCT quantitative approach is limited to target some elements with high Z that bind to the SOM (e.g., Ag or I2), so the test of the applicability of such elements is the first step for future quantitative application of this approach.
The objective of this study was to test different contrast agents, including silver (Ag), eosin (Br based) as well as liquid and gaseous iodine (I), in order to qualitatively analyze SOM and biological material in soil samples using SR-μCT. The second objective was to test K-edge μCT for the Ag and I2 treatments, and the third objective to test the I2 staining using conventional μCT. To the best of our knowledge, eosin and gaseous I2 have not previously been reported in tests for μCT of biological material in soil samples. Likewise, I and Ag were not previously reported as staining agents of SOM using K-edge SR-μCT of soil samples. Our expectation was that I2 is the best agent. In its gaseous form, it potentially has higher penetration power in soil aggregates and produces less impact on the soil structure while other liquid contrast agents could be less efficient (Baveye et al., 2018).
Materials and Methods
Soil Samples
Soil was collected from 0 to 30 cm depth from a meadow at the agricultural experimental station of the Humboldt University in Dahlem (Berlin, Germany). The soil was identified as an Albic Luvisol (World Reference Base for soil resources, 1998). Soil samples were air dried and stored at room temperature (RT) until use. It had the following physical-chemical characteristics: 73.6% sand, 18.8% silt, 7.6% clay; pH 7.1 (CaCl2) (analyses conducted by LUFA Rostock Agricultural Analysis and Research Institute, Germany); 1.87% C (total); and a C/N ratio 15.6 (analyzed on an Euro EA C/N analyzer, HEKAtech GmbH, Wegberg, Germany) (Morris et al., 2019). The soil fraction later sieved to 53–500 μm contained 1.1% C and the fraction sieved 2–4 mm 1.6% C.
Staining Processes (Contrast Agents)
Soil samples were dry sieved to 38–500 μm and added inside 5 mm long Kapton® polyimide tubes (ca. 1.640 mm internal diameter and 75 μm wall thickness; this was the optimal size to achieve maximum resolution at the SR-μCT facility). The tubes had one of the sides blocked by a cut 10 μl pipet tip (Cleanline, Germany) filled with cotton, following a similar design to Van Loo et al. (2014). The soil was sieved to a diameter that fits in the small tubes (500 μm) and to exclude small fractions that could spill through the bottom of the containers (38 μm). These soil containers were then placed inside 1.5 ml centrifuge tubes and the soil underwent the following staining procedures:
1) Control (no treatment);
2) Lugol (aqueous solution of I2KI, Sigma 32922), 5 μl of the solution was pipetted in the upper part of the soil container (the soil was visually saturated);
3) Eosin (Merck Certistain®, Y 15935), 5 μl of a 30% solution (wt/vol in ultrapure water) was pipetted into the soil container;
4) AgNO3 (Roth, 7908), 5 μl of a 0.3% solution (wt/vol in acetate buffer, Niehaus et al., 2016) was pipetted into the soil container;
5) Fixed-sample and Eosin [modified from Busse et al. (2018)], first, 5 μl of fixative solution (950 μl of formaldehyde solution and 50 μl glacial acetic acid) was pipetted into the soil container and then incubated overnight 4°C. The next day the tube was slowly centrifuged at 100 g for 2 min and washed twice with Dulbecco's phosphate-buffered saline solution (DPBS, Thermo Fischer, D8537). Then Eosin was applied as explained for treatment “3.”
6) I2 (Sigma-Aldrich, 207772), first iodine powder was added to the bottom of a 2 ml cryogenic tube and covered by a layer of glass beads (1 mm). The soil container was then placed over the glass beads and the cryogenic tube lid hermetically closed to concentrate I2 gas inside the tube. The cryogenic tube was incubated 1 h at 40°C and later it was placed inside a 50 ml conical tube and kept in a fume hood; and
7) Eosin + AgNO3 (treatments 3 + 4).
Upon completion of the staining procedures, the centrifuge tubes were closed and samples incubated for 24 h at RT. After incubation, samples 2, 3, 4, 5, and 7 were washed to remove residual product. For washing, the following solutions were pipetted into the soil containers and removed by slow centrifugation (100 g for 2 min): twice 5 μl DPBS, once 5 μl Ethanol 50% (Roth, P075 in ultrapure water), and once 5 μl Ethanol 96% (Roth, P075). All the soil containers were then externally cleaned with hypochlorite 3%, rinsed with deionized water, transferred to new 0.5 ml centrifugation tubes and dried overnight at 40°C. The next day the samples were sealed with hot glue and submitted to tomography analysis.
Synchrotron Based μCT
Analyses were performed at the tomography station of the electron storage ring BESSY II at Helmholtz-Zentrum Berlin (HZB), Germany, located at the BAMline. For most of the SR-μCT measurements we used 16 keV, and for image acquisition, a pco4000 camera system with a total resolution of 4,008 × 2,672 pixel CCD chip and 20-fold magnification optics (Olympus). Tomography acquisition was performed over 180°, with 2,200 projections, each with 2 s exposure time (Arlt et al., 2013). A low phase contrast using a detector-sample-distance of 15 mm was applied. The spatial resolution (and resulting voxel size) was therewith set to 0.438 μm and a field of view of 1.6 mm × 1.2 mm width and height.
Absorption Edge CT
For absorption edge μCT (here at K-edges of tracing materials) we used comparative imaging of tomographies made with energy slightly below and above the element edges, considering I K-edge (33.2 keV) and Ag K-edge (25.5 keV) energy. Again, a 180° scan using 2,200 projections with an exposure time of 2 s was performed. The spatial resolution has been retained.
Conventional μCT of the I2 Treatment
We performed a second experiment to qualitatively test the improvement of the I2 treatment using conventional μCT. For this experiment we prepared larger soil containers (polyimide tubes ca. 4 mm internal diameter and 1 cm long) and blocked one side of the tube with a 200 μl cut pipet tip (like the previous design, but not filled with cotton) with a 28 μm nylon mesh attached between the tube and the pipet tip. We used the nylon mesh to reduce reaction of I2 with the cotton fiber and to facilitate I2 penetration into the samples. All these samples were analyzed at least in duplicates. We applied the I2 treatment (previously described) to the follow samples:
1) artificial soil control, no SOM, no soil C (mix of 30% kaolinite, Sigma-Aldrich 03584, 30% montmorillonite, Sigma-Aldrich 281522, and 40% sand, Roth 8441.1). Inside this control we added a root fragment of app. 1 cm (dried root of Plantago lanceolata) and soil animals (three dead individuals of the Collembola species Folsomia fimetaria cultivated in our lab). We intended with this design to test if the I2 staining was selective for organic material and not for the inorganic fraction.
2) soil aggregates between 2 and 4 mm with 1.6% C (from the Dahlem research center, as previously described, but sieved 2–4 mm).
3) undisturbed soil cores with 1.5% C (from a garden soil, at the Freie Universität Berlin). For these samples, we did not use the polyimide tube, but glass containers. The soil was collected inserting 0.8 and 1 cm diameter glass tubes (0.2 mm thick and 3 cm long), in the soil surface (0–2 cm of the soil surface). These cores were air dried for 48 h at 60°C and later placed vertically in a hermetically closed pot containing the powder I2 for the incubation.
All samples were first submitted to conventional μCT before the incubation with I2. Later, the samples in polyimide soil containers were incubated for 20 h in I2 and the glass thicker cores for 40 h. After the incubation the samples were kept in open air for at least 1 h, allowing the residual I2 to evaporate, and then new μCTs were made. After the μCT scanning the samples were incubated again with I2 for additional 4 weeks (32 days in total) and submitted once more to evaporate for 1 h followed by μCT scanning. The conventional μCT was performed with a customized μCT device at the Helmholtz-Zentrum Berlin, consisting of a 150 kV tungsten anode (10 W power) coupled to a Hamamatsu flat panel detector with a pixel array of 2,316 × 2,316 pixel. The applied cone beam geometry yielded a voxel size of 7 μm.
Image Analysis
First, the data sets were normalized, de-noised and registered. The raw tomography data was processed using in-house software tools and Octopus reconstruction software created by the University of Ghent (details in Arlt et al., 2013). The reconstructed images were visualized within ImageJ v 1.52p and the 2D images of the planes X, Y, and Z registered and used in this article. For the edge tomography, reconstructions were based on the differential attenuation before and after the Ag and I K-edges. The overlay images were created using VG StudioMax 2.2.6 and ImageJ v 1.52p. Tomographies before and after the respective edges were registered and divided one by the other. Subsequently, only the local distribution of that specific element remained in the resulting data set. We then prepared overlays of those specific images and standard attenuation images showing the spatial distribution of I and Ag in the soil samples. In the views, the soil aggregates in the absorption tomography images were colored in dark gray shapes to facilitate visualization. The segmentation of I or Ag containing areas were artificially colored and then over-layered with the absorption tomography images.
Results
In the first experiment, we tested six staining methods (liquid and gaseous contrast agents) to improve the imaging of SOM and biological material in soil samples. Of all the treatments, qualitatively, iodine returned the best images and yielded higher contrast for the biological material, including root fragments and hyphae-like structures (Figures 1, 2). The biological material in the samples treated with Lugol and I2 had higher X-ray attenuation (are brighter in the image), when compared to the control sample and the sample treated with Eosin + Ag (Figure 1). Furthermore, few details can be observed in the particulate organic matter in the control (Figure 2, details 1. A-B, green arrows), while structures that look like microbial colonies are observed in the sample treated with iodine (Figure 2.2, Lugol/iodine, green arrow). Moreover, structures resembling fungal hyphae were observed in the sample treated with AgNO3 (Figure 2.4, green arrow), but similar structures are much brighter in the sample treated with I2 (Figure 2.6A, I2, green arrow). Additionally, we found that a partially decomposed root fragment was externally well-stained by iodine (very bright), because organic materials do not have increased X-ray attenuation effects (Figure 2.6B, I2, green arrow), and because that fragment was very rich in iodine, an element that increases the X-ray attenuation and consequently renders brighter images (Supplementary Figure 1.B1, K-edge colored image). In an additional attempt to differentiate the biological material, we tried to apply a machine learning segmentation tool to separate organic and mineral material, but it worked relatively well only for the Ag treatment (details in Supplementary Figure 2). In that image a structure resembling a fungal hypha is indicated by a green arrow (it is similar to the structure observed in Figure 2.4, green arrow).
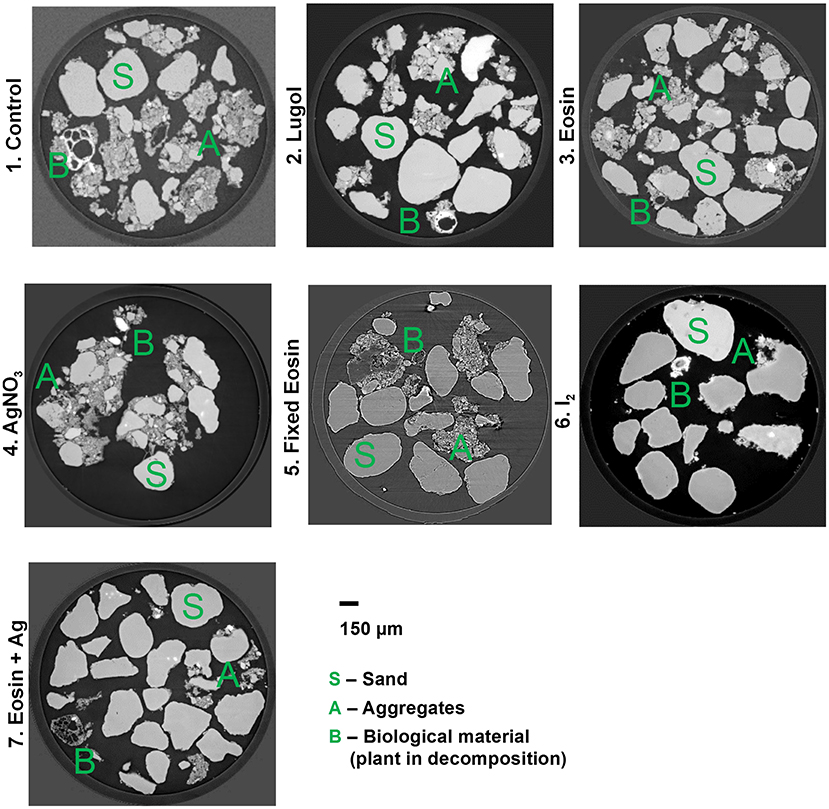
Figure 1. Reconstruction images (X-Y plane) of the synchrotron based X-ray tomographies (16 keV and voxel size 0.438 μm) of soil samples: (1) control, (2) stained with Lugol (liquid I), (3) Eosin, (4) AgNO3, (5) Sample fixed with formaldehyde and stained with AgNO3, (6) I2, (7) Eosin + AgNO3. Details are highlighted in Figure 2, where biological material can be better seen.
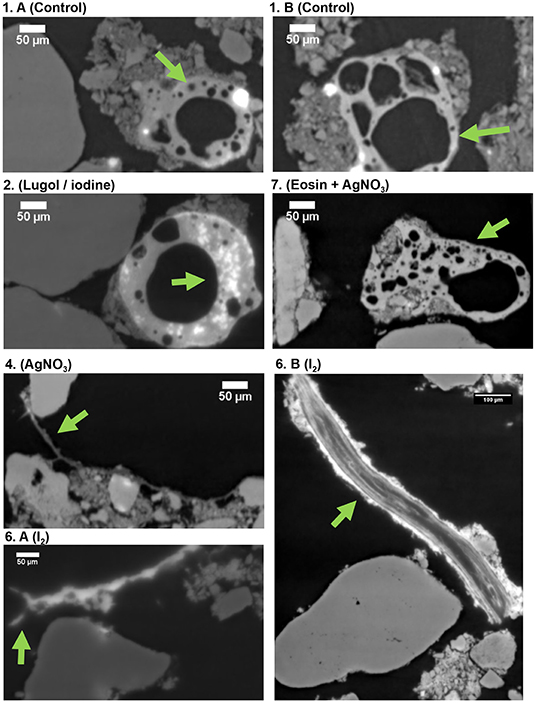
Figure 2. Reconstruction images (X-Z plane) of the synchrotron based X-ray tomographies (16 keV and voxel size 0.438 μm) of the soil samples: (1A,B) control, (2) stained with Lugol, (4) AgNO3, (6) A-B I2, and (7) Eosin + AgNO3. Green arrows indicate details that are mentioned in the text.
The Ag and I2 treatments were further evaluated by qualitative and quantitative measurements of the staining process. After the SR-μCT image acquisition (Figures 1, 2), the Ag and I2 treatments were submitted to K-edge SR-μCT. Both elements were successfully detected in the samples and thus highlighted the stained SOM location in the samples (Figure 3 and Supplementary Figure 1). The decomposing root (Figure 2.6B, I2, green arrow) can be seen stained by I2 in the 3D image (Figure 3.1, green arrow, and Supplementary Figure 1.B1). For I2, we confirmed that the organic matter in the interior of the aggregates was stained (Supplementary Figure 1.B1). While the sand particles (S) were not stained, the interior of the root fragment (green arrow) and the interior of two soil aggregates (blue arrows) were intensely stained by I2 (Supplementary Figure 1.B1). For the Ag treatment these differences are not evident, since overall the Ag staining was not effective (Supplementary Figure 1.B2).
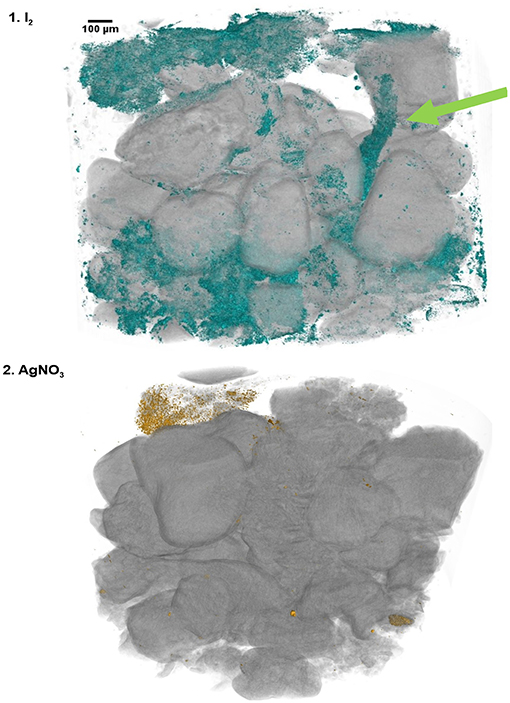
Figure 3. Reconstruction images (X-Y-Z) of the K-edge synchrotron based X-ray tomographies for the soil samples stained with (1) I2 and (2) AgNO3. The colors highlight the location of organic matter stained by the contrast agents (in the virtual models green color for iodine and yellow for Ag). Details in Supplementary Figure 1.
We then estimated the quantity of the material bound to SOM by quantification of the volume related to the differential attenuation of measurements before and after the K-edges. For I2, the stained sample volume is estimated between 3.0 and 4.7% of the full sample (including air); and considering a porosity estimated of 28%, we estimated that the I2 staining was 0.8–1.3% of the soil sample (value close to the 1.1% C content of the sample). For Ag, we estimated that the staining was 0.1–0.3% of the matter inside the sample (much lower than the 1.1% C content).
In the second experiment, we used standard μCT to qualitatively evaluate the I2 staining in a variety of samples (Figures 4, 5; Supplementary Figures 3, 4). There were no visual differences for the mineral fraction in the control treatment before and after the staining (Figures 4.1A–C). On the other hand, the root is clearly more visible after the I2 incubation (Figures 4.1A–C, blue circles and Figures 5.1A,B, blue circles; there was a little movement of the root inside the tube during the 4 week incubation period). It is also clear in the image that the nylon mesh in the bottom of the tube, as the polyimide tube itself, was also stained by I2 (Figures 5.1A,B). There was also improved detection of the soil micro-animals added to the tubes. The three Collembola individuals could not be detected at all before incubation with I2 (Figures 4.1A–C), but they are very evident after the 4 week incubation in I2 (Figures 5.2A,B).
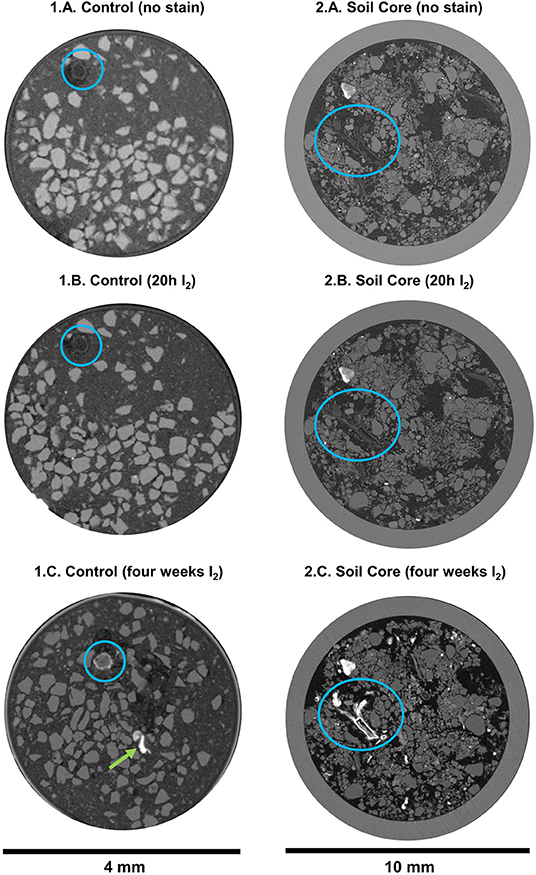
Figure 4. Reconstruction images (X-Y plane) of the conventional X-ray tomographies (μCT, 50 kV, 7 μm voxel resolution) of soil samples with follow treatments: (A) without staining, (B) after few hours I2 staining (20 h for small tubes and 40 h for cores) and (C) after additional 4 weeks I2 staining. (1) clay/sand mix control with a root fragment and Collembola inside; (2) soil core of 8 mm (and 1 mm circular glass container).
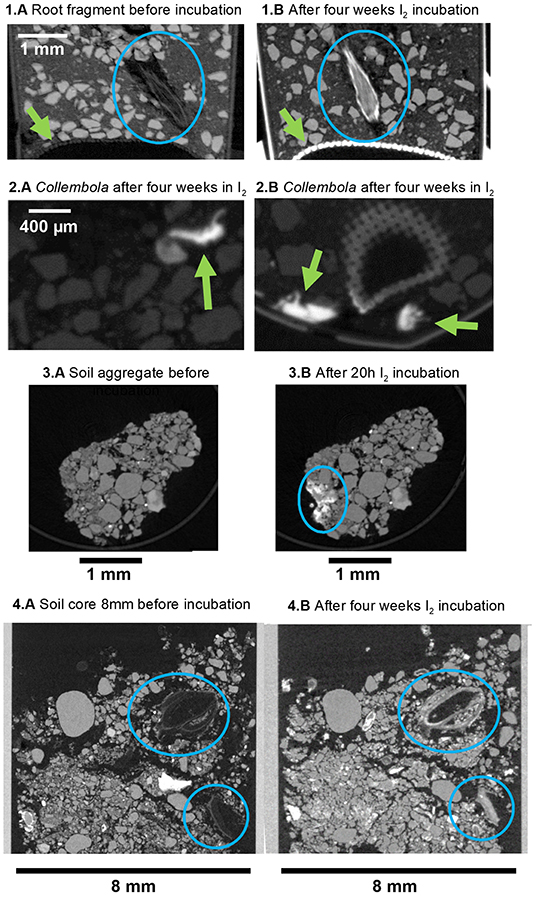
Figure 5. Reconstruction images of the conventional X-ray tomographies (μCT, 50 kV, 7 μm voxel resolution) of soil samples: (1A) clay/sand mix control with detail of the root fragment inside before incubation and (1B) after additional 4 weeks I2 incubation; (2A,B) clay/sand mix control with detail of the Collembola inside; (3A) soil aggregate before incubation and (3B) after 20 h I2 incubation; (4A) details of organic material in a soil core of 8 mm before incubation and (4B) after additional 4 weeks I2 incubation. Details that are mentioned in the text are highlighted with blue circles or green arrows.
We also analyzed soil cores (undisturbed samples) that were submitted to I2 incubation (Figures 4.2A–C). For all the larger samples, longer incubation time was required. Organic material attenuation was improved, and material that was barely visible before incubation became visible (Figures 4.2A–C blue circles and Figures 5.4A,B and Supplementary Figure 3). Additionally, higher attenuation was also observed in parts of the individual aggregates samples, that we assume they are organic material clusters (Figures 5.3A,B and also in Supplementary Figure 4, highlighted by circles in the images).
Discussion
The use of higher resolution techniques for spatial imaging of SOM and biological material in soil samples is crucial to identify how these components interact with soil structure and fertility, microbial activity and ultimately affecting ecosystem functioning (Cotrufo et al., 2015; Tecon and Or, 2017; Baveye et al., 2018; Garratt et al., 2018). Among several options (Vidal et al., 2018; Gorka et al., 2019), as reviewed in detail by Baveye et al. (2018), one promising technique is μCT and efforts have been made to improve it, such as using contrast agents and K-edge μCT (Peth et al., 2014; Van Loo et al., 2014). Here, we tested a variety of contrast agents and report that gaseous I2 has a good potential to improve the spatial imaging of SOM and biological material in soil. Moreover, we report images with probably the best image resolution up to date for these techniques in soil samples.
In our study, iodine was not only a good contrast agent, but the use of this element, as also the Ag staining, allowed the use of K-edge μCT. While I2 had a good staining efficiency (the K-edge measurement values are very similar to those obtained by the chemical analysis of C), the Ag stained had low efficiency. In previous studies, using conventional μCT, the use of Ag improved contrast of organic material in soil (Van Loo et al., 2014) and bacterial material in catheter biofilms (Niehaus et al., 2016). Ag has high affinity to bind to SOM, polyssaccharidic debris of plants and microbial cell walls, forming chelates and complexes with organic material, for example, containing carboxyl, phenolic, alcoholic and enolic-OH, and carbonyl structures of various types (Chenu and Plante, 2006; Van Loo et al., 2014). The use of iodine is also reported as an enhancer for CT imaging for animals samples, due to its high affinity to organic material (Boyde et al., 2014; Li et al., 2015). The four main mechanisms for iodine staining are as follows: (1) the reduction from I2 to iodide and triiodide ions which may form bonds with cations; (2) the formation of complexes with starch, glycogen and glycoproteins; (3) the formation of organo-iodine compounds (after I2 reacts with C-C double bonds in unsaturated molecules); and (4) the displacement of covalently bound chlorine atoms (Yamaguchi et al., 2010; Boyde et al., 2014). For animal specimens, Boyde et al. (2014) suggested that longer incubation with I2, up to several weeks, could yield better staining results. In the short incubation period of experiment 1 (24 h), the root fragments were mainly externally stained by I2 (Figure 2.6). So, likely longer incubation times could yield better internal staining (Boyde et al., 2014). However, future studies should still investigate the ability of I2 to stain less porous organic material, such as plant remnants. Although, the contrast agents Ag and iodine have high affinity with SOM, fortunately their interaction with colloidal materials, like clays and negatively charged minerals, have been reported as negligible (Chenu and Plante, 2006; Yamaguchi et al., 2010; Van Loo et al., 2014). On the other hand, theoretically cationic Ag could also bind to the cation exchange capacity of clays, and this possibility should be better investigated in future studies. In our study, Ag was a poor agent and we did not detect any binding to inorganic material. We also did not observe binding of I2 to inorganic material, but we recommend that after the incubation it is essential to keep the samples in open air to evaporate residual I2 before the μCT analysis (see method).
We did not observe image improvement using eosin in our experiment. In a previous study, eosin stained soft human tissues well, since samples were soaked in a concentrated solution and later thoroughly dried, allowing for a high concentration of Br to accumulate in the samples (Busse et al., 2018). We surmise that since the organic material in our experiment was only a small fraction of the soil sample (usually 1–6%) and SOM has very distinct characteristics from soft organic tissues used in the previous study, we did not achieve the same results. Additionally, eosin is a more specific staining for biological cells, that binds mainly to cytoplasmic protein (Busse et al., 2018), while I2 has a more general mechanism that attaches to various organic material (as described above). Moreover, we suggest that the liquid staining process may include chemicals (such as formaldehyde) and physical processing (e.g., centrifugation and dry-wet cycles), which could damage soil aggregates. So gaseous products, like I2 or Os, look more adequate agents, since they potentially have higher penetration power and cause less disturbance into the samples (Boyde et al., 2014; Peth et al., 2014).
Furthermore, the K-edge μCT technique has proven to be a powerful tool for spatial location of elements in samples. Previous studies used gaseous Os to stain SOM in large soil macroaggregates (4–6 mm) and successfully located the SOM in the sample (Peth et al., 2014; Rawlins et al., 2016; Quigley et al., 2018). However, OsO4 is highly toxic and the method was previously applied for large aggregates in a setup that can hardly be used for undisturbed soil samples. In the present study, we demonstrate that gaseous I2 is a feasible alternative for the staining of soil samples and that it can be successfully applied to a mix of micro and macro-aggregates, with potential to be used also with undisturbed soil samples (Figure 5). Moreover, new technological advances may allow the use of K-edge μCT also with standard μCT machines when it is coupled with a spectral detector, thus facilitating easier access to this technique (Egan et al., 2015).
In our images, K-edge measurements with I2 highly enhanced the location of SOM in the aggregates. It may allow future comparisons of soils with different physical-chemical properties and bring new insights into the drivers of associated microbial processes (Vidal et al., 2018; Gorka et al., 2019; Schlüter et al., 2019). For example, instead of correlating microbial diversity with total C and soil texture, future studies could correlate it with the SOM which is available at the surface of the aggregates and with the soil porosity analyzed by μCT (Tecon and Or, 2017; Baveye et al., 2018). Using μCT analysis may achieve better resolution to define the drivers of microbial diversity and activity. Improved imaging definition could likewise contribute to more precisely defining the role of SOM in binding mineral particles inside the aggregates, for example, estimating in contrasting soils the quantity of silt and clay aggregated by inorganic processes or by SOM. The review of Baveye et al. (2018) emphasizes the benefits of coupling different analytical tools, such as μCT, NanoSim, SEM, and also other techniques, allowing a better understanding of the interactions among physical, chemical, and biological aspects of the soil.
Lastly, the I2 treatment qualitatively improved the visual definition of biological material in conventional μCT, including roots and soil animals (Collembola). Mooney et al. (2012) indicated that one of the challenges of μCT is to improve the attenuation density of the organic material in relation to the air pores. Thus, contrast agents can increase the attenuation of the organic material in relation to the air pore and consequently improving the image quality. The work by Mooney et al. (2012) was achieved on juvenile plants and often rather artificial soils. Indeed, the I2 treatment would be useful to improve CT contrast of roots enabling their automated detection also in more complex and larger real life samples. The use of μCT may have a positive implication in soil biology, by improving a non-destructive method to detect fungi (SR-μCT), soil fauna (conventional μCT) and roots in soil samples. In the future, with better methodological improvements (e.g., better conventional μCT resolution), we suggest that methods that automatically count micro-fauna specimens in 2D images (Gilarranz et al., 2017) could be also improved and expanded for the 3D μCT images, as already occurs for roots (Mooney et al., 2012). And, as a side effect, the I2 also stained the plastic containers of the samples (nylon and polyimide). So the I2 staining procedure could have the potential to be applied also to the detection of plastic pollution in soil samples (Rillig et al., 2017).
Conclusion
Our results indicated that I2 was the most effective contrast method for μCT of the soil samples and the use of the staining method coupled with K-edge μCT proved to be a powerful tool for spatial location of SOM. We acknowledge that the use of SR-μCT is an expensive and access-limited technique to study soil samples. The I2 treatment also improved the visualization of biological material and consequently the qualitative analysis of fine plants roots and soil animals (Collembola). The use of μCT may have a positive implication in soil biology, by improving a non-destructive method to detect fungi (SR-μCT), soil fauna (conventional μCT), and roots in soil samples.
Data Availability Statement
The datasets generated for this study are available on request to the corresponding author.
Author Contributions
DL, TA, IM, and MR designed the study. DL and TA executed the experiments. TA processed the images. DL wrote and organized the article. All the authors contributed with the final text.
Conflict of Interest
The authors declare that the research was conducted in the absence of any commercial or financial relationships that could be construed as a potential conflict of interest.
Acknowledgments
Thanks to Sabine Buchert and André Hilger for experimental support, to Travis Jones for suggestions on the study design and for Walter Peterson for comments on the manuscript. We thank India Mansour for the Collembola individuals and comments on the text. DL thanks his former supervisor Carlos C. Cerri (in memorium) for his excitement and incentive in studying soil carbon and applying innovative techniques, such as μCT, into soil science. We thank HZB for the allocation of synchrotron radiation beam time at Bessy. DL is thankful for a CAPES-Alexander von Humboldt postdoctoral grant. We acknowledge support by the Open Access Publication Initiative of Freie Universität Berlin.
Supplementary Material
The Supplementary Material for this article can be found online at: https://www.frontiersin.org/articles/10.3389/fenvs.2019.00153/full#supplementary-material
References
Arlt, T., Manke, I., Wippermann, K., Riesemeier, H., Mergel, J., and Banhart, J. (2013). Investigation of the local catalyst distribution in an aged direct methanol fuel cell MEA by means of differential synchrotron X-ray absorption edge imaging with high energy resolution. J. Power Sources 221, 210–216. doi: 10.1016/j.jpowsour.2012.08.038
Bastida, F., Torres, I. F., Moreno, J. L., Baldrian, P., Ondoño, S., Ruiz-Navarro, A., et al. (2016). The active microbial diversity drives ecosystem multifunctionality and is physiologically related to carbon availability in Mediterranean semi-arid soils. Mol. Ecol. 25, 4660–4673. doi: 10.1111/mec.13783
Baveye, P. C., Otten, W., Kravchenko, A., Balseiro-Romero, M., Beckers, É., Chalhoub, M., et al. (2018). Emergent properties of microbial activity in heterogeneous soil microenvironments: different research approaches are slowly converging, yet major challenges remain. Front. Microbiol. 9:1929. doi: 10.3389/fmicb.2018.01929
Bouma, J., van Ittersum, M. K., Stoorvogel, J. J., Batjes, N. H., Droogers, P., and Pulleman, M. M. (2017). “Soil capability: exploring the functional potentials of soils,” in Global Soil Security Progress in Soil Science, eds D. J. Field, C. L. S. Morgan, and A. B. McBratney (Cham: Springer International Publishing), 27–44. doi: 10.1007/978-3-319-43394-3_3
Boyde, A., Mccorkell, F. A., Taylor, G. K., Bomphrey, R. J., and Doube, M. (2014). Iodine vapor staining for atomic number contrast in backscattered electron and X-ray imaging: iodine vapor staining for atomic number contrast. Microsc. Res. Tech. 77, 1044–1051. doi: 10.1002/jemt.22435
Bünemann, E. K., Bongiorno, G., Bai, Z., Creamer, R. E., De Deyn, G., de Goede, R., et al. (2018). Soil quality — a critical review. Soil Biol. Biochem. 120, 105–125. doi: 10.1016/j.soilbio.2018.01.030
Busse, M., Müller, M., Kimm, M. A., Ferstl, S., Allner, S., Achterhold, K., et al. (2018). Three-dimensional virtual histology enabled through cytoplasm-specific X-ray stain for microscopic and nanoscopic computed tomography. Proc. Natl. Acad. Sci. U.S.A. 115, 2293–2298. doi: 10.1073/pnas.1720862115
Chenu, C., and Plante, A. F. (2006). Clay-sized organo-mineral complexes in a cultivation chronosequence: revisiting the concept of the ‘primary organo-mineral complex.’ Eur. J. Soil Sci. 57, 596–607. doi: 10.1111/j.1365-2389.2006.00834.x
Cotrufo, M. F., Soong, J. L., Horton, A. J., Campbell, E. E., Haddix, M. L., Wall, D. H., et al. (2015). Formation of soil organic matter via biochemical and physical pathways of litter mass loss. Nat. Geosci. 8, 776–779. doi: 10.1038/ngeo2520
Couradeau, E., Felde, V. J. M. N. L., Parkinson, D., Uteau, D., Rochet, A., Cuellar, C., et al. (2018). In situ X-ray tomography imaging of soil water and cyanobacteria from biological soil crusts undergoing desiccation. Front. Environ. Sci. 6:65. doi: 10.3389/fenvs.2018.00065
Egan, C. K., Jacques, S. D. M., Wilson, M. D., Veale, M. C., Seller, P., Beale, A. M., et al. (2015). 3D chemical imaging in the laboratory by hyperspectral X-ray computed tomography. Sci. Rep. 5:15979. doi: 10.1038/srep15979
Garratt, M. P. D., Bommarco, R., Kleijn, D., Martin, E., Mortimer, S. R., Redlich, S., et al. (2018). Enhancing soil organic matter as a route to the ecological intensification of European arable systems. Ecosystems 21, 1404–1415. doi: 10.1007/s10021-018-0228-2
Gilarranz, L. J., Rayfield, B., Liñán-Cembrano, G., Bascompte, J., and Gonzalez, A. (2017). Effects of network modularity on the spread of perturbation impact in experimental metapopulations. Science 357, 199–201. doi: 10.1126/science.aal4122
Gorka, S., Dietrich, M., Mayerhofer, W., Gabriel, R., Wiesenbauer, J., Martin, V., et al. (2019). Rapid transfer of plant photosynthates to soil bacteria via ectomycorrhizal hyphae and its interaction with nitrogen availability. Front. Microbiol. 10:168. doi: 10.3389/fmicb.2019.00168
Guimarães, R. M. L., Lamandé, M., Munkholm, L. J., Ball, B. C., and Keller, T. (2017). Opportunities and future directions for visual soil evaluation methods in soil structure research. Soil Tillage Res. 173, 104–113. doi: 10.1016/j.still.2017.01.016
Han, L., Sun, K., Jin, J., and Xing, B. (2016). Some concepts of soil organic carbon characteristics and mineral interaction from a review of literature. Soil Biol. Biochem. 94, 107–121. doi: 10.1016/j.soilbio.2015.11.023
Laliberté, E., Kardol, P., Didham, R. K., Teste, F. P., Turner, B. L., and Wardle, D. A. (2017). Soil fertility shapes belowground food webs across a regional climate gradient. Ecol. Lett. 20, 1273–1284. doi: 10.1111/ele.12823
Lammel, D. R., Butterbach-Bahl, K., Cerri, C. E. P., Louis, S., Schnitzler, J.-P., Feigl, B. J., et al. (2017). C and N stocks are not impacted by land use change from Brazilian Savanna (Cerrado) to agriculture despite changes in soil fertility and microbial abundances. J. Plant Nutr. Soil Sci. 180, 436–445. doi: 10.1002/jpln.201600614
Lammel, D. R., Feigl, B. J., Cerri, C. C., and Nüsslein, K. (2015). Specific microbial gene abundances and soil parameters contribute to C, N, and greenhouse gas process rates after land use change in Southern Amazonian Soils. Front. Microbiol. 6:1057. doi: 10.3389/fmicb.2015.01057
Lehmann, A., and Rillig, M. C. (2015). Understanding mechanisms of soil biota involvement in soil aggregation: a way forward with saprobic fungi? Soil Biol. Biochem. 88, 298–302. doi: 10.1016/j.soilbio.2015.06.006
Li, Z., Clarke, J. A., Ketcham, R. A., Colbert, M. W., and Yan, F. (2015). An investigation of the efficacy and mechanism of contrast-enhanced X-ray Computed Tomography utilizing iodine for large specimens through experimental and simulation approaches. BMC Physiol. 15:5. doi: 10.1186/s12899-015-0019-3
Luo, G., Li, L., Friman, V.-P., Guo, J., Guo, S., Shen, Q., et al. (2018). Organic amendments increase crop yields by improving microbe-mediated soil functioning of agroecosystems: a meta-analysis. Soil Biol. Biochem. 124, 105–115. doi: 10.1016/j.soilbio.2018.06.002
Mooney, S. J., Pridmore, T. P., Helliwell, J., and Bennett, M. J. (2012). Developing X-ray Computed Tomography to non-invasively image 3-D root systems architecture in soil. Plant Soil 352, 1–22. doi: 10.1007/s11104-011-1039-9
Morris, E. K., Morris, D. J. P., Vogt, S., Gleber, S.-C., Bigalke, M., Wilcke, W., et al. (2019). Visualizing the dynamics of soil aggregation as affected by arbuscular mycorrhizal fungi. ISME J. 13, 1639–1646. doi: 10.1038/s41396-019-0369-0
Niehaus, W. L., Howlin, R. P., Johnston, D. A., Bull, D. J., Jones, G. L., Calton, E., et al. (2016). Development of X-ray micro-focus computed tomography to image and quantify biofilms in central venous catheter models in vitro. Microbiology 162, 1629–1640. doi: 10.1099/mic.0.000334
Nielsen, U. N., Ayres, E., Wall, D. H., and Bardgett, R. D. (2011). Soil biodiversity and carbon cycling: a review and synthesis of studies examining diversity–function relationships. Eur. J. Soil Sci. 62, 105–116. doi: 10.1111/j.1365-2389.2010.01314.x
Oades, J. M., and Waters, A. G. (1991). Aggregate hierarchy in soils. Soil Res. 29, 815–828. doi: 10.1071/SR9910815
Peth, S., Chenu, C., Leblond, N., Mordhorst, A., Garnier, P., Nunan, N., et al. (2014). Localization of soil organic matter in soil aggregates using synchrotron-based X-ray microtomography. Soil Biol. Biochem. 78, 189–194. doi: 10.1016/j.soilbio.2014.07.024
Quigley, M. Y., Rivers, M. L., and Kravchenko, A. N. (2018). Patterns and sources of spatial heterogeneity in soil matrix from contrasting long term management practices. Front. Environ. Sci. 6:28. doi: 10.3389/fenvs.2018.00028
Rawlins, B. G., Wragg, J., Reinhard, C., Atwood, R. C., Houston, A., Lark, R. M., et al. (2016). Three-dimensional soil organic matter distribution, accessibility and microbial respiration in macroaggregates using osmium staining and synchrotron X-ray computed tomography. Soil 2, 659–671. doi: 10.5194/soil-2-659-2016
Rillig, M. C., Ingraffia, R., and de Souza Machado, A. A. (2017). Microplastic incorporation into soil in agroecosystems. Front. Plant Sci. 8:1805. doi: 10.3389/fpls.2017.01805
Schlüter, S., Eickhorst, T., and Mueller, C. W. (2019). Correlative imaging reveals holistic view of soil microenvironments. Environ. Sci. Technol. 53, 829–837. doi: 10.1021/acs.est.8b05245
Steffens, M., Rogge, D. M., Mueller, C. W., Höschen, C., Lugmeier, J., Kölbl, A., et al. (2017). Identification of distinct functional microstructural domains controlling C storage in soil. Environ. Sci. Technol. 51, 12182–12189. doi: 10.1021/acs.est.7b03715
Tecon, R., and Or, D. (2017). Biophysical processes supporting the diversity of microbial life in soil. FEMS Microbiol. Rev. 41, 599–623. doi: 10.1093/femsre/fux039
Tian, J., He, N., Hale, L., Niu, S., Yu, G., Liu, Y., et al. (2018). Soil organic matter availability and climate drive latitudinal patterns in bacterial diversity from tropical to cold temperate forests. Funct. Ecol. 32, 61–70. doi: 10.1111/1365-2435.12952
Totsche, K. U., Amelung, W., Gerzabek, M. H., Guggenberger, G., Klumpp, E., Knief, C., et al. (2018). Microaggregates in soils. J. Plant Nutr. Soil Sci. 181, 104–136. doi: 10.1002/jpln.201600451
Van Loo, D., Bouckaert, L., Leroux, O., Pauwels, E., Dierick, M., Van Hoorebeke, L., et al. (2014). Contrast agents for soil investigation with X-ray computed tomography. Geoderma 213, 485–491. doi: 10.1016/j.geoderma.2013.08.036
Vidal, A., Hirte, J., Bender, S. F., Mayer, J., Gattinger, A., Höschen, C., et al. (2018). Linking 3D soil structure and plant-microbe-soil carbon transfer in the rhizosphere. Front. Environ. Sci. 6:9. doi: 10.3389/fenvs.2018.00009
World Reference Base for soil resources (1998). Available online at: http://www.fao.org/3/w8594e/w8594e00.htm (accessed August 3, 2019).
Xu, X., Thornton, P. E., and Post, W. M. (2013). A global analysis of soil microbial biomass carbon, nitrogen and phosphorus in terrestrial ecosystems. Glob. Ecol. Biogeogr. 22, 737–749. doi: 10.1111/geb.12029
Yamaguchi, N., Nakano, M., Takamatsu, R., and Tanida, H. (2010). Inorganic iodine incorporation into soil organic matter: evidence from iodine K-edge X-ray absorption near-edge structure. J. Environ. Radioact. 101, 451–457. doi: 10.1016/j.jenvrad.2008.06.003
Zabler, S., Rack, A., Manke, I., Thermann, K., Tiedemann, J., Harthill, N., et al. (2008). High-resolution tomography of cracks, voids and micro-structure in greywacke and limestone. J. Struct. Geol. 30, 876–887. doi: 10.1016/j.jsg.2008.03.002
Keywords: μCT microcomputed tomography, soil organic mater, soil biology, contrast agent, synchrotron
Citation: Lammel DR, Arlt T, Manke I and Rillig MC (2019) Testing Contrast Agents to Improve Micro Computerized Tomography (μCT) for Spatial Location of Organic Matter and Biological Material in Soil. Front. Environ. Sci. 7:153. doi: 10.3389/fenvs.2019.00153
Received: 30 April 2019; Accepted: 20 September 2019;
Published: 11 October 2019.
Edited by:
Hannes Schmidt, University of Vienna, AustriaReviewed by:
Carsten W. Mueller, Technical University of Munich, GermanySteven Sleutel, Faculty of Bioscience Engineering, Ghent University, Belgium
Copyright © 2019 Lammel, Arlt, Manke and Rillig. This is an open-access article distributed under the terms of the Creative Commons Attribution License (CC BY). The use, distribution or reproduction in other forums is permitted, provided the original author(s) and the copyright owner(s) are credited and that the original publication in this journal is cited, in accordance with accepted academic practice. No use, distribution or reproduction is permitted which does not comply with these terms.
*Correspondence: Daniel R. Lammel, ZHJsYW1tZWxAZ21haWwuY29t