 Andreas Rupp
 Tom Guhra
 Andreas Meier
 Alexander Prechtel
 Thomas Ritschel
 Nadja Ray
 Kai Uwe Totsche
- 1Chair of Applied Mathematics I, Department of Mathematics, Friedrich-Alexander University Erlangen-Nürnberg, Erlangen, Germany
- 2Chair of Hydrogeology, Institute of Geosciences, Friedrich-Schiller University Jena, Jena, Germany
Soil functions are closely related to the structure of soil microaggregates. Yet, the mechanisms controlling the establishment of soil structure are diverse and partly unknown. Hence, the understanding of soil processes and functions requires the connection of the concepts on the formation and consolidation of soil structural elements across scales that are hard to observe experimentally. At the bottom level, the dynamics of microaggregate development and restructuring build the basis for transport phenomena at the continuum scale. By modeling the interactions of specific minerals and/or organic matter, we aim to identify the mechanisms that control the evolution of structure and establishment of stationary aggregate properties. We present a mechanistic framework based on a cellular automaton model to simulate the interplay between the prototypic building units of soil microaggregates quartz, goethite, and illite subject to attractive and repulsive electrostatic interaction forces. The resulting structures are quantified by morphological measures. We investigated shielding effects due to charge neutralization and the aggregate growth rate in response to the net system charge. We found that the fraction as well as the size of the interacting oppositely charged constituents control the size, shape, and amount of occurring aggregates. Furthermore, the concentration in terms of the liquid solid ratio has been shown to increase the aggregation rate. We further adopt the model for an assessment of the temporal evolution of aggregate formation due to successive formation of particle dimers at early stages in comparison to higher order aggregates at later stages. With that we show the effect of composition, charge, size ratio, time, and concentration on microaggregate formation by the application of a mechanistic model which also provides predictions for soil aggregation behavior in case an observation is inhibited by experimental limitations.
Introduction
Soil structure is organized in a hierarchy of patterns and properties, as e.g., found in pores and aggregates at different scales. To unravel the interplay between the macroscopic functions provided by soils and the sub-micron scale of surface interactions observed between minerals and organic constituents of the soil solution may be regarded as one of the grand challenges of soil science (Totsche et al., 2010). Conceptual models for the turnover of aggregate classes date back to the research work by Tisdall and Oades (1982), see also Six et al. (2004). In the context of carbon balances, quantitative investigations have been conducted using multipool/compartment concepts (e.g., Segoli et al., 2013; Stamati et al., 2013). Due to the large scales, on which these models are defined, they do not account for any spatial structure of the (micro-)aggregates besides a size class. Also, mechanistic process based transformation rates are missing. For a review of aggregation model approaches see also section 6 in Totsche et al. (2018). While simulations on explicit pore structures of soils have become feasible in the last decade (e.g., Blunt et al., 2013) they do not account for an evolution of the rigid structures. Portell et al. (2018), e.g., established an individual based model approach to account for growth of microbial species on explicit pore geometries, and combined it with solute transport realized by a Lattice Boltzmann method. The solid structure is fixed, however. Cellular automaton model (CAM) methods have already successfully been used to describe the structural development of biofilms at the pore scale (Tang and Valocchi, 2013; Tang et al., 2013) or self-organization of soil-microbe systems (Crawford et al., 2012). On a smaller interaction scale, DLVO theory and the fractal growth of diffusion-limited aggregation has been used recently to illustrate the detailed interplay of molecular forces between particles in the formation of microaggregates (Ritschel and Totsche, 2019).
The model as presented in Ray et al. (2017) and Rupp et al. (2018) approaches the task of unraveling the interplay between scales by the coupling of continuum-scale transport phenomena and a local scale able to represent mineral surface interactions and the consolidation of microaggregates. The effective transport parameters required at the continuum-scale can be derived by an upscaling of micro-scale morphological properties that translates the formation and restructuring of microaggregates to their impacts on, e.g., the hydraulic conductivity (Schulz et al., 2019) or the effective diffusion (Ray et al., 2018). However, how and even whether stable effective properties on the continuum scale emerge from the dynamics at the local scale is not investigated yet. In addition, the factors that control the establishment of stationary structures are to be identified. In Rupp et al. (2018), electrostatics were introduced as surface interactions that control colloidal stability and the aggregation by opposing the attractive van der Waals forces (for two likely charged particles) or electrostatic attraction which leads to fast aggregation (for two oppositely charged particles, Fermin and Riley, 2010; Trefalt et al., 2014). However, the interactions between minerals are not only controlled by surface forces, but also by their physical properties, e.g., size, density, compactness, rigidity, complex shapes, surface roughness (Buffle and Leppard, 1995; McCarthy and McKay, 2004; Bin et al., 2011). As a result, the interaction of constituents of the soil solution is quite diverse and leads to complex structures and structural properties (McCarthy and McKay, 2004; Bin et al., 2011).
A simultaneous investigation of the impact of mineral size, shape, composition, concentration, and charge for the formation of microaggregates is a challenge that is experimentally elaborate or sometimes impossible. Numerous experimental studies consider only selected aspects of aggregation simultaneously e.g., the hetero-aggregation of two similar sized and shaped nanoparticles in different relations (e.g. Bansal et al., 2017) or the hetero-aggregation of two dissimilar sized and shaped mineral particles (Tombácz et al., 2004). Totsche et al. (2018) outline that mathematical aggregation models could support the development of new ways for dedicated and theory-guided experiments and explorative instrumental studies. Additionally, mathematical aggregation models could provide an insight into the time scale of aggregation processes (Bremer et al., 1995) which can avoid immense experimental efforts as well as the development of different aggregate structures as function of time (Szilagyi et al., 2014). Models also allow discriminating the influence of single mechanisms on aggregate formation, which cannot be separated experimentally.
In this study, we present the systematic application and evaluation of a 2D mechanistic, mathematical model (Ray et al., 2017; Rupp et al., 2018; Rupp, 2019) to elucidate the influence of varying sizes, shapes, and charge distributions of prototypic building units on structure formation. The building units are directly implemented with specific properties such as charge distributions, sizes, or shapes. This contrasts with concepts dealing with averaged concentrations in representative elementary volumes where the spatial structure of particles or the porous medium is not resolved explicitly.
Our model also allows for an analysis of the temporal evolution of the formation of microaggregates by investigating whether particle suspensions lead to stable potentially dispersed structures. We adopt this model with a focus on systems, in which electric forces, van der Waals forces, and random Brownian motion are supposed to have a major impact on aggregation as, e.g., in initial soils, subsoil horizons, and ground water systems. Such natural multi-particle systems provide a variety of inorganic mineral particles which are probable to interact which each other. Their charge properties are a function of the prevailing boundary conditions, pH and electric conductivity (Tombácz et al., 2001; Guhra et al., 2019). Three surrogates are designed in silico inspired by secondary mineral phases like goethite (Gt) and illite (Il) as well as quartz (Qz) as a persistent primary mineral, which are all typical for temperate soils.
With this, we simulated the aggregate development in differently composed suspensions to provide a comprehensive overview of optimal growth rates, final aggregate sizes, and structural properties.
Materials and Methods
For our numerical experiments, we apply the CAM as presented in Ray et al. (2017); Rupp et al. (2018), and Rupp (2019) to study structure formation in soils at the scale of microaggregates. We do not investigate the influence of organic matter or biofilms but focused on abiotic interactions to avoid a superposition of contrasting processes that cannot be identified uniquely. Readers might refer to Tang et al. (2013), who explicitly studied biofilm growth with CAM models.
In general CAM are based on decision rules that move or transform cells on rectangular grids to new states or locations. We use a two-dimensional, periodic computational domain consisting of 200 × 200 quadratic unit cells which are the smallest discrete objects in our simulations. For verification, calculations were also performed with a resolution of 500 × 500 cells (not shown here). The results confirmed that the chosen domain is considered representative. For our study, we designed three morphological prototypes to resemble typical minerals of humid latitudes, i.e., the secondary minerals goethite (Gt) and illite (Il) as well as quartz (Qz) as persistent primary mineral. On their surfaces we uniformly apply charges occurring at stationary circumneutral pH. Gt as a needle shaped variable charge metal hydroxide is represented by a positively charged rectangle with an area of 1 × 5 squares, although a negative charge at pH values above their specific point of zero charge (PZC) is also possible (Cornell and Schwertmann, 2003; Kosmulski, 2011). Il is represented by plates of 2 × 3 squares. A typical length scale for the unit cell could thus be 1 μm. Due to its variably charged edges and negatively charged basal planes (Tombácz and Szekeres, 2006) we allowed the charge of Il to be either uniformly positive or negative. This will be specified below in the respective simulation scenarios (section Simulation Scenarios and Results). Qz has negative charges at circumneutral pH (Kosmulski, 2011). Its spherical shape is approximated by unit cells with a diameter of 11 for the prototype (resulting in a particle area of 97). When investigating the influence of the size, we also used Qz with a diameter of 21 (area 349), and 41 (area 1257).
We distinguish between microaggregate forming materials (MFM), i.e., single particles of Qz, Gt and Il, and composite building units (CBUs), i.e., the composition of two or more prototypes called MFMs (for details of the used terminology, see Totsche et al., 2018). The interplay between the MFMs and their composites follows the cellular automaton rules as described in Ray et al. (2017) and Rupp et al. (2018). The range of potential movement for MFMs and/or CBUs are defined analogously within the computational domain and is characterized by stencils in the context of the CAM which are motivated by physical laws. Note that we expand the approach presented in Ray et al. (2017) and Rupp et al. (2018) further as follows: In the current research, we distinguish between the movement within a range of attraction due to electric forces (Trefalt et al., 2014) and random movement due to Brownian motion. These potential movements, encoded in the respective stencil sizes as discussed below, depend on size and charge of the MFMs/the CBUs themselves. The range of electric attraction/repulsion is modeled by rel, while the range of diffusion is given by rdf:
where is the floor function (greatest integer less than or equal to x), and NCp and apdenote the net charge and the area of a particle (either MFM or CBU), respectively. In our investigations, both stencils may be balanced through their respective constants cel and cdf. Unless stated otherwise, the constants in the definition of the stencils are set to 10. This would correspond to time steps of about 0.5 s, relating the mean path length of particles to it. The respective stencils of our approach are abstract theoretical entities. One may interpret their physical meaning as follows: The diffusion stencil may be derived from the expected value of squared diffusive displacement which is 2Dt and Stokes-Einstein equation that linearly relates the diffusion coefficient D of a particle to its inverse radius. Hence, the mean displacement caused by diffusion requires a dependence, which we multiplied by an effective parameter that combines all further physical constants that are involved. Consequently, rdf decreases when CBUs grow. This is a more realistic characterization of the movement of (larger) composites than in Ray et al. (2017) and Rupp et al. (2018). Likewise, the range of electric attraction/repulsion depends on the net charge and may change for composites that are created if MFMs/CBUs of various charges aggregate. The net charge NCp is the sum of the charges of all unit cells this particle is composed of. Thus, the electrostatic stencil and its size relates to the electrostatic potential (Coulomb potential) that is proportional to the charge density represented by . Again, the constant combines the physical constants that are involved. Along this line, a fully dynamic situation is considered throughout the numerical investigations. In each time step, MFMs are allowed to move in accordance with their stencils first, followed by composites. To this end, the sizes of the corresponding electro and random stencils are evaluated dynamically. First, each MFM moves to the closest void space within the electro stencil rel where the affinity Ai is maximal. The affinity Ai of a potential target position Yi in the fluid (which has to be inside the range of the stencil rel) is calculated according to the following formula, with being the location of the solid MFM under consideration:
NN is the number of (new) solid neighbors in position Yi. ρ is the surface charge density, evaluated at the common edges of and which we denote with The affinity Ai is thus a combination of uniform attraction and repulsive/attractive electric forces between particles with charges, for a detailed definition and illustration of a similar mechanism see Rupp et al. (2018). If there are several equally advantageous target positions, one is chosen randomly. Only if the current position is optimal within its electro stencil, the diffusion stencil is evaluated additionally. Then, this procedure is repeated for CBUs without considering rotations. We conduct numerical experiments under varying conditions to investigate the effect of composition, charge, size ratio, and concentration on microaggregate formation (cf. scenarios 1–3 in section Simulation Scenarios and Results). Moreover, the temporal evolution of microaggregate formation is illuminated. A quantitative analysis of the resulting structures using the subsequent morphological characteristics then follows.
Morphological characteristics:
• The total area of CBUs is defined as the sum of the areas of all composites and increases if MFMs form composites (Isolated single MFMs are ignored in this calculation). The total area can be interpreted as a measure of mass.
• The total surface is defined as the length of the solid-fluid interface. The total surface of CBUs is the length of the interface between CBUs and the fluid.
• The number of particles/composites is defined as the number of isolated particles/composites.
• The average particle size (PS) is defined as the arithmetic average of the area of all particles (MFMs and CBUs), i.e., the total area over the number of particles. Likewise, the average particle size of CBUs is defined as the total area of composites over the number of isolated composites.
• The compactness ratio (CR) of CBUs (in two dimensions) is defined as the total surface of CBUs to the power of 2 over the total area of CBUs. Note that any circle has the minimal CR of 4π, any square 16. The prototypes of our MFMs have CR of 16.7 (Il), 28.8 (Gt), and the imperfect approximations of the circular Qz of 20.0/20.2/21.4 (for small, medium and large size Qz).
• The net electric charge (NC) of the scenarios is defined as the sum of all charges according to all MFMs in the observed system.
Further measurements may be derived from these definitions such as the specific surface (total surface over total area). Moreover, the dynamics of theses quantities can be reported, i.e., the temporal evolution of the aggregation process can be characterized according to different descriptive quantities.
Simulation Scenarios and Results
We conducted the following numerical experiments to illustrate the impact of composition, surface charge, particle size ratio, and concentration on microaggregate formation. All simulations start with a random uniform distribution of the solid MFMs in the fluid. We performed 1,000 steps of the CAM, and repeated each scenario 10 times. Longer runs (4,000 steps) revealed no additional information (not shown here).
Variation of Composition
As first scenario, we considered a fixed (area) fraction of 20% of solids in the computational domain and vary the composition of the solid in portions of Qz, Gt, and Il. We started with a solid phase consisting of Qz only (i.e., 0% of the solid is Gt and Il, 100% of the solid is Qz) and equally increase the portions of Il and Gt stepwise until no Qz remains in the solid (i.e., 50% of the solid is each Il and Gt, while 0% is Qz). Additionally, we investigated the effect of the net electric charge (NC) in the observed systems, including the sum of negative charged Qz and positive charges Gt as well as positively (Ilpos) or negatively (Ilneg) charged Il.
Figure 1 shows the effect of composition and charge on the average particle size (PS). If Il is positively charged, both Il and Gt can attach to Qz to form aggregates. PS for Ilpos (Figure 1) increases for compositions of 0 (i.e., only Qz) to 10% Gt/Il from 97 to a maximum PS of 896 (gray shaded in Figure 1). Mixtures with higher portions of Gt/Il then lead to smaller CBUs again (e.g., PS = 73 for 20%Gt/20%Il/60%Qz), down to a minimal PS of 6 for a mixture of 50% of (likely charged) Gt and Il, where all particles appear un-associated. In the scenarios with negatively charged Ilneg also the small BUs of Gt and Il can attach to form composites. The PS increases now from 97 (free Qz) to 761 (10% Gt/Il) and further to a maximum PS of 2027 at a composition of 36% of each Gt and Il (cp. Figure 1). The maximal reached PS corresponds to scenarios with the NC of zero in both systems (Figure 1). Hence these zero charge scenarios represent the composition of MFMs that leads to the strongest aggregation due to charge neutralization by a balanced amount of positive and negative charged MFMs in the observed systems. Compositions deviating from this optimum, i.e., with higher positive or negative net charges, produce lower PS.
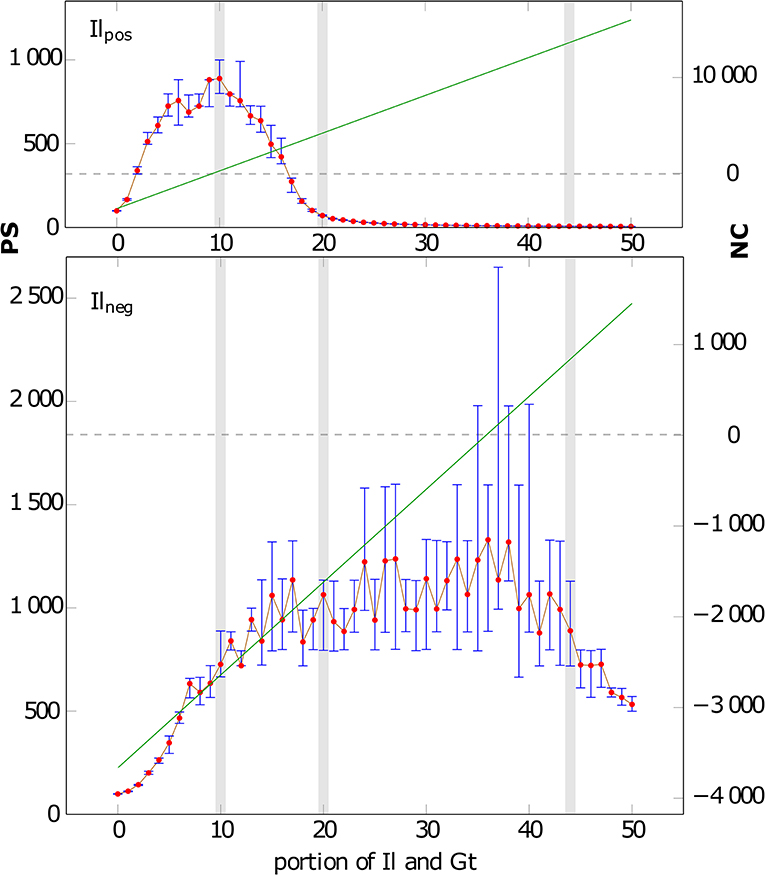
Figure 1. Average particle sizes (PS) for various compositions of the solid after 1,000 CAM steps: X-axis: number denotes the (equal) portions of Il and Gt, the remaining portion is Qz (i.e., 10 represents a composition of 10% Gt, 10% Il, and 80% Qz particles). (Top) Il is positively charged (Ilpos), (Bottom) Il is negatively charged (Ilneg). The red dots show the median of 10 runs, the blue bars indicate the lower and upper quartile of the 10 runs. The green lines depict the net electric charge (NC) of the system and correspond to the second y-axis. The intersection of the gray dashed line and the green line marked the NC of zero and the highest PS in both systems. The gray shaded areas correspond to the three compositions shown in Figure 2.
The aggregate distributions and structures obtained after 1,000 CAM steps for 10, 20, and 44% Il/Gt portions that correspond to scenarios with clearly different PS (Figure 1), including negatively and positively charged Il scenarios are exemplarily shown in Figure 2. First we observe that for Ilpos at a composition of 10%Gt/10%Il/80%Qz all MFMs are bound in CBUs. With increasing portions of Ilpos/Gt (20 and 44%) a shielding is visible by positive charged Il and Gt surrounding one negative charged Qz. The fact that smaller particles move faster than larger ones strengthens this effect. In contrast to this case, Ilneg can also bind to Gt (Figure 2). Thus, the isolation of large particles by shielding does not occur, and composites with several Qz MFMs form. Consequently PS grows up to a maximum of 2027, and does not fall below 550 even without Qz (cf. Figure 1). Furthermore, we want to emphasize that similar PS can correspond to considerably distinct phenotypes of CBUs. Exemplary, we observe short coiled chain like CBUs whose PS is in the same magnitude for mixtures of around 10% Gt/10% Ilpos/80% Qz (~897) and 20% Gt/20% Ilneg/60% Qz (~1,049). But for 44% Gt/44% Ilneg/12% Qz (~915) and higher Gt/Il concentrations structures of thin long chains are observed with increasing content of associated smaller Il and Gt particles. However, the phenotypes of the CBUs are very different (see Figure 2), with long branches of Gt/Ilneg stacks or single Qz only associated to Gt and Ilpos with increasing Gt and Il contents.
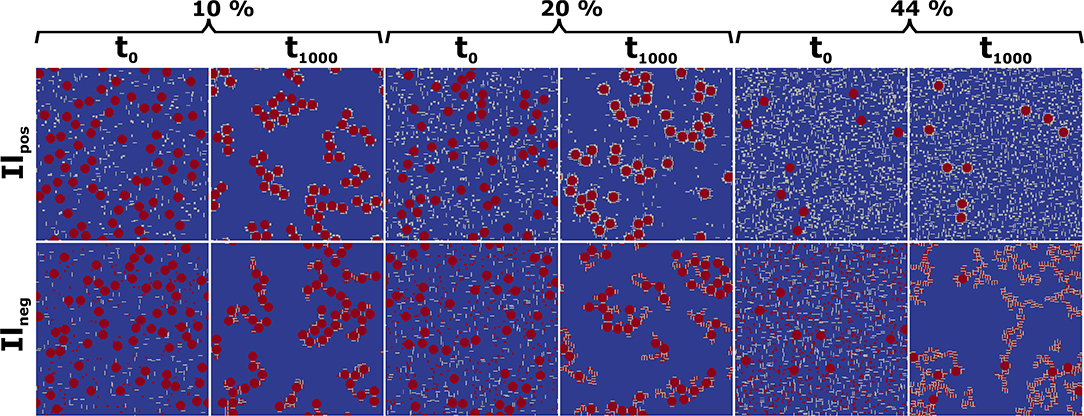
Figure 2. Initial (t0) and final state (t1,000) of a simulation with 10, 20 and 44% of positive (Ilpos) or negative (Ilneg) charged Il and Gt. Positively charged MFMs in gray, negatively charged in red.
Variation of the Size of MFMs
The second scenario considers a fixed (area) fraction of 20% solid and additionally a fixed composition of 6% Gt, 6% Ilpos and 88% Qz that has shown to produce high aggregation according to Figure 1. However, the diameter of Qz now varies from 11 to 21 to 41 (resulting in areas of 97, 349, and 1,257, respectively), i.e., the effect of size ratio of the MFMs was investigated: We compared the effect of less but larger Qz particles to the situation of more but smaller Qz particles building aggregates with Gt/Ilpos. Figure 3 illustrates the evolution of the average particle size PS and the compactness ratio CR over 1,000 CAM steps for the different Qz sizes (Green line: small Qz, red: medium size Qz, black: large Qz). First we observed that the amplitude of variations is largest for large Qz, because the aggregation or separation of a Qz MFM changes the area of a composite by at least 1,257. As the large Qz MFMs or CBUs diffuse very slowly, the much smaller Gt/Ilpos MFMs attach fast to Qz, but the formation of composites with several Qz MFMs has a low probability. With small Qz the movement is faster and the formation of structures with several Qz MFMs is facilitated. The PS grows over a larger number of time steps (compare the slopes of the PS curves in Figure 3) and CR decreases with MFM size with spherical structures having the lowest CR. Smaller Qz MFMs result in chain-like structures with highest CR, see also the exemplary configurations after 1,000 steps in Figure S1 in the Supplementary Material. Low CR are achieved for large Qz, which reflects the fact that the CBUs including large Qz are more compact, and closer to spherical structures.
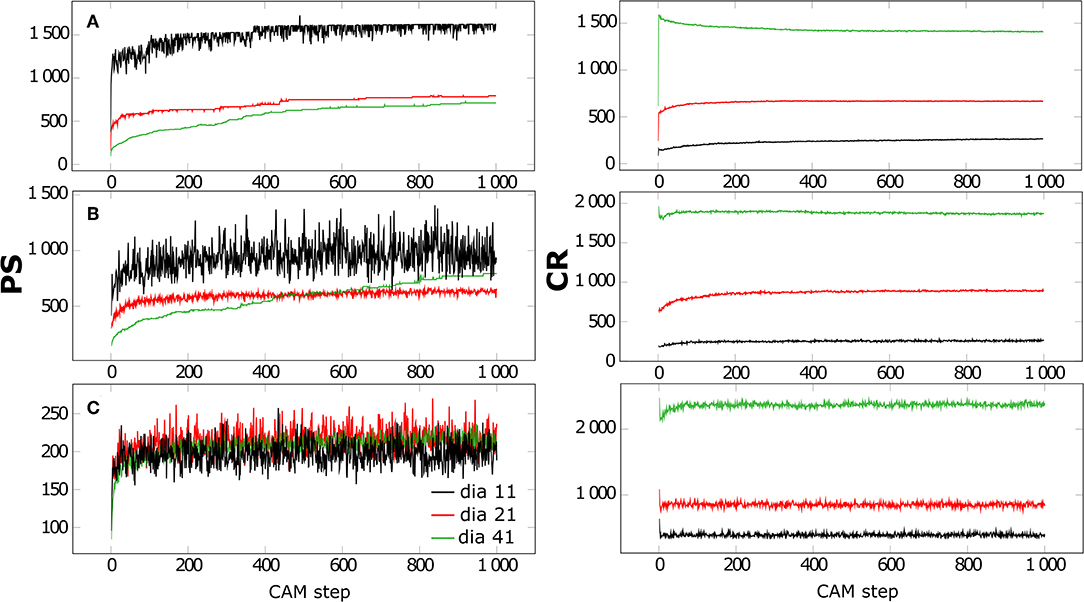
Figure 3. Average particle sizes (PS) and compactness ratios (CR) for CBUs plotted as function of time. The initial conditions were set to an area fraction of 20% and a composition of 6% Gt, 6% Ilpos and 88% Qz (A), 12% Gt, 12% Ilpos and 76% Qz (B) as well as 24% Gt, 24% Ilpos and 52% Qz (C) of different sizes: small diameter of 11 (green), medium diameter of 21 (red) and large diameter of 41 (black).
We repeated these calculations for other compositions. If we compare to a scenario with an unfavorable aggregate formation (MFM compositions of 24% Gt, 24% Ilpos, and 52% Qz see Figure 1) we obtain aggregates with the similar PS independent of initial size of Qz. During these scenarios only compact and short chain structures are formed for small and medium Qz and scenarios containing large Qz are characterized by totally separated spheres coated with Il and Gt, which are not linked to each other. Hence, the formation of dense surface coatings (shielding: inhibits dendritic growth of aggregates) with Il and Gt (over 1,000 CAM-steps) leads to the formation compact structures in all scenarios independent of initial size of Qz. As described above, scenarios containing large Qz leading to more compact structures because of their structure close to an ideal sphere (Figure S1). Intermediate scenarios of 12% Gt, 12% Ilpos and 76% Qz representing an overlapping of effects observed for scenarios with optimal (6% Gt, 6% Ilpos and 88% Qz) and reduced (24% Gt, 24% Ilpos and 52% Qz) aggregation. In these scenarios the number of particles (Il and Gt) in relation to the size and surface of the Qz particles is a distinct parameter which leads to a continuous increase in PS for small Qz. In the small Qz scenario the amount of Il and Gt is not enough to cover the whole Qz surfaces and consequently support aggregation due to bridging. If the Qz size increases, the ratio between the number of particles and the surface of Qz decline and comprehensive surface coatings are formed, which lead to an inhibited aggregation for medium and large Qz scenarios due to the Il and Gt surface coverage (Figure S1).
Variation of Concentration
As third scenario, we varied the solid concentration through changing the porosities to 95, 80, and 50% in the computational domain, equivalent to solid concentrations of 5, 20, and 50%. The composition of the solid phase is again constant with an area fraction of 6% Ilneg, 6% Gt, and 88% Qz (small size) within the solid phase (Figure 4). Note that now also the small MFMs Gt and Ilneg attract each other. We observe that PS increases with higher solid concentration in a non-linear manner. Concentration rises from 5 to 20 to 50% by factors of 4 and 10, respectively, but PS at t1,000 rises only from 174 to 372 and 645 (factors of 2.1 and 3.7). Furthermore, Figure 4 shows a fast initial aggregation for all concentration levels followed by a long transition interval and with fluctuations up to t1,000. Again, fluctuations are larger for high PS. The occurring aggregate shapes after 1,000 time steps are also a function of the porosity shown by short chain like and only single bound aggregates (porosity of 95%) over long and branched chains (porosity of 80%) to strongly coiled aggregates (porosity of 50%) (Figure 5). We also observed different shapes as function of time which suggest an increasing complexity as well as size of aggregates with ongoing aggregation time.
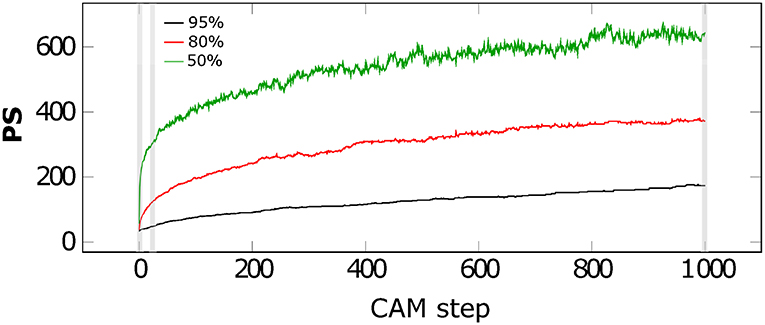
Figure 4. Average particle sizes (PS) over CAM time steps for a composition of 6%Gt/6%Ilneg/88%Qz for porosity of 50% (green), 80% (red), and 95% (black). The gray shaded areas correspond to three time steps shown in Figure 5.
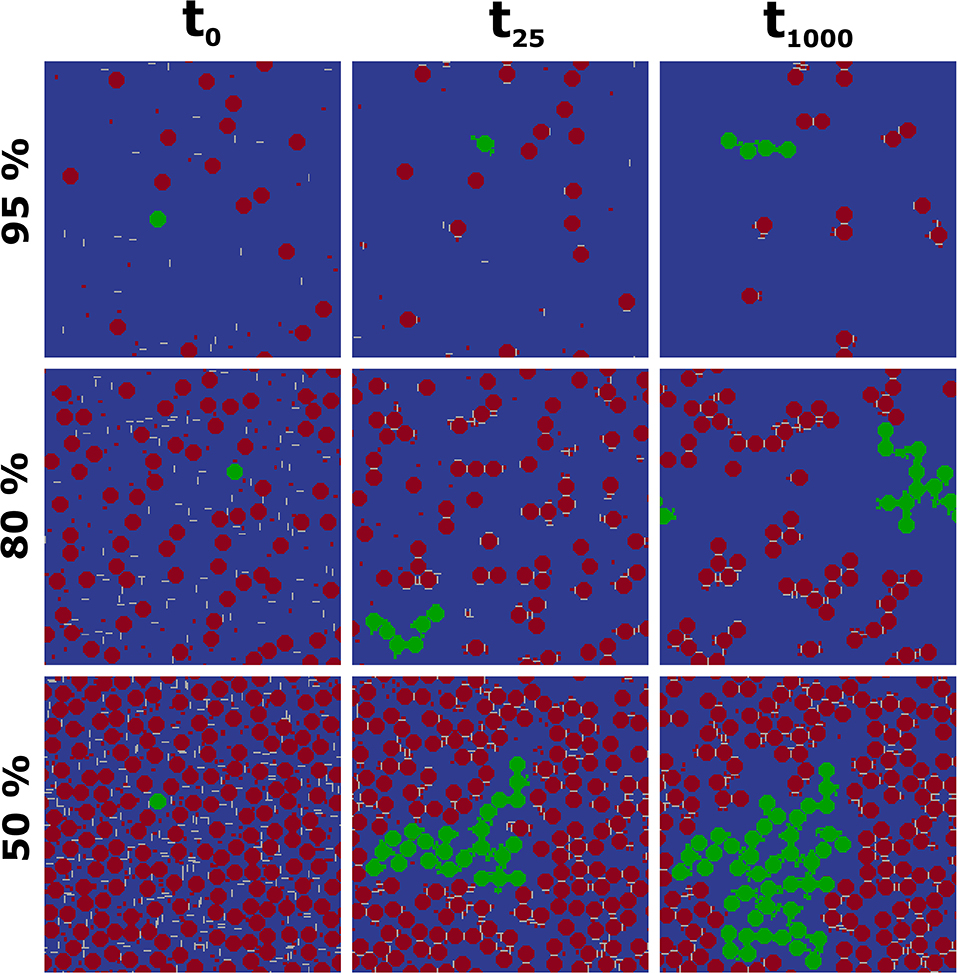
Figure 5. Influence of porosity (50, 80, and 95%) on aggregate formation for a composition of 6%Gt/6%Ilneg/88%Qz: Initial configuration (t0), after 25 CAM steps (t25), and after 1,000 CAM steps (t1,000). The green color mark represents large coherent structures in the given images (to: single Qz, no aggregation occurs; t25 and t1,000: in size increasing aggregates over time including Il, Gt, and Qz).
We also repeated these simulations with 3% Ilneg, 3% Gt, and 94% Qz (3/3/94), as well as ratios of 12/12/76, and 24/24/52. In all simulations the succession of the three curves was identical to simulations with 6% Ilneg, 6% Gt, and 88% Qz, i.e., the higher the concentrations the larger the aggregate sizes (Figure 4). Only the absolute values differed (Figure S2). In particular, increasing portions of small oppositely charged Gt lead to increasing PS values in all scenarios. However, this effect scales non-linearly to porosity due to the different number of oppositely charged clay-sized interaction partners that increase faster in number than large particles with decreasing porosities. Hence, they act more efficiently as possible bridges between equally charged MFMs.
Discussion
We can clearly see that the composition of the solid phase (proportions of Qz and Il/Gt) affects the average particle sizes (cf. Figures 1, 2). If Il is considered as net positively charged, Ilpos and Gt associate to the oppositely charged Qz surface and permit a bridging between greater Qz spheres. In comparison, if Il is net negatively charged, Gt associates to the oppositely charged IIneg and Qz, which results in a bridging due to three different combinations via Gt: Qz-Gt-Il, Il-Gt-Il, and Qz-Gt-Qz. Similar associations are also suggested by completely mixed batch reactor experiment studies due to electrostatic interactions as result of the specific surface charges of interacting compounds (Guhra et al., 2019). Also small Il-Gt-Il aggregates are attached to Qz surfaces (Figure 2). We observe clear differences for Ilneg and Ilpos in PS as function of the composition (c.f. Figure 1). However, for an area fraction of ~10% (Il/Gt), the PS values (896 for Ilpos; 761 for Ilneg) are in the same magnitude explained by the dominance of bridging via Gt. The observation of the highest PS for Ilpos at low portions of approximately 10% Il/Gt fits very well with the observations of Goldberg and Glaubig (1987), reporting that small amounts of Al- or Fe-oxides (net pos. charged) may greatly improve the flocculation of negative charged particles. For higher area fractions of Ilpos shielding effects lead to the formation of small aggregates consisting of Gt and Ilpos covered Qz spheres. The inhibition of further associations is due to neutralization of the surface charge of Qz as consequence of the association of positively charged particles, if these are present in excess (c.f. Figure 3). Ohtsubo et al. (1991) report that positively charged Fe-oxides remain in solution as soon as the negative surface charges of the counterpart are neutralized. Such shielding effects could not be observed for Ilneg due to the coexistence of equivalent amounts of positively charged Gt and negatively charged Il particles which permits the association of Gt with Il or Qz over an entire range of different Il/Gt area fractions (except 0%). The size and shape of resulting aggregates have shown to depend on the proportions of oppositely charged particles (Figure 2) and are limited by the surface available for association. Consequently, we observe highest PS (c.f. Figure 1) for small amounts of bridging particles (Gt and Ilpos) which corresponds to a NC of the system around zero. This observation is in line with the study of Bansal et al. (2017), who observe the largest structures arise due to reaching a zeta-potential near zero for the investigated two-component system. They also find formation of different aggregate shapes as function of the mixing fractions of pos. and neg. charged nanoparticles at constant volume fractions which is also shown by our results (Figure 2).
We also note that for 0% (in Ilpos and Ilneg) and 50% (in Ilpos) no aggregation occurs in our simulations. As homo-aggregation is limited to very specific conditions like achieving a pH near the PZC or charge neutrality (Tripathy and De, 2006) for single compound systems of minor relevance in nature, we did not include it here. However, this could be changed by assigning a stronger weight to the attraction of likely charged particles. Dale et al. (2015) also state that there is an increasing consensus between modelers and experimentalists that homo-aggregation can be ignored in natural systems due to vast variety of influencing variables like ionic strength, pH and composition of the media, in particular dissolved organic species, as well as the different sizes, shapes and surface coatings of interaction components (Guhra et al., 2019).
Considering the influence of the size ratio of particles on the resulting structures, the simulations demonstrate a huge impact on the compactness of particles, which reaches a stationary state much faster than the average particle size. We found the formation of the largest aggregates if the size of Qz is maximal in scenarios which were characterized by optimal aggregation (Figure 1). This is also shown by experimental studies as, e.g., by Yates et al. (2008), who observed a similar effect due to variably sized silica spheres (neg. charged) attaching to Al-oxide (pos. charged) spheres of a constant size. This highlights the importance of the initial size relation between the interacting constituents for in vitro and in silico aggregation processes. Additionally, we observe a faster aggregation for small Qz particles in comparison to larger Qz. This is explained by the amount of interacting positive and negative charged particles at constant area fractions of 20%. With increasing size, the number and specific surface area of Qz particles decrease at constant area fractions. Consequently, the interaction distances increase between oppositely charged interaction partners and the small similar charged particles competing each other to find free interaction partners, which decelerate the aggregation process (see Figure S1). In our numerical experiments, the increase in Qz size in comparison to Il and Gt corresponds to an increased compactness. This result is also observed in laboratory studies which report higher aggregate compactness if the size difference between the oppositely charged particles (aluminum-silica system) is increased (Cerbelaud et al., 2017). But if we simulate more aggregation unfavorable MFM compositions dominated by previously mentioned shielding effects due to an oversupply of Il and Gt, which force the formation of surface coatings, we limit the formation of greater aggregate structures independent of initial Qz particle size (Figure S1). In this case the aggregation is a function of surface coverage (Yates et al., 2005) and scales with the decreasing surface of Qz (in relation to Il and Gt particles) with increasing Qz particle size at fixed (area) fraction of 20% solid.
It is clearly visible that the portion of solid to fluid plays an important role for aggregation. As the interactions for particles are limited to the distance given by the stencil, the long-range interactions are solely driven by random Brownian motion until the particles approach each other (Gregory, 2006). Thus, we observe initially the most rapid aggregation for the model configurations with the lowest porosity and consequently short distances to find and associate to an interaction partner. Comparable concentration effects are typically reported from lab scale if constant boundary conditions are given but increasing initial particle concentrations are used in experiments (He et al., 2008). Additionally, Szilagyi et al. (2014) describe different stages of aggregation as function of time, whereby particle dimers are formed at early stages in comparison to higher order aggregates at later stages, which is supported by the observed sizes and shapes of aggregates formed due to our numerical experiments which are prone to become more complex and increase in aggregate size as function of CAM time steps (Figure 5). We also suggest that—although the composition and thus the portion of binding partners is the same—the structures at higher concentrations are not only an extrapolated view of the lower concentrations.
Conclusion
Soil is known to contain a vast variety of inorganic and organic MFMs like minerals, rock fragments, microorganisms, viruses, organo-mineral associations, and macro/micro-molecules that are mobilized due to the perturbation of geochemical and hydraulic settings (Ryan and Elimelech, 1996; de Jonge et al., 2004). These particles are hugely different in terms of shape, size, roughness, charge, and many further factors (McCarthy and McKay, 2004; Bin et al., 2011). With this model, we approached this natural diversity by studying a three mineral component system that was successfully used to relate the amount of differently shaped/sized and charged MFMs to the size and the structure of resulting aggregates. It was shown that our model can be used to systematically identify compositions that promote certain structural features and aggregate growth rates that, e.g., largely depend on the number of clay-sized particles. Furthermore, our model clearly reflects how surface properties, as e.g., the surface charge controlled by pH and electric conductivity (Tombácz et al., 2004; Trefalt et al., 2014) as well as the corresponding number of equal and unequal charged MFMs, facilitate the electrostatic interactions and thus the strength and kinetics of aggregation (Goldberg and Glaubig, 1987). Consequently, we obtain an evolution of small and dense structures as a result of increasing shielding effects (surface coating with counter charge MFMs) during a high charge difference between interacting MFMs or dendritic grown large structures for systems with equivalent amounts of oppositely charged MFMs where the net charge of the system tend to zero. Thus, the surface charge essentially decides on the type of aggregate that is formed. Additionally, the MFM size and especially the size relation between MFMs control how many oppositely charged MFMs are needed to neutralize the surface charge of their interaction partner and how they arrange as aggregates (Yates et al., 2005). As typical boundary conditions found in natural aqueous suspensions readily translate to the model framework, we think that the presented model is a promising tool to investigate the complex spatial and temporal interplay of aggregation mechanisms that is hard to tackle experimentally.
Outlook
Although soil is characterized as a dynamic multi-phase and -component system, it was possible to assess selected processes of aggregation and structure formation by the systematic application of mechanistic 2D CAM. Still, an extension to 3D is implied for more complex scenarios that include organic matter, microbes or a solid pore network. The size, charge, concentration, and the composition of interacting components controlled the aggregation in water-saturated systems and determined the size, shape, amount and assembly of emerging microaggregates. Consequently, the provided model produces aggregates in silico mimicking water saturated systems dominated by hetero-aggregation due to electrostatic interactions. Especially, the net charge of the observed systems has shown to be a valuable measure to assess the rate of aggregation which is also available experimentally with zeta-potential measurements. The similarities found for the modeled aggregates in comparison to aggregates formed in lab-scale environments, encourage the application of mechanistic models to investigate further scenarios, such as the impact of higher diversity of minerals and the interaction with organic matter typically found in soil solutions that require high experimental effort. The application of the model to aggregate formation experiments under precise conditions as Guhra et al. (2019), or Dultz et al. (2019) seems promising and is work under progress. Furthermore, the available methods to upscale morphological information into effective properties of higher scales have the potential to provide a link between the hierarchy of aggregates and the phenomena of flow and transport at the continuum scale in soils. With this, we may further study the path and fate of nutrients and the development of microbial habitats of in silico aggregates as surrogates for in vitro evolving structures due to morphological analyses of their compactness, size, porosity as well as charges which are important fur microbial attachment. We could also confirm that the timescale of formation is highly relevant considering the transient conditions inside a dynamic system like initial soils, deep soil horizons and ground water systems. Thus, the slow establishment of equilibrium and the different dynamics caused by various size, charge, concentration and the composition of interacting components renders the observation of end members of aggregates also unlikely in natural environments.
Data Availability Statement
The datasets generated for this study are available on request to the corresponding author.
Author Contributions
KT perceived the general concept. AR, NR, and AP developed and elaborated the modeling approach. AR and AM performed the simulations. KT, TG, and TR provide the parameter constraints and scenarios for the model runs. AR, NR, and TG wrote the manuscript. All authors carefully reviewed the manuscript.
Funding
This research was kindly supported by the DFG RU 2179 MAD Soil - Microaggregates: Formation and turnover of the structural building blocks of soils.
Conflict of Interest
The authors declare that the research was conducted in the absence of any commercial or financial relationships that could be construed as a potential conflict of interest.
Supplementary Material
The Supplementary Material for this article can be found online at: https://www.frontiersin.org/articles/10.3389/fenvs.2019.00170/full#supplementary-material
References
Bansal, P., Deshpande, A. P., and Basavaraj, M. G. (2017). Hetero-aggregation of oppositely charged nanoparticles. Colloid Interface Sci. 492, 92–100. doi: 10.1016/j.jcis.2016.12.059
Bin, G., Cao, X., Dong, Y., Luo, Y., and Ma, L. Q. (2011). Colloid deposition and release in soils and their association with heavy metals. Crit. Rev. Environ. Sci. Technol. 41, 336–372. doi: 10.1080/10643380902871464
Blunt, M. J., Bijeljic, B., Dong, H., Gharbi, O., Iglauer, S., Mostaghimi, P., et al. (2013). Pore-scale imaging and modelling. Adv. Water Resour. 51, 197–216. doi: 10.1016/j.advwatres.2012.03.003
Bremer, L. G. B., Walstra, P., and van Vliet, T. (1995). Estimations of the aggregation time of various colloidal systems. Colloids Surf. A 99, 121–127. doi: 10.1016/0927-7757(95)03159-B
Buffle, J., and Leppard, G. G. (1995). Characterization of aquatic colloids and macromolecules. 1. Structure and behaviour of colloidal material. Environ. Sci. Technol. 29, 2169–2175. doi: 10.1021/es00009a004
Cerbelaud, M., Videcoq, A., Rossignol, F., Piechowiak, M. A., Bochicchio, D., and Ferrando, R. (2017). Heteroaggregation of ceramic colloids in suspensions. Adv. Phys. X 2, 35–53. doi: 10.1080/23746149.2016.1254064
Crawford, J., Deacon, L., Grinev, D., Harris, J., Ritz, K., Singh, B., et al. (2012). Microbial diversity affects self-organization of the soil - microbe system with consequences for function. J. R. Soc. Interface 9, 1302–1310. doi: 10.1098/rsif.2011.0679
Dale, A. L., Casman, E. A., Lowry, G. V., Lead, J. R., Viparelli, E., and Baalousha, M. (2015). Modeling nanomaterial environmental fate in aquatic systems. Environ. Sci. Technol. 49, 2587–2593. doi: 10.1021/es505076w
de Jonge, L. W., Kjaergaard, C., and Moldrup, P. (2004). Colloids and colloid-facilitated transport of contaminants in soils. Vadose Zone J. 3, 321–325. doi: 10.2113/3.2.321
Dultz, S., Woche, S. K., Mikutta, R., Schrapel, M., and Guggenberger, G. (2019). Size and charge constraints in microaggregation: model experiments with mineral particle size fractions. Appl. Clay Sci. 170, 29–40. doi: 10.1016/j.clay.2019.01.002
Fermin, D., and Riley, J. (2010). “Charge in colloidal systems,” in Colloid Science Principles, Methods and Applications, ed T. Cosgrove (Chichester, UK: John Wiley & Sons), 45–59.
Goldberg, S., and Glaubig, R. A. (1987). Effect of saturating cation, pH, and aluminium and iron oxide on the flocculation of kaolinite and montmorillonite. Clays Clay Miner. 3, 220–227. doi: 10.1346/CCMN.1987.0350308
Guhra, T., Ritschel, T., and Totsche, K. U. (2019). Formation of mineral-mineral and organo-mineral composite building units from microaggregate-forming materials including microbially produced extracellular polymeric substances. Eur. J. Soil Sci. 70, 604–615. doi: 10.1111/ejss.12774
He, Y. H., Wan, J., and Tokunaga, T. (2008). Kinetic stability of hematite nanoparticles: the effect of particle sizes. J. Nanopart. Res. 10, 321–332. doi: 10.1007/s11051-007-9255-1
Kosmulski, M. (2011). The pH-dependent surface charging and points of zero charge V. Update. J. Colloid Interf. Sci. 353, 1–15. doi: 10.1016/j.jcis.2010.08.023
McCarthy, J. F., and McKay, L. D. (2004). Colloid transport in the subsurface: past, present, and future challenges. Vadose Zone J. 3, 326–337. doi: 10.2113/3.2.326
Ohtsubo, M., Yoshimura, A., Wada, S.-I., and Yong, R. N. (1991). Particle interaction and rheology of illite-iron oxide complexes. Clays Clay Miner. 39, 347–354. doi: 10.1346/CCMN.1991.0390402
Portell, X., Pot, V., Garnier, P., Otten, W., and Baveye, P. C. (2018). Microscale heterogeneity of the spatial distribution of organic matter can promote bacterial biodiversity in soils: insights from computer simulations. Front. Microbiol. 9:1583. doi: 10.3389/fmicb.2018.01583
Ray, N., Rupp, A., and Prechtel, A. (2017). Discrete-continuum multiscale model for transport, biomass development and solid restructuring in porous media. Adv. Water Resour. 107, 393–404. doi: 10.1016/j.advwatres.2017.04.001
Ray, N., Rupp, A., Schulz, R., and Knabner, P. (2018). Old and new approaches predicting the diffusion in porous media. Transp. Porous Med. 124, 803–824. doi: 10.1007/s11242-018-1099-x
Ritschel, T., and Totsche, K. U. (2019). Modeling the formation of soil microaggregates. Comput. Geosci. 127, 36–43. doi: 10.1016/j.cageo.2019.02.010
Rupp, A. (2019). Simulating structure formation in soils across scales using discontinuous Galerkin methods (Ph.D. Thesis). Germany: Shaker, Düren.
Rupp, A., Totsche, K. U., Prechtel, A., and Ray, N. (2018). Discrete-continuum multiphase model for structure formation in soils including electrostatic effects. Front. Environ. Sci. 6:96. doi: 10.3389/fenvs.2018.00096
Ryan, J. N., and Elimelech, M. (1996). Colloid mobilization and transport in groundwater. Colloids Surf. A. 107, 1–56. doi: 10.1016/0927-7757(95)03384-X
Schulz, R., Ray, N., Zech, S., Rupp, A., and Knabner, P. (2019). Beyond Kozeny–Carman: predicting the permeability in porous media. Transp. Porous Med. 130, 487–512. doi: 10.1007/s11242-019-01321-y
Segoli, M., De Gryze, S., Dou, F., Lee, J., Post, W. M., Denef, K., et al. (2013). AggModel: a soil organic matter model with measurable pools for use in incubation studies. Ecol. Model. 263, 1–9. doi: 10.1016/j.ecolmodel.2013.04.010
Six, J., Bossuyt, H., Degryze, S., and Denef, K. (2004). A history of research on the link between (micro)aggregates, soil biota, and soil organic matter dynamics. Soil Till. Res. 79, 7–31. doi: 10.1016/j.still.2004.03.008
Stamati, F. E., Nikolaidis, N. P., Banwart, S., and Blum, W. E. H. (2013). A coupled carbon, aggregation, and structure turnover (CAST) model for topsoils. Geoderma 211–212, 51–64. doi: 10.1016/j.geoderma.2013.06.014
Szilagyi, I., Szabo, T., Desert, A., Trefalt, G., Oncsik, T., and Borkovec, M. (2014). Particle aggregation mechanisms in ionic liquids. Phys. Chem. Chem. Phys. 16, 9515–9524. doi: 10.1039/C4CP00804A
Tang, Y., and Valocchi, A. (2013). An improved cellular automaton method to model multispecies biofilms. Water Res. 47, 5729–5742. doi: 10.1016/j.watres.2013.06.055
Tang, Y., Valocchi, A., Werth, C., and Liu, H. (2013). An improved pore-scale biofilm model and comparison with a microfluidic flow cell experiment. Water Resour. Res. 49, 8370–8382. doi: 10.1002/2013WR013843
Tisdall, J. M., and Oades, J. M. (1982). Organic matter and water-stable aggregates in soils. J. Soil Sci. 33, 141–163. doi: 10.1111/j.1365-2389.1982.tb01755.x
Tombácz, E., Casanky, C., and Illés, E. (2001). Polydisperse fractal aggregate formation in clay mineral and iron oxide suspensions, pH and ionic strength dependence. Colloid Polym. Sci. 279, 484–492. doi: 10.1007/s003960100480
Tombácz, E., Libor, Z., Illés, E., Majzik, A., and Klumpp, E. (2004). The role of reactive surface sites and complexation by humic acids in the interaction of clay mineral and iron oxide particles. Org. Geochem. 35, 257–267. doi: 10.1016/j.orggeochem.2003.11.002
Tombácz, E., and Szekeres, M. (2006). Surface charge heterogeneity of kaolinite in aqueous suspension in comparison with montmorillonite. Appl. Clay Sci. 34, 105–124. doi: 10.1016/j.clay.2006.05.009
Totsche, K. U., Amelung, W., Gerzabek, M. H., Guggenberger, G., Klumpp, E., Knief, C., et al. (2018). Microaggregates in soils. J. Plant Nutr. Soil Sci. 181, 104–136. doi: 10.1002/jpln.201600451
Totsche, K. U., Rennert, T., Gerzabek, M. H., Kögel-Knabner, I., Smalla, K., Spiteller, M., et al. (2010). Biogeochemical interfaces in soil: the interdisciplinary challenge for soil science. J. Plant Nutr. Soil Sci. 173, 88–99. doi: 10.1002/jpln.200900105
Trefalt, G., Ruiz-Cabello, F. J. M., and Borkovec, M. (2014). Interaction forces, heteroaggregation, and deposition involving charged colloidal particles. J. Phys. Chem. B 118, 6346–6355. doi: 10.1021/jp503564p
Tripathy, T., and De, B. R. (2006). Flocculation: a new way to treat the waste water. J. Phys. Sci. 10, 93–127.
Yates, P. D., Franks, G. V., Biggs, S., and Jameson, G. J. (2005). Heteroaggregation with nanoparticles: effect of particle size ratio on optimum particle dose. Colloids Surf. A 255, 85–90. doi: 10.1016/j.colsurfa.2004.12.035
Keywords: individual based modeling, microaggregate formation, mineral surface charge, morphological characteristics, soil structure simulation, self-organization, cellular automaton
Citation: Rupp A, Guhra T, Meier A, Prechtel A, Ritschel T, Ray N and Totsche KU (2019) Application of a Cellular Automaton Method to Model the Structure Formation in Soils Under Saturated Conditions: A Mechanistic Approach. Front. Environ. Sci. 7:170. doi: 10.3389/fenvs.2019.00170
Received: 26 July 2019; Accepted: 09 October 2019;
Published: 01 November 2019.
Edited by:
Ali Ebrahimi, Massachusetts Institute of Technology, United StatesReviewed by:
Bin Wang, University of California, Irvine, United StatesJing Yan, University of California, Merced, United States
Nasrollah Sepehrnia, Leibniz University Hannover, Germany
Copyright © 2019 Rupp, Guhra, Meier, Prechtel, Ritschel, Ray and Totsche. This is an open-access article distributed under the terms of the Creative Commons Attribution License (CC BY). The use, distribution or reproduction in other forums is permitted, provided the original author(s) and the copyright owner(s) are credited and that the original publication in this journal is cited, in accordance with accepted academic practice. No use, distribution or reproduction is permitted which does not comply with these terms.
*Correspondence: Nadja Ray, cmF5QG1hdGguZmF1LmRl