 Paul B. L. George1,2*
 Simon Creer1
 Robert I. Griffiths2
 Bridget A. Emmett2David A. Robinson2
 Davey L. Jones1,3
- 1School of Natural Sciences, Bangor University, Bangor, United Kingdom
- 2Centre for Ecology & Hydrology, Environment Centre Wales, Bangor, United Kingdom
- 3SoilsWest, UWA School of Agriculture and Environment, The University of Western Australia, Perth, WA, Australia
The internal transcribed spacer (ITS) region is the accepted DNA barcode of fungi. Its use has led to a step-change in the assessment and characterisation of fungal communities from environmental samples by precluding the need to isolate, culture, and identify individuals. However, certain functionally important groups, such as the arbuscular mycorrhizas (Glomeromycetes), are better characterised by alternative markers such as the 18S rRNA region. Previous use of an ITS primer set in a nationwide metabarcoding soil biodiversity survey revealed that fungal richness declined along a gradient of productivity and management intensity. Here, we wanted to discern whether this trend was also present in data generated from universal 18S primers. Furthermore, we wanted to extend this comparison to include measures of functional diversity and establish trends with soil types and soil organic matter (SOM) content. Over the 413 individual sites examined (arable, grassland, woodland, moorland, heathland), we found congruent trends of total fungal richness and β-diversity across land uses, SOM class, and soil type with both ITS and 18S primer sets. A total of 24 fungal classes were shared between datasets, in addition to 15 unique to ITS1 and 12 unique to 18S. However, using FUNGUILD, divergent trends of functional group richness became apparent, especially for symbiotrophic fungi, likely driven by an increased detection rate of Glomeromycetes in the 18S dataset. The disparate trends were also apparent when richness and β-diversity were compared to soil properties. Additionally, we found SOM class to be a more meaningful variable than soil type biodiversity for predicting biodiversity analyses because organic matter was calculated for each sample whereas soil type was assigned from a national soil map. We advocate that a combination of fungal primers should be used in large-scale soil biodiversity surveys to capture important groups that can be underrepresented by universal barcodes. Utilising such an approach can prevent the oversight of ubiquitous but poorly described species as well as critically important functional groups.
Introduction
Soil fungi are the dominant eukaryotic component of soil communities and are known to perform crucial ecosystem functions (Peay et al., 2008). Characterising the diversity of fungi within the landscape and their response to anthropogenic perturbation therefore represents an important topic within ecology. High-throughput sequencing has allowed the rapid estimation and identification of fungi by overcoming historical limitations of culture isolation and classifying fruiting bodies (Tedersoo et al., 2015). Using these DNA-based approaches it has been estimated that global fungal diversity in soil ranges from 3.5 to 5 million species. Yet at the beginning of the present decade, only around one-tenth of fungal diversity was thought to have been described (Rosling et al., 2011). In terms of ecosystem function, the majority of fungi are important in organic matter turnover and nutrient recycling as they facilitate the conversion of complex organic polymers into forms more readily accessible to other organisms (Peay et al., 2008; Nguyen et al., 2016). Consequently, they play a crucial role in regulating both below- and above-ground productivity (Peay et al., 2008). Many soil fungi also form important interactions with plants. Some form mutualistic relationships, best exemplified by the wide range of mycorrhizas (Wang and Qui, 2006; Smith and Read, 2008; Nguyen et al., 2016), whereas others are pathogens, responsible for numerous plant and animal diseases within agriculture and forestry (Fisher et al., 2012; Nguyen et al., 2016). Depending on environmental conditions or life stage, fungi are capable of taking on some or all of these roles (i.e., saprotroph, symbiotroph, pathotroph; Fisher et al., 2012). Despite the recognition that fungi are extremely important in soil ecosystems, characterising fungal communities has remained a challenge, exemplified by the numerous studies on soil bacteria in comparison to fungi.
Fungal barcode sequences are found within the ubiquitous, multicopy ribosomal RNA gene. Within this, the internal transcribed spacer (ITS) region has been accepted as a universal barcode for fungi (Schoch et al., 2012). Recent development of ITS-based databases such as UNITE (Kõljalg et al., 2013) and Warcup (Deshpande et al., 2016) have overcome limitations in collecting and assigning taxonomic identities to unknown sequences, though database selection may introduce bias into results (Tedersoo et al., 2015; Xue et al., 2019). Yet ITS barcodes exhibit some limitations when dealing with unknown or environmental samples. Generally, the ITS region cannot be aligned above the family-level (Cavender-Bares et al., 2009), making phylogenies based on ITS sequence data unreliable. Importantly, the ITS region has proven unreliable at distinguishing certain fungal groups at the species-level, such as Glomeromycetes (Stockinger et al., 2010). Such inconsistencies mean that ITS primers may not accurately detect target organisms. For instance, Berruti et al. (2017), found that ITS primers underestimated Glomeromycetes in bulk soil. Such uncertainty may confound experimental results and lead to erroneous conclusions.
Despite the widespread use of ITS barcodes, other markers may better capture the diversity of some fungal taxa. Primers targeting the small and large subunits as well as the ITS regions of the rRNA gene have all been applied to fungi (Tedersoo et al., 2015; Xue et al., 2019). For example, early diverging lineages such as Chytridiomycota (Schoch et al., 2012; Tedersoo et al., 2015) and Glomeromycetes (Tedersoo et al., 2015) are poorly represented in ITS sequencing. Additionally, advancements in classification have highlighted the shortcomings of environmental DNA barcoding. For example, the Archaeorhizomycetes are a poorly understood but ubiquitous class of soil fungi and their previously unidentifiable sequences have been major components of past soil biodiversity assessments (Anderson et al., 2003; Rosling et al., 2011). Overlooking these lineages may potentially lead to erroneous assumptions of biological and functional diversity in soils.
Underrepresentation of Glomeromycetes in particular exemplifies this issue. Arbuscular mycorrhizal fungi (AMF) form symbiotic relationships with more than 80% of vascular plant families and have been categorised into the monophyletic Glomeromycetes (Schüβler et al., 2001). Unlike most fungi, the ITS region has consistently demonstrated poor resolution in some closely related AMF species (Stockinger et al., 2010) as it is too hyper-variable (Thiéry et al., 2016). As mentioned previously, the ITS region underestimates Glomeromycetes in bulk soil (Berruti et al., 2017). Instead, the 18S region is more commonly used for barcoding AMF, especially in ecological studies (Öpik et al., 2014). Therefore, it is important to recognise biases inherent even in supposedly universal barcodes.
We previously undertook a nation-wide assessment of soil biodiversity across Wales, representing a breadth of heterogeneous land uses, which included agricultural land, grasslands, woodlands, and upland bogs. In this case, fungal richness and β-diversity were assessed using soil environmental DNA, utilising ITS1 primers (George et al., 2019). Yet, from the earliest stages of experimental design, we were cognisant that the ITS1 universal primer choice may not account for numerous functionally important fungal groups, particularly AMF. Thus, the primary objective of the present study was to assess whether observed fungal biodiversity (richness and β-diversity) across contrasting land uses from the ITS1 dataset would differ when compared to a dataset derived from an alternative choice of primer and database. We therefore sought to assess if primer choice influenced fungal biodiversity across land use, soil type, and soil organic matter (SOM) class. Our next aim was to critically evaluate the influence of climatic and edaphic factors [e.g., soil pH, total carbon (C), nitrogen (N), phosphorus (P)] on fungal diversity arising from the use of the two different primer sets. Our final aim was to look for differences in coverage of taxonomic and functional diversity between the two primer sets across the broad range of land uses and soil types evaluated.
Materials and Methods
Study Design
Data were collected as part of the Glastir Monitoring & Evaluation Programme (GMEP). The GMEP initiative was established by Welsh Government to monitor their most recent agri-environment scheme, Glastir, which involved 4,911 landowners over an area of 3,263 km2 (Figure 1). Through the GMEP framework, survey teams collected samples in 2013 and 2014 between April and October in each year (Emmett and the GMEP Team, 2017). Sampling protocols were based on those of the UK-wide ecosystem monitoring programme, Countryside Survey (Emmett et al., 2010). The survey design randomly located 300, 1 km squares across 26 land classes in Wales which survey teams sampled with 5 plots in each square. A subset of samples were then randomly chosen from squares with a maximum of 3 selected in an individual square. A total of 437 samples were collected for biodiversity analyses.
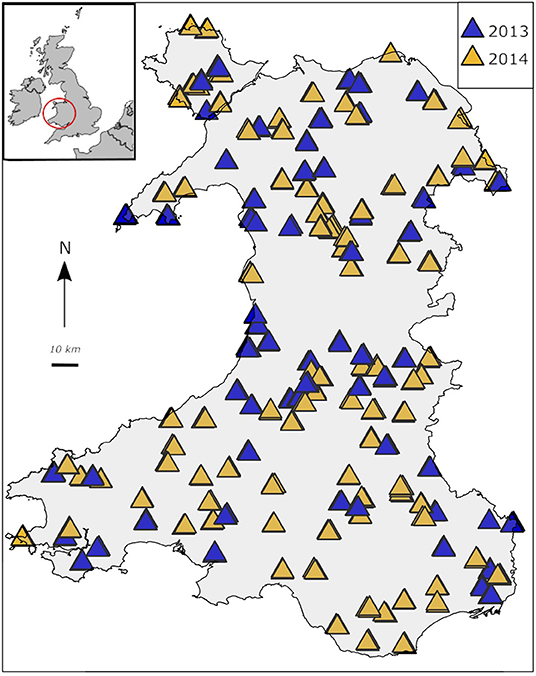
Figure 1. Map of sites selected for GMEP monitoring. To protect landowner anonymity, each triangle gives an approximate location of every 1 km2 plot from which samples were taken.
At each sampling location, 2 cores were collected. One was a 15 cm deep by 4 cm diameter core from which measurements of soil physical and chemical properties were taken, including total C (%), N (%), P (mg/kg), organic matter (% loss-on-ignition), pH (measured in 0.01 M CaCl2), mean soil water repellency (water drop penetration time in seconds), bulk density (g/cm3), volume of rocks (cm3), volumetric water content (m3/m3), as well as percentage sand and clay. For complete details on chemical analyses methodology, see Emmett et al. (2010). Soil texture data were measured by laser granulometry with a LS320 13 analyser (Beckman-Coulter) as described in George et al. (2019). The cut-off points for clay, silt, and sand were: 2.2, 63, and 2,000 μm, respectively. Clay and sand percentages were selected for subsequent analyses and normalised using Aitchison's log10-ratio transformation. Further geographic data including grid eastings, northings, and elevation were also collected. Mean temperature (°C) on date of sample collection and annual precipitation (mL) data were extracted from the Climate Hydrology and Ecology research Support System dataset (Robinson et al., 2017). Environmental variables were normalised (by log10 or square root transformation) where appropriate (see Table 1).
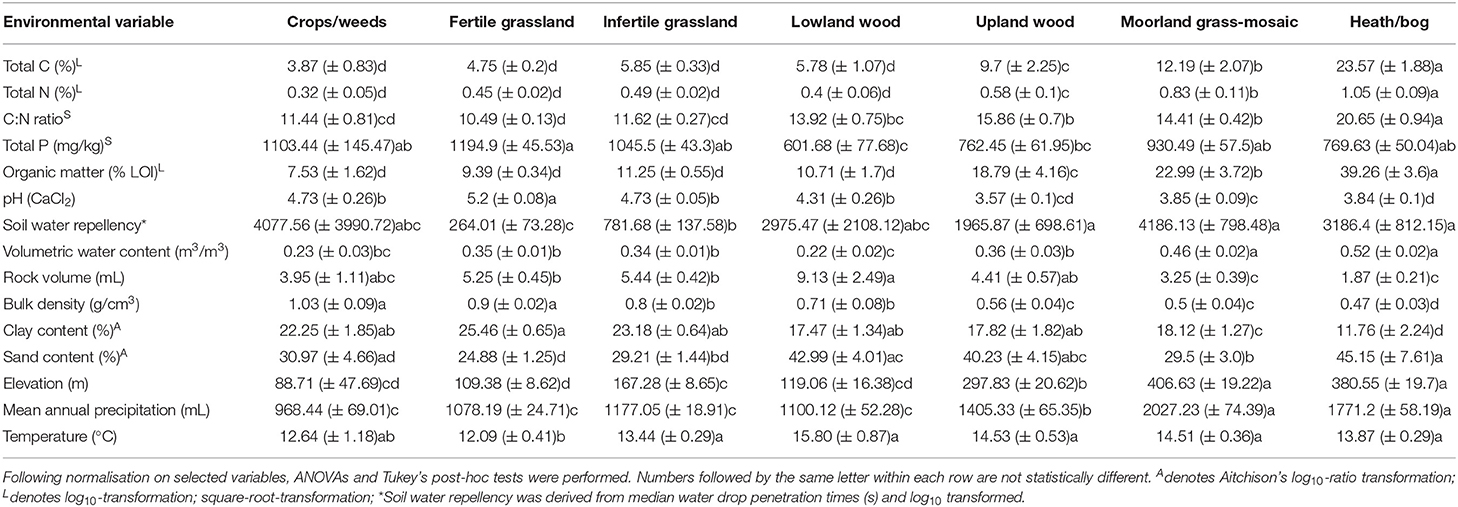
Table 1. Mean values (± SE) of soil physical and chemical variables for each Aggregate Vegetation Class.
Each sampling site was assigned to a land use category, soil type, and SOM class (based on percentage organic matter). The land use classification used in this study was originally developed for the UK Countryside Survey in 1990 (Bunce et al., 1999). Briefly, vegetation was recorded by surveyors and used to classify each site into one of the 8 Aggregate Vegetation Classes (AVCs) as described in Bunce et al. (1999; for further details please see Supplementary Material). The AVCs have been shown to follow a gradient of soil nutrient content from which productivity and management intensity can also be inferred (see Supplementary Material and Bunce et al., 1999). There were 7 AVCs identified in the present study. The AVCs in descending order of productivity are: Crops/weeds (including arable land), Fertile grassland, Infertile grassland, Lowland woodland, Upland woodland, Moorland grass-mosaic, Heath/bog (Supplementary Table 1). Soil type based on the predominant major soil group classification was extracted from the National Soil Map (Supplementary Material; Avery, 1980). Additionally, we classified soils on a per sample basis by organic matter content. Each sample was grouped into one of four organic matter classes based on percent loss-on-ignition (LOI) following the protocols of the 2007 Countryside Survey (Emmett et al., 2010): mineral (0–8% LOI), humus-mineral (8–30% LOI), organo-mineral (30–60% LOI), and organic (60–100% LOI). Mean values for each environmental variable were recorded for each land use, soil organic matter class, and soil type.
DNA Extraction
Soils used in DNA extraction were collected from 15 cm deep by 8 cm diameter cores. Soil samples were transported in refrigerated boxes; samples were received at Environment Centre Wales, Bangor within an average of 48 h post-extraction and frozen at −80°C upon arrival. Soils were then thawed and homogenised as they passed through a sterilised 2 mm stainless steel sieve after which they were returned to a −80°C freezer until DNA extraction. Sieves were sterilised between samples by rinsing with tap water at high pressure and an application of Vircon® laboratory disinfectant followed by UV-treating each side for 5 min. DNA was extracted by mechanical lysis from 0.25 g of soil per sample using a PowerLyzer PowerSoil DNA Isolation Kit (MO-BIO Inc.). Soils were pre-treated with 750 μL of a suspension of CaCO3 (1 M) following Sagova-Mareckova et al. (2008) to improve PCR performances, especially for acidic soils. Extracted DNA was stored at −20°C until amplicon library preparation began. The extractions and homogenisation steps were performed in triplicate. To check for contamination in sieves, 3 negative control DNA extractions were completed as well as 2 negative control kit extractions using the same technique but without the CaCO3 pre-treatment. Aliquots of the resultant DNA were used to create amplicon libraries for sequencing with each primer set.
Primer Selection and PCR Protocols for Library Preparation
Amplicon libraries were created using primers for the ITS1 (ITS5/5.8S_fungi) area to specifically target fungi (Epp et al., 2012) and the V4 region of the 18S gene (TAReuk454FWD1/TAReukREV3; Behnke et al., 2011) targeting a wide range of, but not all, eukaryotic organisms, including fungi. A two-step PCR following protocols devised in conjunction with the Liverpool Centre for Genome Research was used as described in George et al. (2019). Amplification of amplicon libraries was run in triplicate on DNA Engine Tetrad® 2 Peltier Thermal Cycler (BIO-RAD Laboratories Inc.) and thermocycling parameters for both PCR protocols started with 98°C for 30 s and terminated with 72°C for 10 min for final extension and held at 4°C for a final 10 min. For the ITS1 locus, there were 15 cycles of 98°C for 10 s; 58°C for 30 s; 72°C for 30 s. For the 18S locus there were 15 cycles at 98°C for 10 s; 50°C for 30 s; 72°C for 30 s. Twelve microliters of each first-round PCR product were mixed with 0.1 μL of exonuclease I, 0.2 of μL thermosensitive alkaline phosphatase, and 0.7 μL of water and cleaned in the thermocycler with a programme of 37°C for 15 min and 74°C for 15 min and held at 4°C. Addition of Illumina Nextera XT 384-way indexing primers to the cleaned first round PCR products were amplified following a single protocol which started with initial denaturation at 98°C for 3 min; 15 cycles of 95°C for 30 s; 55°C for 30 s; 72°C for 30 s; final extension at 72°C for 5 min and held at 4°C. Twenty-five microliters of second-round PCR products were purified with an equal amount of AMPure XP beads (Beckman Coulter). Library preparation for the 2013 samples was conducted at Bangor University. Illumina sequencing for both years and library preparation for 2014 samples were conducted at the Liverpool Centre for Genome Research.
Bioinformatics
Bioinformatics analyses were performed on the Supercomputing Wales cluster as previously described in George et al. (2019). A total of 104,276,828, and 98,999,009 raw reads were recovered from the ITS1 and 18S sequences, respectively. Illumina adapters were trimmed from sequences using Cutadapt (Martin, 2011) with 10% level mismatch for removal. Sequences were then de-multiplexed, filtered, quality-checked, and clustered using a combination of USEARCH v. 7.0 (Edgar, 2010) and VSEARCH v. 2.3.2 (Rognes et al., 2016). Open-reference clustering (97% sequence similarity) of operational taxonomic units (OTUs) was performed using VSEARCH; all other steps were conducted with USEARCH. Sequences with a maximum error greater than 1 and shorter than 200 bp were removed following the merging of forward and reverse reads for ITS1 sequences. A cut-off of 250 bp was used for 18S sequences, according to higher quality scores. There were 7,242,508 (ITS1) and 9,163,754 (18S) cleaned reads following these steps. Sequences were sorted and those that only appeared once in each dataset were removed.
Remaining sequences were matched first against the UNITE 7.2 (Kõljalg et al., 2013) and SILVA 128 (Quast et al., 2013) databases for the ITS1 and 18S sequences, respectively. Ten per cent of sequences that failed to match were clustered de novo and used as a new reference database for failed sequences. Sequences that failed to match with the de novo database were subsequently also clustered de novo. All clusters were collated and chimeras were removed using the uchime_ref command in VSEARCH. Chimera-free clusters and taxonomy assignment summarised in an OTU table with QIIME v. 1.9.1 (Caporaso et al., 2010) using RDP (Wang et al., 2007) methodology with the UNITE database for ITS1 data. Taxonomy was assigned to the 18S OTU table using BLAST (Altschul et al., 1990) against the SILVA database and OTUs appearing only once or in only 1 sample were removed from each OTU table. Based on DNA quality and read counts, 413 samples were used for analyses of the ITS1 data and 422 for 18S data (from the total of 438).
A Newick tree was constructed for the 18S tables using 80% identity thresholds and was paired with the 18S OTU table as part of analyses using the R package phyloseq (McMurdie and Holmes, 2013). Non-fungi OTUs were removed from both OTU tables. Read counts from each group were rarefied 100 times using phyloseq (as justified by Weiss et al., 2017) and the resulting mean richness was calculated for each sample. The ITS1 table was rarefied at a depth of 4,000 reads whereas the 18S table was rarefied to 10,000 reads. A subset of the 18S data was rarefied to 400 reads across 398 samples to analyse Glomeromycetes OTUs separately. Samples with observed lower read counts were removed before rarefaction. To assess functional diversity, both OTU tables were processed using FUNGUILD (Nguyen et al., 2016) and the resulting matched OTU tables were used to investigate functional roles based on trophic mode. Sequences have been uploaded to The European Nucleotide Archive and can be accessed with the following primary accession codes after the end of the data embargo: PRJEB28028 (ITS1), and PRJEB28067 (18S).
Statistical Analysis
All statistical analyses were run using R v. 3.3.3 (R Core Team, 2017) following rarefaction. For each data set, NMDS ordinations using Bray-Curtis dissimilarity were created with the vegan package (Oksanen et al., 2016) to assess β-diversity. Environmental data was fitted linearly onto each ordination of AVCs using the envfit function. NMDS scores were plotted against these values for each variable to determine the direction of associations. Differences in β-diversity amongst AVCs were calculated with PERMANOVA and homogeneity of dispersion was also assessed.
Linear mixed models were constructed using package nlme (Pinheiro et al., 2016) to show the differences in α-diversity amongst AVCs, soil types, and LOI classification, for both ITS1 and 18S fungal data sets. Sample year as fixed factors; sample square identity was the random factor. This methodology was also used for the subsets of data that matched to the FUNGUILD database. For each model, significant differences were assessed by ANOVA and pairwise differences were identified using Tukey's post-hoc tests from the multcomp package (Hothorn et al., 2008).
Partial least squares regressions from the pls package (Mevik et al., 2016) were used with the variable importance in projection (VIP) approach (Chong and Jun, 2005) to sort the original explanatory variables by order of importance to identify the most important environmental variables for richness. Such analysis is ideal for data where there are many more explanatory variables than sample numbers or where extreme multicollinearity is present (Lallias et al., 2015; George et al., 2019). Variables with VIP values > 1 were considered most important. Relationships between important variables and richness values for each group of organisms were investigated by linear regression. Richness was normalised before regression when necessary.
Results
Soil Properties
Soil properties displayed a range of changes across land uses (Table 1). Notably, total C [F(6, 427) = 89.13 p < 0.001], total N [F(6, 427) = 61.03, p < 0.001], C:N ratio [F(6, 427) = 94.41, p < 0.001], organic matter content [F(6, 428) = 107.02, p < 0.001], elevation [F(6, 429) = 78.42, p < 0.001], and mean annual precipitation [F(6, 429) = 72.6, p < 0.001], and moisture [F(6, 427) = 33.74, p < 0.001] increased with declining land use productivity. We also observed a reduction in pH [F(6, 428) = 69.56, p < 0.001], bulk density [F(6, 428) = 79.87, p < 0.001], and clay content [F(6, 344) = 19.54, p < 0.001] across the land use productivity gradient. Trends in other variables such as soil water repellency [F(6, 428) = 22.08, p < 0.001], total P [F(6, 424) = 7.1, p < 0.001], sand content [F(6, 344) = 5.71, p < 0.001], stone content [F(6, 427) = 10.4, p < 0.001], and temperature at time of sampling [F(6, 429) = 4.4, p < 0.001], though significant, were less clear across land uses however. These findings were also apparent when samples were grouped from low-to-high organic matter content by organic matter class (Supplementary Table 2). Overall, no clear trends were evident across the different soil types (Supplementary Table 3).
Sequencing Data
A total of 7,582 and 4,408 fungal OTUs were recovered using the ITS1 and 18S primer sets, respectively. Of these, 5,666 were assigned an identifier at the class-level in the ITS1 dataset while 4,367 were assigned an identifier in the 18S dataset. There were 15 classes that were only found in the ITS1 dataset and 12 unique to the 18S data. Endogonomycetes was the most abundant class found only in the ITS dataset (19 OTUs), whereas Laboulbeniomycetes (17 OTUs) was the most abundant fungal class unique to the 18S data. A total of 24 classes were present in both ITS1 and 18S data (Figure 2A).
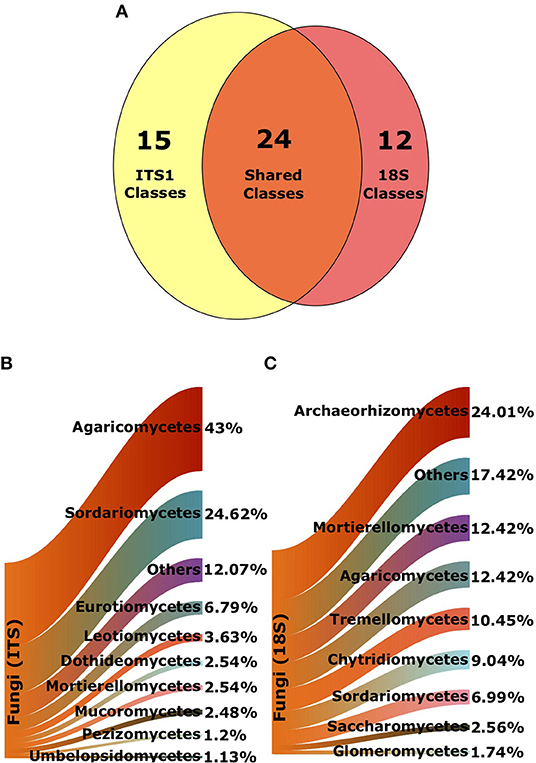
Figure 2. Composition of fungal classes from ITS1 and 18S datasets. (A) Venn diagram denoting total number of shared and unique classes in each data set, following exclusion of unknown sequences. Sankey diagrams of proportional abundances of fungal OTUs from all samples from (B) ITS1 data and (C) 18S data. Arms denote proportions of OTUs of the most populous classes.
As reported in George et al. (2019), Agaricomycetes were the most abundant class of fungi in the ITS1 dataset overall. There were also a large proportion of Sordariomycetes (Figure 2B). Archaeorhizomycetes was the most abundant class in the 18S dataset (Figure 2C). Proportionate abundances of Sordariomycetes and Agaricomycetes followed contrasting trends, with the dominance of the former replaced by the latter in lower productivity AVCs in the ITS1 data, as described previously (Figure 3A). Although Agaricomycetes and Sordariomycetes comprised smaller fractions of the 18S dataset (Figure 2C), this trend was still apparent (Figure 3B). Additionally, the Archaeorhiozmycetes from 18S data generally followed the same trend as the Sordariomycetes (Figure 3B). The preceding trends observed across land uses are also evident across organic matter classes (Figure S1) but are not as clear across soil types (Figure S2).
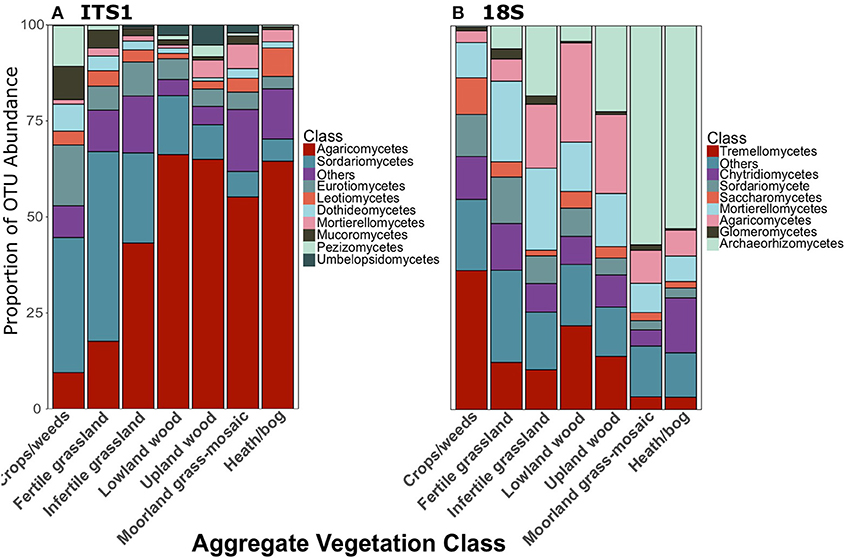
Figure 3. Proportionate abundances of fungal OTUs for (A) ITS1 and (B) 18S data across Aggregate Vegetation Class. Aggregate Vegetation Classes are ordered from most (Crops/weeds) to least (Heath/bog) productive.
When a class was present in both datasets, it was usually much more prevalent in one than the other (Supplementary Table 4). For example, there were 1858 Agaricomycetes and 915 Sordariomycetes OTUs in the ITS1, yet these numbers dropped to 646 and 417 OTUs in the 18S dataset. Similarly, Glomeromycetes accounted for 162 of the OTUs in the 18S data, but only 6 OTUs in the ITS1 dataset. Abundances of classes unique to the ITS1 and 18S datasets can be found in Supplementary Tables 5, 6, respectively.
Fungal Richness and β-Diversity From ITS1 and 18S Data
We found that fungal richness followed the same trends across land use, irrespective of primer set. As previously demonstrated in George et al. (2019), fungal OTU richness from ITS1 metabarcoding significantly declined [F(6, 258) = 39.87, p < 0.001; Figure 4A] from high to low productivity/management intensity. Richness in Fertile grasslands was significantly greater than all other AVCs (p < 0.001) except Crops/weeds. In the 18S dataset, richness was also significantly higher [F(6, 267) = 82.73, p < 0.001] in more productive/managed land uses and declined along this gradient. However, richness in grasslands was highest in this dataset (Figure 4B). For complete pairwise differences between land uses see Supplementary Material.
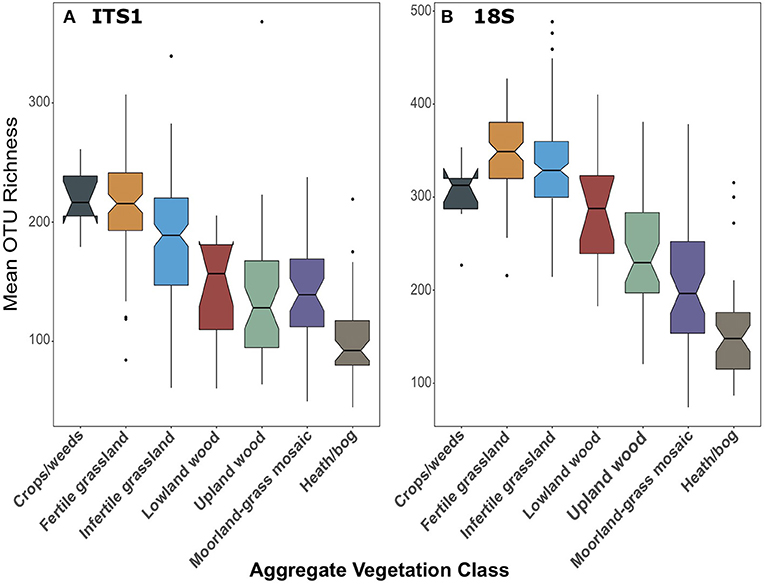
Figure 4. Boxplots of fungal OTU richness for (A) ITS1 and (B) 18S datasets plotted against Aggregate Vegetation Class. Aggregate Vegetation Classes are ordered from most (Crops/weeds) to least (Heath/bog) productive. Boxes cover the first and third quartiles and horizontal lines denote the median. Black dots represent outliers beyond the whiskers, which cover 1.5X the interquartile range. Notches indicate confidence interval around the median. Overlapping notches are a proxy for non-significant differences between medians. Black dots are outliers.
The trend of declining richness with productivity was also apparent when samples were categorised by organic matter content (Figure 5). In both datasets, richness was significantly greater [F(3, 259) = 48.13, p < 0.001; F(3, 269) = 46.71, p < 0.001; for ITS1 and 18S, respectively] in mineral and humus-mineral than all other classifications (ITS1, Figure 5A; 18S, Figure 5B). There was no consistent pattern of richness when soils were categorised by soil type (Figure S3). Again pairwise differences between organic matter classes and soil types are described in the Supplementary Material.
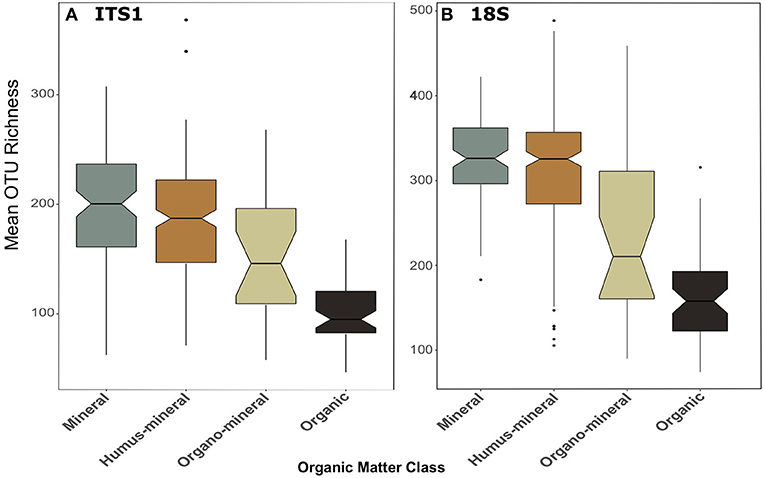
Figure 5. Boxplots of fungal OTU richness for (A) ITS1 and (B) 18S datasets plotted against organic matter class. Organic matter classes are listed in order of increasing percent organic matter. Boxes cover the first and third quartiles and horizontal lines denote the median. Black dots represent outliers beyond the whiskers, which cover 1.5X the interquartile range. Notches indicate confidence interval around the median. Overlapping notches are a proxy for non-significant differences between medians. Black dots are outliers.
Community composition based on non-metric multidimensional scaling of Bray-Curtis distances also showed consistent trends between the datasets. Plots demonstrate tight clustering of Crops/weeds, and grassland AVCs in both ITS1 (Figure 6A) and 18S (Figure 6B) compared to the wide dispersal of other AVCs. Such results are supported by PERMANOVAs, which show significant differences [F(6, 406) = 10.74, p = 0.001; F(6, 415) = 15.65, p = 0.001]; however, analyses of dispersion were also significant [F(6, 406) = 41.30, p = 0.001; F(6, 415) = 10.69, p = 0.001] as a result of the large disparity in replicates between land uses.
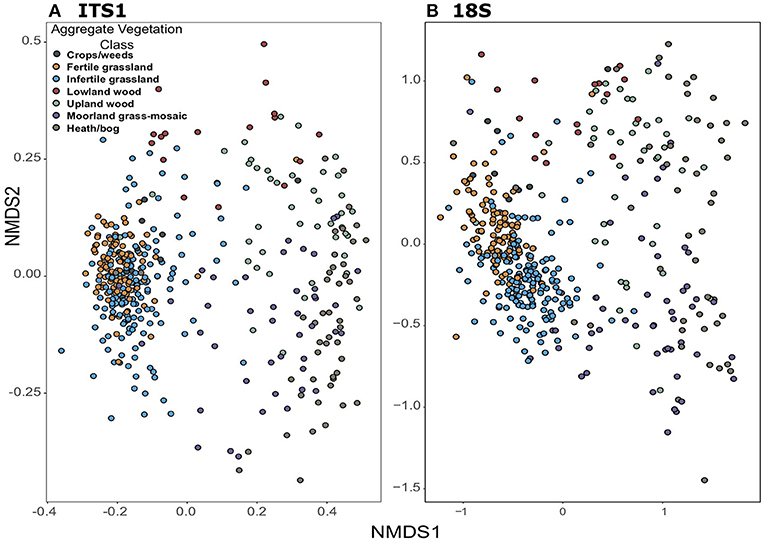
Figure 6. Non-metric dimensional scaling ordinations of fungal community composition across GMEP sites. Samples are coloured by Aggregate Vegetation Class. Data from ITS1 (stress = 0.13) is shown in (A); data from 18S (stress = 0.11) is shown in (B).
When these results are visualised by organic matter classification, the tight clusters are populated by mineral and humus-mineral samples, whereas organo-mineral and organic samples are more common in the widely dispersed areas of the plots (Figures S4, S5). Soil types are more widely dispersed but Brown and Surface-water gley soils are more common in the tightly grouped area (Figures S6, S7). Again, significant results were observed for both PERMANOVA and dispersion of variance across organic matter classes and soil types in both datasets.
Relationships Between Soil Properties and Fungal Biodiversity
Fungal richness showed similar relationships to soil properties in both datasets. Across samples, PLS and VIP analyses highlighted strong correlations between fungal richness and soil properties. There were significant, positive relationships of richness with pH and bulk density; and significant, negative correlations between richness and C:N ratio, organic matter, elevation, and mean annual precipitation (Table 2). Although these results followed the same trend in ITS1 and 18S data, however, their relative rankings varied. For example, fungal richness from ITS1 data was most strongly correlated with bulk density and organic matter, while richness from 18S data was more strongly correlated to C:N ratio and elevation in addition to bulk density (Table 2). Furthermore, there were some relationships unique to each dataset. Significant negative relationships were observed between richness and soil water repellency. Similarly, richness derived from 18S data was negatively related to total C and sand content of soil but also positively related to clay content.
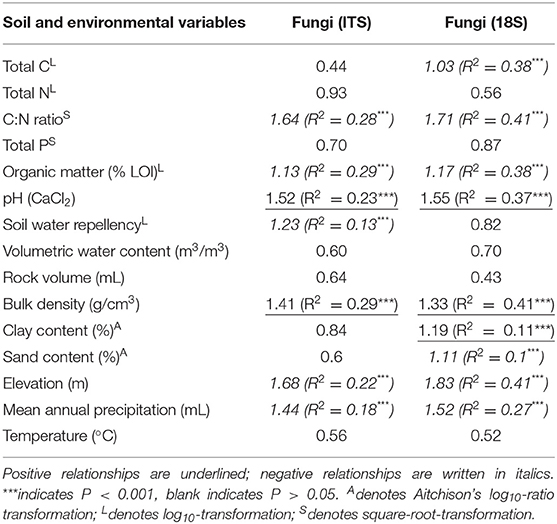
Table 2. Results of partial least squares regressions for fungal richness against environmental variables.
We found pH was the best predictor of β-diversity from linear fitting for fungi no matter what gene region is amplified (Tables 3, 4). All fitted variables were significantly correlated to β-diversity, though most of these only weakly. It is likely that they did not strongly influence the fungal communities. Variables followed similar rankings in both the ITS1 and 18S data. Elevation, annual precipitation, soil moisture, C:N ratio, organic matter, and bulk density all had R2 values greater than 0.35, but their relative order differed between datasets (Tables 3, 4).
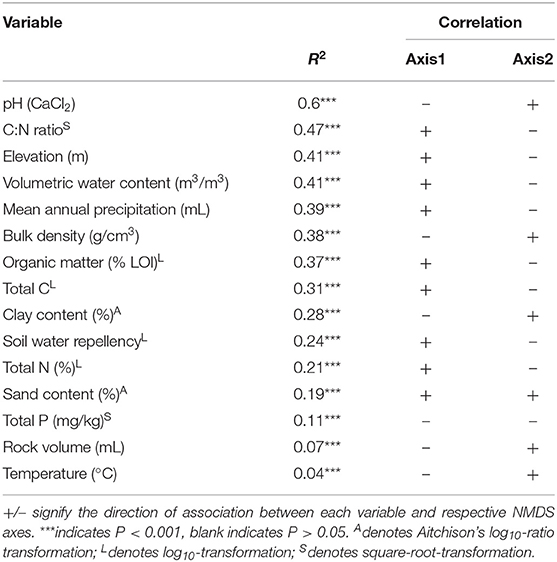
Table 3. Summary of relationships amongst environmental factors and fungal communities based on ITS data.
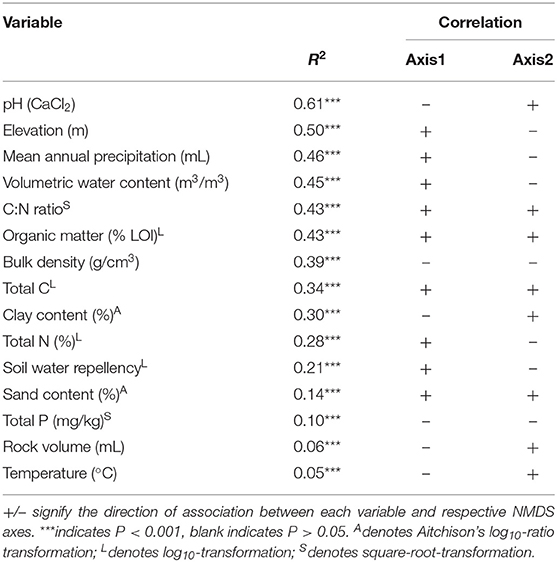
Table 4. Summary of relationships amongst environmental factors and fungal communities based on 18S data.
Effect of Land Use on Functional Diversity
There was a distinct difference in trophic modes of OTUs that were successfully matched to the FUNGUILD database between ITS1 and 18S datasets. In total, 3,402 and 1,783 OTUs from the ITS1 and 18S datasets, respectively were matched to the FUNGUILD database. Overall, saprotrophs were the most abundant trophic mode in both datasets (Figure 6); however, pathotrophs ranked second in ITS1 (Figure 6A) data while the pathotroph-saprotroph-symbiotroph multi-trophic group was second-most abundant in 18S data (Figure 6B). Across land uses, proportions of pathotrophs and pathotroph-saprotroph-symbiotrophs fell with declining productivity (Figure 7). In matches from the ITS1 data, pathotroph-saprotrophs increased across the productivity gradient (Figure 7A), as did saprotrophs in the 18S data (Figure 7B). The aforementioned trend in proportional abundance of pathotrophs and pathotroph-saprotroph-symbiotrophs was also present across organic matter classes (Figure S8). Symbiotrophs appeared to follow an opposite trend, increasing as productivity fell. Interestingly, this was the case for saprotrophs in the 18S (Figure S8B) but not the ITS1 (Figure S8A) dataset. Proportional abundances of fungal OTUs grouped by trophic modes did not follow a discernable pattern across changing soil types (Figure S9). For simplicity, we focused further analyses only on the broadly defined saprotroph, pathotroph, and symbiotroph groups, ignoring all combination groups; pairwise differences for all of the following comparisons are described in the Supplementary Material.
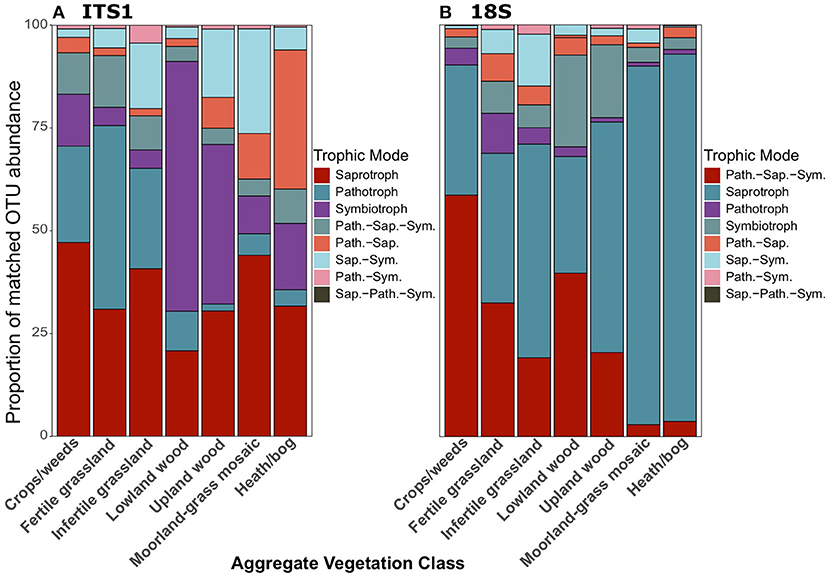
Figure 7. Proportionate abundances of fungal OTUs matched to FUNGuild trophic groups for (A) ITS1 and (B) 18S data across Aggregate Vegetation Classes. Aggregate Vegetation Classes are ordered from most (Crops/weeds) to least (Heath/bog) productive. Abbreviations for multi-trophic mode groups are as follows: Path.-Sap. (Pathotroph-Saprotroph); Path.-Sap.-Sym. (Pathotroph-Saprotroph-Symbiotroph); Path.-Sym. (Pathotroph-Symbiotroph); Sap.-Path.-Sym (Saprotroph-Pathotroph-Symbiotroph); Sap.-Sym. (Saprotroph-Symbiotroph).
Across land uses, significant differences were observed in the richness of saprotrophic fungi in both the ITS1 [F(6, 258) = 25.14, p < 0.001] and 18S [F(6, 267) = 31.10, p < 0.001] data; however, there were differences between datasets (Figure 8). In the ITS1 dataset, richness followed the same trend as overall fungal richness, with the highest and lowest values in the Crops/weeds and Heath/bog AVCs respectively (Figure 8A). Although this pattern was preserved in the 18S data (Figure 8B), richness of saprotrophs was much more even across AVCs in this case. Indeed, rather than the linear decline of richness along the productivity gradient, there appeared to be 3 distinct levels in the data affiliated with (i) grassland/agricultural sites, (ii) woodlands, and (iii) bogs.
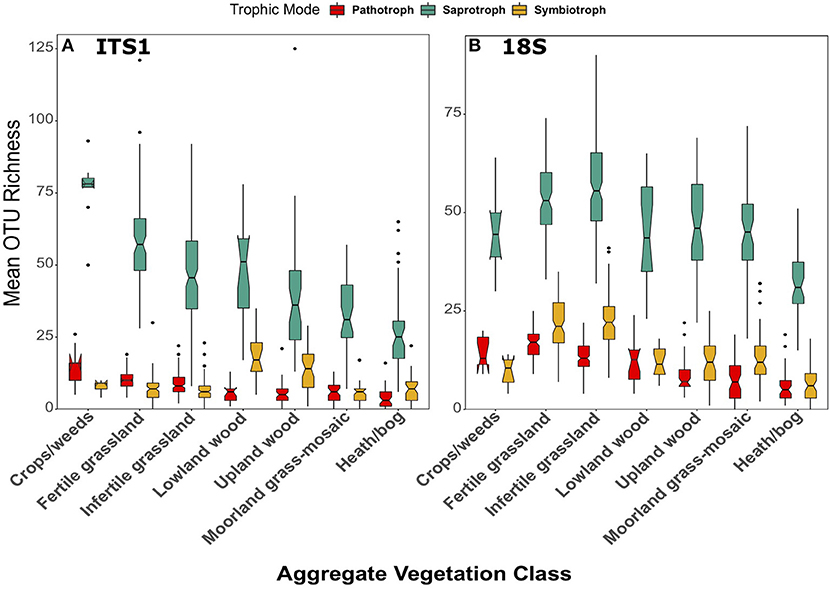
Figure 8. Boxplots of richness of fungal OTUs matched to the pathotrophic, saprotroph, and symbiotroph trophic modes in FUNGuild for (A) ITS1 and (B) 18S datasets plotted against Aggregate Vegetation Class. Aggregate Vegetation Classes are ordered from most (Crops/weeds) to least (Heath/bog) productive. Boxes cover the first and third quartiles and horizontal lines denote the median. Black dots represent outliers beyond the whiskers, which cover 1.5X the interquartile range. Notches indicate confidence interval around the median. Overlapping notches are a proxy for non-significant differences between medians. Black dots are outliers.
The same pattern was also apparent across organic matter classifications in both datasets [ITS1: F(3, 260) = 32.86, p < 0.001; 18S: F(3, 269) = 41.13, p < 0.001; Figure 9]. In the ITS1 dataset, each class was significantly different from the others (Figure 9A). In the 18S data, saprotroph richness was significantly higher in mineral and humus-mineral soils than organo-mineral and organic soils (all p < 0.001 except mineral—organo-mineral p = 0.02) (Figure 9B). Again, the overarching trend of fungal richness was not apparent when samples were grouped by soil type. Although there were significant differences across soil types in both the ITS1 [F(5, 259) = 9.7, p < 0.001] and 18S [F(5, 268) = 10.73, p < 0.001] datasets, these differences did demonstrate consistent patterns across soil types (Figure S10).
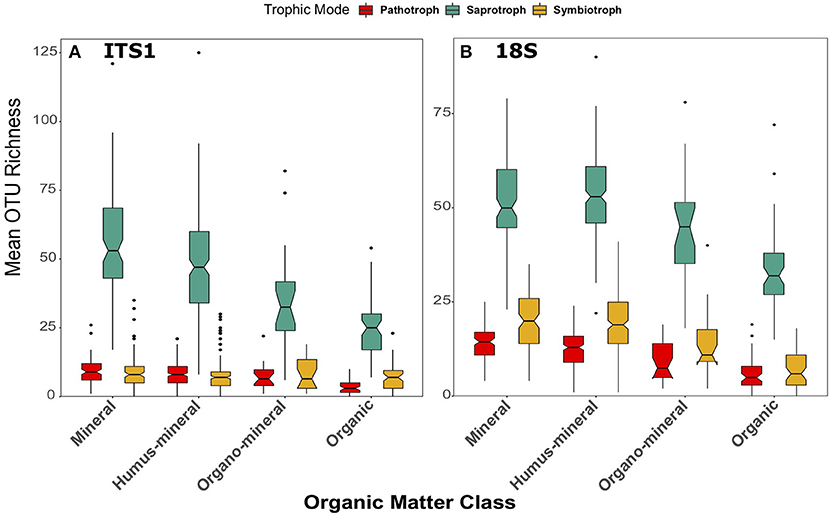
Figure 9. Boxplots of richness of fungal OTUs matched to the pathotrophic, saprotroph, and symbiotroph trophic modes in FUNGuild for (A) ITS1 and (B) 18S datasets plotted against organic matter class. Organic matter classes are listed in order of increasing percent organic matter. Boxes cover the first and third quartiles and horizontal lines denote the median. Black dots represent outliers beyond the whiskers, which cover 1.5X the interquartile range. Notches indicate confidence interval around the median. Overlapping notches are a proxy for non-significant differences between medians. Black dots are outliers.
In the case of pathotrophic fungi, richness also followed a similar trend to the saprotrophs across both datasets. In the ITS1 data, significantly [F(6, 258) = 26.11, p < 0.001] greater richness values were observed in Crops/weeds and grassland samples (Figure 8A). Richness of pathotrophs was significantly highest in Crops/weeds sites. Again, this trend was present, though not as clear, in the 18S dataset (Figure 8B). Significant differences [F(6, 267) = 52.26, p < 0.001] were observed between AVCs, with the highest richness of pathotrophs occurring in the Fertile grassland and Crop/weeds land uses.
Across organic matter classes, significant differences were also observed in pathotroph richness in the ITS1 [F(3, 250) = 24.91, p < 0.001] and 18S [F(3, 269) = 30.49, p < 0.001] datasets. However, in this case the trends were more apparent in the 18S data than the ITS1 data (Figure 9). Pathotroph richness was highest in mineral soils and lowest in organic soils when compared to all other classes in the ITS1 data (Figure 9A). However, all organic matter classifications were statistically different from each other in the 18S data (Figure 9B), in descending order from mineral to peat soils. Again, trends were less clear across soil types (Figure S10). Significant differences were observed in the ITS1 data [F(5, 259) = 6.93, p < 0.001] with the lowest pathotroph richness found in peat soils (Figure S10A). In the 18S data, differences between pathotrophic fungi across soil types were more similar to those observed in other groups (Figure S10B). Pathotroph richness was significantly [F(5, 268) = 13.6, p < 0.001] different across soil types with the highest values found in brown soils and the lowest in peats.
The previously described trend of declining richness across the land use productivity gradient (i.e., Figure 4) was not apparent when considering symbiotrophs. Furthermore, although significant differences were apparent in both the ITS1 [F(6, 258) = 14.88, p < 0.001] and 18S [F(6, 267) = 55.13, p < 0.001] datasets they were by no means identical (Figure 8). Symbiotroph richness was highest in Lowland wood sites followed by Upland wood. This trend was not apparent in the 18S dataset, however (Figure 8B). Here richness of symbiotrophs was greatest in grassland AVCs and lowest in Heath/bog sites much like the overarching trend of total fungal OTU richness.
When samples were grouped by organic matter class, further discrepancies became apparent between the datasets. Whereas, the previously described trend of decreasing richness with increasing organic matter content held true in the 18S data [F(3, 269) = 36.28, p < 0.001; Figure 9B], no significant differences were observed in the ITS1 dataset [F(3, 260) = 1.88, p = 0.13; Figure 9A]. In the 18S data, richness of symbiotrophs was greater in mineral and humus-mineral soils when compared to organo-mineral (p = 0.002, p = 0.04, respectively) and organic (p < 0.001) soils (Figure 9B). There were also no significant differences [F(5, 259) = 1.43, p = 0.21] in symbiotroph richness across soil types in ITS1 data (Figure S10A), though there were in 18S data [F(5, 259) = 12.52, p < 0.001; Figure S10B]. As described previously, richness was lowest in peat soils and highest in brown soils.
We suspected that the differences in functional diversity observed between datasets might be a result of differential coverage of important groups. We were able to confirm this when we analysed the richness of OTUs identified as Glomeromycetes present in the 18S dataset (Figure 10). All of the 162 Glomeromycetes OTUs were assigned as highly-probable symbiotrophs through FUNGUILD. Across land uses, richness of Glomeromycetes followed similar trends to those of symbiotrophs and saprotrophs from 18S data. There were significant [F(6, 244) = 33.47, p < 0.001] differences across land uses, though they appeared, like the saprotroph richness to be tiered between grasslands, woods, and bogs (Figure 10A). Richness of Glomeromycetes was higher in grasslands than all other AVCs except Crops/weeds and lowest in Heath/bog sites. Again, when grouped by organic matter class (Figure 10B) and soil type (Figure 10C), Glomeromycetes richness followed the same trend as saprotrophs and symbiotrophs from the 18S dataset. Richness was significantly [F(3, 246) = 37.65, p < 0.001] greater in mineral and humus-mineral soils than all others. Across soil types, richness of Glomeromycetes was significantly [F(5, 245) = 8.65, p < 0.001] lower in peat soils when compared to most other soil types.
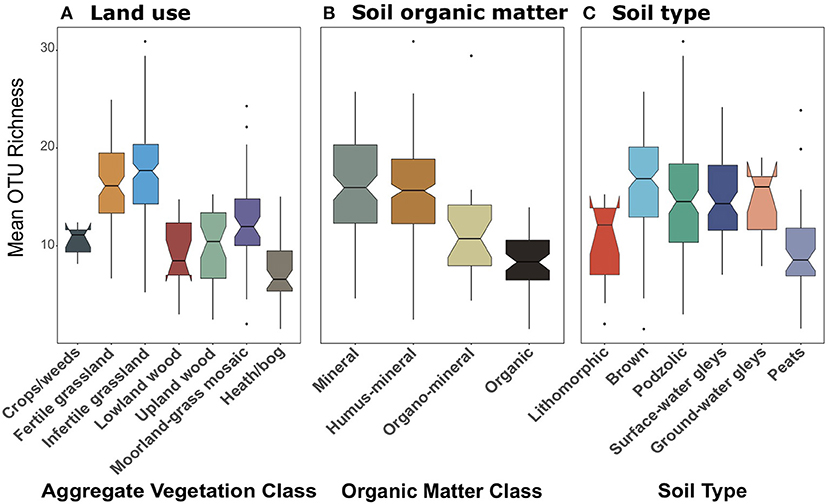
Figure 10. Boxplots of richness of Glomeromycetes OTUs plotted against (A) Aggregate Vegetation Class; (B) organic matter class; (C) soil type. Aggregate Vegetation Classes are ordered from most (Crops/weeds) to least (Heath/bog) productive. Organic matter classes are listed in order of increasing percent organic matter. Soils are listed in increasing order of moisture retention. Boxes cover the first and third quartiles and horizontal lines denote the median. Black dots represent outliers beyond the whiskers, which cover 1.5X the interquartile range. Notches indicate confidence interval around the median. Overlapping notches are a proxy for non-significant differences between medians. Black dots are outliers.
Relationships Between Soil Properties and Fungal Functional Diversity
Across all samples, PLS and VIP analyses highlighted strong correlations between fungal richness and soil properties by trophic groups. Richness of pathotrophs showed similar relationships to soil properties in both datasets. There were significant, positive relationships of richness with pH and bulk density; and significant negative correlations between richness and total C, C:N ratio, organic matter, elevation, and mean annual precipitation (Table 5). As with the total fungal data, the relative rankings of the strength of relationships between pathotroph and each property varied between datasets. Organic matter was most strongly correlated with pathotroph richness from ITS1 data whereas pH was most strongly correlated with pathotroph richness in the 18S data (Table 5). Also soil moisture content was also negatively correlated with pathotroph richness in the ITS1 dataset only.
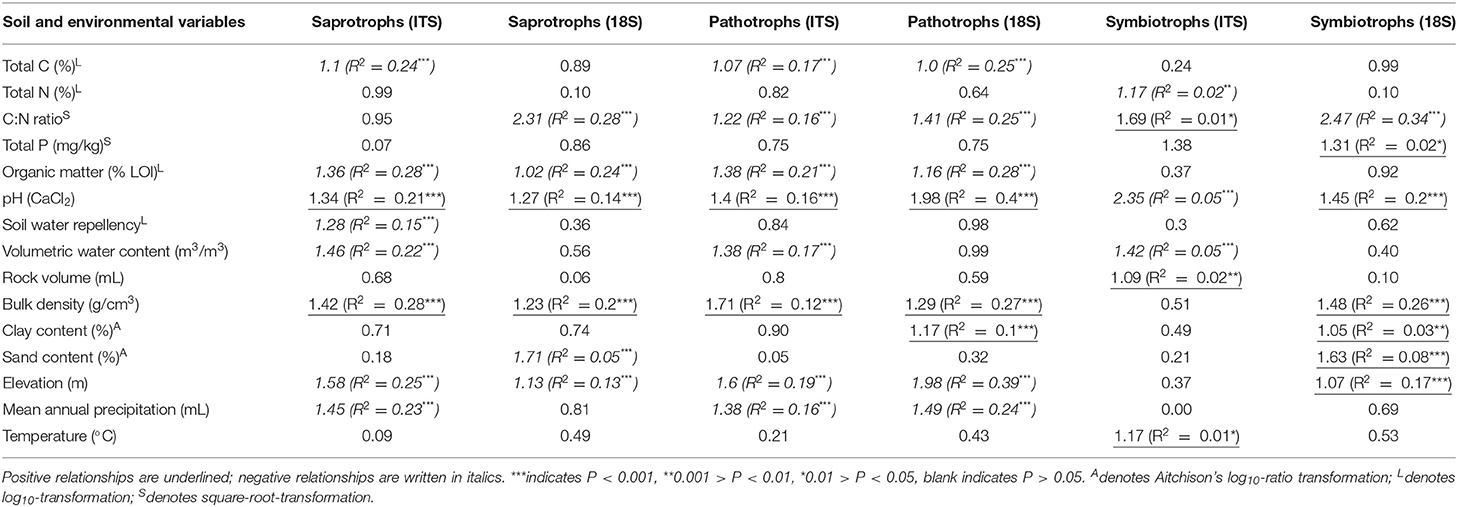
Table 5. Results of partial least squares regressions for richness of OTUs classified by trophic mode from FUNGUILD analyses against environmental variables.
Organic matter, elevation (both negative), pH, and bulk density (both positive) all showed significant relationships with saprotroph richness in both datasets (Table 5). The correlations between richness of saprotrophs and both bulk density and pH were the strongest observed in the ITS1 data. There were also negative correlations between saprotroph richness and total C, mean annual precipitation, soil moisture, soil water repellency, and mite abundance in the ITS1 data. However, it again should be noted that the correlation with mites was extremely weak. C:N ratio was strongly and positively correlated with saprotroph richness in the 18S data. Similarly, richness from 18S data was negatively related to total C and sand content of soil but also positively related to clay content. In addition, there was a significant, positive, but weak correlation between sand content and saprotroph richness.
In both datasets, symbiotroph richness was significantly correlated with pH and C:N ratio (Table 5). Interestingly, the relationships were positive in the case of C:N ratio and negative for pH in ITS1 data but the opposite was apparent in the 18S data. There were also many more relationships unique to each dataset. Weak but significant positive relationships were observed between symbiotroph richness and rock volume, Collembola abundance, and temperature as well as a negative correlation to soil moisture. In the 18S data, stronger relationships were observed between symbiotroph richness and bulk density (positive) and elevation (negative). Furthermore, a weakly negative correlation was observed with sand content in addition to weak positive correlations with clay content and total P.
Discussion
Primer Choice and the Total Fungal Community
We observed congruent patterns in total fungal OTU richness across land uses, organic matter classes and soil type when measured with either ITS1 or 18S primer sets. Richness was greater in arable and grassland land uses, which are highly productive, intensively managed and declined in the less productive, largely unmanaged bogs. Although these findings had been previously known from the ITS1 dataset (George et al., 2019), it is important to note that the trend was also present in the fungal OTUs identified from 18S sequencing. A similar trend was observed across organic matter classes. Here, fungal richness fell as organic matter increased. Fungal α-diversity is known to be greater in arable soils than in grasslands or forests (Szoboszlay et al., 2017). Potential mechanisms for this include: (i) increased nutrient availability due to fertiliser input (Szoboszlay et al., 2017), and (ii) beneficial disturbance from tillage and other standard agricultural practices. The latter is consistent with the intermediate disturbance hypothesis whereby high levels of diversity are maintained by consistent interruption of successional processes (Connell, 1978).
Soils rich in organic matter, especially peats, found in upland moors, bogs, and other wetlands across harbour distinct fungal communities from neighbouring habitats (Anderson et al., 2003). Fungi dominate microbial communities in bogs (Thormann and Rice, 2007) although their proportional abundance drops sharply below the first 5 cm of bog habitats (Potter et al., 2017). Yet, richness in bogs is consistently low, perhaps due to environmental pressures such as high acidity, highly recalcitrant SOM, low nutrients, and oxygen levels (Rousk et al., 2010; Tedersoo et al., 2014) or reduced competition within the fungal community.
In comparison to AVC and SOM levels, differences in fungal communities were not as clear across soil types as defined by the National Soil Map (Avery, 1980), which is inline with previous work on microbial activity across the UK (Jones et al., 2014). Richness was highest in brown soils and was lowest in peats. Brown soils commonly support grassland communities across Wales (Avery, 1980; Rudeforth et al., 1984). Nearly half of the Fertile and Infertile grasslands surveyed in GMEP were categorised as brown soils. The absence of other major trends besides these may be due to the use of the dominant soil type and lack of resolution for the soil classification. The soils map used in this study simply does not provide enough resolution (1:63, 360; Avery, 1980) for soil type to be an effective category. Furthermore, this system heavily uses subsoil properties to determine soil type (Avery, 1980), while our work only involved the upper 15 cm. However, it is our opinion that the use of organic matter classification is more effective and simple metric that can be easily implemented in large-scale studies in lieu of fine-scale maps.
Results of PLS analyses demonstrates that soil properties and associated environmental factors influencing fungal richness are consistent across ITS1 and 18S datasets. Major drivers included pH, bulk density, C:N ratio, organic matter, elevation, and mean annual temperature (Table 2). Such results from 18S data are consistent with previous findings from the ITS1 data (George et al., 2019). However, there were certain properties that were significant in only one of the datasets and the relative importance of these properties does vary between the two datasets. There are several possible explanations for this. Firstly, 9 more samples were used in the 18S dataset (n = 422) than the ITS1 data (n = 413), which may have introduced the discrepancy in relative importance of the data. However, it is much more likely that a differential coverage of fungal groups between the two datasets caused these discrepancies.
Community composition showed consistent clustering across land uses, organic matter classes, and soil types in both data sets. As in George et al. (2019), communities were most similar in the grassland and arable sites and more spread out across woodlands and upland habitats. This was likely driven by environmental factors across Wales. In both datasets, pH was the most important environmental variable influencing community composition and although the remaining properties followed similar patterns, their relative importance again differed in the dataset. The importance of pH, elevation, C:N ratio, and precipitation in determining fungal community composition fits well in the wider context of soil fungi biogeography. Tedersoo et al. (2014) previously highlighted the importance of these variables in the distribution of fungi at the global scale. Furthermore, the strong positive correlation with C:N ratio is indicative of the expected fungal dominance (de Vries et al., 2006) of nutrient-poor, acidic soils (Bloem et al., 1997).
Primer Choice and Fungal Functional Diversity
Differences between richness of trophic modes of fungi, used here as a proxy for functional diversity, showed some discrepancies across land uses and soil classification between data sets. Saprotrophs made up the largest proportion of the 3 functional groups studied and generally exhibited the same trends as total richness across soils and land uses. This was also the case for pathotrophs. Indeed, correlations between environmental variables with pathotroph and saprotroph richness were largely consistent across datasets. However, we observed divergent trends in symbiotroph richness across land uses and soils. Symbiotroph richness was highest in woodlands in the ITS1 dataset whereas it was highest in grasslands according to the 18S data (Figures 7A,B). A similar increase in richness within grasslands in the 18S data is repeated when Glomeromycetes were considered on their own (Figure 9); AMF are the predominant mycorrhizal fungi in grassland systems (Smith and Read, 2008). The symbiotroph peak in the ITS1 data may be explained by an increase in coverage of ectomycorrhizas which are the most common group to associate with trees and shrubs (Smith and Read, 2008). Despite these differences, both datasets suggest that symbiotroph richness was low in arable land, which is in line with previous findings demonstrating high susceptibility of mycorrhizal fungi to disturbance, for example tillage (Schnoor et al., 2011; Säle et al., 2015), and the addition of fertilizers, which decreases the receptiveness of many agricultural plants to mycorrhizal infection (Smith and Read, 2008).
The divergent trend in symbiotroph richness and discrepancies in relationships between functional groups and environmental variables likely stem from primer biases. Primer biases have been well-recognised as a confounding factor in categorising communities from environmental DNA (Cai et al., 2013; Elbrecht and Leese, 2015; Tedersoo et al., 2015). Tedersoo et al. (2015) assessed the effectiveness of fungal barcodes from the ITS, 18S, and 28S rDNA regions and found that primer choice did not affect richness or β-diversity results of soil fungi communities from Papua New Guinea, although fewer OTUs were recovered by 18S primers than ITS primers. In silico analyses suggests such findings are the result of lumping of sequences in the 18S that may predominantly affect rare sequences, thereby strengthening community matrices. Similarly, results were similar enough for all primers to be suitable for analyses at the class-level (Tedersoo et al., 2015). Although the 18S primers used here were designed to cover the breadth of eukaryotes and may lack specificity to fungi (Behnke et al., 2011), our results show strong congruence to the ITS1 data across total richness and indeed most functional groups.
Unlike Tedersoo et al. (2015) we observed considerable differences in the proportions of fungal classes between the ITS1 and 18S data sets. We suspect that such differences stem from the need to use appropriate databases to assign taxonomy to OTUs to each dataset (Xue et al., 2019). Perhaps only 30–35% of Glomeromycetes are present in 18S and ITS databases, respectively (Hart et al., 2015), and although sequences are continuously being uploaded to such repositories, it is likely the majority of AMF are not identifiable from environmental samples (but see Öpik et al., 2014). Similarly we suspect that, although not studied in detail, primer choice may lead to biases in other groups. Archaeorhizomycetes accounted for nearly 25% of the 18S sequences but less than 1% from the ITS1 data (Figure 2B). Primer bias has been recognised for Archaeorhizomycetes even before the class' formal description; ~19% of 18S sequences collected from Anderson et al. (2003), have been matched to Archaeorhizomycetes, whereas none were recovered from the same samples using ITS primers. Despite its recent description, Archaeorhizomycetes are ubiquitous components of soil communities. Strong associations have been observed with trees, yet precise functional roles of these fungi have yet to be determined (Rosling et al., 2011). Subsequently, such biases likely account for divergent relationships between functional group richness and environmental properties.
Conclusions
Our comparison of the use of ITS1 and 18S primers and their respective databases in a nationwide metabarcoding survey of fungi yielded 3 major findings. First, the congruent findings of total richness and β-diversity across land use and their relationships to environmental variables confirmed our previous research (George et al., 2019). Second, soil organic matter was found to be a more sensitive metric than soil type in our survey design. Third, biases from the combination of primer and database choice became apparent for certain classes of fungi, including Glomeromycetes and Archaeorhizomycetes, which strongly influenced functional group richness across land uses as well as their relationships with environmental variables. It is therefore important to recognise the sensitivity of metabarcoding to primer choice, even when using universal primers. Without simultaneous analyses of environmental DNA using both primers and databases, the presence of AM fungi as well as the newly characterised Archaeorhizomycetes would have been overlooked and unquantified in this survey. Furthermore, since the majority of soil biodiversity is undescribed (Ramirez et al., 2015), utilising multiple primers will elucidate a more complete picture of belowground biodiversity by revealing shortcomings in existing probes and revealing the presence of as yet undescribed organisms. We therefore advocate that future nation-wide surveys included both a sample-based metric of soil type (i.e., organic matter classification) and multiple primers for fungal biodiversity. Such measures should not be arduous to implement, especially if researchers can identify specific fungal groups of particular interest to accommodate.
Data Availability Statement
Data associated with this paper will be publically published in the National Environment Research Council (NERC) Environmental Information Data Centre (EIDC). Currently, pH, bulk density, C, N, P, moisture, and water repellency data are available (Robinson et al., 2019). Data are also available from the authors upon reasonable request with permission from the Welsh Government. Sequences with limited sample metadata have been uploaded to the European Nucleotide Archive and can be accessed with the following primary accession codes: PRJEB28028 (ITS1) and PRJEB28067 (18S).
Author Contributions
PG, DJ, DR, and SC conceived this project. BE and DR facilitated the use of GMEP data. Bioinformatics and statistical analyses were led by PG with assistance from SC and RG. PG wrote the first draft of the manuscript. SC, DR, and DJ contributed to subsequent revisions. All authors read and approved the final draft of the manuscript.
Funding
This project was supported as part of the Welsh Government funded Glastir Monitoring & Evaluation Programme (Contract reference: C147/2010/11) and by the UK Natural Environment Research Council (NERC) through the RC/Centre for Ecology & Hydrology (CEH Project: NEC04782). PG was supported by a Soils Training and Research Studentship (STARS) grant from the Biotechnology and Biological Sciences Research Council and NERC [Grant number: NE/M009106/1]. STARS is a consortium consisting of Bangor University, British Geological Survey, Centre for Ecology and Hydrology, Cranfield University, James Hutton Institute, Lancaster University, Rothamsted Research and the University of Nottingham.
Conflict of Interest
The authors declare that the research was conducted in the absence of any commercial or financial relationships that could be construed as a potential conflict of interest.
Acknowledgments
We thank the GMEP Team for their contribution in collecting the data and the laboratory staff of Environment Centre Wales, especially Delphine Lallias, for sample processing and DNA extraction. Thanks also to Fiona M. Seaton for assistance with statistical analyses. We thank Supercomputing Wales for support and training on their system for bioinformatics analyses. We thank John G. Kenny and Richard M. Eccles for generating sequence data at the Centre for Genomic Research, University of Liverpool.
Supplementary Material
The Supplementary Material for this article can be found online at: https://www.frontiersin.org/articles/10.3389/fenvs.2019.00173/full#supplementary-material
References
Altschul, S. F., Gish, W., Miller, W., Myers, E. W., and Lipman, D. J. (1990). Basic local alignment search tool. J. Mol. Biol. 215, 403–410. doi: 10.1016/S0022-2836(05)80360-2
Anderson, I. C., Campbell, C. D., and Prosser, J. I. (2003). Diversity of fungi in organic soils under a moorland – Scots pine (Pinus sylvestris L). Environ. Microbiol. 5, 1121–1132. doi: 10.1046/j.1462-2920.2003.005522.x
Avery, W. (1980). Soil Classifications for England and Wales (Higher Categories). Soil Survey Technical Monograph No 14. Harpenden.
Behnke, A., Engel, M., Christen, R., Nebel, M., Klein, R. R., and Stoeck, T. (2011). Depicting more accurate pictures of protistan community complexity using pyrosequencing of hypervariable SSU rRNA gene regions. Environ. Microbiol. 13, 340–349. doi: 10.1111/j.1462-2920.2010.02332.x
Berruti, A., Desirò, A., Visentin, S., Zecca, O., and Bonfante, P. (2017). ITS fungal barcoding primers versus 18S AMF-specific primers reveal similar AMF-based diversity patterns in roots and soils of three mountain vineyards. Environ. Microbiol. Rep. 9, 658–667. doi: 10.1111/1758-2229.12574.
Bloem, J., de Ruiter, P. C., and Bouwman, L. A. (1997). “Soil food webs and nutrient cycling in agroecosystems,” in Modern Soil Microbiology, eds J. D. van Elsas, J. K. Jansson, and J. T. Trevors (Boca Raton, FL: CRC Press, 245–278.
Bunce, R. G. H., Carr, C. J., Gillespie, M. K., Howard, D. C., Scott, W. A., Smart, S. M., et al. (1999). Vegetation of the British Countryside – The Countryside Vegetation System. Department of the Environment, Transport and the Regions, London.
Cai, L., Ye, L., Tong, A. H., Lok, S., and Zhang, T. (2013). Biased diversity metrics revealed by bacterial 16S phylotags derived from different primer sets. PLoS ONE 8:e53649. doi: 10.1371/journal.pone.0053649
Caporaso, J. G., Kuczynski, J., Stombaugh, J., Bittinger, K., Bushman, F. D., Costello, E. K., et al. (2010). QIIME allows analysis of high-throughput community sequencing data. Nat. Methods 7, 335–336. doi: 10.1038/nmeth.f.303
Cavender-Bares, J., Kozak, K., Fine, P. V. A., and Kembel, S. W. (2009). The merging of community ecology and phylogenetic biology. Ecol. Lett. 12, 693–715. doi: 10.1111/j.1461-02548.2009.01314.x
Chong, I.-G., and Jun, C.-H. (2005). Performance of some variable selection methods when multicollinearity is present. Chemometr. Intell. Lab. Syst. 78, 103–112. doi: 10.1016/j.chemolab.2004.12.011
Connell, J. H. (1978). Diversity in tropical rain forests and coral reefs. Science 199, 1302–1310. doi: 10.1126/science.199.4335.1302
de Vries, F. T., Hoffland, E., van Eekeren, N., Brussard, L., and Bloem, J. (2006). Fungal/bacterial ratios in grasslands with contrasting nitrogen management. Soil Biol. Biochem. 38, 2092–2103. doi: 10.1016/j.soilbio.2006.01.008
Deshpande, V., Wang, Q., Greenfield, P., Charleston, M., Porras-Alfaro, A., Kuske, C. R., et al. (2016). Fungal identification using a Bayesian classifier and the Warcup training set of internal transcribed spacer sequences. Mycologia 108, 1–5. doi: 10.3852/14-293.
Edgar, R. C. (2010). Search and clustering orders of magnitude faster than BLAST. Bioinformatics 10, 2460–2461. doi: 10.1093/bioinformatics/btq461
Elbrecht, V., and Leese, F. (2015). Can DNA-based ecosystem assessments quantify species abundance? Testing primer bias and biomass-sequence relationships with an innovative metabarcoding protocol. PLoS ONE 10:e0130324. doi: 10.1371/journal.pone.0130324
Emmett, B. A., Reynolds, B., Chamberlain, P. M., Rowe, E., Spurgeon, D., Brittain, S. A., et al. (2010). Countryside Survey: Soils Report from 2007. NERC/Centre for Ecology and Hydrology (CS Technical Report No. 9/07, CEH Project Number: C03259).
Emmett, B. A., and the GMEP Team (2017). Glastir Monitoring & Evaluation Programme. Final Report to Welsh Government (Contract reference: C147/2010/11. NERC/Centre for Ecology & Hydrology (CEH Project: NEC04780/NEC05371/NEC05782).
Epp, L. S., Boessenkool, S., Bellemain, E. P., Haile, J., Esposito, A., Riaz, T., et al. (2012). New environmental metabarcodes for analysing soil DNA: potential for studying past and present ecosystems. Mol. Ecol. 8, 1821–1833. doi: 10.1111/j.1365-294X.2012.05537.x
Fisher, M. C., Henk, D. A., Briggs, C. J., Brownstein, J. S., Madoff, L. C., McCraw, S. L., et al. (2012). Emerging fungal threats to animal, plant and ecosystem health. Nature 484, 186–194. doi: 10.1038/nature10947
George, P. B. L., Lallias, D., Creer, S., Seaton, F. M., Kenny, J. G., Eccles, R. M., et al. (2019). Divergent national-scale trends of microbial and animal biodiversity revealed across diverse temperate soil ecosystems. Nat. Commun. 10:1107. doi: 10.1038/s41467-019-09031-1
Hart, M. M., Aleklett, K., Chagnon, P.-L., Egan, C., Ghignone, S., Helgasson, T., et al. (2015). Navigating the labyrinth: a guide to sequence-based, community ecology of arbuscular mycorrhizal fungi. New Phytol. 207, 235–247. doi: 10.1111/nph.13340
Hothorn, T., Bretz, F., and Westfall, P. (2008). Simultaneous inference in general Parametric Models. Biometr. J. 50, 346–363. doi: 10.1002/bimj.200810425
Jones, D. L., Simfukwe, P., Hill, P. W., Mills, R. T., and Emmett, B. A. (2014). Evaluation of dissolved organic carbon as a soil quality indicator in national monitoring schemes. PLoS ONE 9:e90882. doi: 10.1371/journal.pone.0090882
Kõljalg, U., Nilsson, R. H., Abarenkov, K., Tedersoo, L., Taylor, A. F., Bahram, M., et al. (2013). Towards a unified paradigm for sequence-based identification of fungi. Mol. Ecol. 22, 5271–5277. doi: 10.1111/mec.12481
Lallias, D., Hiddink, J. G., Fonseca, V. G., Gaspar, J. M., Sung, W., Neill, S. P., et al. (2015). Environmental metabarcoding reveals heterogeneous drivers of microbial eukaryote diversity in contrasting estuarine ecosystems. ISME J. 9, 1208–1221. doi: 10.1038/ismej.2014.213
Martin, M. (2011). Cutadapt removes adapter sequences from high-throughput sequencing reads. EMBnet 17, 10–12. doi: 10.14806/ej.17.1.200
McMurdie, P. J., and Holmes, S. (2013). phyloseq: an R package for reproducible interactive analysis and graphics of microbiome census data. PLoS ONE 8:e61217. doi: 10.1371/journal.pone.0061217
Mevik, B.-H., Wehrens, R., Liland, K. H., and Hiemstra, P. (2016). pls: Partial Least Squares and Principal Component Regression. R package version 2.6-0. Available online at: https://CRAN.R-project.org/package=pls
Nguyen, N. H., Song, Z., Bates, S. T., Branco, S., Tedersoo, L., Menke, J., et al. (2016). FUNGuild: an open annotation tool for parsing fungal community datasets by ecological guild. Fungal Ecol. 20, 241–248. doi: 10.1016/j.funeco.2015.06.006
Oksanen, J., Blanchet, F. G., Friendly, M., Kindt, R., Legendre, P., McGlinn, D., et al. (2016). Vegan: Community Ecology Package. R package version 2.4-0. Available online at: https://CRAN.R-project.org/package=vegan.
Öpik, M., Davison, J., Moora, M., and Zobel, M. (2014). DNA-based detection and identification of Glomeromycota: the virtual taxonomy of environmental sequences1. Botany 92, 135–147. doi: 10.1139/cjb-2013-0110
Peay, K. G., Kennedy, G., and Bruns, T. D. (2008). Fungal community ecology: a hybrid beast with a molecular master. Bioscience 58, 799–810. doi: 10.1641/B580907
Pinheiro, J., Bates, D., DebRoy, S., Sarkar, D., EISPAK authors, Heisterkamp, S., et al. (2016). nlme: Lineral and Nonlinear Mixed Effects Models. R package version 3.1e138. Available online at: https://CRAN.R-project.org/package=nlme
Potter, C., Freeman, C., Golyshin, P. N., Ackermann, G., Fenner, N., McDonald, J. E., et al. (2017). Subtle shifts in microbial communities occur alongside the release of carbon induced by drought and rewetting in contrasting peatland ecosystems. Sci. Rep. 7:11314. doi: 10.1038/s41598-017-11546
Quast, C., Pruesse, E., Yilmaz, P., Gerken, J., Schweer, T., Yarza, P., et al. (2013). The SILVA ribosomal RNA gene database project: improved data processing and web-based tools. Nucl. Acids Res. 41, D590–D596. doi: 10.1093/nar/gks1219
R Core Team (2017). R: A Language and Environment for Statistical Computing. Vienna: R Foundation for Statistical Computing. Available online at: https://www.R-project.org/.
Ramirez, K. S., Leff, J. W., Barberán, A., Bates, S. T., Betley, J., Crowther, T. W., et al. (2015). Biogeographic patterns in below-ground diversity in New York City's Central Park are similar to those observed globally. Proc. R. Soc. B. 281:20141988. doi: 10.1098/rspb.2014.1988
Robinson, D. A., Astbury, S., Barrett, G., Burden, A., Carter, H., Emmett, B. A., et al. (2019). Topsoil Physico-Chemical Properties From the Glastir Monitoring and Evaluation Programme, Wales 2013-2016. NERC Environmental Information Data Centre. doi: 10.5285/0fa51dc6-1537-4ad6-9d06-e476c137ed09
Robinson, E. L., Blyth, E., Clark, D. B., Comyn-Platt, E., Finch, J., and Rudd, A. C. (2017). Climate Hydrology and Ecology Research Support System Meteorology Dataset for Great Britain (1961-2015) [CHESS-met] v1.2. NERC Environmental Information Data Centre.
Rognes, T., Flouri, T., Nichols, B., Quince, C., and Mahé, F. (2016). VSEARCH: a versatile open source tool for metagenomics. PeerJ 4:e2584. doi: 10.7717/peerj.2584
Rosling, A., Cox, F., Cruz-Martinez, K., Ihrmark, K., Grelet, G.-A., Lindahl, B. D., et al. (2011). Archaeorhizomycetes: unearthing an ancient class of ubiquitous soil fungi. Science 333, 876–879. doi: 10.1126/science.1206958
Rousk, J., Bååth, E., Brookes, P. C., Lauber, C. L., Lozupone, C., Caporaso, J. G., et al. (2010). Soil bacterial and fungal communities across a pH gradient in an arable soil. ISME J. 4, 1340–1351. doi: 10.1038/ismej.2010.58
Rudeforth, C. C., Hartnup, R., Lea, J. W., Thompson, T. R. E., and Wright, P. S. (1984). Soils and Their Use in Wales. Harpenden: Lawes Agricultural Trust (Soil Survey of England and Wales).
Sagova-Mareckova, M., Cermak, L., Novotna, J., Plhackova, K., Forstova, J., and Kopecky, J. (2008). Innovative methods for soil DNA purification tested in soils with widely differing characteristics. Appl. Environ. Microb. 74, 2902–2907. doi: 10.1128/AEM.02161-07
Säle, V., Aguilera, P., Laczko, E., Mäder, P., Berner, A., Zihlmann, U., et al. (2015). Impact of conservation tillage and organic farming on the diversity of arbuscular mycorrhizal fungi. Soil Biol. Biochem. 84, 38–52. doi: 10.1016/j.soilbio.2015.02.005
Schnoor, T. K., Lekberg, Y., Rosendahl, S., and Olsson, P. A. (2011). Mechanical soil disturbance as a determinant of arbuscular mycorrhizal fungal communities in semi-natural grassland. Mycorrhia 21, 211–220. doi: 10.1007/s00572-010-0325-3
Schoch, C. L., Seifert, K. A., Huhndorf, S., Robert, V., Spouge, J. L., Levesque, C. A., et al. (2012). Nuclear ribosomal internal transcribed spacer (ITS) region as a universal DNA barcode marker for Fungi. Proc. Natl. Acad. Sci. U.S.A. 109, 6241–6246. doi: 10.1073/pnas.1117018109
Schüβler, A., Schwarzott, D., and Walker, C. (2001). A new fungal phylum, the Glomeromycota: phylogeny and evolution. Mycol. Res. 105, 1413–1421. doi: 10.1017/S0953756201005196
Stockinger, H., Krüger, M., and Schüssler, A. (2010). DNA barcoding of arbuscular mycorrhizal fungi. New Phytol. 187, 461–474. doi: 10.111/j.1469-8137.2010.03262.x
Szoboszlay, M., Dohrmann, A. B., Poeplau, C., Don, A., and Tebbe, C. C. (2017). Impact of land-use change and soil organic carbon quality on microbial diversity in soils across Europe. FEMS Microbiol. Ecol. 93:fix146. doi: 10.1093/femsec/fix146
Tedersoo, L., Anslan, S., Bahram, M., Pólme, S., Riit, T., Liiv, I., et al. (2015). Shotgun metagenomes and multiple primer pair-barcode combinations of amplicons reveal biases in metabarcoing analyses of fungi. MycoKeys 10, 1–43. doi: 10.3897/mycokeys.104852
Tedersoo, L., Bahram, M., Põlme, S., Kõljalg, U., Yorou, N. S., Wijesundera, R., et al. (2014). Global diversity and geography of soil fungi. Science 346:1256688. doi: 10.1126/science.1256688
Thiéry, O., Vasar, M., Jairus, T., Davison, J., Roux, C., Kivistik, P.-A., et al. (2016). Sequence variation in nuclear ribosomal small subunit, internal transcribed spacer and large subunit regions of Rhizophagus irregularis and Gigaspora margarita is high and isolate-dependent. Mol. Ecol. 25, 2816–2832. doi: 10.1111/mec.13655
Thormann, M. N., and Rice, A. V. (2007). Fungi from peatlands. Fungal Divers. 24, 241–299. Available online at: www.cfs.nrcan.gc.ca/bookstore_pdfs/29484.pdf
Wang, B., and Qui, Y.-L. (2006). Phylogeneitc distribution and evolution of mycorrhizas in land plants. Mycorrhiza 16, 299–363. doi: 10.1007/s00572-005-0033-6
Wang, Q., Garrity, G. M., Tiedje, J. M., and Cole, J. R. (2007). Naïve Bayesian classifier for rapid assignment of rRNA sequences into the new bacterial taxonomy. Appl. Environ. Microb. 73, 5261–5267. doi: 10.1128/AEM.00062-07
Weiss, S., Xu, Z. Z., Peddada, S., Amir, A., Bittinger, K., Gonzalez, A., et al. (2017). Normailzation and microbial differential abundance strategies depend upon data characteristics. Microbiome 5, 1–18. doi: 10.1186/s40168-017-0237-y
Keywords: UNITE, SILVA, identification bias, high-throughput sequencing, arbuscular mycorrhizal fungi, Archaeorhizomycetes
Citation: George PBL, Creer S, Griffiths RI, Emmett BA, Robinson DA and Jones DL (2019) Primer and Database Choice Affect Fungal Functional but Not Biological Diversity Findings in a National Soil Survey. Front. Environ. Sci. 7:173. doi: 10.3389/fenvs.2019.00173
Received: 25 March 2019; Accepted: 16 October 2019;
Published: 01 November 2019.
Edited by:
Philippe C. Baveye, AgroParisTech Institut des Sciences et Industries du Vivant et de l'Environnement, FranceReviewed by:
Wilfred Otten, Cranfield University, United KingdomAndrey S. Zaitsev, University of Giessen, Germany
Copyright © 2019 George, Creer, Griffiths, Emmett, Robinson and Jones. This is an open-access article distributed under the terms of the Creative Commons Attribution License (CC BY). The use, distribution or reproduction in other forums is permitted, provided the original author(s) and the copyright owner(s) are credited and that the original publication in this journal is cited, in accordance with accepted academic practice. No use, distribution or reproduction is permitted which does not comply with these terms.
*Correspondence: Paul B. L. George, YWZwNjdlQGJhbmdvci5hYy51aw==