 Ate Poortinga1*
 Quyen Nguyen2
 Karis Tenneson1
 Austin Troy1,3
 David Saah1,4
 Biplov Bhandari2
 Walter L. Ellenburg5
 Aekkapol Aekakkararungroj2
 Lan Ha6
 Hai Pham7
 Giang Nguyen8,9
 Farrukh Chishtie2
- 1Spatial Informatics Group, LLC, Pleasanton, CA, United States
- 2Asian Disaster Preparedness Center, Bangkok, Thailand
- 3Department of Urban and Regional Planning, University of Colorado Denver, Denver, CO, United States
- 4Geospatial Analysis Lab, University of San Francisco, San Francisco, CA, United States
- 5SERVIR Science Coordination Office, NASA Marshall Space Flight Center, Huntsville, AL, United States
- 6Institute of Water Resources Planning, Ministry of Agriculture and Rural Development, Hanoi, Vietnam
- 7Forest Inventory and Planning, Ministry of Agriculture and Rural Development, Hanoi, Vietnam
- 8Division of Nature, Forest and Landscape, KU Leuven, Leuven, Belgium
- 9Space Technology Institute, Vietnam Academy of Science and Technology, Hanoi, Vietnam
Land cover change and its impact on food security is a topic that has major implications for development in population-dense Southeast Asia. The main drivers of forest loss include the expansion of agriculture and plantation estates, growth of urban centers, extraction of natural resources, and water infrastructure development. The design and implementation of appropriate land use policies requires accurate and timely information on land cover dynamics to account for potential political, economical, and agricultural consequences. Therefore, SERVIR-Mekong led the collaborative development of a Regional Land Cover Monitoring System (RLCMS) with key regional stakeholders across the greater Mekong region. Through this effort, a modular system was used to create yearly land cover maps for the period 1988–2017. In this study, we compared this 30-year land cover time-series with Vietnam national forest resources and agricultural productivity statistics. We used remote sensing-derived land cover products to quantify landscape changes and linked those with food availability, one of food security dimension, from a landscape approach perspective. We found that agricultural production has soared while the coverage of agricultural areas has remained relatively stable. Land cover change dynamics coincide with important legislation regarding environmental management and sustainable development strategies in Vietnam. Our findings indicate that Vietnam has made major steps toward improving its' food security. We demonstrate that RLCMS is a valuable tool for evaluating the relationship between policies and their impacts on food security, ecosystem services and natural capital.
1. Introduction
Land governance is at the center of development challenges in Southeast Asia: between 1973 and 2009 the lower Mekong sub-region lost almost a third of its forest cover (WWF, 2013). Such a drastic loss in an area of rapidly growing populations can result in dangerously reduced food security and ecosystem services. The main drivers of land cover change include expansion of agriculture and plantation estates, development of transportation, energy and water infrastructure, urbanization, extraction of natural resources, logging and forest fires (Curtis et al., 2018). Shifts in population dynamics coupled with economic growth are cited as underlying causes of land cover change, often intensified by weak governance (Bui et al., 2014; Stibig et al., 2014). Socioeconomic development, land cover and use and food security are all interconnected at different scales and have far-reaching impacts for not only local people, but the region at large. The development of appropriate land policies is therefore crucial for healthy economic and social development at the national and sub-national level.
Land cover maps are essential for assessing the five biophysical dimensions of food security (Bartholomé and Belward, 2005; Liu et al., 2008; See et al., 2015), which include estimations of cultivated area, crop type, cropping suitability, irrigation and water use, and crop yield. Traditional methods of acquiring information on crop yields and area were through in-person or field surveys using questionnaires, interviews, observations and sampling. These data were then combined and reported in statistical yearbooks. However, such methods vary depending upon skill level of surveyor, community boundaries, local traditions and definitions, and knowledge of those surveyed. Such an approach also requires significant time, personal equipment, and costs. To minimize the need for these resources, satellite data are often used to generate land cover maps (Friedl et al., 2010; Congalton et al., 2014). These maps, however, often lack ground-level validation, or the desired land cover typology is not detectable at the ideal spatial or temporal resolution. Moreover, the generation of satellite- based land cover maps requires technical expertise in the fields of remote sensing and information technology; such expertise is limited to a relatively small subset of people worldwide. New cloud-based geo-computational platforms enable a broader array of technical specialists to process large amounts of data without investing in expensive storage, extensive training and/or processing infrastructure (Gorelick et al., 2017; Markert et al., 2018; Poortinga et al., 2018).
To assess the food security within a country or smaller jurisdictional boundary, one must consider the landscapes and their impacts on food production. For example, forested highlands, which are often located upstream of agricultural areas, provide a wide variety of ecosystem services including raw materials, erosion control, water and nutrient regulation, and micro-climate regulation. These benefits are often conceptualized and quantified in an ecosystem service framework (Costanza et al., 1997; Daily et al., 1997; Stürck et al., 2014). Good environmental legislation must take these ecosystem services, and the dynamic trade-offs and synergies between them, into account. But to understand such dynamics, one must quantify the different dimensions of food security and their relations to the landscape. Current technologies provide capabilities for creating high resolution multi-temporal data series on land cover. These products have well known sources of error. For example, representing continuous land cover as discrete classes often results in misclassification at land type boundaries (Olofsson et al., 2014). Other errors in the data may include image aberrations from atmospheric conditions and flaws in the analysis methods (Foody, 2010). To accurately assess food security within a landscape, statistically robust, easily replicable and transparent approaches are required to translate pixel counts into unbiased estimates of change Olofsson et al. (2014).
This study used a landscape approach to characterize the trajectory and quantify change of two dimensions of food security in Vietnam: area under cultivation and crop types. The term “landscape approach” has been discussed since the 1980s, when the Global Landscape Forum defined it as “balancing competing land use and land cover demands in a way that is best for human well-being and the environment.” This means that socio-economic development solutions must embed food and livelihoods, finance, rights, restoration and progress toward climate and development goals. Landscape approaches thus provide a framework for integrating policy and practice for multiple land uses within a given area, all while ensuring equitable and sustainable land use and improved measures to mitigate and adapt to environmental change (Reed et al., 2015).
We first assessed land cover change using Earth observation data from the Regional Land Cover Monitoring System (RLCMS). The RLCMS was developed by SERVIR-Mekong, a joint United States Agency for International Development (USAID) and National Aeronautics and Space Administration (NASA) collaborative project that aims to support development and sustainable landscape projects in the Mekong region. For this study, the RLCMS was used to produce annual land cover maps for the period from 1988 to 2017. The map products were used to characterize 30 years of changes in area under cultivation and crop type.
This Earth observation data was then coupled with crop productivity estimates from census data and estimates from statistical yearbooks. The crop type categories included in the assessment were aquaculture, rice, orchard and plantation forests, and other croplands. We applied best practices for area estimations to estimate coverage of crop commodities and other land cover classes over the same 30 years period. The assessment was applied at the national and, on a subset of the land, at the provincial level. Analyses at these two levels allowed us to demonstrate variation in observed trends across the country. We then qualitatively related these land cover and crop production trends to the adoption of key sustainable development policies in Vietnam.
We have been able to document what land covers are expanding, and what these expanding regions are replacing. This study demonstrated the capabilities of a cloud-based system like the RLCMS to accurately detects land cover dynamics, allowing developing counties like Vietnam to better address food security and nutrition needs of its' people.
2. Materials and Methods
Vietnam's natural capital is provided by a total area of 33 million hectares of land and more than 3,000 km of coastline. The country is covered by a snaking and dense river and stream network, with an average total volume of surface water estimated at 830 billion cubic meters. It has rich forest resources, a wide range of minerals, fossil fuels, and a high level of biodiversity–with nearly 15 thousand species. The natural capital in Vietnam is of great value and plays an important role in the overall sustainable development strategy.
Vietnam is modernizing rapidly, with high rates of population growth and socioeconomic development since the promulgation of Doi Moi (Renovation) in 1986. As testament to this rapid growth, Vietnam's poverty rate fell from 58% in 1993 to 14.5% in 2008 (Begun, 2012). However, this swift development has negatively impacted the environment, leading to widespread land, forest and water overuse and degradation (Meyfroidt and Lambin, 2008). Deforestation, poor water quality, and decreased biodiversity are additional impacts.
Beginning in 1992 Vietnam started integrating sustainable development strategies into the country's legislative frameworks. In August 2004, Vietnam adopted the Strategic Orientation for Sustainable Development (Agenda 21), resulting in remarkable achievements in the economic, social, and environmental fields. Food security in Vietnam has improved significantly since 1986, with Vietnam becoming one of the biggest rice exporters in the world since 2010. The agricultural sector accounts for over 22% of the country's GDP, 30% of the country's exports, and 52% of the country's employment (IFAD, 2012). Agricultural growth has accelerated in recent decades through a combination of improved land use practices, better irrigation, technology adoption, and incentives, such as price liberalization and land titling, to encourage agricultural investment (Van Khuc et al., 2018). We study these dynamics in five provinces (Figure 1), which were selected to represent a range of agricultural production systems, biomes, and communities. A brief description of each province follows.
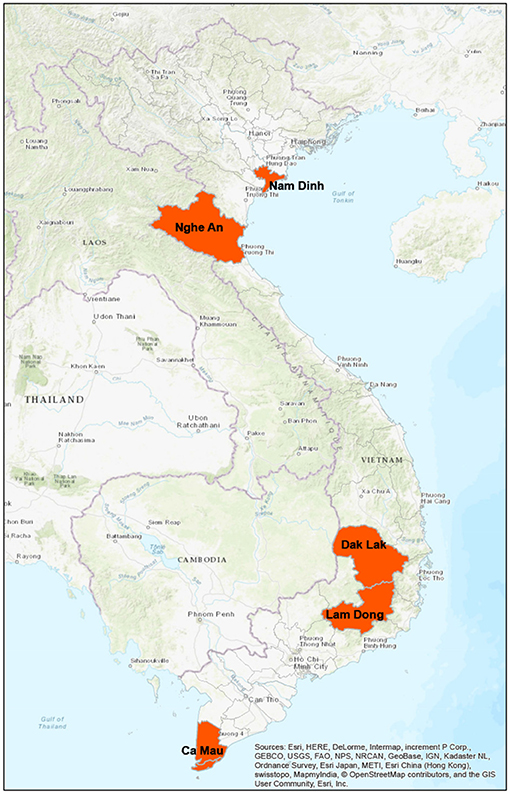
Figure 1. Map of Vietnam with Nam Dinh, Nghe An, Dak Lak, Lam Dong, and Ca Mau indicated with orange colors.
2.0.1. Nam Dinh
Nam Dinh province is part of the coastal area of northern Vietnam and located in the southern part of the Red River delta (Ha et al., 2018). The province has a total area of 1,676 km2 and 72 km of coastline. Nam Dinh is surrounded by a dyke system that protects the land from inundation. Nam Dinh has alluvial, nutrient rich soil highly suitable for agriculture. The coastal province is well-known for its large Ramsar site wetland (Xuan Thuy National park), and its productive mangrove ecosystems. The province is frequently affected by natural disasters, including typhoons and floods. These affect the development of important economic sectors, including agriculture, aquaculture and fisheries. Economic development has also sparked debate about land reclamation into the sea and led to loss of mangrove forest area. Coastline erosion also has been impacting economic development in recent years.
2.0.2. Nghe An
Nghe An province is located in the north central coastal region of Vietnam. The total area of the province is 16,490 km2. The provinces Eastern border is coastline with high mountain ranges in the west. The monsoon tropical climate supports a rich biodiversity. The total population of Nghe An was over 3.5 million in 2019. The Kinh people make up the majority group. The practice of shifting cultivation has led to an increase in fallow land over the past decades (Leisz, 2009). Urbanization and industrial zone development in the coastal zone area has increased rapidly. Recent numbers show that services and tourism contribute to over 40% of the GDP, whereas agriculture and forestry account for 20%.
2.0.3. Lam Dong
Lam Dong province is located in the southern part of Vietnam's central highland region and encompasses a total area of 9,764 km2. There are 1.3 million people and 28 ethnic groups in this province. The majority of the population are Kinh people, at 97% of the population. The province is separated by the Di Linh and Lam Vien plateaus, which have altitudes ranging from 800 to 1,500 meters above sea level. The sloping terrain attracts many tourists. Lam Dong is the most biodiversity-rich province in the Central Highlands and south-central region. A large portion of the province is covered by natural or planted forests, that are home to a number of rare flora and fauna species. The province also contains a variety of soil types, which makes it suitable for industrial plant and crop cultivation as well as a source of mineral resources. However, the latter is a threat to the environment and biodiversity. After Vietnam released the Payment For Ecosystem Services (PFES) decree in 2009, Lam Dong was the first province that implemented the decree.
2.0.4. Dak Lak
Dak Lak province is located in the central highlands of Vietnam. The province has an average altitude of 600 m above sea level. The point with the highest elevation, at 2,442 m, is located in the Chu Yang Sin National Park. The province has a total area of 13,125 km2 and a population of more than 2 million people from 44 ethnic groups. The province contains a dense river and stream network providing an abundance of surface water. Moreover, the province is known for rich forest resources. The soils in Dak Lak are of basalt origin, with high fertility which make them suitable for industrial crop plantations including coffee, pepper, and rubber.
2.0.5. Ca Mau
Ca Mau province is located in the Mekong Delta region, located in the southernmost part of Vietnam's inland territory. The province has a total area of 5,331 km2 and supports a population of more than 1.2 million people. There are three main ethnic groups: the Kinh, Kh'mer, and Chinese. The province is situated in low, flat terrain which is frequently flooded. The average elevation is between 0.5 and 1.5 m above sea level. Ca Mau is a geologically young region, formed from silt and sediment accretion. The young, fertile lands support aquaculture, rice, mangroves, and brackish forests. In recent years a large proportion of rice paddies were converted into aquaculture uses.
2.1. Land Cover Maps
The land cover time series maps used in this study are from the Regional Land Cover Monitoring System (RLCMS) implemented across the Mekong region. They were created for the period from 1988 to 2017 using the Landsat legacy collection and machine learning methods in the Google Earth Engine open platform. The paper of Saah et al. (2020) provides specific technical details regarding the work flow and data processing of this system. We provide a short description below. Examples of the 1988 and 2017 maps are shown in Figure 2.
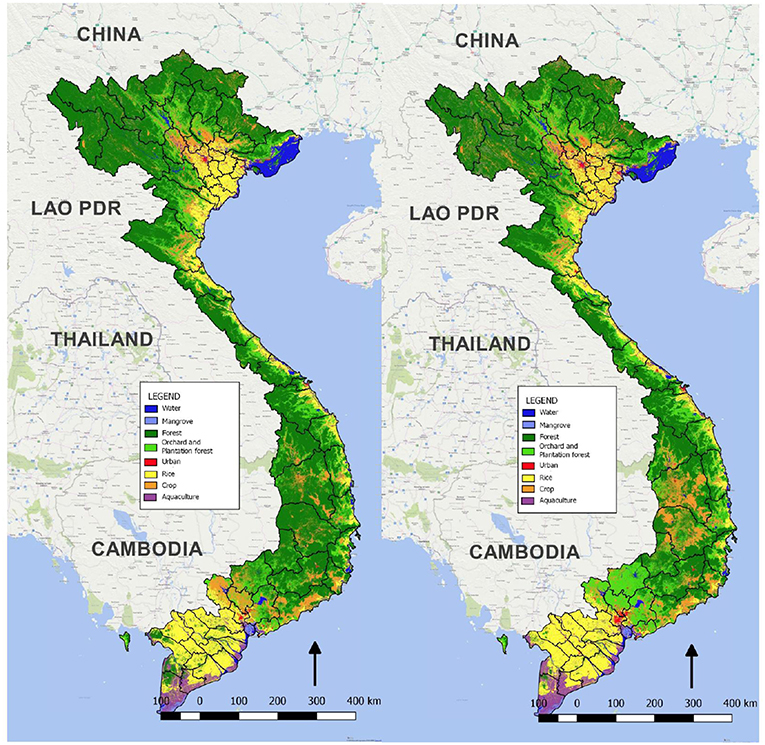
Figure 2. Vietnam land cover map for the years 1988 (Left) and 2017 (Right). Land cover maps of all years can be found online on the SERVIR-Mekong data portal, accessible at https://rlcms-servir.adpc.net/en/.
2.1.1. Annual Satellite Image Composites
The USGS Landsat 4, 5, 7, and 8 surface reflectance images were used to create land cover time series maps. These atmospherically corrected and orthorectified Landsat images are hosted in the Earth Engine data archive. Landsat 8 data were atmospherically corrected using the Landsat Surface Reflectance Code (LaSRC) (Holden and Woodcock, 2016; Roy et al., 2016a; Vermote et al., 2016), while the images from Landsat missions 4, 5, and 7 were corrected with LEDAPS (Vermote et al., 1997; Masek et al., 2006; Ju et al., 2012; Schmidt et al., 2013). All images come with a cloud, shadow, water and snow mask produced using CFMASK (Zhu and Woodcock, 2012), as well as a per-pixel saturation mask. Images from Landsat 7 ETM+ acquired after the 2003 Scan Line Corrector failure were not included in the analysis, as scan line effects were found to propagate through the data analysis into the final products. Additional image pre-processing steps were applied to account for sensor, solar, atmospheric, and topographic distortions (Young et al., 2017) and create a reliable and consistent time series. We applied shadow and cloud removal (Housman et al., 2018; Chastain et al., 2019), a bidirectional reflectance distribution function (BRDF) (Lucht et al., 2000; Roy et al., 2008, 2016b, 2017; Gao et al., 2014) and topographic correction (Smith et al., 1980; Justice et al., 1981; Teillet et al., 1982; Soenen et al., 2005).
2.1.2. Primitives
Primitives are the suite of biophysical and end member layers used to construct land cover products using a customizable assembly logic. Primitive examples include forest canopy height and fractional canopy cover (Potapov et al., 2019). The information represented by the suite of primitive layers is used to make decisions in a dichotomous key for land cover typing. To create the input primitives used in this study, we ran a supervised classification predicting the presence or absence of each land cover class. Reference data were merged with coincident values from the image stack to create a training data set used in a random forest classifier. Data for each class (presence observations) were combined with a random sample of all other classes (absence observations) to create a sample representing both classes for each primitive layer. The training data were used in a random forest model in R (Breiman, 2001; Liaw and Wiener, 2002; R Core Team, 2018) to determine the most important covariates. We used this information to select a subset of images and image derivatives, such as median normalized difference vegetation index (NDVI), from the full list of potential covariates. The random forest classifier was implemented on the subset of covariates in Google Earth Engine (GEE). It was trained with 100 decision trees and the output was saved using the probability mode option (instead of majority vote). The classifier was run on each annual image stack, creating a new time series stack of probability maps for each primitive class.
2.1.3. Assembly Logic and Monte-Carlo Simulations
The final land cover assemblage was created using a decision tree and Monte-Carlo simulation. The decision tree specifies the order and thresholds used to combine all primitives together into a final land cover map. This decision tree was run 100 times using a Monte-Carlo simulation process (Binder et al., 1993). In the Monte-Carlo process, random numbers were added to each of the primitives based on the error structure of the primitive layer. The final land cover map was the mode of the 100 simulations and a probability map which contained the count of the mode divided by the total number of model runs.
2.2. Typology
This study focuses on assessing the 8 main land cover types. Since definitions of land cover types vary between studies, we have included the precise definitions we used for each class below.
• Aquaculture is the farming of aquatic organisms, including fish, molluscs, crustaceans and aquatic plants. Areas defined as aquaculture consist of man-made pond systems on fresh or salt water surfaces, and can be permanently or temporarily flooded.
• Cropland is defined as land with temporary crops followed by harvest and a bare soil period Loveland and Belward (1997). These include single and multiple cropping systems. Example crops include cereals, oils seeds, vegetables, root crops and forages. Some areas include mixed rice and seasonal crop cultivars. Herbaceous and shrubby cultivated plants (e.g., tea and coffee) are included in this layer; but it excludes orchards, forest croplands, and forest plantations.
• Mangroves are defined as coastal sediment habitats with more than 10% woody vegetation canopy cover where the majority of cover is higher than 2 m (Loveland and Belward, 1997).
• Forest is land spanning more than 0.5 hectares with trees higher than 5 m and a canopy cover of more than 10%, or trees able to reach these thresholds in situ. It does not include land that is predominantly under agricultural or urban land use.
• Orchard or plantation forests are defined by FAO as land cultivated with perennial crops that occupy the land for long periods (Blanchez, 1997). Commercial tree crops in Vietnam include mainly rubber, cashew nut, and fruit trees. Forest plantations such as eucalyptus and acacias are included in this category.
• Rice paddies are defined as irrigated or flooded fields, or low land paddy fields where rice is intensively planted for more than 1 cycle per year (can be up to 2 or 3 cycles). Rice makes up the majority of vegetation cover.
• Surface water is defined as open water bodies larger than 30 m2 which are open to the sky, including both fresh and saltwater (Pekel et al., 2016).
• Urban and built-up areas include cultural lands covered by buildings, roads, and other built structures.
2.3. Response Design for Area Estimation
Statistically robust and transparent methods to assess map accuracy and estimate an unbiased area (of change) are critical to ensure the integrity of land change statistics. Area estimations from only counting pixels in land cover maps are often biased because of the inherent errors of the classification process (McRoberts, 2011). Errors are rarely equally distributed between land cover classes; instead there are specific land cover categories that are more difficult to separate than others. This is due to similarity and overlap in spectral and temporal signatures between these classes. Performance can also vary between ecoregions, provinces and even districts. These errors will propagate and create biased area estimations. Hence, based on these considerations, we apply the guidelines of Olofsson et al. (2013, 2014) to estimate map accuracy and provide unbiased area estimates. We apply a stratified random sample design to ensure that classes that cover a small portion of the total area are adequately represented in the sample, while still maintaining a manageable sample size. Equation (1) (Cochran, 1978) was used to estimate the total sample size.
where:
n = Number of sample points
N = Number of units in the Region of Interest (ROI)
Wi = Mapped area of class i (proportion)
Si = Standard deviation of stratum i (Equation 2)
S(ô) = Standard error of estimated overall accuracy.
The total sample size estimate is based on the assumption that N is large, which is valid for our present study. This approach was also suggested as a good practice in Olofsson et al. (2014) and Stehman (2009). The standard deviation of stratum i is,
where:
Ui = User's accuracy (commission error).
Table 1 shows the number of samples used in this study, the proportional area, users' accuracy, and standard deviation for each land cover strata (Equation 2). The proportional area was estimated for the 2017 map and the users' accuracies were previously reported in Saah et al. (2020). Filling out Equation (1) using an S(o) of 0.01 leads to a total of 1,567 sample points. We applied a minimum threshold of 100 points for each land cover class, increasing the sample size of the surface water, mangrove, urban and built up and aquaculture strata. Without the minimum threshold we would have high uncertainty in the error estimates for these land cover strata due to their low occurrence in the landscape. The remaining points were proportionally allocated by area.
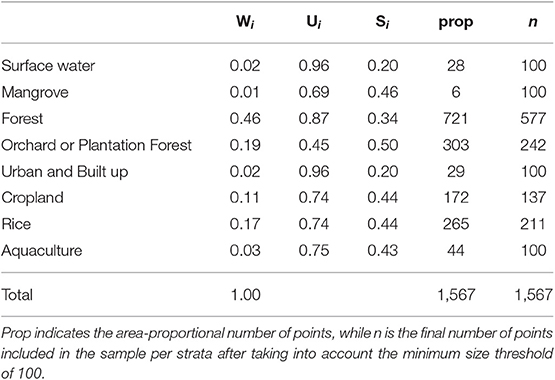
Table 1. Sampling strata for the different land cover classes.
Area proportions were calculated using the confusion matrix from the validation data and Equation (3) (Stehman and Czaplewski, 1998; Olofsson et al., 2014).
where:
pij = Estimated area proportion for year y
Wi = Mapped area of class i (proportion) for year y
nij = Sample counts
ni = Total sample counts of class i.
We created a separate response design for the five provinces as the area proportions vary between these regions. Table 2 shows the number of points included for each class and province. It should be noted that not all classes are represented in each province or only cover a small portion of the total area. Hence, they were not included in the response design.
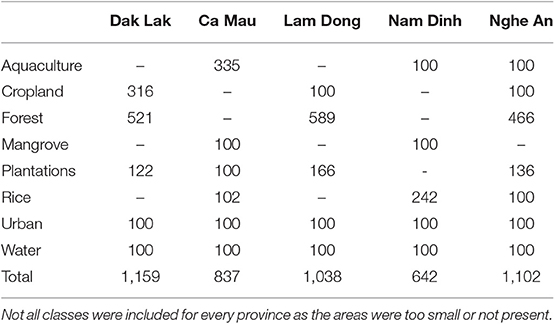
Table 2. Number of validation points per province.
Reference data were collected in Collect Earth Online (CEO; Saah et al., 2019). CEO is a custom built, open-source, high resolution satellite image viewing and interpretation system, an on-line successor of Collect Earth (desktop) (Bey et al., 2016). No desktop installation is required and only an internet connection is needed. It includes a customizable widget interface where the project administrator can set up the display of image chips and time series plots using Google Earth Engine.
High resolution images are not available for each year of the analysis, therefore it was not possible to use this approach to validate the change areas for all years in our time series assessment. Therefore, we integrated census data from the Vietnam national statistical yearbook to triangulate our findings with an independent data source.
3. Results
The results of the national level map evaluation are displayed in Table 3. It is notable that the numbers do not match the number of samples defined in the response design; this is due to low-quality or a completely lack of high resolution satellite imagery. The overall accuracy of the national map was 89%, with users' accuracies of the land cover classes varying between 79% and 99% and producers' accuracies between 79% and 100%. Notable overlap was found between urban and rice, forest and plantations, and forest and cropland.
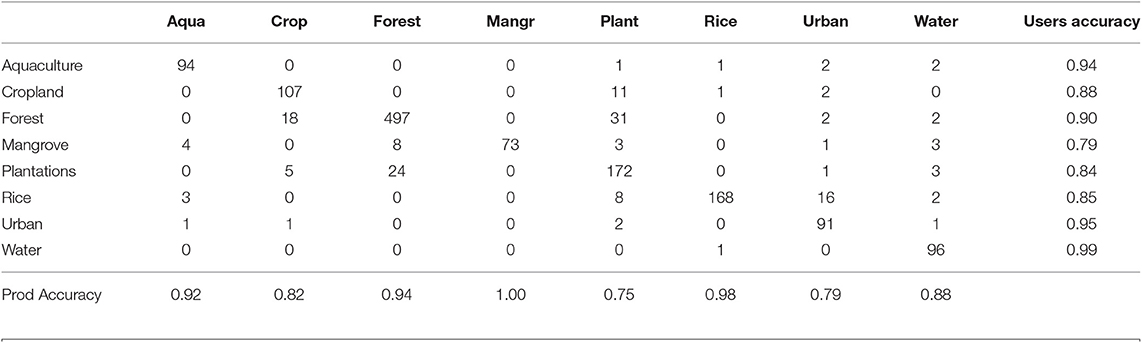
Table 3. Confusion matrix from the Vietnam country level map validation.
We used producers' accuracy to estimate the total area of each land cover class. The results for 2017 are shown in Figure 3. The largest land cover class across the country is forestland, followed by plantations and paddy rice. Cropland also accounts for a large portion, whereas aquaculture, surface water, urban, and mangrove forest constitute a small percentage of the total territory.
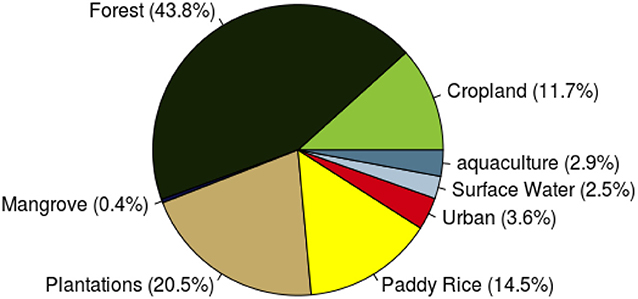
Figure 3. Land cover area distribution of Vietnam in 2017.
The 1988–2017 time series land cover maps were used for change analysis. Figure 4 (Supplemental Data) shows the change in relation to the total area in 1988. The urban category gained the most area, followed by plantations and aquaculture. Rice and surface water expanded slightly but increases leveled off after 2010. Forest and mangrove areas declined, but the decline stabilized in 2000 (for forests) and in 2010 (for mangroves). The change trajectories for cropland are particularly interesting: they show a sharp increase beginning in 2000, a decline after 2003 and a stabilization after 2010. Figure 4 shows that land cover change dynamics in Vietnam were divided into three periods: (1) before 2000 when all land cover types changed rapidly; (2) a slow down in change between 2000 and 2005; and (3) stabilization of change from 2005 to 2010.
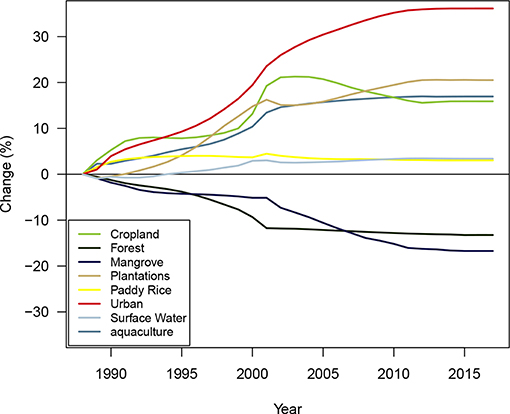
Figure 4. The percent of change of coverage for each land cover class in Vietnam, using the 1988 area composition as the baseline.
The change dynamics of Figure 4 were compared with the numbers from the national statistical yearbook. Figure 5 shows the reported area of cassava, sweet potatoes, maize, spring, winter and autumn paddy reported in the yearbook as well as the changes in detectable with the RLCMS. As the figure shows, the yearbook reports an increase in area of spring and autumn paddy, maize and cassava. The yearbook reports that the total cropland area increases, albeit at a greater magnitude than total cropland increased estimated from the RLCMS. This difference might indicate an intensification as only a small portion of the change is explained by an expansion of agricultural area.
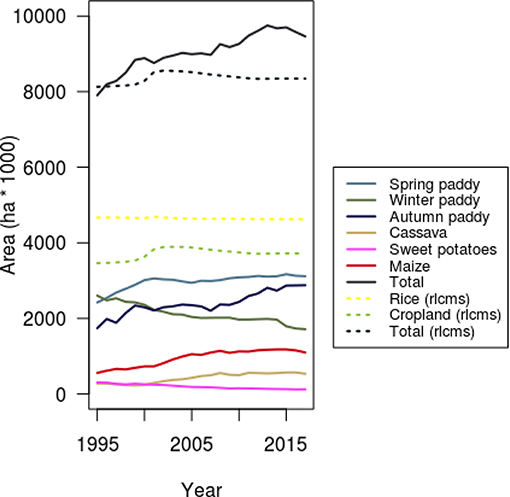
Figure 5. Area from statistical yearbook and area calculated from the RLCMS landcover map.
The response design was then applied to each province. Table 4 shows the province level users' and producers' accuracies. The highest overall accuracy was in Ca Mau, followed by Nghe An, Nam Dinh, Lam Dong and Dak Lak. Producers' accuracies were lower than the users' accuracies for plantations and crops. For the forest strata, producers' accuracies were higher than the users' accuracies.
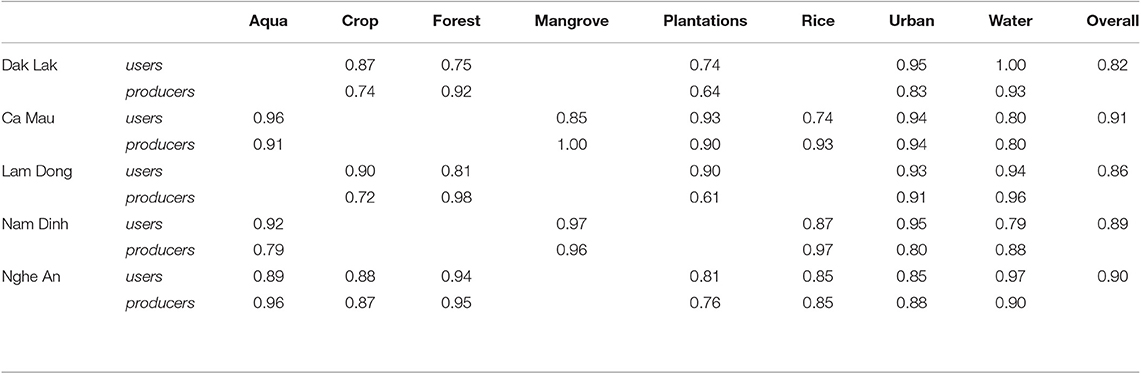
Table 4. Overall user and producer accuracy for each province.
Data from Table 4 was used to map land cover change dynamics for each selected province in relation to the reported changes in cropland area and crop production from the statistical yearbook. Figure 6 (Supplemental Data) plots the change dynamics between 1988 and 2017 as estimated by RLCMS and reported by the statistical yearbook for each province. Figures 7–11 show the land cover changes at a 5 year interval between 1990 and 2017. Transitions from forest to cropland are most noticeable between 1990 and 2000. Charts show the estimated changes in area from the total area expressed as a percentage from the 1988 baseline. The statistics charts show the changes as reported in the statistical yearbook. The production numbers were also included (titled prod) and are expressed in thousand tons (kg).
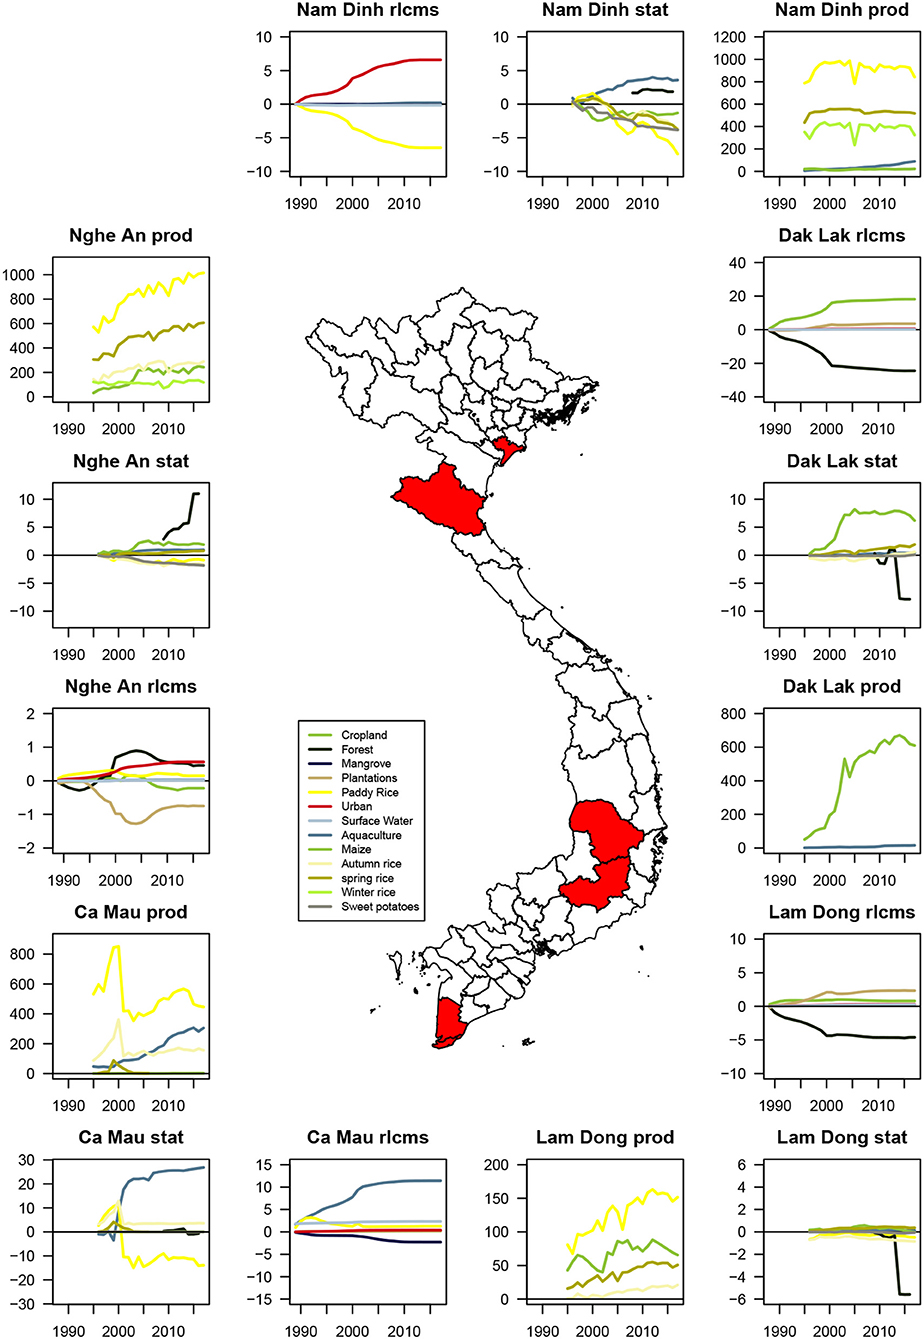
Figure 6. The change in area from RLCMS, the statistical yearbook (stat) and the total production (prod) for different crop types. Change in area from RLCMS and the statistical yearbook are expressed as a percentage (%), the unit of production is in thousand tons.
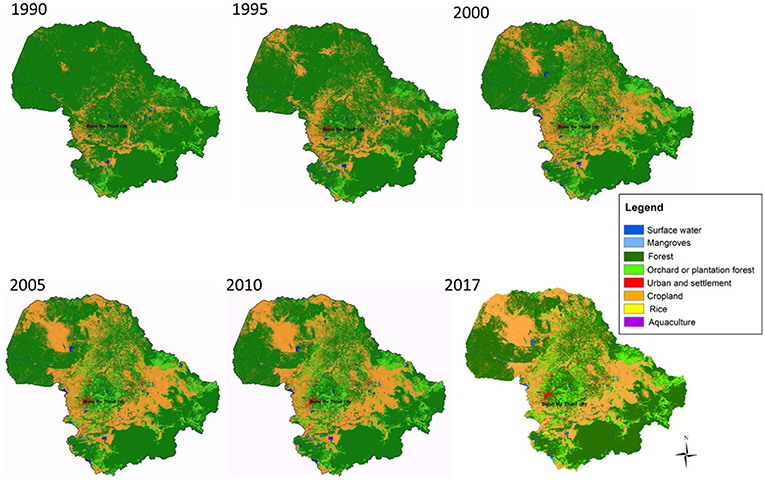
Figure 7. Land cover change in Dak Lak with 5 year intervals from 1990 to 2017. The statistics can be found in Supplementary Table 4.
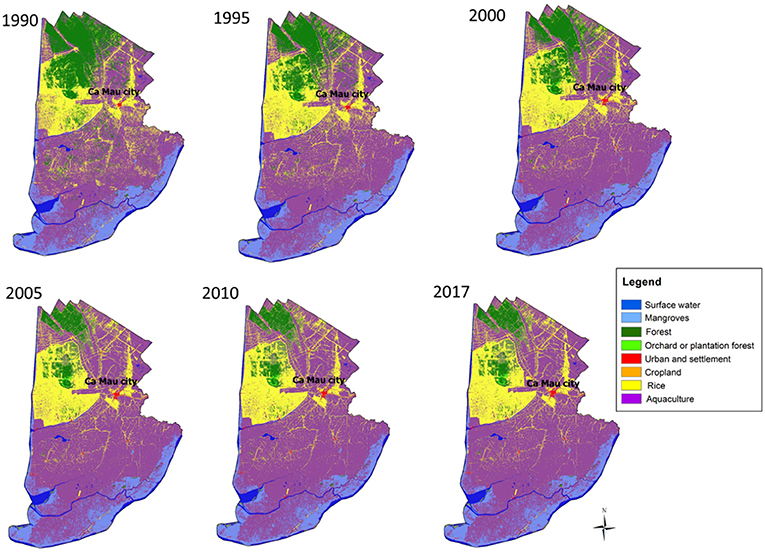
Figure 8. Land cover change in Ca Mau with 5 year intervals from 1990 to 2017. The statistics can be found in Supplementary Table 2.
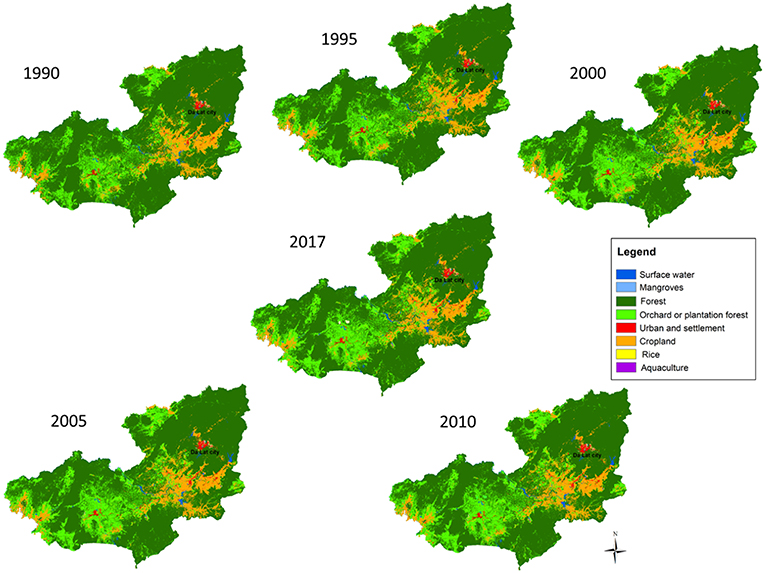
Figure 9. Land cover change in Lam Dong with 5 year intervals from 1990 to 2017. The statistics can be found in Supplementary Table 3.
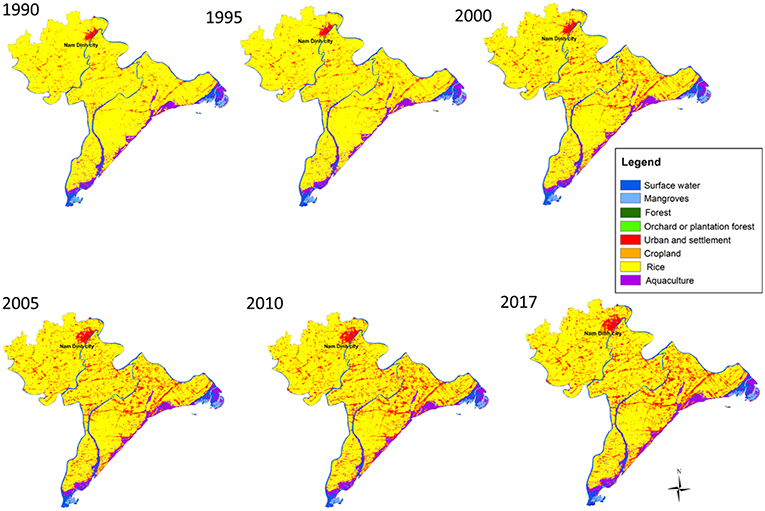
Figure 10. Land cover change in Nam Dinh with 5 year intervals from 1990 to 2017. The statistics can be found in Supplementary Table 6.
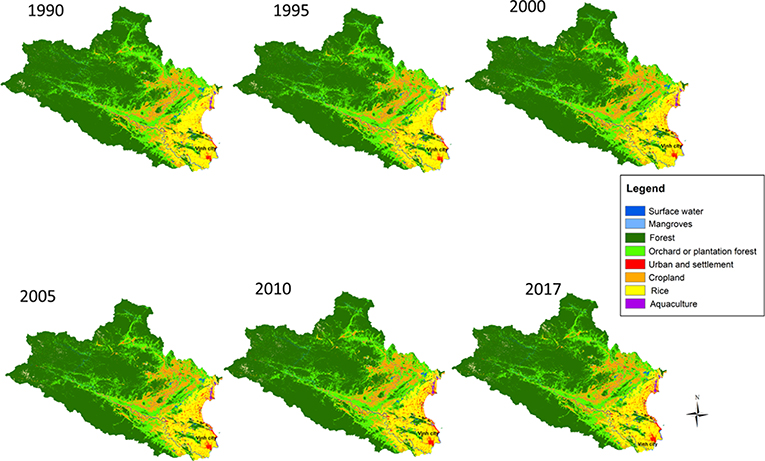
Figure 11. Land cover change in Nghe An with 5 year intervals from 1990 to 2017. The statistics can be found in Supplementary Table 5.
The greatest increase in urban area was found to be in Nam Dinh, apparently at the expense of rice paddies. This is in agreement with the data from the statistical yearbook which also shows a decrease in rice area. Dak Lak province shows the highest increase in crop area, which is confirmed by the statistical data. It also shows a sharp decrease in forested area, as does Lam Dong province. In both provinces forest area was replaced by agricultural lands and tree plantations from 1988 to 2000, but this stabilized after 2000. Ca Mau province experienced rapid expansions in aquaculture ponds, mostly as a result of conversion from rice paddies and mangroves. This is well represented in both the RLCMS results and the statistical data. Land cover changes have been relatively less dynamic in Nghe An province, compared to other provinces; there were only slight increases in urban, rice, and forest areas.
The yearbook data on agricultural production levels tell a different story than the aerial coverage estimates. Figure 6 shows that the production of almost all agricultural products has increased across all provinces, without a proportional expansion in area under cultivation. Nam Dinh shows stable rice production, yet the area supporting rice cultivation decreased. Production levels in Nghe An province also increased while cultivated area decreased. For Dak Lak province we found an increase in maize production that coincides with areal expansion up to the year 2000, but after 2000 production continues to increased while area under cultivation does not. Aquaculture shows a linear increase in productivity over all years analyzed, while areal expansion stabilized after 2000.
4. Discussion
In this study, we estimated national forest cover levels at 43.8%, which is close to the estimates of 42.7 and 44.6% reported by the Food and Agricultural Organization of the United Nations (FAO) for the years 2010 and 2015 (FAO, 2015; Vogelmann et al., 2017). FAO also reports a sharp decline in primary forest between 1990 and 2000, and an increase in naturally regenerated forest from 2000. This is all in line with our analysis. Previous studies regarding the decrease in area of mangroves are also in line with our findings. Mangroves were estimated to cover around 1.2% of the country in 1943 (Maurand, 1943) but decreased to 0.42% in 2010 mostly because of the expansions of aquaculture and rice paddies (Richards and Friess, 2016; Grellier et al., 2017). These dynamics are clearly shown in Figure 4, but are particularly clear for Ca Mau province in Figure 6.
Applying best practices for data validation and area estimations using a stratified random sampling design are labor and resource demanding. This is because interpreting hundreds of data-points on high resolution satellite imagery is labor intensive, and acquiring high resolution satellite imagery is resource-demanding when large areas need to be covered. A limitation of this study is that validation was done using high resolution satellite imagery from only 2017, whereas the lower resolution time-series covers 30 years. Validation of the data over multiple years would further improve the quality of the area estimations. However, we attempted to triangulate our estimates by comparing the results to report from the national statistical yearbook, and we see good agreement between the two sources of crop coverage estimates.
Overall, our analysis shows a notable increase in production with little expansion of area under cultivation. These dynamics coincide with liberalized markets, improved standards, intensified production systems, more efficient fertilizer application, better land and water management practices, the new and more efficient plant varieties (OCDE, 2015; Nguyen et al., 2017; Xuan, 2018). These improvements happened because Vietnam adopted incentives in the agriculture sector such as the Vietnamese Good Agricultural Practices (VietGAP) and the Climate-Smart Agriculture (CSA) programs, which include a number of innovative technologies and practices that aim to increase agriculture production while preserving the environment.
Figure 12 provides a decadal timeline highlighting important legislation on environmental management in Vietnam. This timeline of improvement began when Vietnam participated in the 1992 Earth Summit in Brazil, where country committed to new sustainable development strategies. This helped the country to develop the foundation and legal framework for environmental and natural resource protection, the forest protection and development law, the environmental protection law, and the national plan on biodiversity and nature conservation, all of which were enacted between 1990 and 2000, and tied to economic development targets. As the results above show, these new policies led to a period of increased land cover transitions.
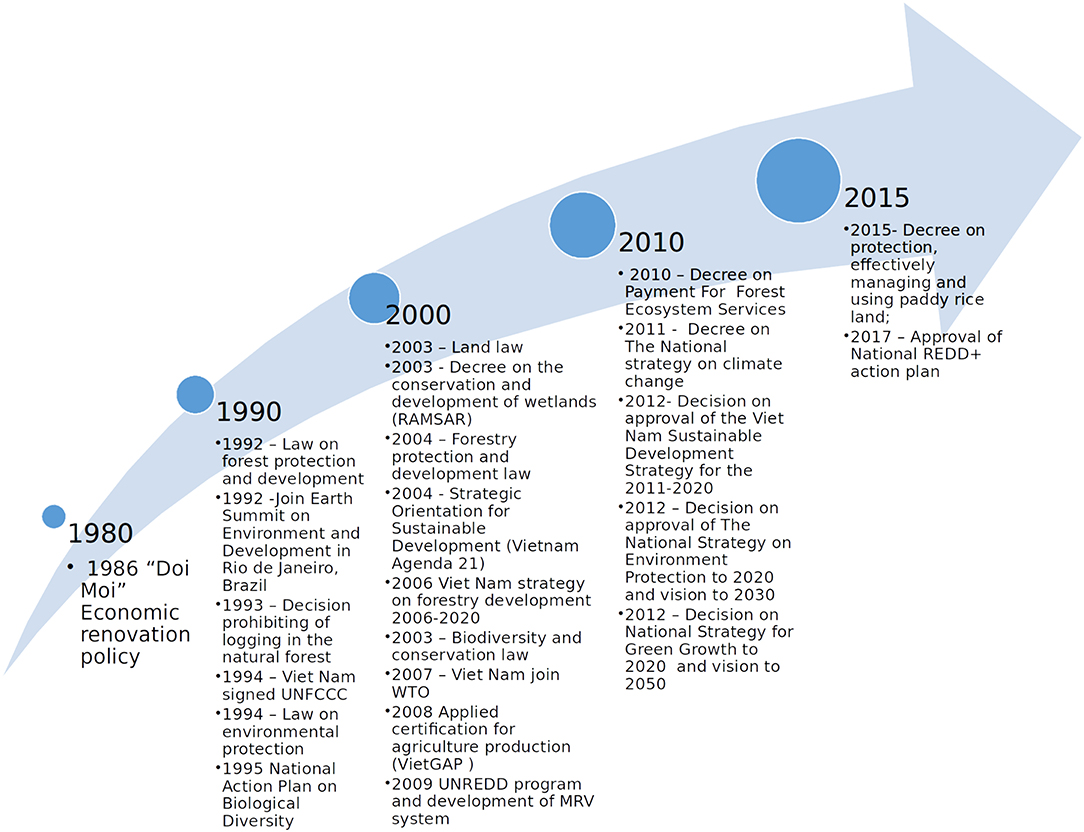
Figure 12. Decadal environmental policy change timeline for Vietnam.
Between 2000 and 2010, the country began integrating the Strategic Orientation for Sustainable Development (Vietnam Agenda 21) into development policies, and also joined the World Trade Organization (WTO) and well as other international trade bodies. These memberships meant that Vietnam had to produce products that met requirements for world markets. International legislation was adapted to the Vietnamese context and integrated into national, ministerial, and local development and certification strategies. This ensured better linkages between economic, social, and environmental objectives, as well improved law enforcement, helping the country sustain healthier ecosystems.
Post-2010, Vietnam adopted the national Green Growth Development Strategy; this strategy defined important environmental policies, such as the national strategy on climate change mitigation and a nationwide policy on payments for forest environmental services (PFES). These new policies have undoubtedly promoted forest recovery, increased forest plantations and stabilized cropland expansion. These dynamics are also coupled with increasing food production, which is essential for national food security.
In particular, the PFES scheme seems to show promise for improved land use and socio-economic development. The implementation of the PFES program has mobilized hundreds of thousands of households to protect and manage more than 5 million hectares of forestland in under 10 years. The program aims to promote sustainable livelihoods and incomes for local people who protect and manage forests. As a next step Vietnam is currently developing a monitoring framework to support effectiveness and transparency of PFES. Indicators in this framework include: forest area, forest quality, landscape, land use and land cover change dynamic, water quality, quantity and sedimentation. Monitoring change in these indicators will be essential for successful policy implementation.
Swidden agriculture was not included in the analysis as it is considered a land use type rather than land cover. Swidden cultivation has been a common land use systems in the tropics including Vietnam (Fox et al., 2000; Mertz et al., 2009; Van Vliet et al., 2012). Resolution 10 of 1988 and the Land Law of 1993 have played an important role in eliminate shifting cultivation by allocating fixed fields to shifting cultivators while encouraging them to cultivate these permanently in the northern and central mountainous region in Vietnam (Castella et al., 2006). Moreover, measures have been implemented on upland cultivation such as sloping agricultural land technology (SALT) to enhance the efficiency and crop productivity (Folving and Christensen, 2007). However, swidden agriculture is still practiced (Pham et al., 2018) and have evolved to accommodate the changing land laws and also to incorporate tree crops. Areas that were classified as forests in this study may be made up of trees that are part of managed regrowth in a fallow system. Similarly, croplands in the upland areas may be part of swidden systems. A land cover change analysis on using the RLCMS time series can provide more information on this.
In this paper we applied the landscape approach to analyze the land use and land cover change both nationally and in selected provinces in Vietnam. This approach allowed us to link physical land use change and changes in agricultural production to evolving policy and sustainable development strategies in Vietnam over that past 30 years. The assessment shows how increasingly complex environmental, social and political challenges that transcend traditional management boundaries can be addressed through good sustainable development policies.
Ecosystems are directly affected by changes in land use and land cover. Such changes affect ecosystem services by increasing the availability of certain services while reducing others, thus reducing the ecosystems ability to support human needs. This in turn further accelerates ecological degradation and the decreases the resiliency of communities reliant on these services (Polasky et al., 2011). With this study we showed that land cover data and information provided by RLCMS can be used for relatively quick and efficient ecosystem service evaluation and assessments that can support better policy implementation and monitoring.
5. Conclusion
We cross-walked a remote sensing-derived 30 year land cover time-series with national statistical data of forest resources and agricultural productivity in Vietnam. We have shown that most land use and land cover changes occurred before the year 2000 and have stabilized since. This stabilization coincides with the implementation of important national environmental and sustainable development policies and strategies. We also show that agricultural production has soared while the coverage of agricultural areas has remained relatively steady. We demonstrated that RLCMS is an important tool to evaluate the effectiveness of sustainable development policies and the evaluation of ecosystem service and natural capital.
Data Availability Statement
All datasets generated for this study are included in the article/Supplementary Material.
Author Contributions
AP, QN, BB, KT, DS, and FC contributed conception and design of the study. AP and QN organized the data collection. AP, QN, and FC performed the statistical analysis. AP and QN wrote the first draft of the manuscript. KT, DS, and FC wrote sections of the manuscript. All authors contributed to the manuscript revision, read, and approved the submitted version.
Conflict of Interest
AP, KT, AT, DS, and FC are employed by spatial informatics group, LLC.
The remaining authors declare that the research was conducted in the absence of any commercial or financial relationships that could be construed as a potential conflict of interest.
Acknowledgments
We thank SilvaCarbon, RDMA, USAID, NASA, Google, the SERVIR program, and Rachmat Mulia from ICRAF for supporting our efforts and providing valuable feedback. Support for this work was provided through the joint US Agency for International Development (USAID) and National Aeronautics and Space Administration (NASA) initiative SERVIR, Cooperative agreement number: AID-486-A-14-00002. We thank Jefferson Metz Fox, Stephen Leisz, and Niall Patrick Hanan for their constructive comments on the manuscript.
Supplementary Material
The Supplementary Material for this article can be found online at: https://www.frontiersin.org/articles/10.3389/fenvs.2019.00186/full#supplementary-material
References
Bartholomé, E., and Belward, A. S. (2005). Glc2000: a new approach to global land cover mapping from earth observation data. Int. J. Remote Sens. 26, 1959–1977. doi: 10.1080/01431160412331291297
Begun, W. (2012). Not Yet Done: Vietnam's Remarkable Progress on Poverty Reduction and the Emerging Challenges. Hanoi: World Bank.
Bey, A., Sánchez-Paus Díaz, A., Maniatis, D., Marchi, G., Mollicone, D., Ricci, S., et al. (2016). Collect earth: land use and land cover assessment through augmented visual interpretation. Remote Sens. 8:807. doi: 10.3390/rs8100807
Binder, K., Heermann, D., Roelofs, L., Mallinckrodt, A. J., and McKay, S. (1993). Monte carlo simulation in statistical physics. Comput. Phys. 7, 156–157. doi: 10.1063/1.4823159
Blanchez, J, L. (1997). “Forest resources and roundwood supply in the Asia Pacific countries: situation and outlook to the Year 2010,” in Working Paper no: APFSOS/WP/17. FAO; Forestry Policy and Planning Division.
Bui, Y. T., Orange, D., Visser, S., Hoanh, C. T., Laissus, M., Poortinga, A., et al. (2014). Lumped surface and sub-surface runoff for erosion modeling within a small hilly watershed in northern vietnam. Hydrol. Process. 28, 2961–2974. doi: 10.1002/hyp.9860
Castella, J.-C., Boissau, S., Thanh, N. H., and Novosad, P. (2006). Impact of forestland allocation on land use in a mountainous province of vietnam. Land Use Policy 23, 147–160. doi: 10.1016/j.landusepol.2004.07.004
Chastain, R., Housman, I., Goldstein, J., and Finco, M. (2019). Empirical cross sensor comparison of sentinel-2A and 2B MSI, landsat-8 oli, and landsat-7 ETM+ top of atmosphere spectral characteristics over the conterminous United States. Remote Sens. Environ. 221, 274–285. doi: 10.1016/j.rse.2018.11.012
Cochran, W. G. (1978). “Laplace's ratio estimator,” in Contributions to Survey Sampling and Applied Statistics, ed H. A. David (Academic Press), 3–10.
Congalton, R. G., Gu, J., Yadav, K., Thenkabail, P., and Ozdogan, M. (2014). Global land cover mapping: a review and uncertainty analysis. Remote Sens. 6, 12070–12093. doi: 10.3390/rs61212070
Costanza, R., d'Arge, R., De Groot, R., Farber, S., Grasso, M., Hannon, B., et al. (1997). The value of the world's ecosystem services and natural capital. Nature 387:253. doi: 10.1038/387253a0
Curtis, P. G., Slay, C. M., Harris, N. L., Tyukavina, A., and Hansen, M. C. (2018). Classifying drivers of global forest loss. Science 361, 1108–1111. doi: 10.1126/science.aau3445
Daily, G. C. (1997). Nature's Services: Societal Dependence on Natural Ecosystems. Washington, DC: Island Press. 392.
FAO (2015). Global Forest Resources Assessment 2015. Technical report, Food and Agriculture Organization of the United Nations (FA).
Folving, R., and Christensen, H. (2007). Farming system changes in the Vietnamese uplands—using fallow length and farmers' adoption of sloping agricultural land technologies as indicators of environmental sustainability. Geografisk Tidsskrift-Danish J. Geogr. 107, 43–58. doi: 10.1080/00167223.2007.10801374
Foody, G. M. (2010). Assessing the accuracy of land cover change with imperfect ground reference data. Remote Sens. Environ. 114, 2271–2285. doi: 10.1016/j.rse.2010.05.003
Fox, J., Truong, D. M., Rambo, A. T., Tuyen, N. P., Cuc, L. T., and Leisz, S. (2000). Shifting cultivation: a new old paradigm for managing tropical forests. BioScience 50, 521–528. doi: 10.1641/0006-3568(2000)050[0521:SCANOP]2.0.CO;2
Friedl, M. A., Sulla-Menashe, D., Tan, B., Schneider, A., Ramankutty, N., Sibley, A., et al. (2010). Modis collection 5 global land cover: algorithm refinements and characterization of new datasets. Remote sens. Environ. 114, 168–182. doi: 10.1016/j.rse.2009.08.016
Gao, F., He, T., Masek, J. G., Shuai, Y., Schaaf, C. B., and Wang, Z. (2014). Angular effects and correction for medium resolution sensors to support crop monitoring. IEEE J. Select. Top. Appl. Earth Observat. Remote Sens. 7, 4480–4489. doi: 10.1109/JSTARS.2014.2343592
Gorelick, N., Hancher, M., Dixon, M., Ilyushchenko, S., Thau, D., and Moore, R. (2017). Google earth engine: planetary-scale geospatial analysis for everyone. Remote Sens. Environ. 202, 18–27. doi: 10.1016/j.rse.2017.06.031
Grellier, S., Janeau, J.-L., Dang Hoai, N., Nguyen Thi Kim, C., Le Thi Phuong, Q., Pham Thi Thu, T., et al. (2017). Changes in soil characteristics and c dynamics after mangrove clearing (Vietnam). Sci. Tot. Environ. 593, 654–663. doi: 10.1016/j.scitotenv.2017.03.204
Ha, L., Bastiaanssen, W., Van Griensven, A., Van Dijk, A., and Senay, G. (2018). Calibration of spatially distributed hydrological processes and model parameters in swat using remote sensing data and an auto-calibration procedure: a case study in a Vietnamese River basin. Water 10:212. doi: 10.3390/w10020212
Holden, C. E., and Woodcock, C. E. (2016). An analysis of landsat 7 and landsat 8 underflight data and the implications for time series investigations. Remote Sens. Environ. 185, 16–36. doi: 10.1016/j.rse.2016.02.052
Housman, I., Chastain, R., and Finco, M. (2018). An evaluation of forest health insect and disease survey data and satellite-based remote sensing forest change detection methods: case studies in the United States. Remote Sens. 10:1184. doi: 10.3390/rs10081184
International Fund for Agricultural Development (IFAD) (2012). Socialist Republic of Viet Nam Country Programme Evaluation. Report No. 2606-VN.
Ju, J., Roy, D. P., Vermote, E., Masek, J., and Kovalskyy, V. (2012). Continental-scale validation of modis-based and ledaps landsat ETM+ atmospheric correction methods. Remote Sens. Environ. 122, 175–184. doi: 10.1016/j.rse.2011.12.025
Justice, C. O., Wharton, S. W., and Holben, B. (1981). Application of digital terrain data to quantify and reduce the topographic effect on landsat data. Int. J. Remote Sens. 2, 213–230. doi: 10.1080/01431168108948358
Leisz, S. J. (2009). Dynamics of land cover and land use changes in the upper CA river basin of Nghe An, Vietnam. Japanese J. Southeast Asian Stud. 47, 287–308. Available online at: https://www.jstage.jst.go.jp/article/tak/47/3/47_KJ00006032400/_article
Liaw, A., and Wiener, M. (2002). Classification and regression by randomforest. R News 2, 18–22. Available online at: https://cran.r-project.org/web/packages/randomForest/citation.html
Liu, J., Fritz, S., Van Wesenbeeck, C., Fuchs, M., You, L., Obersteiner, M., et al. (2008). A spatially explicit assessment of current and future hotspots of hunger in Sub-Saharan Africa in the context of global change. Glob. Planet. Change 64, 222–235. doi: 10.1016/j.gloplacha.2008.09.007
Loveland, T. R., and Belward, A. (1997). The IGBP-DIS global 1km land cover data set, DISCover: first results. Int. J. Remote Sens. 18, 3289–3295. doi: 10.1080/014311697217099
Lucht, W., Schaaf, C. B., and Strahler, A. H. (2000). An algorithm for the retrieval of Albedo from space using semiempirical BRDF models. IEEE Trans. Geosci. Remote Sens. 38, 977–998. doi: 10.1109/36.841980
Markert, K., Schmidt, C., Griffin, R., Flores, A., Poortinga, A., Saah, D., et al. (2018). Historical and operational monitoring of surface sediments in the lower mekong basin using landsat and google earth engine cloud computing. Remote Sens. 10:909. doi: 10.3390/rs10060909
Masek, J. G., Vermote, E. F., Saleous, N. E., Wolfe, R., Hall, F. G., Huemmrich, K. F., et al. (2006). A landsat surface reflectance dataset for North America, 1990-2000. IEEE Geosci. Remote Sens. Lett. 3, 68–72. doi: 10.1109/LGRS.2005.857030
Maurand, P. (1943). L'Indochine Forestiére : les Forêts d'Indochine, Exploitation, Défrichement, Maménagement, Reconstitution des Forêts. Hanoï: Imprimerie d'Extrême Orient, 22–26.
McRoberts, R. E. (2011). Satellite image-based maps: scientific inference or pretty pictures? Remote Sens. Environ. 115, 715–724. doi: 10.1016/j.rse.2010.10.013
Mertz, O., Padoch, C., Fox, J., Cramb, R. A., Leisz, S. J., Lam, N. T., et al. (2009). Swidden change in Southeast Asia: understanding causes and consequences. Hum. Ecol. 37, 259–264. doi: 10.1007/s10745-009-9245-2
Meyfroidt, P., and Lambin, E. F. (2008). Forest transition in vietnam and its environmental impacts. Glob. Change Biol. 14, 1319–1336. doi: 10.1111/j.1365-2486.2008.01575.x
Nguyen, T., Roehrig, F., Grosjean, G., Tran, D., and Vu, T. (2017). Climate Smart Agriculture in Vietnam. Hanoi: International Center for Tropical Agriculture (CIAT).
OCDE, O. (2015). Agricultural Policies in Viet Nam 2015. Organisation for Economic Co-operation and Development. doi: 10.1787/9789264235151-en
Olofsson, P., Foody, G. M., Herold, M., Stehman, S. V., Woodcock, C. E., and Wulder, M. A. (2014). Good practices for estimating area and assessing accuracy of land change. Remote Sens. Environ. 148, 42–57. doi: 10.1016/j.rse.2014.02.015
Olofsson, P., Foody, G. M., Stehman, S. V., and Woodcock, C. E. (2013). Making better use of accuracy data in land change studies: estimating accuracy and area and quantifying uncertainty using stratified estimation. Remote Sens. Environ. 129, 122–131. doi: 10.1016/j.rse.2012.10.031
Pekel, J.-F., Cottam, A., Gorelick, N., and Belward, A. S. (2016). High-resolution mapping of global surface water and its long-term changes. Nature 540:418. doi: 10.1038/nature20584
Pham, T., Moeliono, M., Wong, G. Y., Brockhaus, M., and Dung, L. N. (2018). The politics of swidden: a case study from Nghe An and Son La in Vietnam. Land Use Policy. doi: 10.1016/j.landusepol.2017.10.057
Polasky, S., Carpenter, S. R., Folke, C., and Keeler, B. (2011). Decision-making under great uncertainty: environmental management in an era of global change. Trends Ecol. Evol. 26, 398–404. doi: 10.1016/j.tree.2011.04.007
Poortinga, A., Clinton, N., Saah, D., Cutter, P., Chishtie, F., Markert, K. N., et al. (2018). An operational before-after-control-impact (BACI) designed platform for vegetation monitoring at planetary scale. Remote Sens. 10:760. doi: 10.3390/rs10050760
Potapov, P., Tyukavina, A., Turubanova, S., Talero, Y., Hernandez-Serna, A., Hansen, M., et al. (2019). Annual continuous fields of woody vegetation structure in the lower mekong region from 2000-2017 landsat time-series. Remote Sens. Environ. 232:111278. doi: 10.1016/j.rse.2019.111278
R Core Team (2018). R: A Language and Environment for Statistical Computing. Vienna: R Foundation for Statistical Computing.
Reed, J., Deakin, L., and Sunderland, T. (2015). What are ‘integrated landscape approaches' and how effectively have they been implemented in the tropics: a systematic map protocol. Environ. Evid. 4:2. doi: 10.1186/2047-2382-4-2
Richards, D. R., and Friess, D. A. (2016). Rates and drivers of mangrove deforestation in southeast asia, 2000–2012. Proc. Natl. Acad. Sci. U.S.A. 113, 344–349. doi: 10.1073/pnas.1510272113
Roy, D. P., Ju, J., Lewis, P., Schaaf, C., Gao, F., Hansen, M., et al. (2008). Multi-temporal modis–landsat data fusion for relative radiometric normalization, gap filling, and prediction of landsat data. Remote Sens. Environ. 112, 3112–3130. doi: 10.1016/j.rse.2008.03.009
Roy, D. P., Kovalskyy, V., Zhang, H., Vermote, E. F., Yan, L., Kumar, S., et al. (2016a). Characterization of landsat-7 to landsat-8 reflective wavelength and normalized difference vegetation index continuity. Remote Sens. Environ. 185, 57–70. doi: 10.1016/j.rse.2015.12.024
Roy, D. P., Li, J., Zhang, H. K., Yan, L., Huang, H., and Li, Z. (2017). Examination of sentinel-2a multi-spectral instrument (MSI) reflectance anisotropy and the suitability of a general method to normalize msi reflectance to nadir brdf adjusted reflectance. Remote Sens. Environ. 199, 25–38. doi: 10.1016/j.rse.2017.06.019
Roy, D. P., Zhang, H., Ju, J., Gomez-Dans, J. L., Lewis, P. E., Schaaf, C., et al. (2016b). A general method to normalize landsat reflectance data to NADIR BRDF adjusted reflectance. Remote Sens. Environ. 176, 255–271. doi: 10.1016/j.rse.2016.01.023
Saah, D., Johnson, G., Ashmall, B., Tondapu, G., Tenneson, K., Patterson, M., et al. (2019). Collect Earth: an online tool for systematic reference data collection in land cover and use applications. Environ. Model. Softw. 118, 166–171. doi: 10.1016/j.envsoft.2019.05.004
Saah, D., Tenneson, K., Poortinga, A., Nguyen, Q., Chishtie, F., San Aung, K., et al. (2020). Primitives as building blocks for constructing land cover maps. Int. J. Appl. Earth Observ. Geoinform. 85:101979. doi: 10.1016/j.jag.2019.101979
Schmidt, G., Jenkerson, C., Masek, J., Vermote, E., and Gao, F. (2013). Landsat Ecosystem Disturbance Adaptive Processing System (LEDAPS) Algorithm Description. Technical report, US Geological Survey.
See, L., Fritz, S., You, L., Ramankutty, N., Herrero, M., Justice, C., et al. (2015). Improved global cropland data as an essential ingredient for food security. Glob. Food Secur. 4, 37–45. doi: 10.1016/j.gfs.2014.10.004
Smith, J., Lin, T. L., and Ranson, K. (1980). The lambertian assumption and landsat data. Photogrammetr. Eng. Remote Sens. 46, 1183–1189.
Soenen, S. A., Peddle, D. R., and Coburn, C. A. (2005). SCS+ C: a modified sun-canopy-sensor topographic correction in forested terrain. IEEE Trans. Geosci. Remote Sens. 43, 2148–2159. doi: 10.1109/TGRS.2005.852480
Stehman, S. V. (2009). Sampling designs for accuracy assessment of land cover. Int. J. Remote Sens. 30, 5243–5272. doi: 10.1080/01431160903131000
Stehman, S. V., and Czaplewski, R. L. (1998). Design and analysis for thematic map accuracy assessment: fundamental principles. Remote Sens. Environ. 64, 331–344. doi: 10.1016/S0034-4257(98)00010-8
Stibig, H.-J., Achard, F., Carboni, S., Rasi, R., and Miettinen, J. (2014). Change in tropical forest cover of Southeast Asia from 1990 to 2010. Biogeosciences 11:247. doi: 10.5194/bg-11-247-2014
Stürck, J., Poortinga, A., and Verburg, P. H. (2014). Mapping ecosystem services: the supply and demand of flood regulation services in europe. Ecol. Indicat. 38, 198–211. doi: 10.1016/j.ecolind.2013.11.010
Teillet, P., Guindon, B., and Goodenough, D. (1982). On the slope-aspect correction of multispectral scanner data. Can. J. Remote Sens. 8, 84–106. doi: 10.1080/07038992.1982.10855028
Van Khuc, Q., Tran, B. Q., Meyfroidt, P., and Paschke, M. W. (2018). Drivers of deforestation and forest degradation in Vietnam: an exploratory analysis at the national level. For. Policy Econ. 90, 128–141. doi: 10.1016/j.forpol.2018.02.004
Van Vliet, N., Mertz, O., Heinimann, A., Langanke, T., Pascual, U., Schmook, B., et al. (2012). Trends, drivers and impacts of changes in swidden cultivation in tropical forest-agriculture frontiers: a global assessment. Glob. Environ. Change 22, 418–429. doi: 10.1016/j.gloenvcha.2011.10.009
Vermote, E., Justice, C., Claverie, M., and Franch, B. (2016). Preliminary analysis of the performance of the landsat 8/oli land surface reflectance product. Remote Sens. Environ. 185, 46–56. doi: 10.1016/j.rse.2016.04.008
Vermote, E. F., Tanré, D., Deuze, J. L., Herman, M., and Morcette, J.-J. (1997). Second simulation of the satellite signal in the solar spectrum, 6s: an overview. IEEE Trans. Geosci. Remote Sens. 35, 675–686. doi: 10.1109/36.581987
Vogelmann, J., Khoa, P., Lan, D., Shermeyer, J., Shi, H., Wimberly, M., et al. (2017). Assessment of forest degradation in Vietnam using landsat time series data. Forests 8:238. doi: 10.3390/f8070238
WWF (2013). Ecosystems in the Greater Mekong: Past Trends, Current Status, Possible Futures. Greater Mekong: WWF.
Xuan, V. T. (2018). “Rice production, agricultural research, and the environment,” in Vietnam's Rural Transformation, eds B. J. T. Kerkvliet and D. G. Porter (Abingdon: Routledge), 185–200.
Young, N. E., Anderson, R. S., Chignell, S. M., Vorster, A. G., Lawrence, R., and Evangelista, P. H. (2017). A survival guide to landsat preprocessing. Ecology 98, 920–932. doi: 10.1002/ecy.1730
Keywords: food security, land cover, earth observation, ecosystems, SERVIR, sustainability, land cover change, Mekong
Citation: Poortinga A, Nguyen Q, Tenneson K, Troy A, Saah D, Bhandari B, Ellenburg WL, Aekakkararungroj A, Ha L, Pham H, Nguyen G and Chishtie F (2019) Linking Earth Observations for Assessing the Food Security Situation in Vietnam: A Landscape Approach. Front. Environ. Sci. 7:186. doi: 10.3389/fenvs.2019.00186
Received: 27 June 2019; Accepted: 07 November 2019;
Published: 03 December 2019.
Edited by:
Niall Patrick Hanan, New Mexico State University, United StatesReviewed by:
Jefferson Metz Fox, East-West Center, United StatesStephen Leisz, Colorado State University, United States
Copyright © 2019 Poortinga, Nguyen, Tenneson, Troy, Saah, Bhandari, Ellenburg, Aekakkararungroj, Ha, Pham, Nguyen and Chishtie. This is an open-access article distributed under the terms of the Creative Commons Attribution License (CC BY). The use, distribution or reproduction in other forums is permitted, provided the original author(s) and the copyright owner(s) are credited and that the original publication in this journal is cited, in accordance with accepted academic practice. No use, distribution or reproduction is permitted which does not comply with these terms.
*Correspondence: Ate Poortinga, YXBvb3J0aW5nYUBzaWctZ2lzLmNvbQ==