 Stephanie Natho
 Martin Tschikof
 Elisabeth Bondar-Kunze
 Thomas Hein
- 1Geography and Disaster Risk Research, Institute of Environmental Science and Geography, University of Potsdam, Potsdam, Germany
- 2Department of Water, Atmosphere and Environment, Institute of Hydrobiology and Aquatic Ecosystem Management, University of Natural Resources and Life Sciences, Vienna, Austria
- 3WasserCluster Lunz, Lunz am See, Austria
Floodplains have been degraded in Central Europe for centuries, resulting in less dynamic and less diverse ecosystems than in the past. They provide essential ecosystem services like nutrient retention to improve overall water quality and thus fulfill naturally what EU legislation demands, but this service is impaired by reduced connectivity patterns. Along the second-longest river in Europe, the Danube, restoration measures have been carried out and are planned for the near future in the Austrian Danube Floodplain National Park in accordance with navigation purposes. We investigated nutrient retention capacity in seven currently differently connected side arms and the effects of proposed restoration measures using two complementary modeling approaches. We modeled nutrient retention capacity in two scenarios considering different hydrological conditions, as well as the consequences of planned restoration measures for side arm connectivity. With existing monitoring data on hydrology, nitrate, and total phosphorus concentrations for three side arms, we applied a statistical model and compared these results to a semi-empirical retention model. The latter was originally developed for larger scales, based on transferable causalities of retention processes and set up for this floodplain with publicly available data. Both model outcomes are in a comparable range for NO3-N (77–198 kg ha−1 yr−1) and TP (1.4–5.7 kg ha−1 yr−1) retention and agree in calculating higher retention in floodplains, where reconnection allows more frequent inundation events. However, the differences in the model results are significant for specific aspects especially during high flows, where the semi-empirical model complements the statistical model. On the other hand, the statistical model complements the semi-empirical model when taking into account nutrient retention at times of no connection between the remaining water bodies left in the floodplain. Overall, both models show clearly that nutrient retention in the Danube floodplains can be enhanced by restoring lateral hydrological reconnection and, for all planned measures, a positive effect on the overall water quality of the Danube River is expected. Still, a frequently hydrologically connected stretch of national park is insufficient to improve the water quality of the whole Upper Danube, and more functional floodplains are required.
Introduction
Rivers and their adjacent floodplain ecosystems are essential for human life and biodiversity, but are among the most threatened ecosystems globally (Tockner et al., 2008). One very important characteristic increasingly recognized by society and politics is also the floodplains' tendency to retain floodwater and nutrients when inundated, which nowadays happens only very rarely during high floods in regulated river systems (Schober et al., 2015). Pressures on floodplains are high, especially around large rivers and in the vicinity of large cities or areas with intensive agriculture. Reduction of river length, cutting-off of side arms, bank stabilization, and the establishment of groins and reservoirs has led to a functional decoupling of river and floodplain, further intensified by resulting riverbed incision. Restoring lateral hydrological connectivity between rivers and their floodplains could bring back ecological functionality and the provision of several ecosystem services, including nutrient retention (Opperman et al., 2010; Thorp et al., 2010; Funk et al., 2019).
Floodplains are seen as important nutrient sinks (Spieles and Mitsch, 1999; McClain et al., 2003; Hoffmann et al., 2011; Hopkins et al., 2018), with a higher retention potential than in the main channel (Saunders and Kalff, 2001; Venterink et al., 2003). For nutrients to be retained more efficiently, the supply to floodplains needs to be assured (Amoros and Bornette, 2002; Hein et al., 2004; Noe and Hupp, 2005). Only dissolved nutrients are transported, dependent on oxic conditions and particles' adsorption affinity, via groundwater seepage. Whereas in times of higher water levels suspended particles and inorganic nutrients are transported into side arms or inundated areas, during periods of no or low supply, internal nutrient cycling prevails (with low concentrations of inorganic forms) (Hein et al., 2004). Once arrived, the retention of these nutrients in floodplains depends on a variety of abiotic and biotic processes. In the case of phosphorus (P), suspended particles can deposit, as well as dissolved forms precipitated with metal oxides or adsorbed to clay particles (Behrendt and Opitz, 2000; House, 2003; Hoffmann et al., 2009). Inorganic nitrogen (N), on the other hand, is most commonly removed through biotic processes, mainly denitrification (accounting for up to 63% TN retention according to Saunders and Kalff, 2001) as a permanent removal (Boyer et al., 2006) and together with phosphate through autotrophic and heterotrophic uptake (Fisher and Acreman, 2004; Venterink et al., 2006; Jordan et al., 2011).
The quantification of the filtering function of floodplains in terms of nutrients is a challenge that scientists have addressed through different approaches, on various temporal and spatial scales. Mass balances operate on a reach scale and use black box approaches for total nutrient retention or release (Venterink et al., 2003; Hoffmann et al., 2011, 2012). Other approaches quantify single nutrient compartments and consider implicit processes, like sedimentation, denitrification, or uptake by biota (e.g., Kronvang et al., 2002, 2007; Forshay and Stanley, 2005; Noe and Hupp, 2005; Venterink et al., 2006; Hoagland et al., 2019). Yet other approaches attempt to assess this function through empirical causalities with predictors on a larger scale (e.g., Behrendt and Opitz, 2000; Venohr et al., 2011; Natho et al., 2013). Only a few studies have investigated the role of large river floodplains for nutrient balances (Venterink et al., 2003, 2006; Natho et al., 2013; Theriot et al., 2013) and the impact of their hydro-morphological restoration (Newcomer Johnson et al., 2016) on different temporal and spatial scales. To optimize the restoration success and plan ecologically oriented floodplain reconnection, it is essential to gain an understanding of the relationship between hydrological connectivity, spatial and temporal nutrient retention, and biogeochemical processes of the floodplain ecosystem (Pywell et al., 2003; Reckendorfer and Steel, 2004). Models are essential to improve this understanding at different spatial and temporal scales, and can be used as a tool to better predict the transfer of nutrients from the river to the floodplain for planned side arm restoration projects.
Nutrient retention in restored floodplains is reported to behave differently for N and P. For N, higher denitrification rates (Gumiero et al., 2011; Hoffmann et al., 2011) and increased deposition of particulate N (Brunet et al., 1994; Keizer et al., 2018) are reported. Regarding P, uptake of phosphate by primary producers can be enhanced (Hein et al., 2004) and trapping of suspended P in restored reaches is reported to increase (Noe et al., 2019), while remobilization of soluble P is frequently found (Venterink et al., 2002; Hoffmann et al., 2011; Noe et al., 2019) especially shortly after restoration in former agricultural areas (Aldous et al., 2007). Restoration of lateral hydrological connectivity is known to reestablish ecological functions in floodplains (Gumiero et al., 2013; Reckendorfer et al., 2013) and a combination of measures may increase restoration success (Newcomer Johnson et al., 2016). This underlines the potential of side arm reconnection as a feasible measure for reducing nutrients in river water and at the same time improving ecological conditions in floodplains.
In this paper, we explore the efficiency of nutrient retention due to side arm reconnections in a case study of the Danube River by applying two modeling techniques. We therefore formulate the following research questions:
1. How do different scaled modeling approaches (semi-empirical, statistical) depict nutrient retention in the Danube Floodplain National Park (DFNP) under different hydrological conditions?
2. How do different connectivity levels in a former braided river floodplain affect N and P retention and what is the effect of reconnection measures?
3. Are these measures sufficient to identify a reduction in river nutrient load, or what extent of restoration measures is needed to observe a significant reduction of the overall riverine loads (>1%)?
Thus, we analyzed how the reconnection of seven floodplain side arms in an ~30-km stretch of the DFNP east of Vienna affect nutrient retention primarily in the range of restored connectivity levels, excluding very high floods (<1% exceedance in 30 years), and applied a statistical model to quantify nutrient retention during phases of surface water connection and disconnection. To generate a more comprehensive picture across different scales, we compared the outcomes with a mesoscale semi-empirical retention model (Venohr et al., 2011), based on transferable denitrification and sedimentation causalities as the main processes for nitrogen and phosphorus retention, respectively (Behrendt and Opitz, 2000; Zessner and Gils, 2002; Venterink et al., 2006; Mölder and Schneider, 2011). Based on proposed management plans, we calculated scenarios considering current conditions (CUR) and complete floodplain reconnection (ALL), and the effect of increased lateral hydrological connectivity on the reduction of the total nutrient load in the Danube. Accounting for a wet and a dry hydrological year, we wanted to show for the first time the range of nutrient loads that could be retained in floodplains of the DFNP. Finally, we analyzed the similarities and differences between the two modeling approaches to depict relevant drivers and limitations of nutrient retention and the relative contributions of high floods and average discharge conditions.
Methods
Study Site
The DFNP east of Austria's capital Vienna (Figure 1) is, with 96 km2, the largest natural floodplain landscape of its kind in central Europe, where the Danube River still has the dynamic character of a mountain river. To ensure navigation and reduce flood hazards, extensive channelization, regulation through rip-raps and groins, as well as active disconnection of the floodplain through levees, have been conducted since the nineteenth century. Additionally, heavy damming since the 1950s has further impacted natural dynamics, with the DFNP being the longest remaining free flowing stretch of the Austrian Danube (36 km) (Habersack et al., 2016).
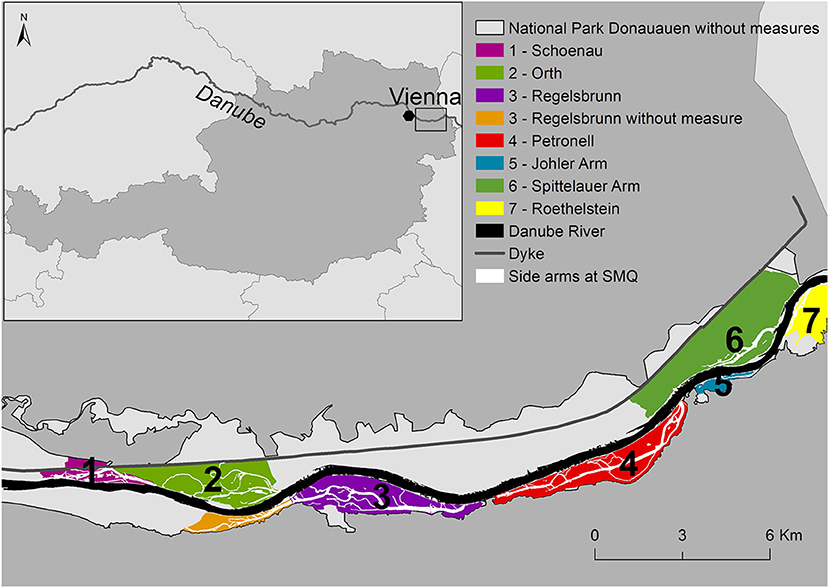
Figure 1. Location of study site with the seven side-arm systems along the Danube River in Austria.
Starting in 1996, the first side arm in Haslau-Regelsbrunn (3) was partially reconnected, followed by two floodplain systems in Orth (2) and Schönau (1) 5 years later, connected at lower water levels but still in a technical manner (Figure 1, Supplementary Figure 1, Supplementary Table 3). To increase natural dynamics while ensuring navigation, a pilot project by the Austrian waterway administration (viadonau, http://www.viadonau.org) (2012–2014) successfully tested a combination of river engineering measures including the complete reconnection of a side arm (Johler Arm−5), optimization of groins, removal of rip-raps, and river bed improvement to counteract riverbed incision. The remaining side arms (Petronell−4, Spittelauer Arm−6, Roethelstein−7) are solely groundwater fed until the Danube discharge reaches >2,600 m3 s−1, well above mean discharge (MQ).
We consider these seven side arm systems in the DFNP with different degrees of connectivity to the Danube flow regime (Table 1) and different sizes (here as length of branch and maximum flooded area) to model retention of nitrate and total phosphorus for wet, dry, and average hydraulic years. The considered river stretch belongs to the Upper Danube Catchment with a nival flow regime influenced by snow melt from the Alps. Hainburg is the representative gauge for the study site. Here, the catchment has a size of 104,727 km2 and the MQ is 1,930 m3 s−1. At the study site, the Danube River transports between about 119,015 t (dry year 2003) and 199,000 t (wet year 2002) of dissolved inorganic nitrogen (DIN), with NO3-N being the main component. The annual load of TP ranges between 2,699 t (dry year 2003) and 6,700 t (wet year 2002) (ICPDR, 2002, 2003).
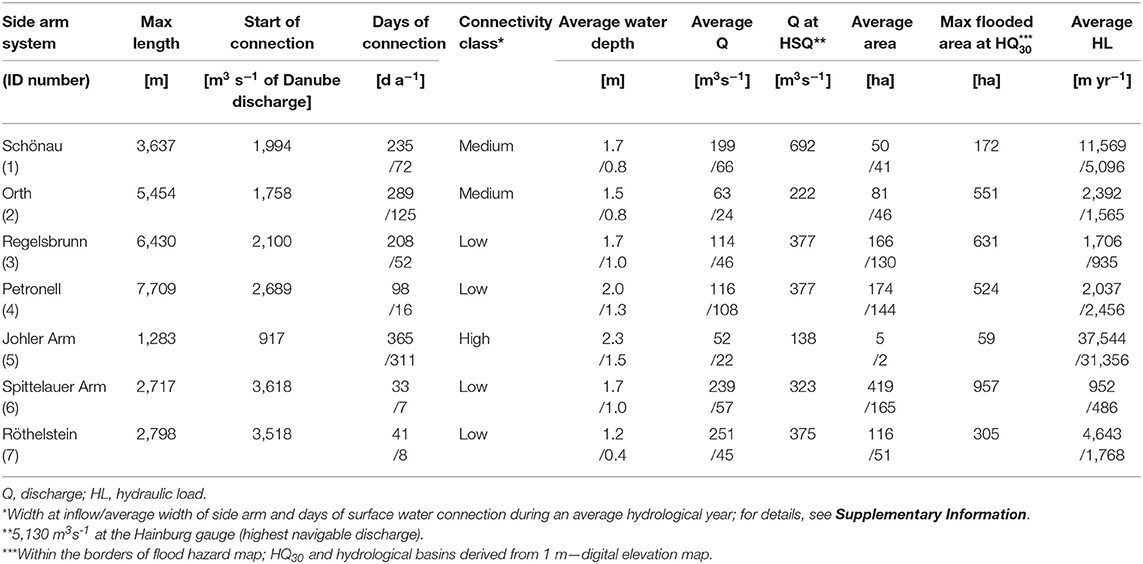
Table 1. Summary of connectivity-related hydro-morphological characteristics of the side arms in the current state for wet/dry years.
Management Scenarios
To detect the effect of river restoration, nutrient retention was modeled in the current state (CUR) and in a scenario of complete implementation of all proposed restoration measures (ALL), according to the management and restoration plan of the Austrian waterway authority. This scenario includes the complete reconnection of seven side arms and the maintenance of stable riverine water levels due to sediment addition to the river channel. CUR and ALL were calculated for a hydrograph of an extremely wet (2002) and an extremely dry year (2003) as defined by Weigelhofer et al. (2015).
Data
Hydrological variables of the Danube were obtained by the hydrological portal of Austria (https://ehyd.gv.at/, last download 15th of July 2019) and water quality data on nutrients from the federal ministry of sustainability and tourism database (https://wasser.umweltbundesamt.at/h2odb/, last download 15th of July 2019). Water quality data in the side arms was gathered from monitoring and research projects of past reconnection measures in the systems of Regelsbrunn (2) (Heiler et al., 1995; Hein et al., 1999, 2002), Orth (2) (Hein et al., 2003), and Johler Arm (5) (Viadonau, 2015). Water quality was measured at discharges of the Danube River up to 5,130 m3 s−1 in the vicinity of the respective inlets and outlets. To ensure comparability, we included only data sets where sampling and nutrient analysis were conducted with standardized methods. The degree and duration of surface water connection of the side arms was approximated in all scenarios by linearly interpolating the flow between the topographical point of inflow and a discharge of 5,130 m3 s−1. The latter value was obtained from the simulation output of a one-dimensional hydraulic model (HEC-RAS).
Information on DFNP borders was obtained from EEA (2018, https://www.eea.europa.eu/data-and-maps/data/natura-10/natura-2000-spatial-data). Wetted area and water depth at three discharges were obtained by intersecting surface and groundwater tables with the DEM (Hohensinner et al., 2008). For higher discharges, a flood hazard map of a frequent HQ30 flood (9,290 m3 s−1) for the DFNP (https://maps.wisa.bmnt.gv.at/hochwasser, last download 15th of July 2019) was georeferenced and intersected with DFNP borders, showing that the entire floodplain is inundated at this discharge. To estimate the extent of each side arm system, we delineated watersheds on the basis of a digital elevation 1 m grid (provided by viadonau, tiles 78, 89, and 81) using the ESRI ArcGIS “Hydrology” tool (Figure 1). Shortwave radiation data on a monthly mean basis was downloaded from EUMETSAT (http://www.cmsaf.eu/pum) to consider additional nitrate uptake by macrophytes following the method described in Venohr et al. (2011).
Statistical Model
Mass balances for the statistical model were deduced from concentration measurements and the hydraulic model in investigated side arms. During surface water connection, longitudinal concentration differences (dc, in g m−3 m−1) were calculated (Equation 2), and during isolation, changes in concentration over time (Δc, in g m−3 d−1) (Equation 3). Therefore, the available dataset was divided accordingly, resulting in pairwise observations in upstream and downstream parts of the side arm in the connected state (n = 54) or uninterrupted periods between measurements in the disconnected state (n = 125).
Statistical models were developed for TP and NO3-N, each following independent routines on the basis of concentration measurements in all three side arms. For TP, identified significant relationships (Figure 2) were used to calculate nutrient retention by applying a multiple adaptive spline regression model (Millborow, 2015). However, because dc and Δc differed considerably between the three side arm systems (Figure 2, Supplementary Table 1), three different connectivity classes were assigned (Supplementary Table 2). The connectivity classes, indicating three different TP retention potentials, were used to extrapolate nutrient retention to side arms without concentration measurements based on the average surface water connection (d a−1) and the ratio of the inlet opening to the side arm width (Table 1). Assuming that the maximum retention equals the load entering the side arm, we modeled the longitudinal TP concentration decline as a logistic growth function (Equation 1). TP input from the Danube River was computed according to an adapted exponential discharge-dependent TP concentration model from Zessner and Kroiss (1999). During periods of isolation, concentration differences were not significantly different from zero and therefore not considered in further calculations for TP (one-sample Wilcox-test, p > 0.1).
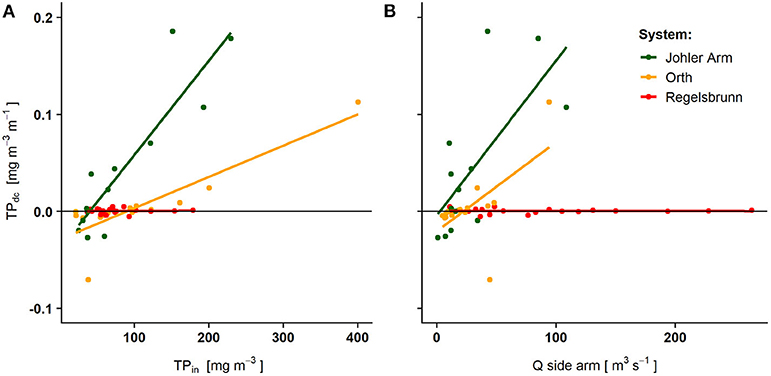
Figure 2. Significantly increasing measured concentration differences (n = 54) of total phosphorus with increasing incoming total phosphorus concentration (A) and discharge (B) along the three differently connected side arm systems: Johler Arm (high connectivity, n = 17), Orth (medium connectivity, n = 16), and Regelsbrunn (low connectivity, n = 21). Positive values indicate net retention and negative value release of TP between two sampling points. For details on the deduction of the statistical approach, please refer to the Supplementary Information.
For nitrates, no correlation with any measure-specific parameters could be detected, but retention values significantly exceeded zero (one-sample Wilcox-test, p < 0.01, n = 179). Therefore, mean retention values in connected (9 × 10⁻⁷ g m−3 m−1, n = 54) and isolated (718 × 10−5 g m−3 d−1, n = 125) conditions were used to calculate retention. By multiplying the resulting TP and NO3-N retention rates (g m−2 d−1) by the factor 10 and the days under consideration, commonly used rates in kg ha−1 month−1 or kg ha−1 yr−1 were calculated.
dc = concentration difference of TP between inlet and outlet [g m−3]
dc/m = system-specific retention rate per m [g m−3 m−1]
cin = inlet concentration [g m−3]
a = concentration-dependent retention rate (connectivity class) [–]
L = length of the side arm [m]
During connection:
During isolation:
Ret = retention [g m−2 d−1]
Q = discharge in side arm [m3 d−1]
dc = concentration difference between inlet and outlet [g m−3]
Δc = concentration change over time [g m−3d−1]
A = area [m2]
d = water depth [m].
Semi-Empirical Mesoscale Model
This semi-empirical mesoscale model is based on two submodels. The first submodel calculates incoming load and inundated floodplain area considering the statistical relationships between the given discharge ratios and the incoming discharge and inundated area on a daily basis for each side arm system (Natho et al., 2013; Natho and Venohr, 2014). With this data given, the nutrient retention was calculated for nitrates and total phosphorus on a monthly basis for each side arm system following the approach of Venohr et al. (2011).
The incoming nitrate and total phosphorus load was calculated on a monthly resolution according to ICPDR (2017). On the basis of the discharge-flooded area relationship, three parameter sigmoidal functions were derived (SIGMAPLOT version 13.0 Notebook, Systat Software Inc.) to describe the proceeding inundation of floodplains of each side arm system with increasing discharge (Supplementary Figure 2). This key parameter represents the degree of lateral hydrological connectivity of each side arm system and was developed successfully for rivers in Germany (Natho and Venohr, 2012, 2014; Natho et al., 2013).
As flood waves normally occur over a short period, the incoming nutrient load was calculated on a daily basis with daily average discharge. In line with seasonal dependencies of NO3-N concentrations found by Zweimüller et al. (2008), Venohr (2006), and Venohr et al. (2011) and complex patterns of TP fluxes during high discharges (Zessner et al., 2005; Bowes et al., 2008; Chen et al., 2013), concentration proxies for NO3-N and TP were applied (Supplementary Tables 4, 5). The incoming daily load was calculated with an average nitrate concentration for each month and with an average TP concentration considering winter and summer seasons and discharge levels below or above MQ. Based on the daily loads and the known inundated area, the retention model (Equations 4, 5) developed on the mesoscale was applied at a monthly resolution (Venohr et al., 2011):
Nret% = retention in % of incoming nutrient load [%]
R = short wave radiation [W m−2]
T = temperature [°C]
HL = hydraulic load [m yr−1]
a = 5.7 [–], a1 = 0.025 [–], and b = 0.067 [–]
Pret% = retention in % of incoming nutrient load [%]
HL = hydraulic load [m yr−1]
c = 15.91 [–]
Both Equations (4) and (5) consider hydraulic load (HL) as an equivalent for retention time (see Venohr, 2006 for details), meaning lower areal retention in case of high HL. For nitrogen, temperature and shortwave radiation have also influenced the metabolic rate of denitrification and plant uptake (Venohr et al., 2011).
Results
Model Comparison Under Current Conditions (CUR)
Current Annual Nutrient Retention Rate in the Study Area
As for the mean area-specific retention rates on an annual basis, both models were in a comparable range and predicted higher retention rates in the wet year (Supplementary Figures 3, 4). For NO3-N, the statistical model amounted to 170 kg ha−1 yr−1, the semi-empirical model 161 kg ha−1 yr−1 and for TP, 5.7 and 4 kg ha−1 yr−1, respectively. In the case of both nutrients, the statistical model showed a higher variation. In the dry year, retention rates were lower than in the wet year, with 77 or 88 kg NO3-N ha−1 yr−1 and 1.4 or 2 kg TPha−1 yr−1 for the statistical and semi-empirical models, respectively. When considering the very high discharges in the wet year, the retention rate calculated by the semi-empirical model increased to 198 kg NO3-N ha−1 yr−1 and 4.8 kg TP ha−1 yr−1 (Table 2).
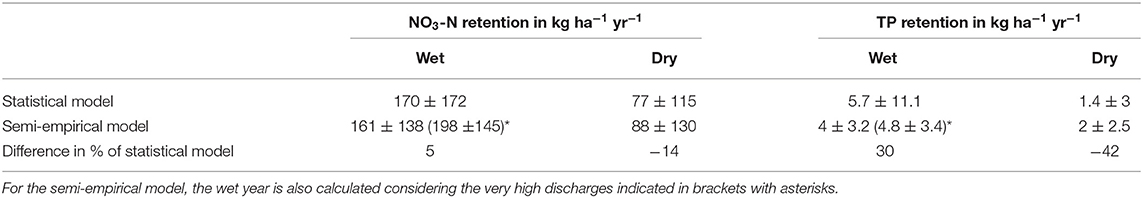
Table 2. Resulting nutrient retention calculated by the semi-empirical and statistical models for three hydraulic conditions in the study sites.
Current Monthly Retention Rates in Two Differently Connected Side Arm Systems
Both models agreed in calculating higher monthly nitrate and total phosphorus retention with increasing discharges in the side arms and days of surface water connection (Figure 3). According to the statistical model, nutrient removal in the connected state was considerably higher than in the disconnected state. The contribution to nitrate reduction in the disconnected state quickly became insignificant when the side arm was connected longer than ~2 days a month (Figure 3).
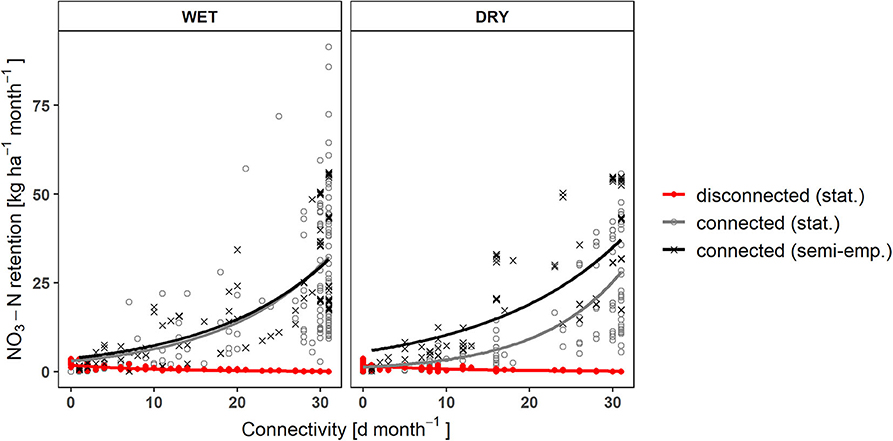
Figure 3. Changes in NO3-N retention with increasing connectivity (Q < 5,130 m3 s−1) in the current state. Exponential increase as calculated by the two models and linear decrease of the fraction retained during disconnection in the stored floodplain water ( = 0.64, = 0.55, p wet, dry <0.001). By fitting an exponential function [y = b*exp(a*x)], the mean errors of the linear models (R2 = 0.39–0.62, p < 0.001) could be further reduced.
Johler Arm (5, Figure 1, Supplementary Figure 3) was permanently connected to the main river channel, but inundation of the floodplain occurred only during high flows. In Regelsbrunn (3, Figure 1, Supplementary Figure 3), inundation occurred less frequently, but only if the inundated area was relatively large. As a consequence, HL was low for Regelsbrunn and extremely high for Johler Arm especially in August (high floods). On a monthly basis, both models represented the occurrence of floods (<5,130 m3 s−1) differently. Due to the dependence of the semi-empirical model on HL, it showed areal retention peaks (in kg ha−1 yr−1) after floods when the entering nutrient load was still high, but the inundated area was lower than during the flood peak. In contrast, the statistical model calculated the highest retention rates during floods reflecting the hydrograph (Figure 4), since discharge and dependent nutrient transport were the only variables in the statistical retention model. The biggest difference between the models was visible for TP in Johler Arm for a wet hydrograph (Figure 4). Here, the semi-empirical model predicted low TP retention rates due to high HL, but the statistical approach modeled high rates, due to high measured TP retention in Johler Arm and its increase with rising discharge (Figure 2).
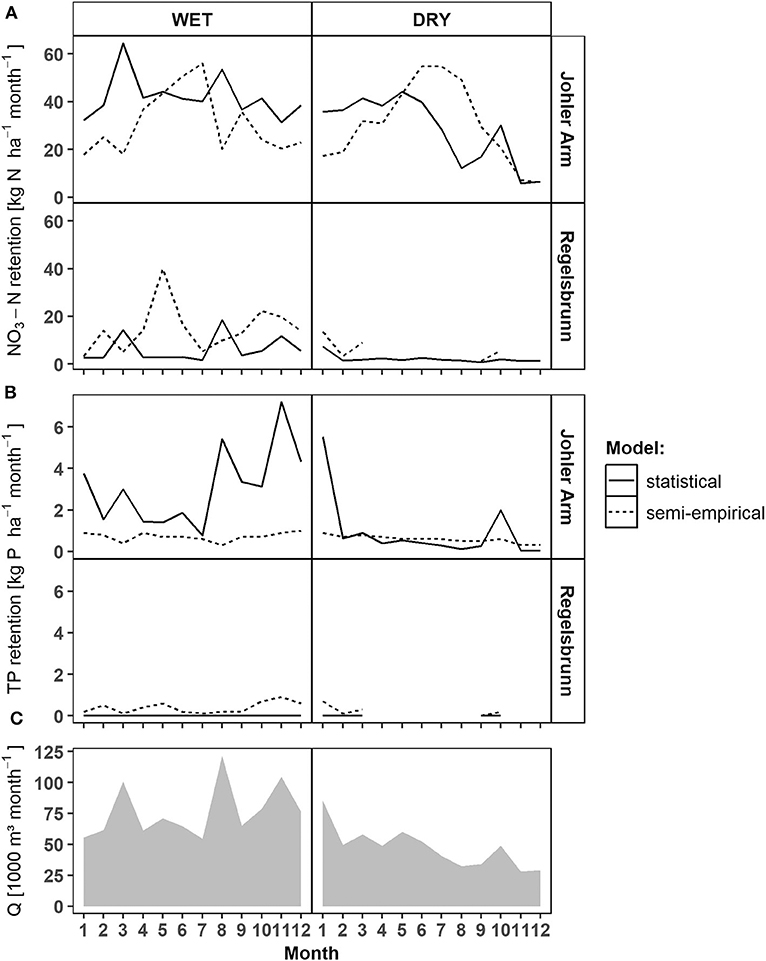
Figure 4. Model comparison of monthly areal NO3-N (A) and TP (B) retention values below 5,130 m3 s−1 for the selected side arms Johler Arm (high connectivity) and Regelsbrunn (low connectivity), in which water quality data was available, as well as monthly discharge sums of the Danube River (C). More detailed figures for all side arm systems, scenarios, and model years can be found in Supplementary Figures 2, 3.
Effect of Reconnection Measures on Nutrient Retention
Due to the dependence on connectivity in both models (Figure 3), reconnection of all side arms (ALL scenario) was predicted to considerably improve nutrient retention capacity in the DFNP. According to both models, the calculated absolute NO3-N retention in the DFNP doubled in the wet year and even rose by a factor of 3.75–5 in the dry year (Figure 5). For TP retention, the trend was similar to NO3-N according to the semi-empirical model. For the statistical model, TP retention after restoration was higher than the NO3-N retention in absolute terms. Generally, the reconnection effect was most visible for large side arms with low connectivity under current conditions [Regelsbrunn (3), Petronell (4), and Spittelauer Arm (6); Figure 6]. In the current state, NO3-N and TP load reduction in the floodplains accounted for between a marginal 0.01 and 0.03% for both models and hydrographs. Considering the complete implementation of all restoration measures, load reduction may increase to 0.05–0.07% according to the semi-empirical model. The statistical model resulted in 0.04–0.06% reduction of NO3-N load and an unlikely high 1.8–3% reduction of TP load in the dry and wet hydrographs, respectively.
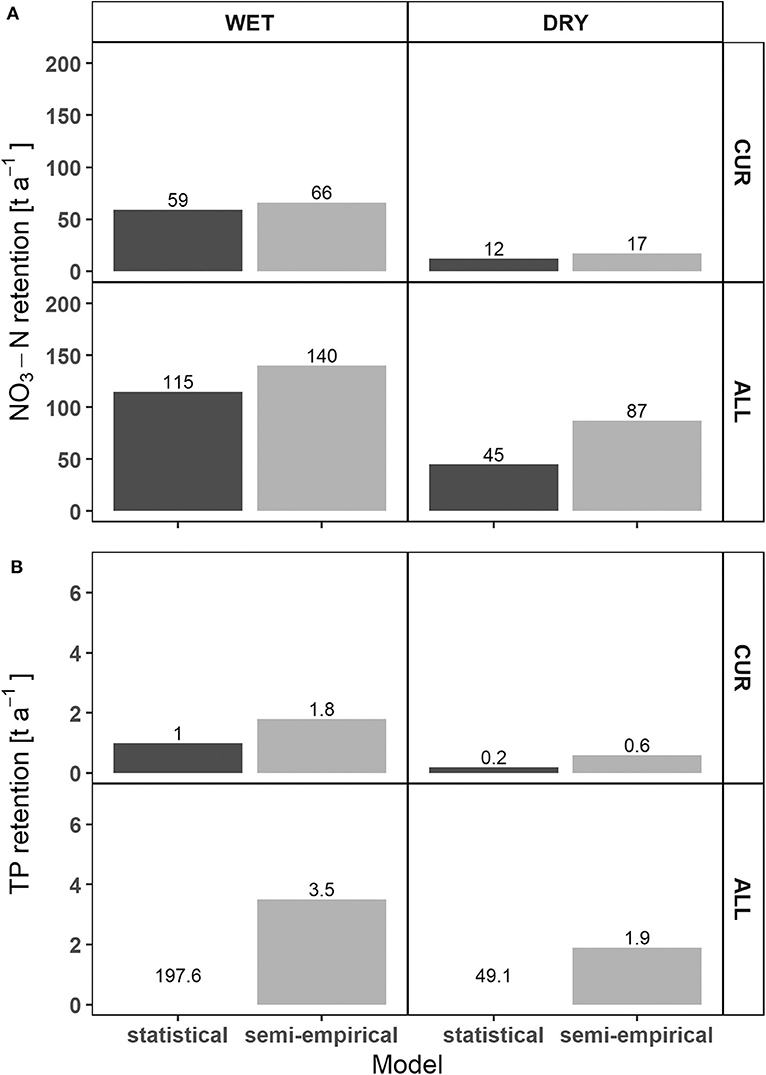
Figure 5. Comparison of absolute NO3-N (A) and TP (B) retention in the national park between statistical and semi-empirical models before and after restoration. For reasons of clarity, no bars for TP retention in the ALL scenario of the statistical model are displayed.
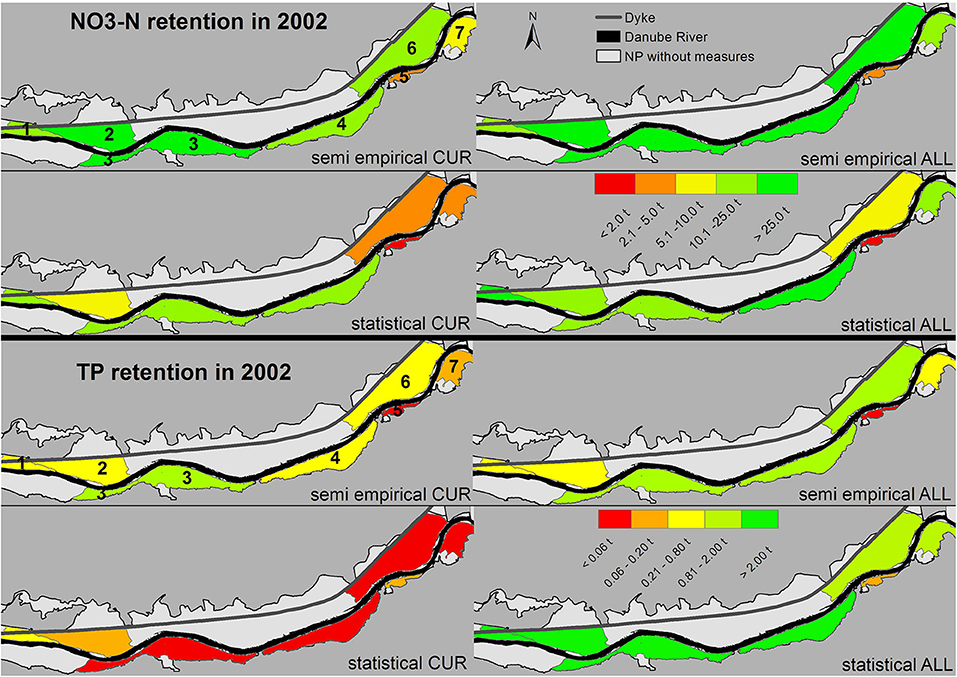
Figure 6. Contribution of each side arm system to NO3-N and TP retention in the wet year 2002 for the scenarios CUR and ALL. Numbers are given instead of side arm system names and explained in the text.
Nutrient Retention in the Range of Restoration Compared to Flooding Events
In the wet year 2002, the hydrograph exceeded the highest navigable discharge (HSQ) at 14 days (March, August and November), of which 12 days exceeded an annual flood. The semi-empirical model was found to adequately illustrate these events (Table 3). By including these events, the annual retention (t a−1) increased by a factor of 1.6 for TP (0.04% river load reduction) and even 1.9 for NO3-N (0.06% reduction) compared to discharges <5,130 m3 s−1. However, if all side arms were completely reconnected (ALL scenario), the annual retention <5,130 m3 s−1 would still exceed the current state including flooding events by a factor of 1.14 for both TP and NO3-N. If the 14 flooding events were then included in the ALL scenario, the factor would even rise to 1.9 (0.07% river load reduction) and 2.1 (0.1% river load reduction) for TP and NO3-N, respectively, compared to the current state. This finding supports once more the importance of frequent inundations for the efficient removal of nutrients from floodplains.
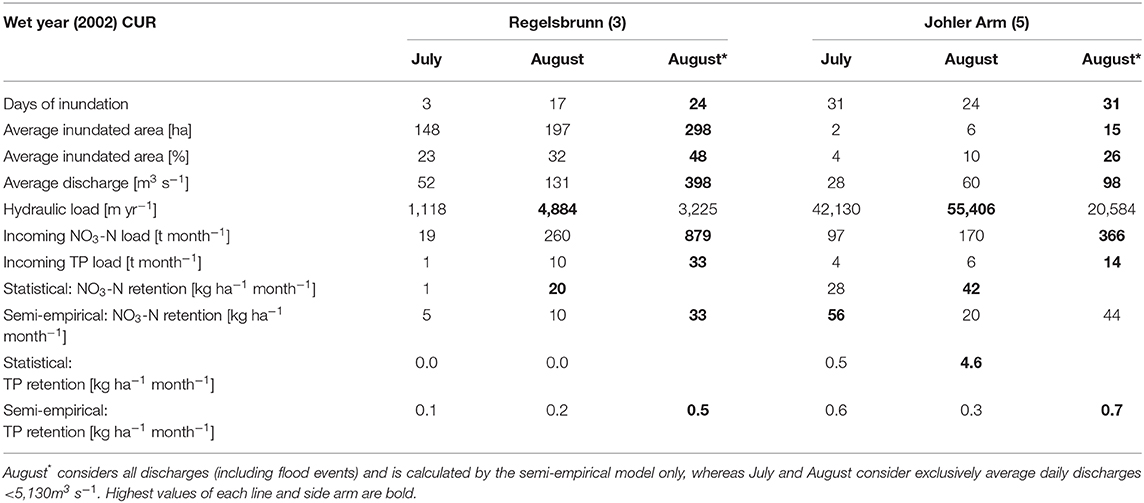
Table 3. Floodplain characteristics of two differently restored floodplains for July and August 2002 (wet year).
Discussion
Model Validation: Comparison of Calculated Retention Values With the Literature
A detailed model validation in terms of observable nutrient retention was not possible because there was no data available suitable for this purpose. Instead, we compared our model results in selected systems and with the literature values presented in Supplementary Tables 6, 7. Whereas, for TP our model results (CUR: 1.4–5.1 kg P ha−1 yr−1) lie rather in the lower to mean range of values, our calculated NO3-N retention (CUR: 65.5–114.5 kg NO3-N ha−1 yr−1) is in the mid- to upper range of values found. The variation in published areal retention rates is great, even though only floodplain systems in temperate areas were selected. Reasons for this may be attributed to differences in floodplain size, hydrological conditions, nutrient loading, vegetation type, sampling design, or retention mechanisms (Fisher and Acreman, 2004). In the case of TP, retention is partly a temporary process of sedimentation (Fisher and Acreman, 2004; Venterink et al., 2006) and a highly variable transport with increasing discharge. Noe et al. (2019) found positive net retention when sedimentation inputs of P were high and leaching rates were low, e.g., processes described by Hoffmann et al. (2012) and (Schönbrunner et al., 2012).
Modeled Drivers for NO3-N and TP Retention and Resulting Model Limitations
Discharge, Nutrient Load, HL, and Nutrient Concentration
Both models consider discharge to be an important driver affecting nutrient loads and hydrological connectivity, but in different ways. The discharge determines how much nutrient load enters the floodplain area, as well as the duration and areal extent of the connected floodplain area, which is considered in the semi-empirical model (Supplementary Figure 2). In the statistical model, discharge explains reductions in nutrient concentrations (Figure 2). Nutrient loads (Saunders and Kalff, 2001) and hydrological connectivity, both are reported to be among the most important factors for nutrient retention in riparian wetlands found in the literature (Fisher and Acreman, 2004). P and N concentrations in the Danube (0.02–2.1 mg TP L−1, mean 0.06 mg TP L−1 and 0.8–4.2 mg NO3-N L−1, mean 2.0 mg NO3-N L−1) were low in comparison to other large rivers in central Europe. This might explain the relatively low TP retention rates modeled in this study. Discharge also acts as a surrogate for water residence time (Behrendt and Opitz, 2000), explaining how long the hydraulic load lasts on the system (Natho et al., 2013). On a monthly basis, both models depict brief periods (hot moments according to McClain et al., 2003) that frequently account for a high percentage of the denitrification activity or total phosphorus retention (Table 3).
TP and its main component, particulate P, are transported at the highest concentration during high flows only for a short period during the year. Regarding the retention, a decrease is calculated according to the semi-empirical model due to very high HL, which does not allow sedimentation to occur even though the TP load is very high. Due to the dependence of the semi-empirical model on HL, it shows areal retention peaks (in kg ha−1 yr−1) after floods when the entering nutrient load is still high, but the HL is lower than during the flood peak. No correlation between HL (m d−1) and TP and NO3-N retention (mg m3 m−1) was detected (R2 < 0.02, p > 0.05) in the statistical model and is therefore not used as a predictor. TP retention is very likely to be overestimated by the statistical model for the ALL scenario, because higher retention with increasing connectivity and discharges is assumed. This severe overestimation stems from the use of the maximal retention rate measured and calculated in the smallest and highly connected Johler Arm (5) for all side arms after complete reconnection. Even though the impact of connectivity on retention efficiency was clearly visible, transfer to other side arms was only possible by assigning connectivity classes and upscaling systems of different scales.
The semi-empirical model uses area and nutrient loads as input data, which is also done by Kronvang et al. (1999) and Hoffmann et al. (2011). Both TP and NO3-N retention in the Regelsbrunn and Petronell side arms (3 and 4, Figure 1) is probably overestimated by the semi-empirical approach. Only four measurements of discharge-area pairs for each side arm system were available to calculate the sigmoidal relationship between discharge and connected area (specifically between Q/MQ = 2 and 5.2, Supplementary Figure 2). The inundation area, as a sigmoidal relationship reflecting the lateral hydrological connectivity, is crucial for calculating HL in the semi-empirical model. The larger the area, the smaller the HL and the more time needed for denitrification, as well as for total phosphorus to settle (Saunders and Kalff, 2001; Venterink et al., 2003). The statistical approach was developed independently of the area but based on a measured reduction in nutrient concentration with increasing distance from the inlet, as also reported by others (Kronvang et al., 1999; Saunders and Kalff, 2001; Venterink et al., 2003; Reckendorfer et al., 2013 in an isolated floodplain in the DFNP). Although the model does not consider favorable redox conditions in sediments or vegetation processes (Fennessy and Cronk, 1997; Fisher and Acreman, 2004; Venterink et al., 2006), it gives reliable estimations for TP retention in the range of the measurements. This is because TP is mainly transported in the particulate form; discharge and concentration are the main factors driving TP removal. However, concentrations or loads considered as the basis for retention can show inverse patterns (Natho and Venohr, 2014) because of the different behavior of nutrient concentrations with increasing discharge. This is also visible for the Johler Arm (5, Figure 1), where the decline of nutrient concentration was highest, although the semi-empirical model calculated the highest HL of all investigated side arms (Table 1, Supplementary Figure 2).
Due to insufficient data on nutrient concentrations at high water levels, the statistical mass balance approach lacks applicability to large flooding events (Q > 5,130 m3s−1), an essential period for nutrient transport, load and retention (Kronvang et al., 2007). TP concentrations in floodplains at very high Danube discharges are hardly measured, and thus information about retention in floodplains is very uncertain (Zessner et al., 2005). Venterink et al. (2003) showed that with an increasing share of discharge entering the floodplain of two Rhine tributaries, P retention tended to increase in absolute numbers, as also found by our statistical approach. However, retention efficiency is reported by the same authors to decrease when more than 15% of the main channel discharge enters the floodplain. Generally, pairwise measurements in times of surface water connection are rare, resulting in only 16 [Orth (2)] to 21 [Regelsbrunn (3)] data points on which the statistical model is built (Figure 2). The semi-empirical model, based on causalities at larger scales, shows more reasonable values for the ALL scenario and flood events than the statistical model. It is therefore more robust to model nutrient retention in other large river floodplain systems independent of water quality data in differently connected side arms. However, without comprehensive water quality data for the project area, the semi-empirical model cannot be sufficiently validated.
Contribution of Connectivity vs. Isolation to Nutrient Retention
In the initial phase of disconnection, inorganic nutrients decline rapidly, but with increasing duration of disconnection internal nutrient cycling processes dominate as organic forms prevail, leading to very low nutrient removal rates in the side arms (Hein et al., 2004; Forshay and Stanley, 2005). Whereas, NO3-N is removed in both disconnected and connected states to different extents, no storage of TP is detected during periods of isolation, as transport depends on hydraulic connection (Noe and Hupp, 2005). Low levels of connectivity and low discharges lead to a net release of TP, whereas higher discharges result in increasing absolute TP storage (Figure 2). This lower connectivity can lead to alternations between periods of desiccation and inundation, which enhances phosphorus release upon re-wetting, and in turn could enable eutrophication processes (Schönbrunner et al., 2012). However, in the long run a decrease in phosphorus release after restoration may occur (Noe et al., 2019). This stresses once more the importance of nutrient inputs for system functioning, either through high flows or more frequent inundation following reconnection. Reflecting the results from the statistical model, we conclude for the semi-empirical model that on the yearly basis NO3-N retention might be negligible on the decoupled floodplain, whereas at finer temporal resolutions a proxy is needed that considers ongoing nutrient retention and release during the (initial) phase of reconnection.
Seasonality
Apart from the HL and nutrient concentrations mentioned above, denitrification is influenced mainly by temperature and oxygen concentrations, whereby the former is also included in the semi-empirical model. In opposition to TP, the higher modeled NO3-N retention can be attributed to seasonality. This was considered by taking the water temperature into account, which serves as a proxy for increased biological activity of denitrifying bacteria at higher water temperatures and higher nutrient loads in summer. Consequently, lower NO3-N concentrations in summer were observed in the Danube as reported for other rivers at higher water temperatures (Behrendt and Opitz, 2000; Saunders and Kalff, 2001; Venohr, 2006; Zweimüller et al., 2008). The semi-empirical model considered denitrification as the dominant removal process for nitrates in the DFNP, which is supported by mesocosm experiments by Welti et al. (2012).
An increase in water temperature is concurrent with a decrease in water column oxygen concentration, which in turn promotes denitrification rates (Groffman et al., 2009). In 2002, higher water temperatures of the summer floods outbalanced the high HL because metabolic rates of denitrifiers allow rapid turnover in the case of NO3-N availability at the sediment water interface (Forshay and Stanley, 2005; Craig et al., 2008). Therefore, it can be concluded that the semi-empirical model is more reliable when predicting hot moments for nitrogen removal. In contrast, the statistical model calculates the highest retention rates during floods reflecting the hydrograph (Figure 4), since discharge and dependent nutrient transport are the only variables in the statistical retention model. Nutrient concentrations in side arms were investigated in different projects scattered along a timespan of two decades, and measurements were not taken in the months of January and February, meaning that the annual temperature range was not represented in the data set and summer was overrepresented. In order to eliminate error sources of this kind, continuous concentration measurements in the remaining side arms in the DFNP and at high discharges are required.
Answering our first research question, we can summarize that the two models calculate similar trends in nutrient retention regarding yearly values for the whole area. Considering biogeochemically hot moments, the models depict different patterns due to their different consideration of driving factors. Consequently, both models complement each other. We suggest the semi-empirical model when considering the national park as a whole. When evaluating the effect of small-scale restoration measures, like single side arm reconnections, the statistical model can complement the estimation with more detailed outcomes during phases of isolation and reconnection.
Effect of Side Arm Reconnection and Flooding on Nutrient Retention
The results of both models clearly show that the effect of restoration in the study region is the improvement of lateral hydrological connectivity and thus more frequent inundation, so-called “hot moments” (McClain et al., 2003). In our models, more frequent and thus higher nutrient input into floodplains leads to higher absolute nutrient retention (Newcomer Johnson et al., 2016; Noe et al., 2019) because of higher accumulation rates of N and P (Noe and Hupp, 2005) and greater removal of reactive nitrogen with increasing load (Jordan et al., 2011). Frequent inundations with less destructive power are important, because N removal efficiency (%) is reported to decrease with higher N load (Fisher and Acreman, 2004; Bernot and Dodds, 2005; Venohr, 2006; Jordan et al., 2011). Similar findings, though less pronounced, are described for TP retention (%) in wetlands (Reddy et al., 1999; Fisher and Acreman, 2004). Because of its ability to be released, not only with increasing incoming load, but with increasing duration of input, phosphorus retention efficiency in floodplains may decline (Fisher and Acreman, 2004).
In combination with connectivity and nutrient load inputs, Newcomer Johnson et al. (2016) showed in an extensive review that nutrient retention in floodplains could be enhanced through restoration, leading to increased water surface area and increased hydraulic residence time. In both models, discharge is a determinant for inundated area, days of inundation and incoming nutrient load. The highest retention in the statistical model is found in frequently connected areas with high nutrient load inputs, following rising patterns of the hydrograph. On the other hand, the highest retention rates found by the semi-empirical model occur in flat topographies with high input loads [e.g., Regelsbrunn (3)], where area increases disproportionately faster compared to the discharge, hence reducing HL and flow velocity. Maaß and Schüttrumpf (2019) also model more effective sedimentation in restored, lowered floodplains than in restored, elevated rivers. Saunders and Kalff (2001) and Craig et al. (2008) confirm that low flow velocities increase retention through longer water-sediment contact time, which is responsible for denitrification and sedimentation. Under current conditions (CUR) inundation happens less frequently, but if it does happen, the area is larger on average. In contrast, under higher connectivity levels, inundation happens more frequently, leading to reduced average areas but longer inundation periods of far more days. This indicates the importance of small inundation events with low HL for effective nutrient retention and further underlines the importance of improved lateral hydrological connectivity of the whole floodplain, not only selected side arms, as the main goal of floodplain restoration. Furthermore, prioritizing reconnection of larger side arm systems creates synergies of high retention potential with the provision of habitat for protected and endangered rheophilic communities (Funk et al., 2013, 2019).
In summary, increasing connectivity and its consequences for retention is estimated differently by the two models, but generally leads to higher retention, in answer to our second research question.
How Much Connected Floodplain Area Do We Need to Reduce Nutrient Loads in the Upper Danube River by 1%?
We considered a total of 3,200 ha of floodplains that can be inundated with a probability of once every 30 years, making up one-third of the DFNP. This is the lowest probability found in Flood Hazard Maps showing inundation of all the floodplains already considered. With an average inundation area of 481 ha (wet) and 282 (dry), which we would call a very well-connected floodplain, the semi-empirical model calculated for the ALL scenario a river load reduction of 0.07–0.1% for NO3-N and 0.05–0.07% for TP. This seems to be very little and would not be detectable in the river. However, we analyzed a stretch of only 30 km and argue that the floodplain area is very small compared to the river size. Thus, we ask the question: How much well-connected floodplain area would be needed to achieve a nutrient retention of 1% of the yearly transported river load? A one-percent decrease in river load would already be detectable and within an achievable range in the light of our modeled retention efficiencies.
From our model results, we can conclude an areal retention rate of up to 334 (dry)−400 (wet) kg NO3-N ha−1 yr−1 and 7 (dry)−9 (wet) kg TP ha−1 yr−1. A river load of 199,000 t dissolved inorganic nitrogen and 6,700 t TP is reported by ICPDR (2002). To achieve a retention of 1% of the river load in a wet year, we would need 4,975 ha for NO3-N and 7,444 ha for TP. As we stated above, only 15% of the DFNP is flooded on a regularly basis, which would then result in a floodplain area 10.4 and 15.5 times larger than the DFNP. Alternatively, on a 100 km river stretch we would need a floodplain that is 0.5 km wide on each side for NO3-N and 0.75 km for TP. In the dry year, the Danube transported 119,015 t DIN and 2,699 t TP (ICPDR, 2003). The area required to remove 1% of this load is 3,563 ha for NO3-N and 3,856 ha for TP. Considering an average inundated area of only 9%, an area of about 12.6 and 13.7 times the DFNP is required for a 1% removal of NO3-N and TP.
We suggest increasing reconnection not only through side arm connection but also by allowing overbank flow, which inundates the entire floodplain complex during frequent floods with lower water levels (annual floods). This increases river-floodplain interactions and might lead to higher sedimentation and phosphorus and N-enriched sediment deposition (Maaß and Schüttrumpf, 2019; Noe et al., 2019). Despite the clear evidence that the re-establishment of hydrological pulsing increases denitrification and decreases emissions of greenhouse gases (Mitsch et al., 2008; Welti et al., 2012), we are aware that nutrient retention in restored floodplain areas is a complex topic and that the potential for phosphate release from soils of floodplains with restored wetland hydrology is a large concern. Although some PO4-P release processes might occur after floodplain reconnection (Figure 2; Aldous et al., 2007; Schönbrunner et al., 2012), over the long run positive net retention after restoration will appear (Owens and Walling, 2002; Noe and Hupp, 2005; Venterink et al., 2006; Wassen and Olde Venterink, 2006; Anderson and Mitsch, 2007; Noe et al., 2019).
Based on these considerations, we can answer our third research question and confirm that the measures planned in the ALL scenario will not be enough to retain a significant amount of nutrients (1% threshold). Only when reconnection at low flow conditions leads to very frequent inundation of the floodplain area as a whole could a significant amount of river nutrient load be retained in the DNFP. Finally, knowing that floodplain restoration may increase the multi-functionality of these ecosystems worthy of protection, it should still be our major goal to manage water quality primarily through reduction of punctual and diffuse nutrient emissions into river systems rather than filtering out pollutants afterwards.
Conclusion
So far, only four side arm systems in the DFNP were partially reconnected to different degrees, resulting in no noticeable reduction of nutrients transported in the Danube River. Even though the two models were built upon different backgrounds, hydrological connectivity has shown to be the common main driver determining the amounts of nutrients to be retained by the floodplains. From our results, we conclude that if more area were frequently inundated by reconnecting all proposed side arms, an increased reduction in transported nutrient load could be achieved. To achieve a retention of 1% of the total load, 10–15.5 times more re-connected floodplain area is necessary. Frequent inundations are a prerequisite not only for effective nutrient retention through denitrification and sedimentation, but also for typical floodplain habitat provisioning, and could positively influence the multi-functionality of floodplains.
By applying two fundamentally different models, we were able not only to generate a more comprehensive understanding by elucidating common driving factors, but also to point out general or specific limitations to modeling nutrient retention, including reduced data availability and the detailed description of extreme events. Whereas, the strength of the semi-empirical model is the calculation of nutrient retention on a larger scale and during a wider range of discharges, the statistical approach is able to represent the current retention functions in more detail on a smaller scale. Overall, it was our aim to quantify the current state and the achievable potential of the DFNP in light of nutrient retention and floodplain restoration. We could show for the first time that the effect of complete reconnection of side arms leads to higher nutrient retention than sole flooding events in an extreme wet year without better connectivity—but the investigated floodplain stretch is still too small to considerably reduce nutrient loads in the Upper Danube.
Due to the complexity of river floodplains, quantification of nutrient retention potential remains challenging, but is an important management issue. With our results, we contribute to a better understanding of this ecosystem service, which helps to tailor future restoration programs to the needs of nature and society.
Data Availability Statement
Data are available upon request from the authors or at following publicly accessible databases: https://ehyd.gv.at/, https://www.eea.europa.eu/data-and-maps/data/natura-10/natura-2000-spatial-data, https://wasser.umweltbundesamt.at/h2odb/, https://maps.wisa.bmnt.gv.at/hochwasser, http://www.cmsaf.eu/pum.
Author Contributions
SN set up the semi-empirical model, wrote the first draft of the manuscript, carried out the formatting and created the maps (Figures 1, 6) as well as Supplementary Tables 3–5 and Supplementary Figures 1, 3. MT developed the statistical model supported by TH, wrote the section on the statistical model as well as the management scenarios, carried out the literature research on nutrient retention values in floodplains, and created Figures 2–5, and in the Supplementary Tables 1, 2, 6, 7 and Supplementary Figures 3, 4. SN and MT jointly created Tables 1–3. TH developed the design of this model comparison and made available the data on measurements. EB-K initially launched the BEDOM project and contributed to sections 1 and 4. All authors contributed to the manuscript revision and read and approved the submitted version.
Funding
This project was funded by Deutsche Forschungsgemeinschaft Project No. 390612937, viadonau (BEDOM), and H2020 (Danubius PP, Grant Agreement No. 739562).
Conflict of Interest
WasserCluster Lunz - Biologische Station GmbH is a non-profit research institute owned by three universities (University of Vienna, Danube University Krems, and University of Natural Resources and Life Sciences, Vienna) and is non-commercial.
The authors declare that the research was conducted in the absence of any commercial or financial relationships that could be construed as a potential conflict of interest.
Acknowledgments
We are grateful to be able to complete this article with funding from the Austrian Waterway Authority viadonau for the project BEDOM, the EU-Horizon 2020 for the project Danubius-PP and Deutsche Forschungsgemeinschaft for the Project No. 390612937. Additionally, we want to thank all those gathering the water quality and hydraulic data that we used for our work in the above-mentioned publications and the FWF project P19907-B17. We also thank two reviewers for their constructive comments helping to improve the first version of the manuscript.
Supplementary Material
The Supplementary Material for this article can be found online at: https://www.frontiersin.org/articles/10.3389/fenvs.2020.00074/full#supplementary-material
References
Aldous, A. R., Craft, C. B., Stevens, C. J., Barry, M. J., and Bach, L. B. (2007). Soil phosphorus release from a restoration wetland, Upper Klamath Lake, Oregon. Wetlands 27, 1025–1035. doi: 10.1672/0277-5212(2007)27[1025:SPRFAR]2.0.CO;2
Amoros, C., and Bornette, G. (2002). Connectivity and biocomplexity in waterbodies of riverine floodplains. Freshw. Biol. 47, 761–776. doi: 10.1046/j.1365-2427.2002.00905.x
Anderson, C., and Mitsch, W. (2007). Sediment, carbon, and nutrient accumulation at two 10-year-old created riverine marshes. Wetlands 26, 779–792. doi: 10.1672/0277-5212(2006)26[779:SCANAA]2.0.CO;2
Behrendt, H., and Opitz, D. (2000). Retention of nutrients in river systems: dependence on specific runoff and hydraulic load. Hydrobiologia 410, 111–122. doi: 10.1023/A:1003735225869
Bernot, M. J., and Dodds, W. K. (2005). Nitrogen retention, removal, and saturation in lotic ecosystems. Ecosystems 8, 442–453. doi: 10.1007/s10021-003-0143-y
Bowes, M. J., Smith, J. T., Jarvie, H. P., and Neal, C. (2008). Modelling of phosphorus inputs to rivers from diffuse and point sources. Sci. Total Environ. 395, 125–138. doi: 10.1016/j.scitotenv.2008.01.054
Boyer, E. W., Alexander, R. B., Parton, W. J., Li, C., Butterbach-Bahl, K., Donner, S. D., et al. (2006). Modeling denitrification in terrestrial and aquatic ecosystems at regional scales. Ecol. Appl. 16, 2123–2142. doi: 10.1890/1051-0761(2006)016[2123:MDITAA]2.0.CO;2
Brunet, R. C., Pinay, G., Gazelle, F., and Roques, L. (1994). Role of the floodplain and riparian zone in suspended matter and nitrogen retention in the adour river, south-west France. Regul. Rivers Res. Manage. 9, 55–63. doi: 10.1002/rrr.3450090106
Chen, Y.-C., Liu, J.-H., Kuo, J.-T., and Lin, C.-F. (2013). Estimation of phosphorus flux in rivers during flooding. Environ. Monitor. Assess. 185, 5653–5672. doi: 10.1007/s10661-012-2974-5
Craig, L. S., Palmer, M. A., Richardson, D. C., Filoso, S., Bernhardt, E. S., Bledsoe, B. P., et al. (2008). Stream restoration strategies for reducing river nitrogen loads. Front. Ecol. Environ. 6, 529–538. doi: 10.1890/070080
Fennessy, S., and Cronk, J. (1997). The effectiveness and restoration potential of riparian ecotones for the management of nonpoint source pollution, particularly nitrate. Crit. Rev. Environ. Sci. Technol. 27, 285–317. doi: 10.1080/10643389709388502
Fisher, J., and Acreman, M. C. (2004). Wetland nutrient removal: a review of the evidence. Hydrol. Earth Syst. Sci. 8, 673–685. doi: 10.5194/hess-8-673-2004
Forshay, K. J., and Stanley, E. H. (2005). Rapid nitrate loss and denitrification in a temperate river floodplain. Biogeochemistry 75, 43–64. doi: 10.1007/s10533-004-6016-4
Funk, A., Gschöpf, C., Blaschke, A. P., Weigelhofer, G., and Reckendorfer, W. (2013). Ecological niche models for the evaluation of management options in an urban floodplain—conservation vs. restoration purposes. Environ. Sci. Policy 34, 79–91. doi: 10.1016/j.envsci.2012.08.011
Funk, A., Martínez-López, J., Borgwardt, F., Trauner, D., Bagstad, K. J., Balbi, S., et al. (2019). Identification of conservation and restoration priority areas in the Danube River based on the multi-functionality of river-floodplain systems. Sci. Total Environ. 654, 763–777. doi: 10.1016/j.scitotenv.2018.10.322
Groffman, P. M., Butterbach-Bahl, K., Fulweiler, R. W., Gold, A. J., Morse, J. L., Stander, E. K., et al. (2009). Challenges to incorporating spatially and temporally explicit phenomena (hotspots and hot moments) in denitrification models. Biogeochemistry 93, 49–77. doi: 10.1007/s10533-008-9277-5
Gumiero, B., Boz, B., Cornelio, P., and Casella, S. (2011). Shallow groundwater nitrogen and denitrification in a newly afforested, subirrigated riparian buffer. J. Appl. Ecol. 48, 1135–1144. doi: 10.1111/j.1365-2664.2011.02025.x
Gumiero, B., Mant, J., Hein, T., Elso, J., and Boz, B. (2013). Linking the restoration of rivers and riparian zones/wetlands in Europe: Sharing knowledge through case studies. Ecol. Eng. 56, 36–50. doi: 10.1016/j.ecoleng.2012.12.103
Habersack, H., Hein, T., Stanica, A., Liska, I., Mair, R., Jäger, E., et al. (2016). Challenges of river basin management: current status of, and prospects for, the River Danube from a river engineering perspective. Sci. Total Environ. 543, 828–845. doi: 10.1016/j.scitotenv.2015.10.123
Heiler, G., Hein, T., Schiemer, F., and Bornette, G. (1995). Hydrological connectivity and flood pulses as the central aspects for the integrity of a river-floodplain system. Regul. Rivers Res. Manage. 11, 351–361. doi: 10.1002/rrr.3450110309
Hein, T., Baranyi, C., and Reckendorfer, W. (2002). Bedeutung der hydrologischen Vernetzung für die hydrochemische Situation der Augewässer im Bereich Orth/Donau. Wissenschaftliche Reihe des Nationalpark Donauauen, 10.
Hein, T., Baranyi, C., and Reckendorfer, W. (2003). Einfluss von Öffnungsmaßnahmen auf die hydrochemische Situation und die planktischen Prozesse in einem dynamischen Ausystem— The impact of restoration measures on the hydrochemical Situation and pelagic processes in a dynamic floodplain segment. Abhandlungen der Zoologisch-Botanischen Gesellschaft in Österreich, 31–46.
Hein, T., Baranyi, C., Reckendorfer, W., and Schiemer, F. (2004). The impact of surface water exchange on the nutrient and particle dynamics in side-arms along the River Danube, Austria. Sci. Total Environ. 328, 207–218. doi: 10.1016/j.scitotenv.2004.01.006
Hein, T., Heiler, G., Pennetzdorfer, D., Riedler, P., Schagerl, M., and Schiemer, F. (1999). The Danube restoration project: functional aspects and planktonic productivity in the floodplain system. Regul. Rivers Res. Manage. 15, 259–270. doi: 10.1002/(SICI)1099-1646(199901/06)15:1/3<259::AID-RRR539>3.0.CO;2-E
Hoagland, B., Schmidt, C., Russo, T. A., Adams, R., and Kaye, J. (2019). Controls on nitrogen transformation rates on restored floodplains along the Cosumnes River, California. Sci. Total Environ. 649, 979–994. doi: 10.1016/j.scitotenv.2018.08.379
Hoffmann, C., Kjaergaard, C., Uusi-Kämppä, J., Hansen, H., and Kronvang, B. (2009). Phosphorus retention in riparian buffers: review of their efficiency. J. Environ. Qual. 38, 1942–1955. doi: 10.2134/jeq2008.0087
Hoffmann, C. C., Heiberg, L., Audet, J., Schønfeldt, B., Fuglsang, A., Kronvang, B., et al. (2012). Low phosphorus release but high nitrogen removal in two restored riparian wetlands inundated with agricultural drainage water. Ecol. Eng. 46, 75–87. doi: 10.1016/j.ecoleng.2012.04.039
Hoffmann, C. C., Kronvang, B., and Audet, J. (2011). Evaluation of nutrient retention in four restored Danish riparian wetlands. Hydrobiologia 674, 5–24. doi: 10.1007/s10750-011-0734-0
Hohensinner, S., Herrnegger, M., Blaschke, A. P., Habereder, C., Haidvogl, G., Hein, T., et al. (2008). Type-specific reference conditions of fluvial landscapes: a search in the past by 3D-reconstruction. CATENA 75, 200–215. doi: 10.1016/j.catena.2008.06.004
Hopkins, K. G., Noe, G. B., Franco, F., Pindilli, E. J., Gordon, S., Metes, M. J., et al. (2018). A method to quantify and value floodplain sediment and nutrient retention ecosystem services. J. Environ. Manage. 220, 65–76. doi: 10.1016/j.jenvman.2018.05.013
House, W. (2003). Geochemical cycling of phosphorus in rivers. Appl. Geochem. 18, 739–748. doi: 10.1016/S0883-2927(02)00158-0
ICPDR (2002). Water Quality in the Danube River Basin (TNMN-Yearbook). Vienna: International Commission for the Protection of the Danube River.
ICPDR (2017). Water Quality in the Danube River Basin - 2015. TNMN – Yearbook 2015, ed I. Liska. Vienna: International Commission for the Protection of the Danube River.
Jordan, S. J., Stoffer, J., and Nestlerode, J. A. (2011). Wetlands as sinks for reactive nitrogen at continental and global scales: a meta-analysis. Ecosystems 14, 144–155. doi: 10.1007/s10021-010-9400-z
Keizer, F. M., Van der Lee, G. H., Schot, P. P., Kardel, I., Barendregt, A., and Wassen, M. J. (2018). Floodplain plant productivity is better predicted by particulate nutrients than by dissolved nutrients in floodwater. Ecol. Eng. 119, 54–63. doi: 10.1016/j.ecoleng.2018.05.024
Kronvang, B., Andersen, I. K., Hoffmann, C. C., Pedersen, M. L., Ovesen, N., et al. (2007). Water exchange and deposition of sediment and phosphorus during inundation of natural and restored lowland floodplains. Water Air Soil Pollut. 181, 115–121. doi: 10.1007/s11270-006-9283-y
Kronvang, B., Falkum, Ø., Svendsen, L. M., and Laubel, A. (2002). Deposition of sediment and phosphorus during overbank flooding. Int. Vereinigung Theor. Angew. Limnol. Verhandlungen 28, 1289–1293. doi: 10.1080/03680770.2001.11902664
Kronvang, B., Hoffmann, C. C., Svendsen, L. M., Windolf, J., Jensen, J. P., and Dørge, J. (1999). Retention of nutrients in river basins. Aquat. Ecol. 33, 29–40. doi: 10.1023/A:1009947907811
Maaß, A.-L., and Schüttrumpf, H. (2019). Reactivation of floodplains in river restorations: long-term implications on the mobility of floodplain sediment deposits. Water Resourc. Res. 55, 8178–8196. doi: 10.1029/2019WR024983
McClain, M. E., Boyer, E. W., Dent, C. L., Gergel, S. E., Grimm, N. B., Groffman, P. M., et al. (2003). Biogeochemical hot spots and hot moments at the interface of terrestrial and aquatic ecosystems. Ecosystems 6, 301–312. doi: 10.1007/s10021-003-0161-9
Millborow, S. (2015). Earth: Multivariate Adaptive Regression Splines. R Package Version 4.0. Available online at: http://CRAN.R-project.org/package=earth
Mitsch, W. J., Zhang, L., Fink, D. F., Hernandez, M. E., Altor, A. E., Tuttle, C. L., et al. (2008). Ecological engineering of floodplains. Ecohydrol. Hydrobiol. 8, 139–147. doi: 10.2478/v10104-009-0010-3
Mölder, A., and Schneider, E. (2011). On the beautiful diverse Danube? Danubian floodplain forest vegetation and flora under the influence of river eutrophication. River Res. Appl. 27, 881–894. doi: 10.1002/rra.1403
Natho, S., and Venohr, M. (2012). Nutrient retention in riparian floodplains on landscape scale, the necessity for a monthly retention approach. Water Sci. Technol. 66, 2800–2807. doi: 10.2166/wst.2012.531
Natho, S., and Venohr, M. (2014). Active versus potential floodplains–the effect of small flood events on nutrient retention along the river Elbe corridor (Germany). Aquat. Sci. 76, 633–642. doi: 10.1007/s00027-014-0360-9
Natho, S., Venohr, M., Henle, K., and Schulz-Zunkel, C. (2013). Modelling nitrogen retention in floodplains with different degrees of degradation for three large rivers in Germany. J. Environ. Manage. 122, 47–55. doi: 10.1016/j.jenvman.2013.02.049
Newcomer Johnson, A. T., Kaushal, S. S., Mayer, M. P., Smith, M. R., and Sivirichi, M. G. (2016). Nutrient retention in restored streams and rivers: a global review and synthesis. Water 8:116. doi: 10.3390/w8040116
Noe, G. B., Boomer, K., Gillespie, J. L., Hupp, C. R., Martin-Alciati, M., Floro, K., et al. (2019). The effects of restored hydrologic connectivity on floodplain trapping vs. release of phosphorus, nitrogen, and sediment along the Pocomoke River, Maryland USA. Ecol. Eng. 138, 334–352. doi: 10.1016/j.ecoleng.2019.08.002
Noe, G. B., and Hupp, C. R. (2005). Carbon, nitrogen, and phosphorus accumulation in floodplains of Atlantic coastal plain rivers, USA. Ecol. Appl. 15, 1178–1190. doi: 10.1890/04-1677
Opperman, J. J., Luster, R., McKenney, B. A., Roberts, M., and Meadows, A. W. (2010). Ecologically functional floodplains: connectivity, flow regime, and scale. JAWRA J. Am. Water Resour. Assoc. 46, 211–226. doi: 10.1111/j.1752-1688.2010.00426.x
Owens, P. N., and Walling, D. E. (2002). Changes in sediment sources and floodplain deposition rates in the catchment of the River Tweed, Scotland, over the last 100 years: the impact of climate and land use change. Earth Surface Proc. Landforms 27, 403–423. doi: 10.1002/esp.327
Pywell, R. F., Bullock, J. M., Roy, D. B., Warman, L., Walker, K. J., and Rothery, P. (2003). Plant traits as predictors of performance in ecological restoration. J. Appl. Ecol. 40, 65–77. doi: 10.1046/j.1365-2664.2003.00762.x
Reckendorfer, W., Funk, A., Gschöpf, C., Hein, T., and Schiemer, F. (2013). Aquatic ecosystem functions of an isolated floodplain and their implications for flood retention and management. J. Appl. Ecol. 50, 119–128. doi: 10.1111/1365-2664.12029
Reckendorfer, W., and Steel, A. (2004). Effects of hydrological connectivity on hydrology, morphology and sediments. Abhandlungen der Zoologisch-Botanischen Gesellschaft in Österreich 34, 19–30. Available online at: https://www.zobodat.at/publikation_volumes.php?id=29798
Reddy, K. R., Kadlec, R. H., Flaig, E., and Gale, P. M. (1999). Phosphorus retention in streams and Wetlands: a review. Crit. Rev. Environ. Sci. Technol. 29, 83–146. doi: 10.1080/10643389991259182
Saunders, D. L., and Kalff, J. (2001). Nitrogen retention in wetlands, lakes and rivers. Hydrobiologia 443, 205–212. doi: 10.1023/A:1017506914063
Schober, B., Hauer, C., and Habersack, H. (2015). A novel assessment of the role of Danube floodplains in flood hazard reduction (FEM method). Natural Hazards 75, 33–50. doi: 10.1007/s11069-013-0880-y
Schönbrunner, I. M., Preiner, S., and Hein, T. (2012). Impact of drying and re-flooding of sediment on phosphorus dynamics of river-floodplain systems. Sci. Total Environ. 432, 329–337. doi: 10.1016/j.scitotenv.2012.06.025
Spieles, D. J., and Mitsch, W. J. (1999). The effects of season and hydrologic and chemical loading on nitrate retention in constructed wetlands: a comparison of low- and high-nutrient riverine systems. Ecol. Eng. 14, 77–91. doi: 10.1016/S0925-8574(99)00021-X
Theriot, J. M., Conkle, J. L., Reza Pezeshki, S., DeLaune, R. D., and White, J. R. (2013). Will hydrologic restoration of Mississippi River riparian wetlands improve their critical biogeochemical functions? Ecol. Eng. 60, 192–198. doi: 10.1016/j.ecoleng.2013.07.021
Thorp, J. H., Flotemersch, J. E., Delong, M. D., Casper, A. F., Thoms, M. C., Ballantyne, F., et al. (2010). Linking ecosystem services, rehabilitation, and river hydrogeomorphology. BioScience 60, 67–74. doi: 10.1525/bio.2010.60.1.11
Tockner, K., Bunn, S., Gordon, C., Naiman, R., Quinn, G., and Stanford, J. (2008). “Flood plains: critically threatened ecosystems,” in Aquatic Ecosystems: Trends and Global Prospects, ed N. Polunin (Cambridge: Cambridge University Press), 45–62.
Venohr, M. (2006). “Modellierung der Einflüsse von Temperatur, Abfluss und Hydromorphologie auf die Strickstoffretention in Flusssystemen,” in Berliner Beiträge zur Ökologie 14 (Berlin: Weißensee Verlag), p. 193.
Venohr, M., Hirt, U., Hofmann, J., Opitz, D., Gericke, A., Wetzig, A., et al. (2011). Modelling of nutrient emissions in river systems – MONERIS – methods and background. Int. Rev. Hydrobiol. 96, 435–483. doi: 10.1002/iroh.201111331
Venterink, H. O., Davidsson, T. E., Kiehl, K., and Leonardson, L. (2002). Impact of drying and re-wetting on N, P and K dynamics in a wetland soil. Plant Soil 243, 119–130. doi: 10.1023/A:1019993510737
Venterink, H. O., Vermaat, J. E., Pronk, M., Wiegman, F., Lee, G. E. M., van den Hoorn, L. W. G., et al. (2006). Importance of sediment deposition and denitrification for nutrient retention in floodplain wetlands. Appl. Vegetat. Sci. 9, 163–174. doi: 10.1111/j.1654-109X.2006.tb00665.x
Venterink, H. O., Wiegman, F., Van der Lee, G. E. M., and Vermaat, J. E. (2003). Role of active floodplains for nutrient retention in the River Rhine. J. Environ. Qual. 32, 1430–1435. doi: 10.2134/jeq2003.1430
Viadonau (2015). Fachtagung Pilotprojekt Bad Deutsch-Altenburg: Erkenntnisse für Schifffahrt, Ökologie und Flussbau. Vienna: BOKU.
Wassen, M., and Olde Venterink, H. (2006). Comparison of nitrogen and phosphorus fluxes in some European fens and floodplains. Appl. Vegetat. Sci. 9, 213–222. doi: 10.1111/j.1654-109X.2006.tb00670.x
Weigelhofer, G., Preiner, S., Funk, A., Bondar-Kunze, E., and Hein, T. (2015). The hydrochemical response of small and shallow floodplain water bodies to temporary surface water connections with the main river. Freshw. Biol. 60, 781–793. doi: 10.1111/fwb.12532
Welti, N., Bondar-Kunze, E., Tritthart, M., Pinay, G., and Hein, T. (2012). Nitrogen dynamics in complex Danube River floodplain systems: effects of restoration. River Syst. 20, 71–85. doi: 10.1127/1868-5749/2011/0047
Zessner, M., and Gils, J. (2002). Nutrient fluxes from the Danube Basin to the Black Sea. Water Sci. Technol. 46, 9–17. doi: 10.2166/wst.2002.0134
Zessner, M., and Kroiss, H. (1999). Retention and losses of nutrients in the hydrosphere of Austria. Water Sci. Technol. 40, 59–66. doi: 10.2166/wst.1999.0502
Zessner, M., Postolache, C., Clement, A., Kovacs, A., and Strauss, P. (2005). Considerations on the influence of extreme events on the phosphorus transport from river catchments to the sea. Water Sci. Technol. 51, 193–204. doi: 10.2166/wst.2005.0406
Keywords: floodplain, lateral hydrological connectivity, Danube, restoration, reconnection, inundation, nutrient retention, modeling
Citation: Natho S, Tschikof M, Bondar-Kunze E and Hein T (2020) Modeling the Effect of Enhanced Lateral Connectivity on Nutrient Retention Capacity in Large River Floodplains: How Much Connected Floodplain Do We Need? Front. Environ. Sci. 8:74. doi: 10.3389/fenvs.2020.00074
Received: 12 December 2019; Accepted: 18 May 2020;
Published: 18 June 2020.
Edited by:
Sergi Sabater, University of Girona, SpainReviewed by:
Stefanos Xenarios, Nazarbayev University, KazakhstanVinicius Fortes Farjalla, Federal University of Rio de Janeiro, Brazil
Copyright © 2020 Natho, Tschikof, Bondar-Kunze and Hein. This is an open-access article distributed under the terms of the Creative Commons Attribution License (CC BY). The use, distribution or reproduction in other forums is permitted, provided the original author(s) and the copyright owner(s) are credited and that the original publication in this journal is cited, in accordance with accepted academic practice. No use, distribution or reproduction is permitted which does not comply with these terms.
*Correspondence: Stephanie Natho, bmF0aG9AdW5pLXBvdHNkYW0uZGU=
†These authors have contributed equally to this work