 Jennifer A. Drummond1*
 Eric R. Larson2
 Yiyuan Li3
 David M. Lodge4,5Crysta A. Gantz3
 Michael E. Pfrender3Mark A. Renshaw3
 Adrienne M. S. Correa1
 Scott P. Egan1
- 1Department of BioSciences, Rice University, Houston, TX, United States
- 2Department of Natural Resources and Environmental Sciences, University of Illinois, Champaign, IL, United States
- 3Department of Biological Sciences, University of Notre Dame, Notre Dame, IN, United States
- 4Department of Ecology and Evolutionary Biology, Cornell University, Ithaca, NY, United States
- 5Cornell Atkinson Center for Sustainability, Cornell University, Ithaca, NY, United States
Environmental DNA (eDNA) analysis methods permit broad yet detailed biodiversity sampling to be performed with minimal field effort. However, considerable uncertainty remains regarding the spatial resolution necessary for effective sampling, especially in aquatic environments. Also, contemporary plant communities are under-investigated with eDNA methods relative to animals and microbes. We analyzed eDNA samples from six small temperate lakes to elucidate spatial patterns in the distributions of algae and aquatic and terrestrial plants, using metabarcoding of the Internal Transcribed Spacer-1 (ITS1) genomic region. Sampling locations were varied across horizontal and vertical space: sites in each lake included a mixture of nearshore and offshore positions, each of which was stratified into surface (shallow) and benthic (deep) samples. We detected the expected community variation (beta diversity) from lake to lake, but only small effects of offshore distance and sampling depth. Taxon richness (alpha diversity) was slightly higher in nearshore samples, but displayed no other significant spatial effects. These diversity metrics imply that plant eDNA is more evenly distributed than its generating organisms in these small lake environments. Read abundances were heavily weighted toward aquatic macrophytes, though taxon richness was greatest in the algae and other non-vascular plants. We also identified representatives of many phylogenetically and ecologically varied plant taxa, including terrestrial species from surrounding areas. We conclude that freshwater plant eDNA surveys successfully capture differences among lake communities, and that easily accessible, shore-based sampling may be a reliable technique for informing research and management in similar ecosystems.
Introduction
Questions and experiments in ecology rely on knowledge of what organisms are present in a system, and how their patterns change over space and time. Moreover, the task of monitoring biodiversity, during an unprecedented rate of global extinction, is vital for all the life sciences and the quality of human life (e.g., Díaz et al., 2006). Biodiversity sampling has traditionally involved observation, trapping, and other direct census methods (Trolliet et al., 2014; Olinger et al., 2017; Lõhmus et al., 2018), which are biased toward organisms that are easy to locate and identify (Bosch et al., 2017; Wheeldon et al., 2019).
To support and complement traditional approaches to ecosystem monitoring, new tools have been developed over the last decade, including field detection technologies and lab-based high-throughput molecular techniques (Egan et al., 2013, 2015; Larson et al., 2020). One such technique is the analysis of DNA extsracted from bulk environmental samples of air, water, or soil, which is known as environmental DNA or eDNA. This analysis is currently accomplished either by high-throughput sequencing or targeted PCR, and can target narrow or broad ranges of organisms in many different habitats (Lodge et al., 2012; Creer et al., 2016; Deiner et al., 2017a; Cristescu and Hebert, 2018). However, in the aquatic medium, water and organism movement can confound eDNA-based efforts to determine the spatial distribution of organisms. This spatial uncertainty is one of the most significant remaining challenges for eDNA methods when they aim to characterize aquatic communities in detail (Barnes et al., 2014; Deiner et al., 2017a).
Lake habitats and their photosynthetic inhabitants are crucial elements of many ecosystems, and are both involved in and threatened by a multitude of human activities (Tickner et al., 2020). These factors make them candidates for improved monitoring methods (Mantzouki et al., 2018). This study constitutes one of only a few so far to systematically investigate community-level aquatic plant assemblages using eDNA analysis of easily accessible water rather than sediment (e.g., Alsos et al., 2018), even though ecological monitoring is known to be most effective when it considers multiple taxa (Oertli et al., 2005) and aquatic plants are known to be important proxies for lake health (Hatzenbeler et al., 2004).
Despite the foundational importance of freshwater plants to many ecosystems, aquatic eDNA work on them has been largely confined to PCR-based detection of invasive or elusive species (Matsuhashi et al., 2016; Kuehne et al., 2020) or attempts to measure the quantity and distribution of such species (Gantz et al., 2018; Chase et al., 2020; Kuehne et al., 2020). For instance, eDNA monitoring can detect low abundances of algal species responsible for harmful algal blooms (Keller et al., 2017). However, aquatic plants share many of the same detection challenges as taxa that have received more active attention from the eDNA analysis community: they can be rare, cryptic, and/or difficult to identify precisely by morphology alone (Fahner et al., 2016; Bolpagni et al., 2018).
The spatial aspects of aquatic eDNA sampling have been widely investigated, but thus far without conclusive and generalizable results. When sequencing entire (microscopic) organisms captured in an environmental sample, it is clear that they were present at the actual place and time of collection. However, much of the DNA recovered in aquatic environments from non-microscopic plants and animals is in the form of extraorganismal DNA: shed tissues, cells, or organelles (Turner et al., 2014; Deiner et al., 2017b; Lacoursière-Roussel and Deiner, 2019). This material travels freely through the environment in a manner similar to that of other inert small particulates (Turner et al., 2014; Kelly et al., 2018; Nguyen et al., 2020), limiting our ability to determine when, or even if, the source organism was actually present at the location of sampling. The relationship of eDNA sampling to physical space is highly system-specific, depending both on physical aspects of the system such as lotic or lentic hydrology (Civade et al., 2016; Bedwell and Goldberg, 2020) and on various properties of the targeted organisms (Deiner et al., 2015).
The primary goal of this study is therefore to determine how choices of sampling location and depth affect results of eDNA metabarcoding for photosynthetic communities in small temperate lakes. Because the distributions of many rooted plant species within lakes are complex and yet well-understood based on traditional sampling approaches (Sand-Jensen et al., 2019), we seek to compare the behavior of their eDNA to that of eDNA from non-sedentary organisms such as unicellular algae and photosynthetic protists. We sample a broad array of plants, including algae, from six well-studied natural research lakes in the northern United States. We divide each lake into four “compartments” defined by two spatial variables: surface and benthic sampling depths, and nearshore and offshore sampling coordinates. We apply novel eDNA primers targeting a broad range of internal transcribed spacer (ITS1) rDNA sequences for plant communities (Supplementary Table 1); statistically evaluate the relative roles of sampling depth and distance from shore as both between-lake and within-lake sampling factors; and investigate the effects of these variables on eDNA characterization of these aquatic and lakeshore plant communities. We additionally investigate the contribution of terrestrial plants to the reservoir of eDNA in these lakes, in part because recent studies have revealed the potential for widespread terrestrial biodiversity sampling based on the collection of eDNA in river and lake water and sediment (Giguet-Covex et al., 2014; Cannon et al., 2015; Deiner et al., 2016; Harper et al., 2019).
In this study, we define “plants” as green and golden algae, phytoplankton, and vascular and non-vascular macroscopic plants whether of terrestrial or aquatic habit. We expect that plant communities differ among the four different lake compartments: nearshore surface, nearshore benthic, offshore surface, and offshore benthic. Replicating the sampling design in multiple isolated bodies of water gives us the ability to distinguish overall spatial effects from local inter-lake variation. Specifically, we test three hypotheses: that (1) alpha diversity of plants is highest at the surface and near the shore due to enhanced light and resource availability; (2) spatial differentiation (sample beta diversity among compartments) is higher in larger lakes; and (3) nearshore and surface environments include a greater proportion of DNA from terrestrial plant species. An improved understanding of how sampling location influences the eDNA-based detection of lake-associated plant communities will support large-scale biodiversity monitoring efforts and help minimize the costs associated with these efforts.
Materials and Methods
Field Sampling for eDNA
We collected eDNA samples between July 8th and 13th, 2015, from six lakes at the University of Notre Dame Environmental Research Center (UNDERC) in the northern peninsula of Michigan, United States (Figure 1A). This study is part of a larger, 12-lake study that incorporated sampling for vertebrates and invertebrates as well as plants. For the plant data, we report here on the six-lake subset of samples that was amplified with our novel ITS1 primer set described below.
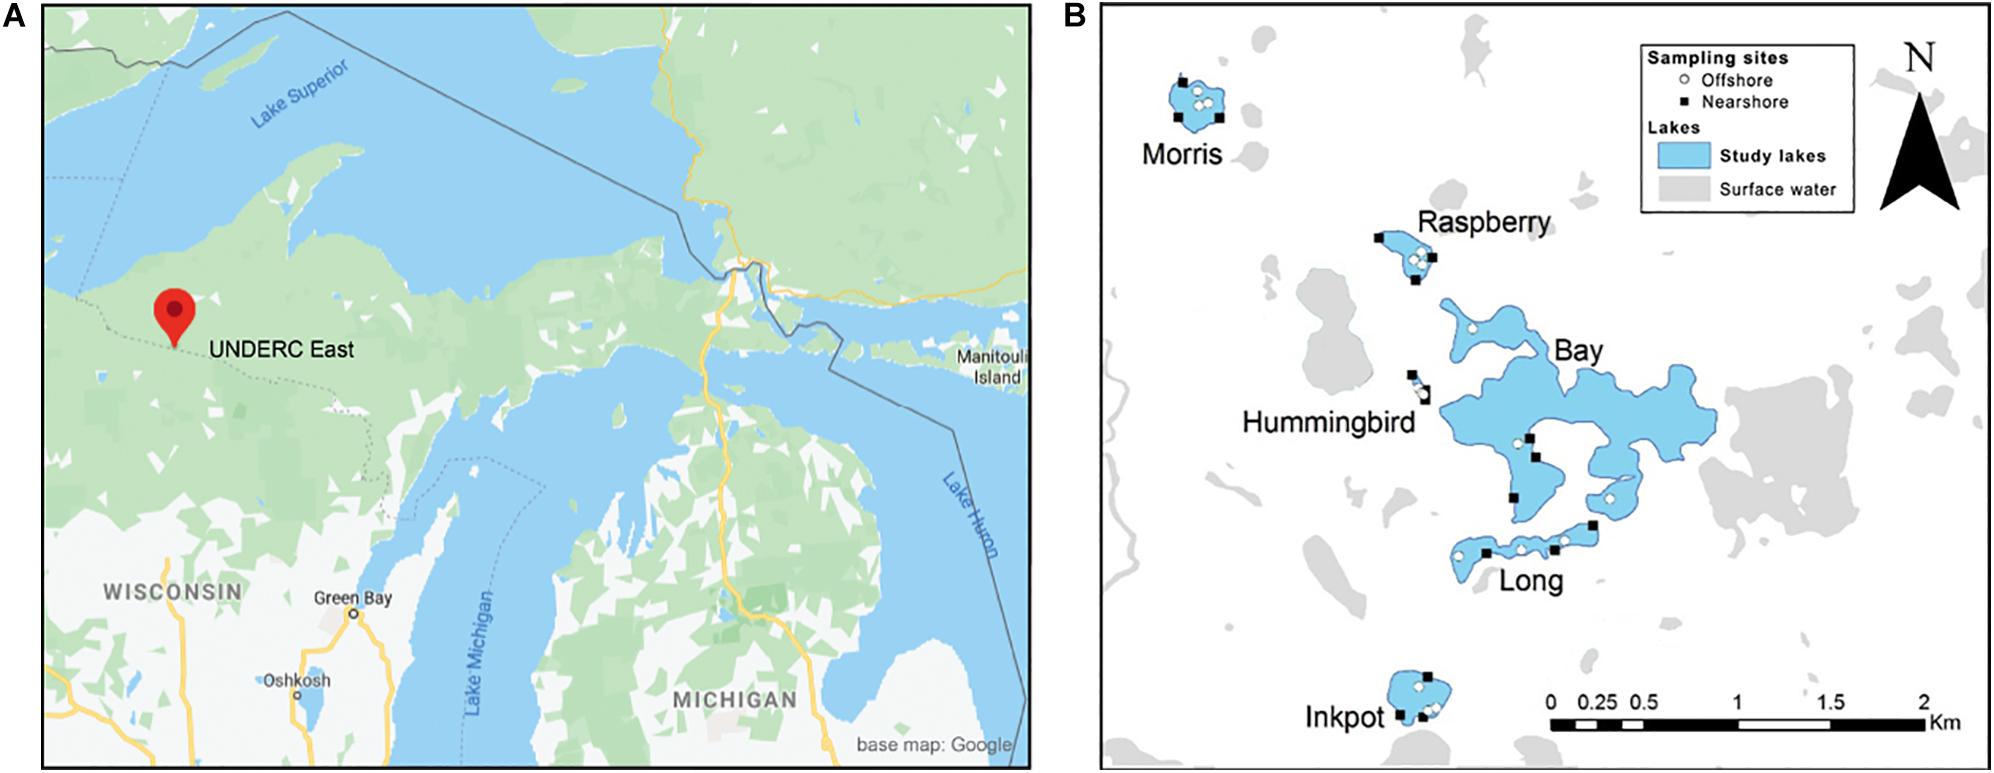
Figure 1. Study lakes and sampling locations at the University of Notre Dame Environmental Research Center (UNDERC) in northern Michigan, United States. Detail map is centered near latitude 46.2336, longitude −89.5237 near the border between Wisconsin and the Upper Peninsula of Michigan. Nearshore and offshore sample locations are denoted within lakes by black squares and white circles, respectively.
The six lakes sampled for plant communities range in size from 0.8 to 67.3 ha (approx. 2–167 acres), with maximum depths from 5.2 to 13.7 m (Table 1). These study lakes are generally considered mesotrophic, or moderately productive. The lakes vary in their stream inputs and outputs, and our random site selection was, in part, intended to reduce site-specific inflow/outflow effects. Water clarity as measured by Secchi disk values near the time of sampling ranged from 0.8 to 4.3 m, as many of the lakes have brown or stained waters due to contributions of tannins and humic acids from adjacent wetlands. Summer depths for the metalimnion (the thermocline between the two distinct temperature layers of a stratified lake) have been measured for these six lakes in recent years and range from roughly 0.75 to 3.2 m (Table 1). Further biotic and abiotic details on these study lakes at UNDERC are given by previous studies (Kelly et al., 2014; Craig et al., 2015).
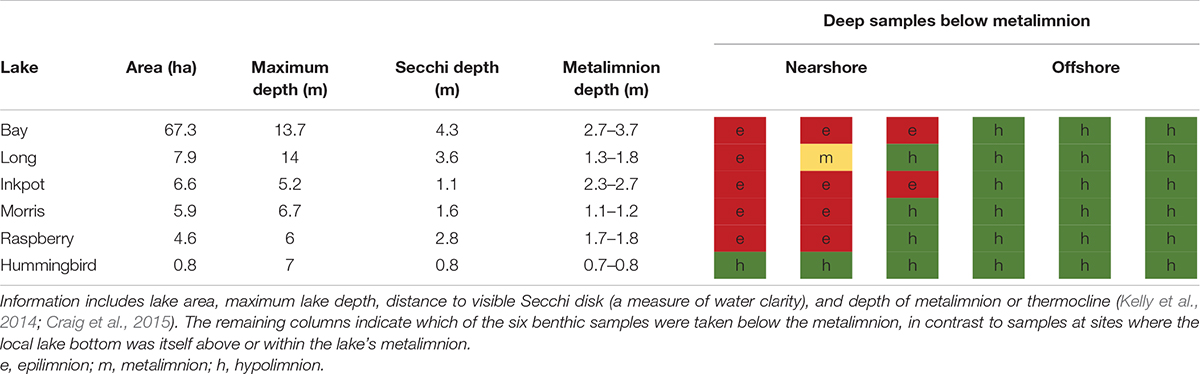
Table 1. Characteristics of lakes sampled at the University of Notre Dame Environmental Research Center (UNDERC), Michigan, United States, for environmental DNA metabarcoding during the summer of 2015.
At each lake, six sampling locations, divided into three nearshore and three offshore, were chosen randomly using ESRI ArcMap (Redlands, California, United States) (Figure 1B). All offshore sites were located a minimum of 20 m from the shoreline (Table 1), at an average distance of 46.2 m (range 20.4–108.4 m). Nearshore locations were constrained to be within 1 m of the shoreline to represent sampling by an individual from the shore, though for consistency, all samples for this study were taken from boats. At each sample site, one surface water sample and one benthic water sample were collected for eDNA filtration. Fresh nitrile gloves were used at each of the six sample collection sites in each lake.
Benthic water samples were taken within 1 m of the lake bottom. In all cases, benthic water samples at offshore locations were taken below the metalimnion. Many nearshore benthic samples were taken above the depth of the metalimnion (Figure 2), though four of six lakes had steep enough nearshore depth profiles for some or all of their nearshore benthic samples to be taken below the metalimnion. Benthic sample depths at offshore locations were reliably deeper than at nearshore locations for all lakes, with a mean of 5.3 m (range 3.4–7.7 m). Within each lake, all nearshore benthic sample depths were shallower than any of the offshore benthic sample depths.
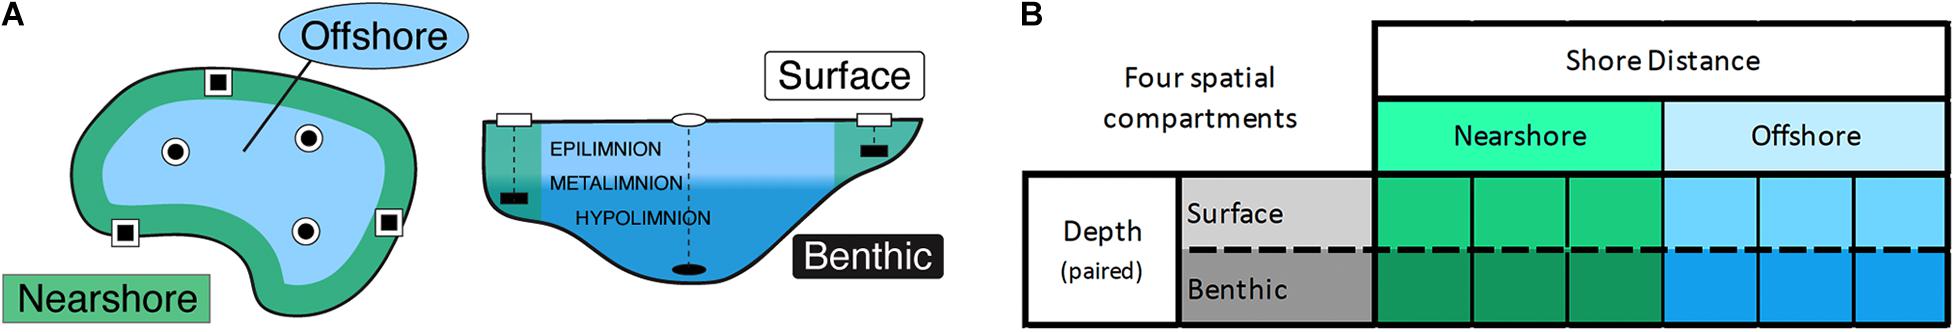
Figure 2. Summary of sampling design for the six lakes in this study. Twelve samples were collected per lake based on depth and distance from shore to define four qualitative sample categories, herein termed compartments. (A) Generalized lake schematic showing nearshore and offshore zones (green and blue, respectively), and surface vs. benthic samples with respect to the metalimnion (see Table 1). (B) Table showing the same division of samples into three nearshore locations and three offshore locations, with a surface and a benthic sample taken at each location. The dashed line indicates that samples are paired vertically but not horizontally.
Surface eDNA samples were taken directly into 250 mL bottles that had been previously sterilized via autoclave followed by an external overnight soak in 10% bleach solution and an external rinse in deionized water. Benthic water samples were taken using 2 L Van Dorn samplers lowered to within 1 m of the lake bottom based on a depth estimate from a hand-held digital sonar (HawkEye Handheld Sonar, Bass Pro Shops, Springfield, Missouri, United States). Subsamples of the water retrieved by Van Dorn samplers were immediately transferred into sterile 250 mL bottles. Three total Van Dorn samplers were used to collect the samples in this study. These three samplers were sterilized between study lakes, and between nearshore and offshore sample locations within study lakes, by 15 min soaks in 50% bleach solution.
Sample bottles were kept on ice in a cooler until transported to a laboratory at UNDERC, where all samples for a given lake were immediately processed by filtration through 1.2 μm cellulose nitrate filters with the aid of an electric vacuum pump attached to side-arm flasks and filter funnels. In order to detect potential external contamination during handling and transport in the field, two filtration blanks per lake containing store-purchased bottled water were transported to and from the study sites along with the bottles for sample collection. Filtration blanks were filtered in the laboratory prior to sample filtration. Filters were immediately placed in 2 mL microcentrifuge tubes (United States Scientific, Ocala, Florida, United States) containing 700 μL of Longmire’s buffer (Longmire et al., 1997). These tubes were kept at 4°C until being transported to the University of Notre Dame (Indiana, United States) for eDNA extraction. Fresh nitrile gloves were used during filtration of each individual sample.
ITS1 Primer Design
We chose to develop a primer specific to the study area, as we were not aware at the time of a published ITS1 primer with good specificity for the Great Lakes region. Previous experience with taxon-specific plant assays (i.e., Elodea and Hydrilla; Gantz et al., 2018) highlighted the ITS1 region as an ideal candidate for unique IDs among closely related plant species over relatively short fragments of DNA. Sequences for the ITS1 genomic region were downloaded from GenBank for a list of 119 locally relevant plant species (Supplementary Table 2). Sequence alignments were built and assays were designed on areas of the ITS1 region that were conserved across the list of plant taxa, based on recommendations from Primer3 (Untergasser et al., 2012). The final selected primer set, designated ITS1-F/-R3 (Supplementary Table 1B), produced a range of amplicons approximately 240–500 bp in size. Primers targeting matK, rbcL, and ITS2 were also developed and evaluated, and the ITS1 primers were found to be the best match for the local lake environment. The primers used are thus not intended to be widely employed outside the area of this study.
DNA Extraction and Target Amplification
DNA extractions followed a modified chloroform-isoamyl alcohol (24:1, Amresco) extraction and isopropanol precipitation protocol as outlined in Renshaw et al. (2015). Following the extraction process, rehydrated DNA pellets were treated with the OneStepTM PCR Inhibitor Removal Kit (Zymo Research, Irvine, California, United States).
A two-step PCR-based method was used for preparation of sequencing libraries (Olds et al., 2016). In the first step, locus-specific PCR amplicons were generated from each sample using the novel primer set designed to amplify the intergenic spacer between the 18S and 5.8S ribosomal RNAs in plants: ITS1-F (5′-GTCGTAACAAGGTTTCCGTAGGT-3′) and ITS1-R3 (5′-GATATCCGTTGCCGRGAGTC-3′). The ITS1 primer set included an overhang on the 5′-end to allow for indexing and Illumina adapter addition during the two-step PCR-based Illumina library preparation (Supplementary Table 1).
A 50 μL first step PCR reaction was used with the following recipe: 29.5 μL sterile water, 10 μL 5× HF buffer, 1 μL 10 mM dNTPs, 1.5 μL 50 mM MgCl2, 1.25 μL 10 μM ITS1-F + PrefixNX/F primer, 1.25 μL 10 μM ITS1-R3 + PrefixNX/R primer, 0.5 μL 2 U/μL iProof High-Fidelity DNA Polymerase (Bio-Rad, Hercules, California, United States), and 5 μL DNA. Temperature cycling conditions were: initial denaturation at 98°C for 2 min; 25 cycles: denaturation at 98°C for 10 s, annealing at 55°C for 20 s, extension at 72°C for 30 s; and final extension at 72°C for 10 min.
First step PCR products were run through a 2% agarose gel, stained with ethidium bromide, and visualized on a UV light platform. Amplified products were manually cut from the gels with single-use razor blades, cleaned with the QIAquick Gel Extraction Kit (Qiagen, Venlo, Netherlands), and eluted from spin columns with 30 μL of Buffer EB. The DNA concentration of each elution was quantified with the Qubit dsDNA HS Assay (Life Technologies, Carlsbad, California, United States).
Library Preparation and Sequencing
To complete the addition of the Illumina adapter and dual-indexing barcode, a 50 μL PCR reaction was used for the second step. The PCR mix consisted of 22 μL sterile water, 10 μL 5× HF buffer, 1 μL 10 mM dNTPs, 1.5 μL 50 mM MgCl2, 5 μL 10 μM Nextera Index Primer 1 (N701-N712), 5 μL 10 μM Nextera Index Primer 2 (S502-S508 and S517), 0.5 μL 2 U/μL iProof High-Fidelity DNA Polymerase (Bio-Rad, Hercules, California, United States), and 5 μL DNA. Sequences for the Nextera Index Primers 1 and 2 are given in Supplementary Table 1B. All PCR primers, for both the first step and second step, were synthesized by Integrated DNA Technologies (Coralville, Iowa, United States).
Temperature cycling conditions for the second-step PCR consisted of an initial denaturation step at 98°C for 2 min; followed by 8 cycles of denaturation at 98°C for 10 s, annealing at 55°C for 20 s, and extension at 72°C for 30 s; followed by a final extension step at 72°C for 10 min. PCR clean-up was performed with Agencourt AMPure XP magnetic beads (Beckman-Coulter, Indianapolis, Indiana, United States) and DNA concentrations were quantified with the Qubit dsDNA HS Assay. Amplicon sizes were verified within each library on a Bioanalyzer DNA 7500 chip (Agilent Technologies, Santa Clara, California, United States). Sequencing was performed on an Illumina MiSeq sequencer at the University of Notre Dame’s Genomics and Bioinformatics Core Facility1 with a MiSeq Reagent Kit v3 (600-cycle; Illumina, San Diego, California, United States).
Over the course of the entire study, 98 total samples were processed, including 72 field samples (12 per lake), 12 field collection blanks (2 per lake), 8 no-template control PCR blanks (one per lake and one per sequencing run), 6 extraction blanks (1 per set of 18 eDNA extractions), and one blank each for the laboratory’s DI water and tap water.
The extraction blanks included all the reagents used in the DNA extraction process and were processed alongside eDNA samples, monitoring for contamination that might occur during the DNA extraction step. Although none of the no-template controls visibly amplified, a band was cut out of the agarose gel at the expected size for each NTC and carried through the remaining library prep for subsequent Illumina sequencing.
Samples were spread across two runs on the Illumina MiSeq as part of a larger pooled eDNA study including vertebrate and general eukaryotic eDNA sequencing. Specific to this plant eDNA study, we included 36 field samples (3 lakes) per run, plus 12 associated control samples (6 field, 2 extraction, and 4 NTC). The tap and DI water blanks were amplified and sequenced on a separate run, associated with the larger project.
Bioinformatic Analysis
A summary of the informatic workflow, with full parameters and software versions, is available as Supplementary Figure 1. Raw MiSeq forward and reverse reads were assessed with FastQC (Andrews, 2010) and adapter-trimmed with Trimmomatic ILLUMINACLIP (Bolger et al., 2014) at a simple clip threshold of 6 bp. A sliding-window quality check was performed simultaneously with adapter removal: bases were trimmed when their windowed average fell below a quality score of 20. A custom Perl script (as used in Olds et al., 2016) performed demultiplexing to separate ITS-primer-specific reads from the other simultaneously sequenced amplicon sets. Forward and reverse reads were merged, and then quality-filtered with USEARCH (Edgar and Bateman, 2010) functions fastq_mergepairs and fastq_filter to a maximum expected error rate of 0.5 and a maximum N count of 1. Filtered merged reads were collapsed to unique sequences, then chimera-filtered and clustered with a 97% similarity threshold using USEARCH cluster_otus and usearch_global.
Taxonomic Assignment
Identification of OTUs was exclusively by BLASTn (Camacho et al., 2009), against the NCBI nt online database as of 12/11/2017. An initial assignment of OTUs to NCBI taxa was performed without identity thresholds, and any completely unassigned OTUs were discarded. Automated resolution of ambiguous BLAST results was then conducted according to a defined set of rules (see Supplementary Figure 1). The assigned OTUs were further filtered and combined as described below.
OTU Filtering
Details of OTU resolution and filtering are given in Supplementary Figure 1. The BLAST criteria for a fully passing OTU taxon assignment were a global percent identity of 97 or higher (as in Olds et al., 2016) and a bitscore of 100 or greater (similar to the approach in Shaw et al., 2016), corresponding to an e-value of approximately 2E–17. The overall set of these “fully passing” OTU assignments was taken as the working set of taxa presumed to be present in the study.
Ambiguity Resolution
Some OTUs were assigned by BLAST to more than one NCBI taxon with equal confidence (i.e., identical bitscore) using the NCBI BLAST taxonomy2. Within each set of ambiguous assignments for a given OTU, a subset of the most informative assignments was selected for final resolution of the OTU. The “most informative” assignments were considered to be, in order of priority: (1) species or subspecies records, (2) genus records with no species specified, and (3) records labeled as “uncultured” members of specific higher taxa. Records labeled as “environmental samples,” which are unidentified sequences reported by other environmental studies, were always excluded in favor of more informative assignments, and an OTU was eliminated from the study altogether if an “uncultured” or “environmental” sample was the most informative assignment that appeared in the list of top hits. See the Code Supplement for further details of this step.
In most cases, this process successfully produced a single species or subspecies assignment. Where it did not, the most specific common genus, family, or order was used as the identification, as defined by the NCBI taxonomy3. Strong sub-threshold matches to known taxonomic groups indicated that some sequences were legitimate examples of as-yet unsequenced organisms rather than sequencing errors or chimeras.
Statistical Analyses
We calculated Shannon’s alpha diversity index (H’) and the inverse Simpson’s diversity index (1/D) on raw passing taxon read totals within each lake, and across spatial variables, using the packages phyloseq version 1.30.0 (McMurdie and Holmes, 2013) and vegan version 2.5.7 (Oksanen et al., 2019) in the statistical program R (version 3.4.2). Differences in means across sets of variables were assessed with Mann-Whitney tests.
We tested for an effect of eDNA sample location and depth on plant communities using permutational multivariate analysis of variance (PERMANOVA) using the adonis function in the R package vegan. Due to the sensitivity of multivariate statistics to outliers, we omitted the rarest taxa (found in < 5 field samples total) from these beta-diversity analyses. A total of 47 vascular plants and 65 algal taxa were excluded from beta diversity analysis as a result of this filtering. We then log + 1 transformed the remaining reads (Anderson et al., 2006) prior to calculating pairwise Bray-Curtis distances between our samples. In each PERMANOVA run on individual taxonomic groups, we considered sample location (nearshore or offshore) and depth (surface or benthic) as factors, with lake identity as a stratum or group. Inclusion of lakes as strata allowed us to partition the variation in communities among these lakes owing to inherent differences in biotic or abiotic factors between sites, as opposed to differences within lakes caused by sample site locations and depths. We also considered an interaction between location and depth, because offshore benthic water samples were deeper than nearshore benthic water samples in all cases, making nearshore benthic and offshore benthic samples potentially distinct. We attempted to perform independent analysis on the vascular-plant subportion of results, but total read abundance was too low to provide sufficient statistical power.
Results
Sequencing
Two multiplexed 2×300 paired-end Illumina MiSeq runs yielded 32M reads, including 3.2M ITS1 amplicon sequences for this study. Among the 72 field samples, total per-sample plant-specific read counts ranged from 1.1 to 376K with a mean of 44.0K reads. After quality filtering, forward/reverse read merging, and chimera removal, per-sample plant-specific read counts for field samples totaled 2.4M reads, with per-sample mean of 33K reads. The laboratory controls, and 18 of the 24 field controls, yielded fewer than 10 plant reads apiece. Most reads in the remaining field controls were from plant taxa that appeared only in controls, and are therefore presumed to result from transport contaminants rather than field or laboratory cross-contamination.
OTU Clustering and Filtering
Counts of distinct sequences averaged 1,115 per sample, and distinct non-singleton sequences averaged 341 per sample. These non-singletons were clustered into 580 OTUs and identified with BLAST. Of these, 376 OTU identifications met thresholds of 97% identity and bitscore of 100 and were considered “passing” identifications. Of those, 50% matched with 100% identity. The majority had unambiguous BLAST assignments to a single NCBI species or subspecies. The remaining OTUs had identical sequence identities and bitscores for multiple possible taxa. These OTUs were resolved by a custom algorithm to species or subspecies level (7 OTUs); resolved to genus or a higher taxonomic level (21 OTUs); or discarded as unresolvable (3 OTUs). 5 OTUs were eliminated because they belonged to fungi or other non-target taxa. The resulting OTUs represented 248 distinct taxa, 63 of which were vascular plants and 185 of which were algae or other non-vascular plant taxa. See Methods and the Python code in the supplement for further details of this step.
Correspondence With Known Area Species
A list provided by UNDERC of known area vascular plants includes 609 species, mostly terrestrial, and approximately 25 aquatic. Of those species, only 159 have ITS1 records available at NCBI that would enable identification of corresponding OTUs in the eDNA results. The exact species overlaps between eDNA results and the area list numbered 21 (14 wetland or upland and 7 aquatic). This relatively low correspondence at the species level reflects both the absence of many species from NCBI ITS1 records and the fact that the plant lists cover a much wider area than is represented by these specific study lakes.
At the genus level, however, the UNDERC area list included 117 total vascular plant genera with at least some available ITS1 species records. The eDNA results contained 47 vascular genera, with 41 genera in common between the two lists. Of the six “false positive” genera found in the eDNA results that do not appear on the area species list, three are crop or widespread weedy species (e.g., guar, soybean, ragweed) that may well contribute material to the area without appearing on local species inventories (Supplementary Table 2). The remaining OTUs belong to algae and other non-vascular plants, including microscopic taxa.
Our attempts to compare our lake-specific macrophyte results to previous, unpublished plant surveys4 yielded mixed results, as might be expected given the age of the surveys. No more recent lake-specific plant surveys were available to us for comparison.
Spatial Taxon Distribution
Spatial distributions of the taxa identified by eDNA sequencing show that 150 of the 209 major taxa are found in all four distance-depth compartments of the dataset (Figure 3). Major taxa are those appearing in five or more samples, as defined as above for purposes of beta diversity analysis. None of these major taxa are unique to a single compartment.
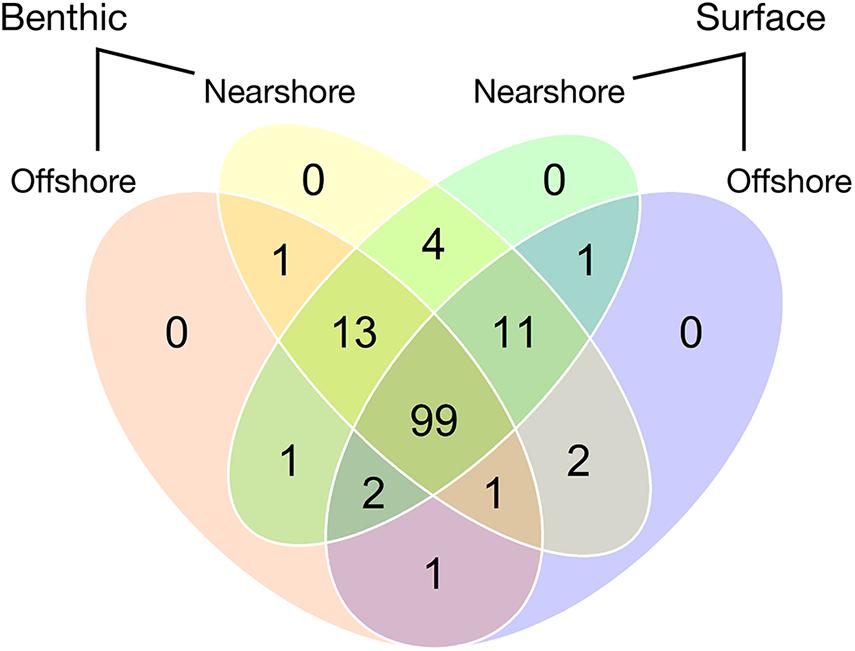
Figure 3. Numbers of major taxa common to the four spatial compartments of eDNA sampling across six lakes. Major taxa are defined as the set of 136 identified plant and algal species (or, rarely, higher taxa) that were used for community analysis after the rarest taxa were excluded as described in Statistical Analyses, above.
Figure 4 contrasts numbers of taxa in various NCBI “taxon categories” with their read prevalence. This set of NCBI taxon categories are occasionally non-intuitive due to the presence of generic-seeming basal groups such as “flowering plants”; nevertheless, these high-level categorizations are a useful rough overview of the distribution of taxon types in the dataset. A majority of total taxa identified are algae and phytoplankton (Figure 4A), but those categories are less dominant in number of reads (Figure 4B).
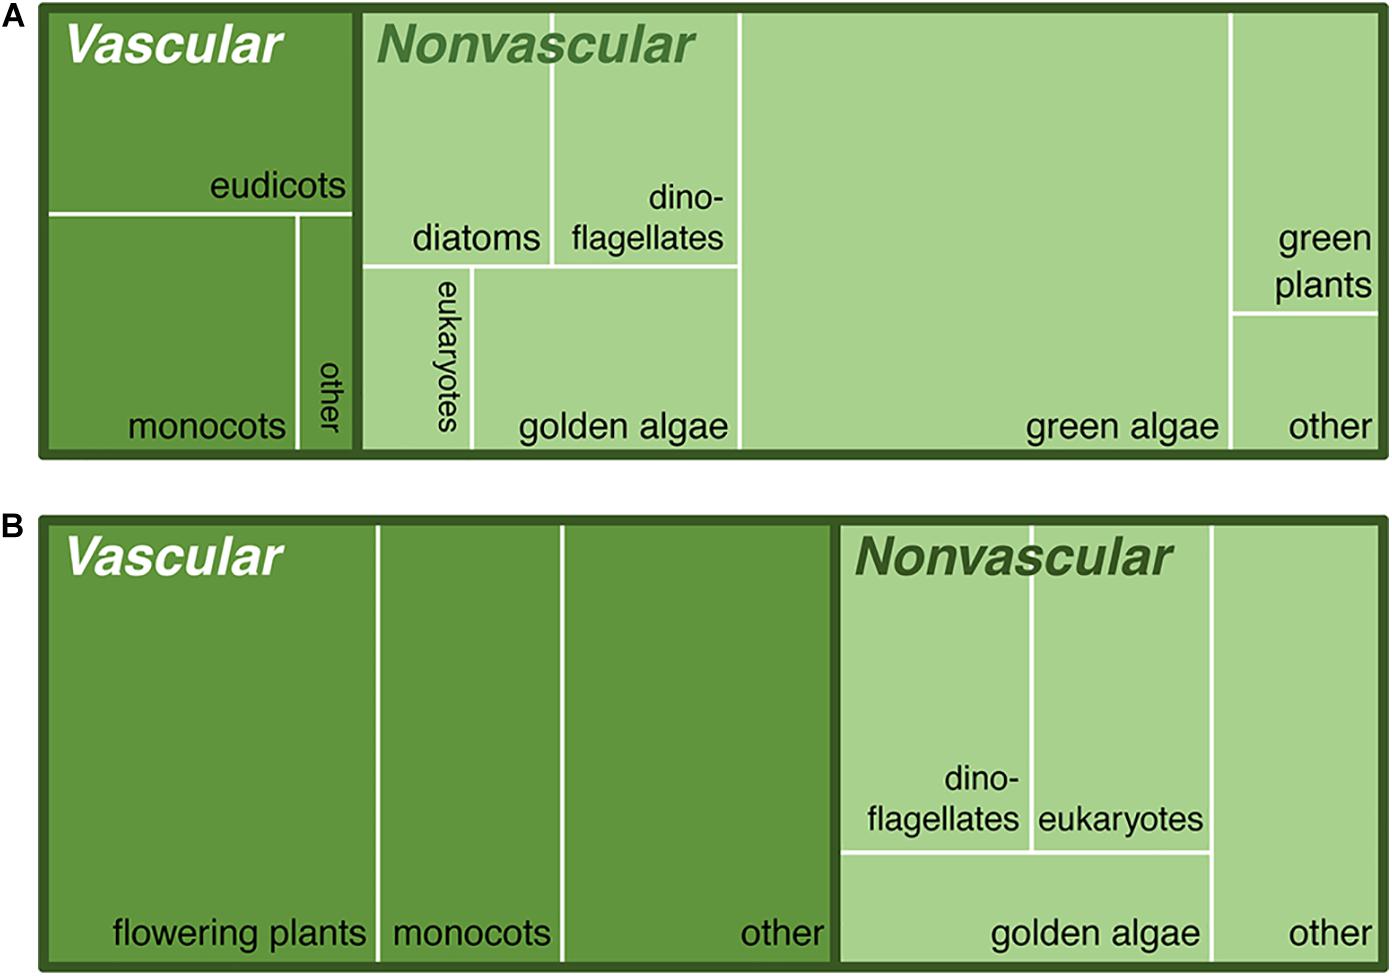
Figure 4. Study taxa by NCBI taxonomic categories identified via ITS1 barcode sequencing in six lakes. These treemaps (Shneiderman, 1992) are proportional representations of vascular plants (darker green) and non-vascular plants/algae (lighter green) by (A) numbers of taxa identified vs. (B) read abundance. Note the variation in dominance in subcategories like “eukaryotes” (generally photosynthetic protists) and “flowering plants” (largely aquatics in the Nymphales and Ceratophyllales, predating the monocot/dicot split). The “green plants” in the non-vascular category are in the Zygnematophyceae, or conjugating algae, a close outgroup to the land plants.
Vascular Plant Taxa by Wetland Status
Of the 63 individual vascular plant taxa detected via eDNA sequencing, only 63% (40 taxa) are aquatic species or terrestrial species classified as hydrophytes according to United States federal wetland delineation guidelines (U.S. Army Corps of Engineers, 2018; Table 2 and Figure 5). The other, substantial, portion of taxa (23) occupies non-aquatic classifications, indicating that a wide range of species contribute DNA to the lake environments. However, aquatic species heavily dominate the read abundances, and hydrophyte species also have read abundances disproportionately higher than their taxon representation would indicate (Table 2). The absolute number of sequencing reads from vascular plants was insufficient for statistical testing of vascular-specific diversity differences within or among lakes: 793K of 1.9M total reads, spread across 72 samples, with two aquatic plant taxa accounting for over half the vascular plant reads.
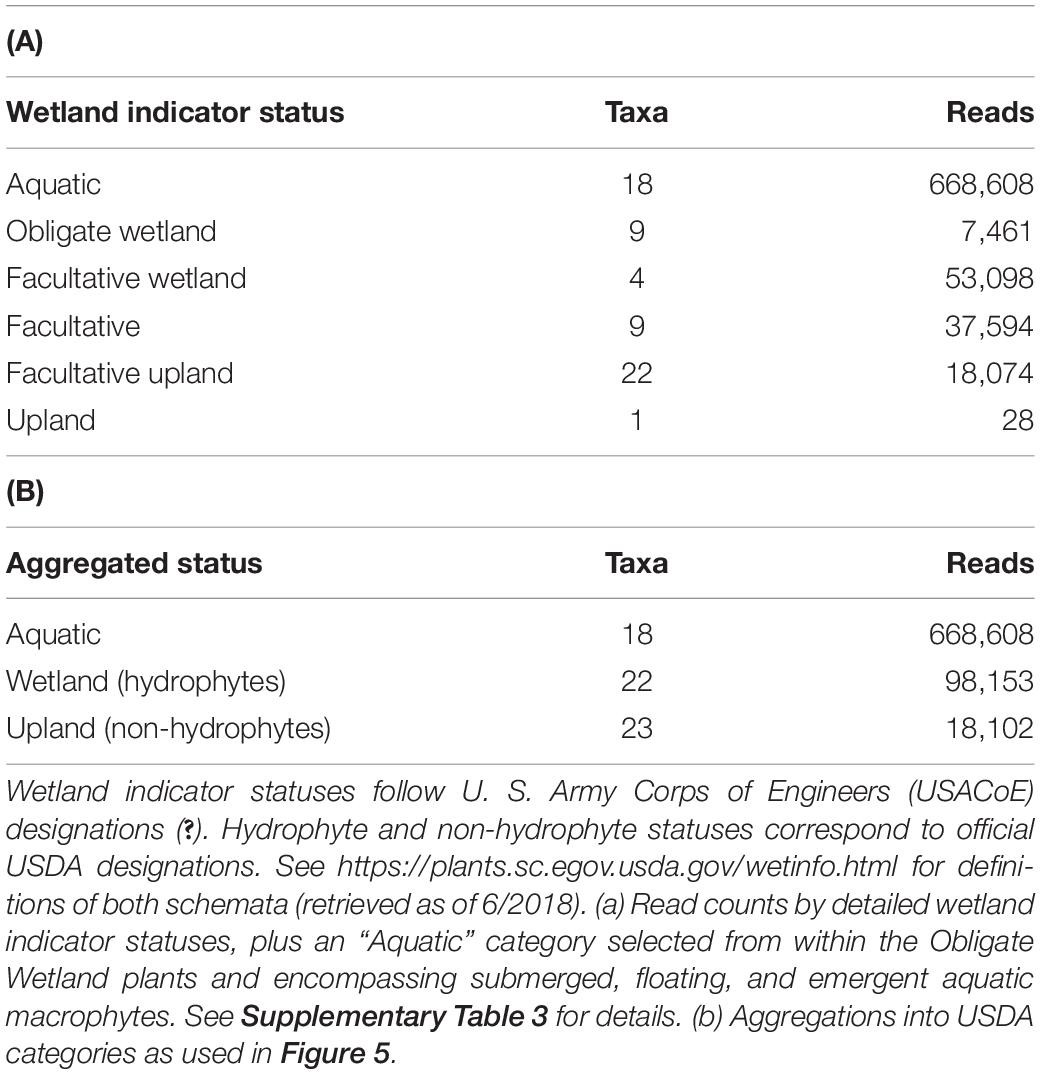
Table 2. Taxon and read abundances of vascular plants by wetland status.
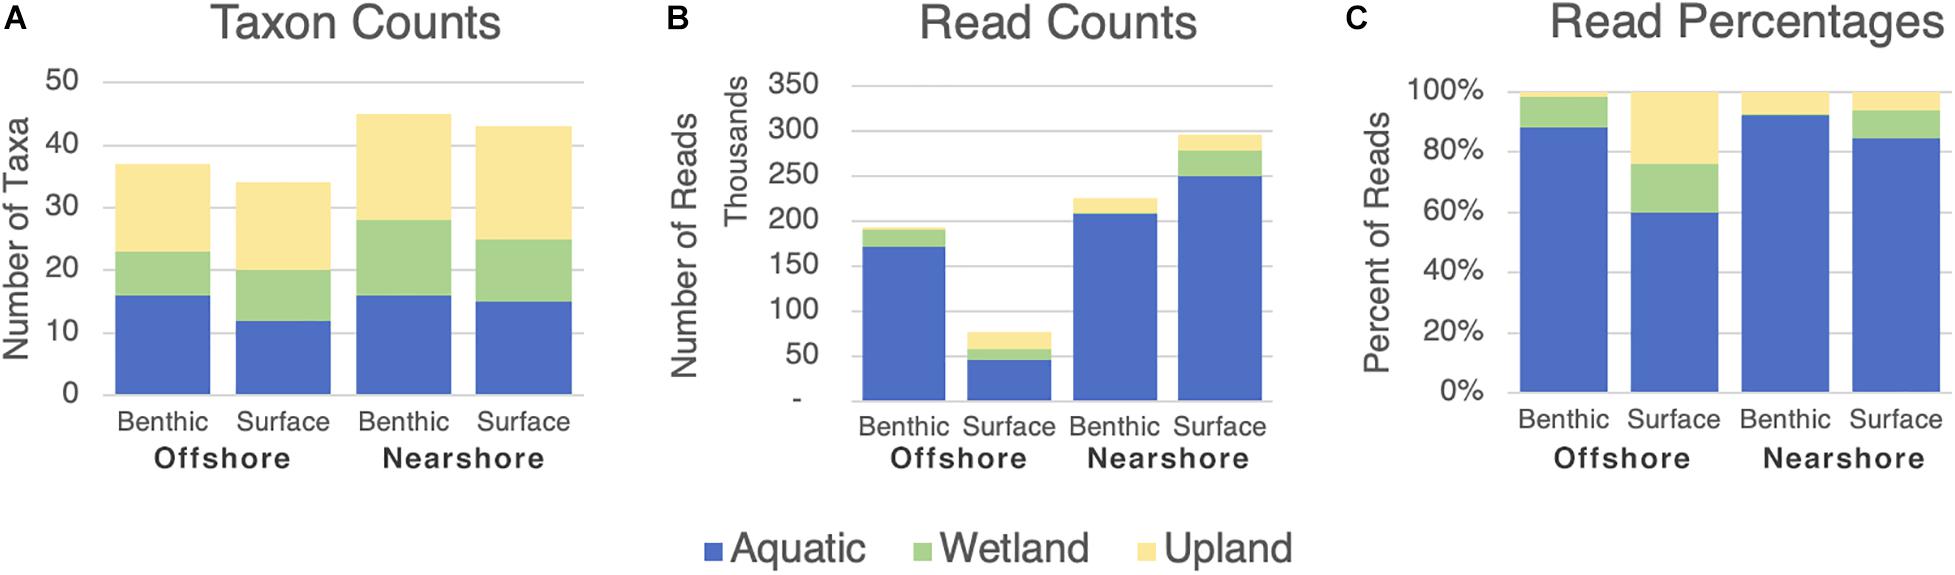
Figure 5. Prevalence of wetland designations among vascular plant taxa categories identified by eDNA sampling in four spatial compartments. “Aquatic,” “Wetland,” and “Upland” correspond to the three aggregated statuses in Table 2B above. Category labels are the four spatial sampling compartments (depth/distance combinations). (A) Numbers of taxa from each broad category represented in eDNA results. (B) Numbers of reads represented in eDNA results. (C) Percentage of reads represented in eDNA results.
Alpha Diversity
Alpha diversity among identified taxa varied substantially among the six lakes, with mean Shannon index values ranging from 1.01 to 1.83 (Figure 6A). The inverse Simpson’s diversity index (1/D; not shown) was consistent with the Shannon results (Spearman correlation ρ = 0.943). Mean alpha diversities of surface vs. benthic samples showed little difference (Figure 6B). Mean nearshore diversity was slightly though significantly higher than offshore diversity by both indices, with a p-value of 0.0026 for the difference in Shannon-index means (Figure 6C).
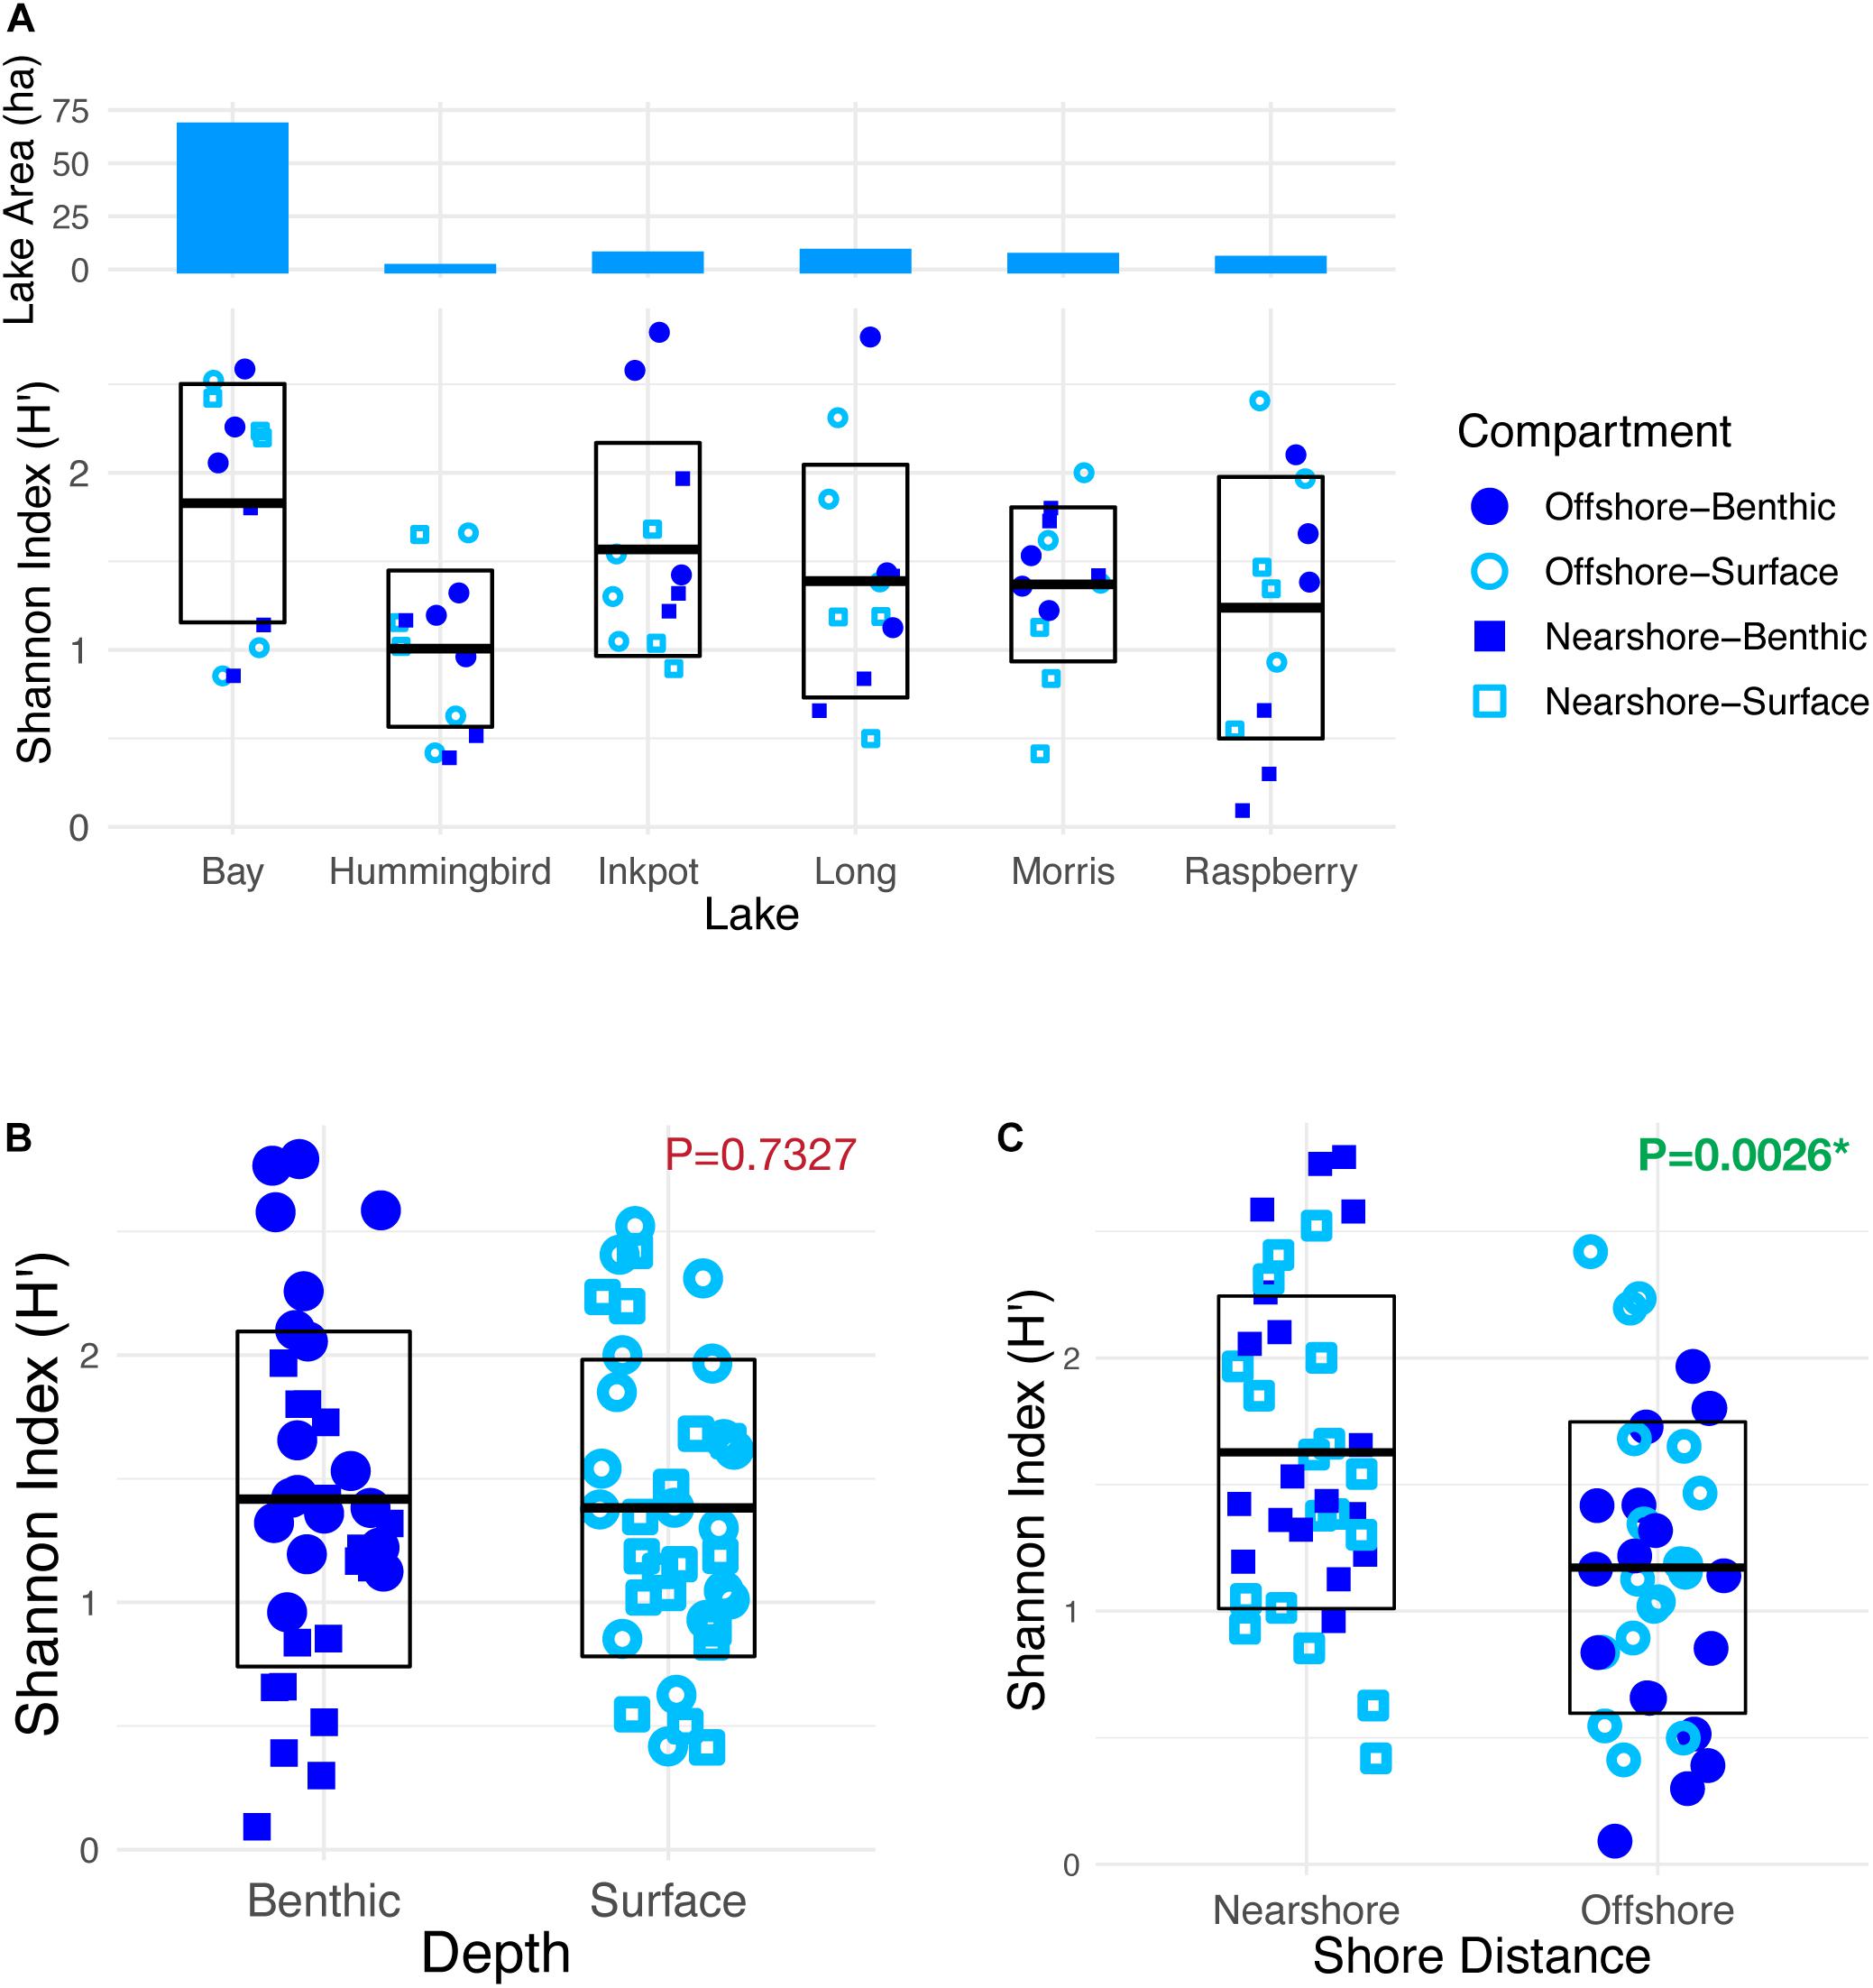
Figure 6. Alpha diversity of combined plant and algal taxa detected by eDNA sampling in six lakes. (A) Distributions of Shannon’s diversity index (H’) for the 12 samples within each of six lakes, showing mean index value with one standard deviation above and below. Surface area of lakes is overlaid above (blue bars), showing a correspondence between lake size and mean alpha diversity (Spearman correlation: ρ = 0.94). (B) Shannon diversity for all surface vs. all benthic samples. Mean values are not significantly different. (C) Shannon diversity for all nearshore vs. all offshore samples. Mean nearshore alpha diversity is significantly higher than mean offshore diversity (p < 0.005).
Beta Diversity and Community Composition
Community characterization by PERMANOVA was performed on the data from six lakes, across each spatial dimension, using lake identity as a blocking factor. Simultaneous analysis of all factors showed a dominant effect of lake identity as the primary explanatory variable for community composition (R2 = 0.5109, p < 0.001). This substantial effect was followed by small effects of distance and depth (R2 = 0.0277 and R2 = 0.0373 respectively, with p < 0.001). The distance-depth interaction showed an additional small yet statistically significant effect (R2 = 0.0137, p = 0.014) (Table 3).
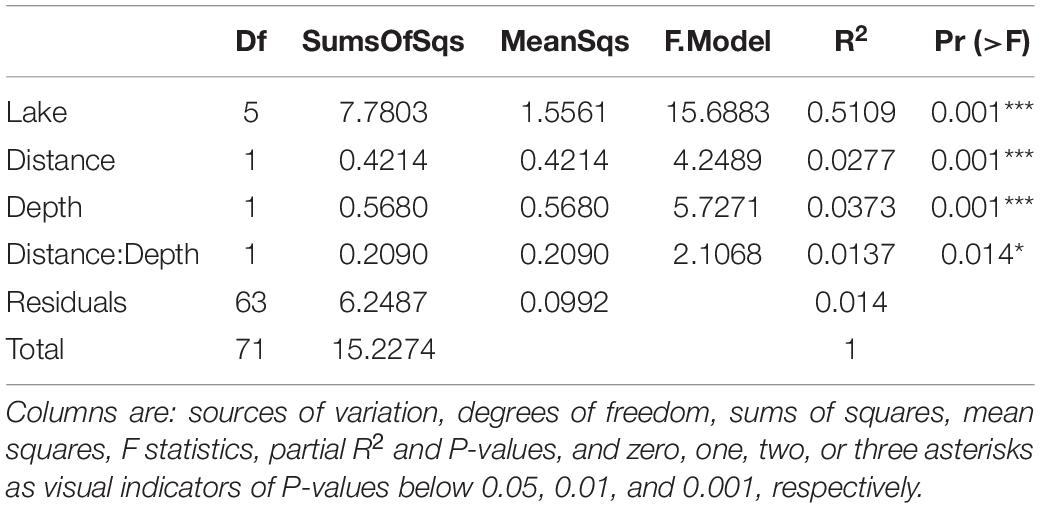
Table 3. Spatial effects by PERMANOVA across six lakes.
Four of the six individual lakes also showed moderately-sized internal patterns with regard to depth and shore distance, with statistically significant R2-values of up to 0.206 for depth and 0.414 for shore distance (Table 4). Effect sizes in each lake showed no significant correlations with per-lake alpha diversity, nor with physical lake characteristics such as longitude, latitude, water clarity, or maximum lake depth, as determined by Spearman correlation (Supplementary Figure 2).
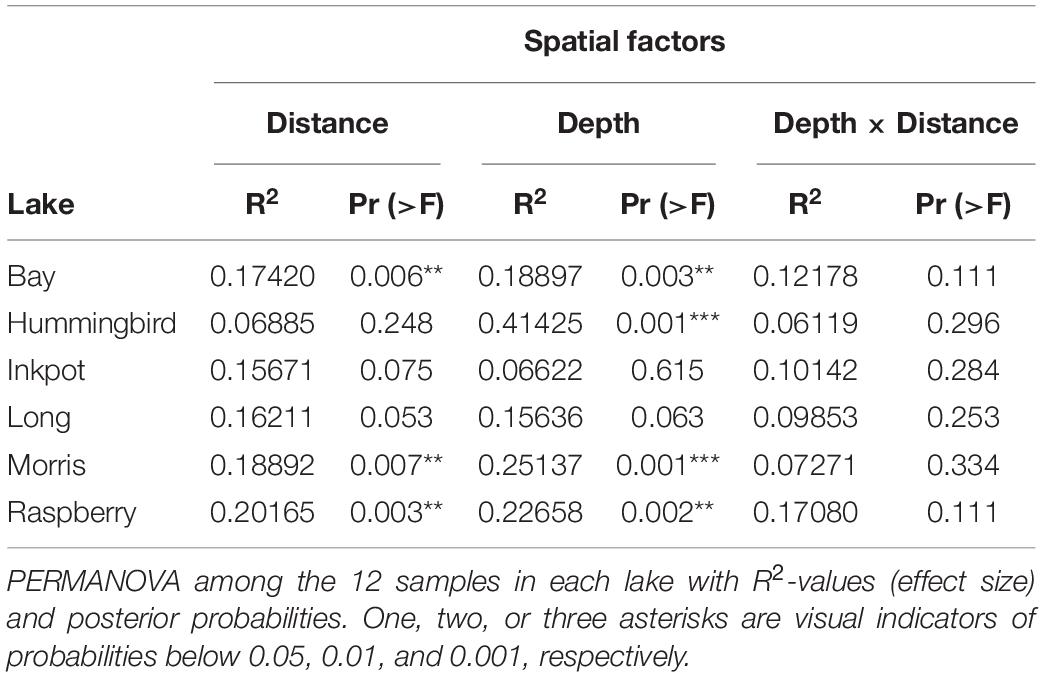
Table 4. Spatial effects by PERMANOVA within individual lakes.
NMDS plots visually confirmed the beta diversity patterns, showing lakes scattered across the plot but distances and depths largely overlapping with only small differences in the overall shapes of the clusters (Figure 7).
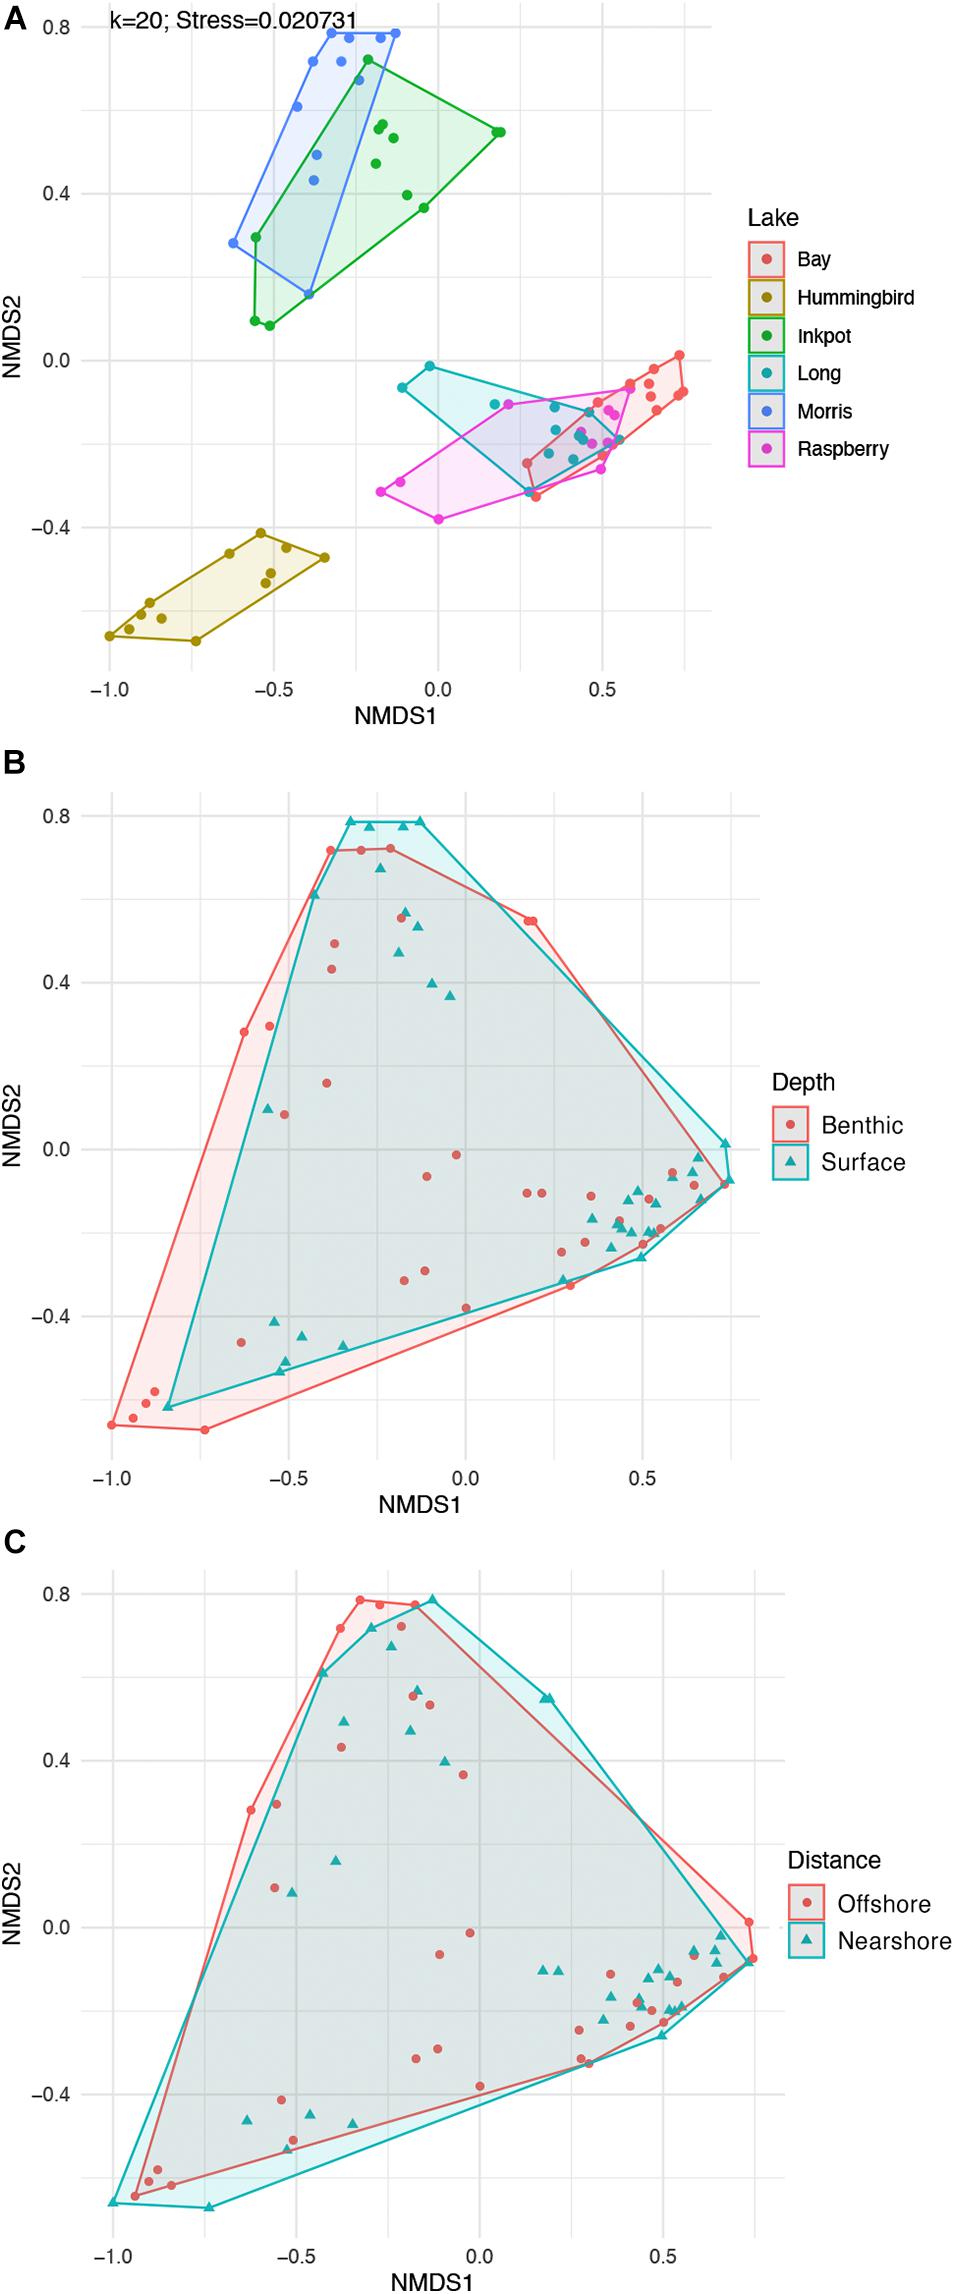
Figure 7. Visualizations of diversity among lake communities based on 12 spatially varied eDNA samples from each of six lakes. Each point represents the read-abundance-based community of one sample from the indicated lake. All plots are based on NMDS ordination of Bray-Curtis distances calculated from log + 1-transformed read abundances. (A) Diversity among the six lakes, showing substantial clustering of points within lakes, corresponding to the R2-value of 0.5109 (Table 3). The bottom two plots are the same points grouped (B) by depth category and (C) by shore distance category, showing the substantial overlap between the 36 sampling locations in one category vs. the other.
Discussion
Environmental DNA (eDNA) metabarcoding has grown rapidly as a novel but repeatedly proven tool for species surveillance (Rees et al., 2014; Thomsen and Willerslev, 2015). Our study is among the first to assess freshwater plant community diversity using eDNA metabarcoding and to address clear hypotheses about eDNA sampling location in lake community surveillance (Valentini et al., 2016). Even though plant community ecology is a fundamental field in biology, most plant-targeted eDNA studies have focused on a single species, largely in the context of invasives detection (Scriver et al., 2015; Fujiwara et al., 2016; Matsuhashi et al., 2016; Gantz et al., 2018). We report here on the success of a community inventory and its implications for future study design.
Spatial Distribution of Taxa Within and Among Lakes
The largest community assemblage differences in this study appear in the whole-community comparisons among lakes, which is consistent with traditional sampling approaches for lakes and ponds that find environmental heterogeneity to be the strongest predictor of beta diversity (Alahuhta et al., 2017). However, small beta diversity signals are also detectible in the spatial variables combined across the six lakes (Table 3). Moreover, the community compositions internal to 4 of the 6 lakes showed significant small or moderate differentiation in one or both spatial dimensions within the individual lake communities themselves (Table 4). The depth component of the signal is as strong as it is expected to be at any point in the year, according to an eDNA study on fish in a large English lake which confirmed the presumption that vertical habitat differentiation is strongest in the summer for temperate stratified lakes (Lawson Handley et al., 2019).
Due to the small but significant absolute magnitude of the spatial patterns (< 5%), we surmised that they might relate to subtle ecological effects, either from inherent characteristics of each lake or the effect of those characteristics on eDNA transport and degradation patterns. Accordingly, we investigated potential relationships between various characteristics of each lake and the sizes of distance and depth effects in that lake, testing for correlation between lake characteristics (position, surface area, maximum depth, and water clarity) and sequencing-based diversity metrics (alpha diversity, and magnitude and significance of depth and distance effects). No correlation between a lake characteristic and an alpha or beta diversity metric reached statistical significance either before or after correction for multiple testing. The lack of relationships between lake size and strength of spatial patterns causes us to reject our hypothesis that larger lakes will have clearer spatial structure in eDNA profiles.
We believe that our single-point sampling was sufficient to discover the existing spatial patterns in these lakes, given that several effect sizes were small but nevertheless highly significant (p < 0.001). Regardless, in the future, we recommend taking multiple technical replicates and/or performing replicate PCRs for each sample to reduce the PCR-related false negative rate. Field technical replicates and PCR replicates would also increase the overall likelihood of detecting rare taxa that would be especially informative about site differences (Leray and Knowlton, 2017).
Our investigation of distance and depth patterns among our unreplicated lake eDNA point samples demonstrates two subtle and opposing effects. First is that low levels of unique taxa are present in each compartment, and therefore that point sampling may not generate an exhaustive species inventory where one is needed. Secondly, however, is an overall indication that much of the eDNA originating in each compartment is well-distributed throughout a small lake, which indicates that point sampling may be adequate for many other purposes. Several individual taxa per lake would have been missed had sampling been limited to one of the four spatial compartments, and therefore specific applications such as time-series comparisons would clearly benefit from consistency in sampling location. Alternatively, for basic lake-wide biological inventories, pooling samples from multiple location types may help to increase overall numbers of species detected without increasing the amount of laboratory work needed. Finally, the spatial information itself may be useful for certain types of detailed investigation such as those of ecological gradients or localized populations. However, the effects of sampling position were small in magnitude, and many taxa were found in common among spatial compartments, which indicates that community composition results were reasonably robust to the choice of sampling position. Our resulting recommendations are summarized in Table 5. Ideally, eDNA sampling projects of this type should perform pilot studies to determine the relative contributions and importance of spatial variation to the local eDNA environment.
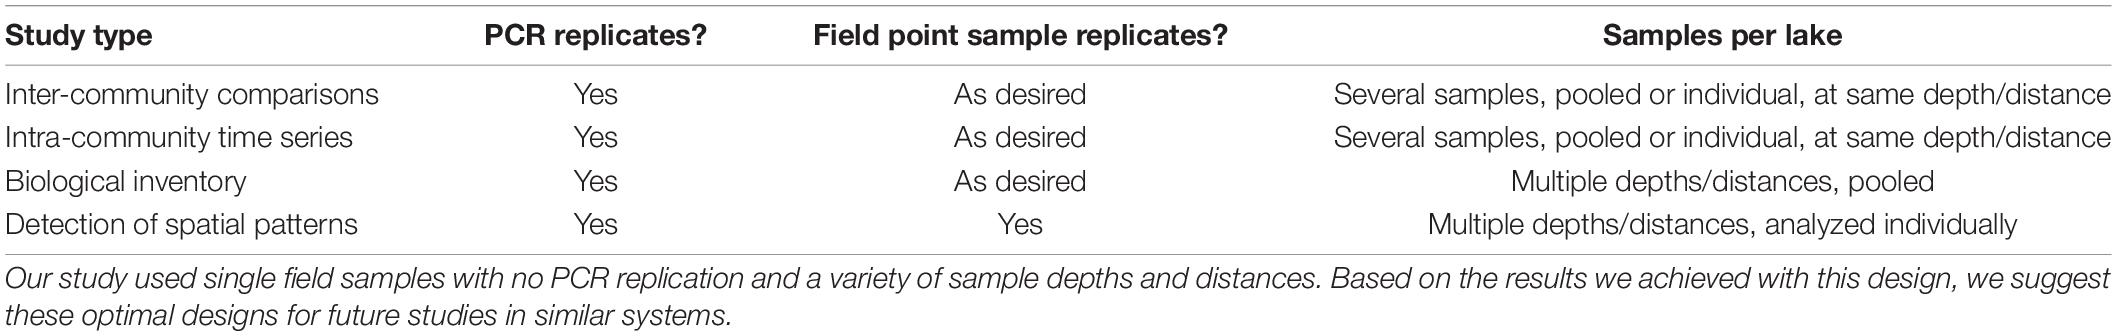
Table 5. eDNA sampling recommendations based on this study of small stratified north temperate lakes.
Terrestrial and Aquatic Plant Diversity and Distribution
Broad airborne distribution of terrestrial plant DNA has been demonstrated to occur, largely mediated by particles other than pollen (Parducci et al., 2017; Sjögren et al., 2017; Johnson et al., 2019). Of the 77 individual vascular plant taxa detected by eDNA analysis in this study, fewer than half are classified as obligate or facultative upland species according to United States federal wetland delineation guidelines (U.S. Army Corps of Engineers, 2018). At this qualitative level, we therefore conclude that the vascular plant eDNA in these lakes is not a general homogenous sampling of the entire surrounding terrestrial area, but rather that the lakes’ eDNA content is enriched in DNA from their local aquatic and shoreline species. However, our hypothesis that nearshore and surface environments will contain more terrestrial plant eDNA is not entirely supported because there is no marked increase in the relative numbers of upland species near the shore (Figure 5C). In fact, upland species are proportionately best represented in the offshore-surface compartment, perhaps owing in part to the lower overall read abundance in those samples (Figure 5B). Another possible explanation for the offshore-surface concentration is that windborne plant detritus settles relatively evenly across the surface of a lake, but once it sinks it is bound to or buried in sediment and less available for sampling in the water column.
The distribution of alpha diversity (Figure 6) across the two spatial dimensions is also somewhat unexpected, showing a small increase in diversity for the nearshore samples as a whole, but no distinction between surface and deep samples. This result partially rejects our hypothesis that diversity is greater both near shore and in shallower water due to light and habitat availability. However, it is conceivable that surface-area eDNA is harder to detect and identify, since ultraviolet light exposure may speed the breakdown of eDNA (Barnes and Turner, 2016).
Overall Taxon Distributions by Lake and Sample Location
Because taxa differ in their DNA shedding rates due to differences in their habitats and physical characteristics (Barnes and Turner, 2016), numbers of sequencing reads recovered from eDNA may not be representative of the absolute numbers or biomass of their associated taxa (Buxton et al., 2017; Fonseca, 2018). The most conservative approach for interpreting highly varied sets of taxa sampled by eDNA methods is therefore to convert read abundances to presences and absences (Ransome et al., 2017). However, we retained the read-number information in our analyses, because relative abundances of a given taxon can be compared among comparably-handled samples (Grey et al., 2018) as long as care is taken not to draw inferences across taxa. Regardless of organism-specific detection and quantification biases, comparable sets of eDNA results still generate “fingerprints” of communities that can be usefully compared and contrasted at a statistical or even ecological level (Leray and Knowlton, 2015).
Among the six studied lakes, three have their largest numbers of reads corresponding to Nuphar variegata (yellow or variegated pond-lily), an emergent aquatic plant. The other three are dominated numerically by algae, either single-celled (e.g., Peridinium) or colonial (e.g., Chrysophyceae, Synura). As mentioned above, read-number dominance does not indicate that pond-lilies or algae are absolutely dominant in area or biomass in these respective lakes; but the relative differences illustrate the inter-lake variability that gives rise to our ability to characterize one sample’s community as different from another. Future work should look for correspondences between lake characteristics and read dominance by vascular plants vs. algae, to determine whether these read number relationships are accurately describing lakes with more or less emergent vegetation or are correlated with any known lake characteristics. Such correspondences could give rise to methods for interrogating other important lake characteristics such as primary production and eutrophication (Hilt et al., 2017; Poikane et al., 2018).
When a study’s primary goal is to develop a reasonably complete catalog of an area’s biodiversity, it is currently recommended to combine eDNA surveys with traditional sampling (Cowart et al., 2015; Olds et al., 2016; Shaw et al., 2016). The two methods have some complementary biases, and each will likely miss a significant number of taxa that are captured by the other (Nguyen et al., 2020). This two-pronged approach may be difficult in environments with barriers to observational sampling, such as remote or marine environments or environments that contain a large proportion of undescribed taxa. However, where the goal is, as in this study, to investigate broad patterns rather than individual species, sampling with consistent eDNA methods can provide useful information even without detailed comparison to conventionally established “ground truth.” When necessary, fingerprints based simply on the presence and relative abundance of genotypes can be usefully compared among sample sites at an ecological or functional level, even when species lists are not complete and sequences are not fully identified (Leray and Knowlton, 2016).
Comparisons With Known Species Inventories
UNDERC maintains lists of terrestrial and aquatic plants found in the general area covered by the research center, and we compared these catalogs with the vascular-plant portion of our eDNA results. Fewer than a third of the vascular plants on the UNDERC area list have species-level ITS1 reference sequence records at NCBI and many taxa were therefore unavailable for identification using the ITS1 marker in our study. Of the many OTUs that were discarded due to identification failure, many presumably belong to these taxa, or to undescribed or unsequenced algae. However, at the genus level, the plants that were identified by eDNA are largely a subset of the listed area genera, indicating that detection and identification of local plants was generally successful. Only six taxa are left as false positives relative to the area species list, and most have reasonable explanations such as being common food or industrial species (guar, soybeans) or species found in the surrounding area (mulberry) (Supplementary Table 3). No lake-specific plant inventories are available from the year in which the eDNA was sampled. Comparisons with earlier macrophyte inventories from 1996 to 1997 were mixed, but this could reflect differences in timing and sampling locations as well as the passage of time. See Supplementary Tables 4, 5 for presence/absence information per lake and taxon.
One clear result is that the eDNA results contain no trace of four of Michigan’s most common non-indigenous invasive lake plants, despite the ITS1 sequences of those plants being available and susceptible to capture by the ITS1-F/-R3 primer set in silico. These species are common reed (Phragmites australis), purple loosestrife (Lythrum salicaria), curly-leaf pondweed (Potamogeton crispus), and Eurasian water-milfoil (Myriophyllum spicatum) (O’Neal and Soulliere, 2006). These species have, in fact, not been historically observed at UNDERC, probably due to strict enforcement of boat transfer and other measures for preventing invasive species transport. This finding establishes what may be a useful historical baseline for future sampling of these frequently researched lakes, and is a demonstration that careful management of lake use can prevent establishment of exotic species (Trebitz et al., 2017).
Performance of eDNA Sampling Methods in This Study
Overall, the study supports the premise that eDNA metabarcoding is accurate and specific, having captured a substantial number of the local area’s known plant genera. Many area plants were not detected, representing false negatives that are largely due to reference database gaps, but could also potentially have been caused by primer biases, sampling methods, and/or seasonality. Specifically, it is possible that our broad assay preferentially amplified the generally shorter ITS1 regions of algae at the expense of vascular plants. On the other side, however, false positives were low. Because our main focus is on diversity metrics rather than species inventory, we retained some doubtful or out-of-range individual species as placeholders for close relatives. Only six genera remained outstanding as false positives relative to the list of known species (Supplementary Table 3). Species accumulation curves (Supplementary Figure 3) show a moderate approach to the asymptote, indicating that many though not all of the available species were detected.
An advantage of the eDNA sampling approach is that difficulties such as reference database incompleteness are not permanent ones, because methods in the capture and analysis of eDNA are rapidly improving (Lacoursière-Roussel and Deiner, 2019). Sequences generated years previously can be reanalyzed and reidentified as often as necessary to provide comparison datasets and historical information. Statistical methods are continually advancing, such that analysis may be repeated with better error correction, more sophisticated algorithms, and more complete reference databases, or simply to ensure analytical consistency with more recent studies.
Conclusion and Future Work
We rejected part or all of our initial hypotheses about the spatial distribution of plant eDNA in these lakes, and therefore conclude that sampling of plants in small temperate lakes of this type is robust to choice of sampling location. Given the subtle differences within lakes, but broad differences among them, the methods employed in this study should perform well for many purposes such as community fingerprinting and time-series monitoring even when limited to easily accessible shore sampling sites. A comprehensive inventory of a given small-lake community, with the intent of capturing the largest possible number of taxa, may nevertheless benefit from spatial diversity in sampling, especially when combined with adequate technical replicates; pooling samples across depth and shore distance may be the best strategy for maximizing taxon recovery. Further work is suggested to quantify the role of small lakes as significant repositories for terrestrial as well as aquatic plant DNA, and to characterize the functional significance of the patterns found in this and similar studies.
Data Availability Statement
The datasets presented in this study can be found in online repositories: NCBI PRJNA693787.
Author Contributions
EL, DL, CG, MP, and SE: concept and designing. EL, CG, and MR: field sampling and lab working. JD, AC, SE, EL, and YL: informatics and analysing. JD, AC, and SE: writing 1st draft. All authors writing final version.
Funding
This work was supported by the Biotechnology Risk Assessment Grant program, Grant No. 2016-33522-25629, from the U. S. Department of Agriculture, and was also supported by the U. S. Environmental Protection Agency Grant EPA-R5-GL2012-1. JD was supported by a Faculty Initiative Fund and an IDEA grant from Rice University to AC and SE.
Conflict of Interest
The authors declare that the research was conducted in the absence of any commercial or financial relationships that could be construed as a potential conflict of interest.
Acknowledgments
JD wishes to thank the two non-coauthor members of her master’s thesis committee: Dr. Evan Siemann (Rice University, BioSciences) and Dr. Todd Treangen (Rice University, Computer Science).
Supplementary Material
The Supplementary Material for this article can be found online at: https://www.frontiersin.org/articles/10.3389/fenvs.2021.617924/full#supplementary-material
Supplementary Figure 1 | Details of OTU clustering and identification pipeline. Software versions of third-party software and descriptions of custom scripts for clustering and BLAST pipeline, including ambiguity resolution.
Supplementary Figure 2 | Spearman correlations with diversity indices among lake covariates. The only factors that display substantial correlation across lake characteristics and biodiversity metrics are the area of the lake and the strength of its depth effect. However, the effect is not statistically significant (P = 0.195), nor are any other correlations across lake characteristics and diversity metrics.
Supplementary Figure 3 | Rarefaction and species accumulation curves. (A) Rarefaction curves by read number and per lake. (B) Species accumulation curve by sample over entire study.
Supplementary Table 1 | Adapter and primer sequences. (A) Illumina Nextera primers used for all libraries. (B) Novel primers for plant and algal ITS1 regions. (C) Adapters, second round of PCR. (D) Barcode index sequences.
Supplementary Table 2 | Species and sequences used in novel ITS1 primer design.
Supplementary Table 3 | Potential false-positive plant taxa. These six records represent the only vascular genera in the eDNA dataset not previously recorded at UNDERC.
Supplementary Table 4 | Macrophyte presences by lake. Wetland statuses follow USDA/USACoE conventions, plus an additional category “AQU” for obligate wetland species that are fully aquatic, i.e., floating and submerged macrophytes.
Supplementary Table 5 | Phytoplankton presences by lake. Bold/highlighted items are the top ten phytoplankton taxa overall by read abundance.
Code Supplement | See supplementary file, or github.com/jennformatics/ITS-eDNA-2021.
Footnotes
- ^ genomics.nd.edu
- ^ ftp://ftp.ncbi.nlm.nih.gov/blast/db/taxdb.tar.gz, retrieved 12/2/2017
- ^ ftp://ftp.ncbi.nih.gov/pub/taxonomy/taxdump.tar.gz, retrieved 12/2/2017
- ^ https://underc.nd.edu/assets/216433/fullsize/francl1996.pdf; https://underc.nd.edu/assets/215506/fullsize/brown1997.pdf
References
Alahuhta, J., Kosten, S., Akasaka, M., Auderset, D., Azzella, M. M., Bolpagni, R., et al. (2017). Global variation in the beta diversity of lake macrophytes is driven by environmental heterogeneity rather than latitude. J. Biogeogr. 44, 1758–1769. doi: 10.1111/jbi.12978
Alsos, I. G., Lammers, Y., Yoccoz, N. G., Jørgensen, T., Sjögren, P., Gielly, L., et al. (2018). Plant DNA metabarcoding of lake sediments: how does it represent the contemporary vegetation. PLoS One 13:e0195403. doi: 10.1371/journal.pone.0195403
Anderson, M. J., Ellingsen, K. E., and McArdle, B. H. (2006). Multivariate dispersion as a measure of beta diversity. Ecol. Lett. 9, 683–693. doi: 10.1111/j.1461-0248.2006.00926.x
Andrews, S. (2010). FastQC: a Quality Control Tool for High Throughput Sequence Data. Available online at: http://www.bioinformatics.babraham.ac.uk/projects/fastqc
Barnes, M. A., and Turner, C. R. (2016). The ecology of environmental DNA and implications for conservation genetics. Conserv. Genet. 17, 1–17. doi: 10.1007/s10592-015-0775-4
Barnes, M. A., Turner, C. R., Jerde, C. L., Renshaw, M. A., Chadderton, W. L., and Lodge, D. M. (2014). Environmental conditions influence eDNA persistence in aquatic systems. Environ. Sci. Technol. 48, 1819–1827. doi: 10.1021/es404734p
Bedwell, M. E., and Goldberg, C. S. (2020). Spatial and temporal patterns of environmental DNA detection to inform sampling protocols in lentic and lotic systems. Ecol. Evol. 10, 1602–1612. doi: 10.1002/ece3.6014
Bolger, A. M., Lohse, M., and Usadel, B. (2014). Trimmomatic: a flexible trimmer for Illumina sequence data. Bioinfomatics 30, 2114–2120. doi: 10.1093/bioinformatics/btu170
Bolpagni, R., Laini, A., Stanzani, C., and Chiarucci, A. (2018). Aquatic plant diversity in Italy: distribution, drivers and strategic conservation actions. Front. Plant Sci. 9:116.
Bosch, N. E., Gonçalves, J. M. S., Erzini, K., and Tuya, F. (2017). “How” and “what” matters: sampling method affects biodiversity estimates of reef fishes. Ecol. Evol. 7, 4891–4906. doi: 10.1002/ece3.2979
Buxton, A. S., Groombridge, J. J., Zakaria, N. B., and Griffiths, R. A. (2017). Seasonal variation in environmental DNA in relation to population size and environmental factors. Sci. Rep. 7:46294.
Camacho, C., Coulouris, G., Avagyan, V., Ma, N., Papadopoulos, J., Bealer, K., et al. (2009). BLAST+: architecture and applications. BMC Bioinform. 10:421. doi: 10.1186/1471-2105-10-421
Cannon, M., Hester, J., Shalkhauser, A., Chan, E. R., Logue, K., Small, S. T., et al. (2015). Deep sequencing of environmental DNA isolated from the Cuyahoga river highlights the utility of river water samples to query surrounding aquatic and terrestrial biodiversity. BioRxiv 3, 77–90.
Chase, D. M., Kuehne, L. M., Olden, J. D., and Ostberg, C. O. (2020). Development of a quantitative PCR assay for detecting Egeria densa in environmental DNA samples. Conserv. Genet. Resour. 12, 545–548. doi: 10.1007/s12686-020-01152-w
Civade, R., Dejean, T., Valentini, A., Roset, N., Raymond, J. C., Bonin, A., et al. (2016). Spatial representativeness of environmental DNA metabarcoding signal for fish biodiversity assessment in a natural freshwater system. PLoS One 11:e0157366. doi: 10.1371/journal.pone.0157366
Cowart, D. A., Pinheiro, M., Mouchel, O., Maguer, M., Grall, J., Miné, J., et al. (2015). Metabarcoding is powerful yet still blind: a comparative analysis of morphological and molecular surveys of seagrass communities. PLoS One 10:e0117562. doi: 10.1371/journal.pone.0117562
Craig, N., Jones, S. E., Weidel, B. C., and Solomon, C. T. (2015). Habitat, not resource availability, limits consumer production in lake ecosystems. Limnol. Oceanogr. 60, 2079–2089. doi: 10.1002/lno.10153
Creer, S., Deiner, K., Frey, S., Porazinska, D., Taberlet, P., Thomas, W. K., et al. (2016). The ecologist’s field guide to sequence-based identification of biodiversity. Methods Ecol. Evol. 7, 1008–1018. doi: 10.1111/2041-210x.12574
Cristescu, M. E., and Hebert, P. D. N. (2018). Uses and misuses of environmental DNA in biodiversity science and conservation. Annu. Rev. Ecol. Evol. Syst. 49, 209–230. doi: 10.1146/annurev-ecolsys-110617-062306
Deiner, K., Bik, H. M., Mächler, E., Seymour, M., Lacoursière-Roussel, A., Altermatt, F., et al. (2017a). Environmental DNA metabarcoding: transforming how we survey animal and plant communities. Mol. Ecol. 26, 5872–5895. doi: 10.1111/mec.14350
Deiner, K., Fronhofer, E. A., Mächler, E., Walser, J. C., and Altermatt, F. (2016). Environmental DNA reveals that rivers are conveyer belts of biodiversity information. Nat. Commun. 7:12544.
Deiner, K., Renshaw, M. A., Li, Y., Olds, B. P., Lodge, D. M., and Pfrender, M. E. (2017b). Long-range PCR allows sequencing of mitochondrial genomes from environmental DNA. Methods Ecol. Evol. 8, 1888–1898. doi: 10.1111/2041-210x.12836
Deiner, K., Walser, J.-C., Mächler, E., and Altermatt, F. (2015). Choice of capture and extraction methods affect detection of freshwater biodiversity from environmental DNA. Biol. Conserv. 183, 53–63. doi: 10.1016/j.biocon.2014.11.018
Díaz, S., Fargione, J., Chapin, F. S., and Tilman, D. (2006). Biodiversity loss threatens human well-being. PLoS Biol. 4:e277. doi: 10.1371/journal.pbio.0040277
Edgar, R. C., and Bateman, A. (2010). Search and clustering orders of magnitude faster than BLAST. Bioinformatics 26, 2460–2461. doi: 10.1093/bioinformatics/btq461
Egan, S. P., Barnes, M. A., Hwang, C.-T., Mahon, A. R., Feder, J. L., Ruggiero, S. T., et al. (2013). Rapid invasive species detection by combining environmental DNA with light transmission spectroscopy. Conserv. Lett. 6, 402–409. doi: 10.1111/conl.12017
Egan, S. P., Ragland, G. J., Assour, L., Powell, T. H. Q., Hood, G. R., Emrich, S., et al. (2015). Experimental evidence of genome-wide impact of ecological selection during early stages of speciation-with-gene-flow. Ecol. Lett. 18, 817–825. doi: 10.1111/ele.12460
Fahner, N. A., Shokralla, S., Baird, D. J., and Hajibabaei, M. (2016). Large-scale monitoring of plants through environmental DNA metabarcoding of soil: recovery, resolution, and annotation of four DNA markers. PLoS One 11:e0157505. doi: 10.1371/journal.pone.0157505
Fonseca, V. G. (2018). Pitfalls in relative abundance estimation using eDNA metabarcoding. Mol. Ecol. Resour. 18, 923–926. doi: 10.1111/1755-0998.12902
Fujiwara, A., Matsuhashi, S., Doi, H., Yamamoto, S., and Minamoto, T. (2016). Use of environmental DNA to survey the distribution of an invasive submerged plant in ponds. Freshw. Sci. 35, 748–754. doi: 10.1086/685882
Gantz, C. A., Renshaw, M. A., Erickson, D., Lodge, D. M., and Egan, S. P. (2018). Environmental DNA detection of aquatic invasive plants in lab mesocosm and natural field conditions. Biol. Invasions 20, 2535–2552. doi: 10.1007/s10530-018-1718-z
Giguet-Covex, C., Pansu, J., Arnaud, F., Rey, P. J., Griggo, C., Gielly, L., et al. (2014). Long livestock farming history and human landscape shaping revealed by lake sediment DNA. Nat. Commun. 5:4211.
Grey, E. K., Bernatchez, L., Cassey, P., Deiner, K., Deveney, M., Howland, K. L., et al. (2018). Effects of sampling effort on biodiversity patterns estimated from environmental DNA metabarcoding surveys. Sci. Rep. 11:8843.
Harper, L. R., Lawson Handley, L., Carpenter, A. I., Ghazali, M., Di Muri, C., Macgregor, C. J., et al. (2019). Environmental DNA (eDNA) metabarcoding of pond water as a tool to survey conservation and management priority mammals. Biol. Conserv. 238:108225. doi: 10.1016/j.biocon.2019.108225
Hatzenbeler, G. R., Kampa, J. M., Jennings, M. J., and Emmons, E. E. (2004). A comparison of fish and aquatic plant assemblages to assess ecological health of small Wisconsin lakes. Lake Reserv. Manag. 20, 211–218. doi: 10.1080/07438140409354245
Hilt, S., Brothers, S., Jeppesen, E., Veraart, A. J., and Kosten, S. (2017). Translating regime shifts in shallow lakes into changes in ecosystem functions and services. BioScience 67, 928–936. doi: 10.1093/biosci/bix106
Johnson, M. D., Cox, R. D., and Barnes, M. A. (2019). The detection of a non-anemophilous plant species using airborne eDNA. PLoS One 14:e0225262. doi: 10.1371/journal.pone.0225262
Keller, S. R., Hilderbrand, R. H., Shank, M. K., and Potapova, M. (2017). Environmental DNA genetic monitoring of the nuisance freshwater diatom, Didymosphenia geminata, in eastern North American streams. Divers. Distrib. 23, 381–393. doi: 10.1111/ddi.12536
Kelly, P. T., Solomon, C. T., Weidel, B. C., and Jones, S. E. (2014). Terrestrial carbon is a resource, but not a subsidy, for lake zooplankton. Ecology 95, 1236–1242. doi: 10.1890/13-1586.1
Kelly, R. P., Gallego, R., and Jacobs-Palme, E. (2018). The effect of tides on nearshore environmental DNA. PeerJ 6:e4521. doi: 10.7717/peerj.4521
Kuehne, L. M., Ostberg, C. O., Chase, D. M., Duda, J. J., and Olden, J. D. (2020). Use of environmental DNA to detect the invasive aquatic plants Myriophyllum spicatum and Egeria densa in lakes. Freshw. Sci. 39.
Lacoursière-Roussel, A., and Deiner, K. (2019). Environmental DNA is not the tool by itself. J. Fish Biol. 98, 383–386. doi: 10.1111/jfb.14177
Larson, E. R., Graham, B. M., Achury, R., Coon, J. J., Daniels, M. K., Gambrell, D. K., et al. (2020). From eDNA to citizen science: emerging tools for the early detection of invasive species. Front. Ecol. Environ. 18, 194–202. doi: 10.1002/fee.2162
Lawson Handley, L., Read, D. S., Winfield, I. J., Kimbell, H., Johnson, H., Li, J., et al. (2019). Temporal and spatial variation in distribution of fish environmental DNA in England’s largest lake. Environ. DNA 1, 26–395. doi: 10.1002/edn3.5
Leray, M., and Knowlton, N. (2015). DNA barcoding and metabarcoding of standardized samples reveal patterns of marine benthic diversity. Proc. Natl. Acad. Sci. USA 112, 2076–2081. doi: 10.1073/pnas.1424997112
Leray, M., and Knowlton, N. (2016). Censusing marine eukaryotic diversity in the twenty-first century. Philos. Trans. R. Soc. B Biol. Sci. 371:20150331. doi: 10.1098/rstb.2015.0331
Leray, M., and Knowlton, N. (2017). Random sampling causes the low reproducibility of rare eukaryotic OTUs in Illumina COI metabarcoding. PeerJ 5:e3006. doi: 10.7717/peerj.3006
Lodge, D. M., Turner, C. R., Jerde, C. L., Barnes, M. A., Chadderton, L., Egan, S. P., et al. (2012). Conservation in a cup of water: estimating biodiversity and population abundance from environmental DNA. Mol. Ecol. 21, 2555–2558. doi: 10.1111/j.1365-294x.2012.05600.x
Lõhmus, A., Lõhmus, P., and Runnel, K. (2018). A simple survey protocol for assessing terrestrial biodiversity in a broad range of ecosystems. PLoS One 13:e0208535. doi: 10.1371/journal.pone.0208535
Longmire, J. L., Maltbie, M., and Baker, R. J. (1997). “Use of “lysis buffer” in DNA isolation and its implication for museum collections,” in Occasional Papers, Museum of Texas Tech University, (Lubbock, TX: Museum of Texas Tech University).
Mantzouki, E., Beklioglu, M., Brookes, J. D., de Senerpont Domis, L. N., Dugan, H. A., Doubek, J. P., et al. (2018). Snapshot surveys for lake monitoring, more than a shot in the dark. Front. Ecol. Evol. 6:201.
Matsuhashi, S., Doi, H., Fujiwara, A., Watanabe, S., and Minamoto, T. (2016). Evaluation of the environmental DNA method for estimating distribution and biomass of submerged aquatic plants. PLoS One 11:e0156217. doi: 10.1371/journal.pone.0156217
McMurdie, P. J., and Holmes, S. (2013). phyloseq: an r package for reproducible interactive analysis and graphics of microbiome census data. PLoS One 8:e61217. doi: 10.1371/journal.pone.0061217
Nguyen, B. N., Shen, E. W., Seemann, J., Correa, A. M. S., O’Donnell, J. L., Altieri, A. H., et al. (2020). Environmental DNA survey captures patterns of fish and invertebrate diversity across a tropical seascape. Sci. Rep. 10:6729.
O’Neal, R. P., and Soulliere, G. J. (2006). Conservation Guidelines for Michigan Lakes and Associated Natural Resources. Available online at: http://www.michigan.gov/dnr/ (accessed June 2018).
Oertli, B., Joye, D. A., Castella, E., Juge, R., Lehmann, A., and Lachavanne, J. B. (2005). PLOCH: A standardized method for sampling and assessing the biodiversity in ponds. Aquatic Conserv. Mar. Freshw. Ecosyst. 15, 665–679. doi: 10.1002/aqc.744
Oksanen, J., Blanchet, F. G., Friendly, M., Kindt, R., Legendre, P., McGlinn, D., et al. (2019). Vegan: Community Ecology Package. Available online at: https://cran.r-project.org/package=vegan.
Olds, B. P., Jerde, C. L., Renshaw, M. A., Li, Y., Evans, N. T., Turner, C. R., et al. (2016). Estimating species richness using environmental DNA. Ecol. Evol. 6, 4214–4226.
Olinger, L. K., Heidmann, S. L., Durdall, A. N., Howe, C., Ramseyer, T., Thomas, S. G., et al. (2017). Altered juvenile fish communities associated with invasive Halophila stipulacea seagrass habitats in the U. S. Virgin Islands. PLoS One 12:e0188386. doi: 10.1371/journal.pone.0188386
Parducci, L., Bennett, K. D., Ficetola, G. F., Alsos, I. G., Suyama, Y., Wood, J. R., et al. (2017). Ancient plant DNA in lake sediments. New Phytol. 214, 924–942. doi: 10.1111/nph.14470
Poikane, S., Portielje, R., Denys, L., Elferts, D., Kelly, M., Kolada, A., et al. (2018). Macrophyte assessment in European lakes: diverse approaches but convergent views of ‘good’ ecological status. Ecol. Indic. 94, 185–197. doi: 10.1016/j.ecolind.2018.06.056
Ransome, E., Geller, J. B., Timmers, M., Leray, M., Mahardini, A., Sembiring, A., et al. (2017). The importance of standardization for biodiversity comparisons: a case study using autonomous reef monitoring structures (ARMS) and metabarcoding to measure cryptic diversity on Mo’orea coral reefs, French Polynesia. PLoS One 12:e0175066. doi: 10.1371/journal.pone.0175066
Rees, H. C., Maddison, B. C., Middleditch, D. J., Patmore, J. R. M., and Gough, K. C. (2014). The detection of aquatic animal species using environmental DNA - a review of eDNA as a survey tool in ecology. J. Appl. Ecol. 51, 1450–1459. doi: 10.1111/1365-2664.12306
Renshaw, M. A., Olds, B. P., Jerde, C. L., Mcveigh, M. M., and Lodge, D. M. (2015). The room temperature preservation of filtered environmental DNA samples and assimilation into a phenol-chloroform-isoamyl alcohol DNA extraction. Mol. Ecol. Resour. 15, 168–176. doi: 10.1111/1755-0998.12281
Sand-Jensen, K., Andersen, M. R., Martinsen, K. T., Borum, J., Kristensen, E., and Kragh, T. (2019). Shallow plant-dominated lakes - extreme environmental variability, carbon cycling and ecological species challenges. Ann. Bot. 124, 355–366. doi: 10.1093/aob/mcz084
Scriver, M., Marinich, A., Wilson, C., and Freeland, J. (2015). Development of species-specific environmental DNA (eDNA) markers for invasive aquatic plants. Aquat. Bot. 122, 27–31. doi: 10.1016/j.aquabot.2015.01.003
Shaw, J. L. A., Clarke, L. J., Wedderburn, S. D., Barnes, T. C., Weyrich, L. S., and Cooper, A. (2016). Comparison of environmental DNA metabarcoding and conventional fish survey methods in a river system. Biol. Conserv. 197, 131–138. doi: 10.1016/j.biocon.2016.03.010
Shneiderman, B. (1992). Tree visualization with Tree-Maps: 2-d space-filling approach. ACM Trans. Graph. 11, 92–99. doi: 10.1145/102377.115768
Sjögren, P., Edwards, M. E., Gielly, L., Langdon, C. T., Croudace, I. W., Merkel, M. K. F., et al. (2017). Lake sedimentary DNA accurately records 20th Century introductions of exotic conifers in Scotland. New Phytol. 213, 929–941. doi: 10.1111/nph.14199
Thomsen, P. F., and Willerslev, E. (2015). Environmental DNA - An emerging tool in conservation for monitoring past and present biodiversity. Biol. Conserv. 183, 4–18. doi: 10.1016/j.biocon.2014.11.019
Tickner, D., Opperman, J. J., Abell, R., Acreman, M., Arthington, A. H., Bunn, S. E., et al. (2020). Bending the curve of global freshwater biodiversity loss: an emergency recovery plan. BioScience 70, 330–342. doi: 10.1093/biosci/biaa002
Trebitz, A. S., Hoffman, J. C., Darling, J. A., Pilgrim, E. M., Kelly, J. R., C1, E. A., et al. (2017). Early detection monitoring for aquatic non-indigenous species: optimizing surveillance, incorporating advanced technologies, and identifying research needs. J. Environ. Manag. 202, 299–310. doi: 10.1016/j.jenvman.2017.07.045
Trolliet, F., Huynen, M.-C., Vermeulen, C., and Hambuckers, A. (2014). Use of camera traps for wildlife studies. a review. Biotechnol. Agron. Soc. Environ. 18, 446–454.
Turner, C. R., Barnes, M. A., Xu, C. C. Y., Jones, S. E., Jerde, C. L., and Lodge, D. M. (2014). Particle size distribution and optimal capture of aqueous macrobial eDNA. Methods Ecol. Evol. 5, 676–684. doi: 10.1111/2041-210x.12206
Untergasser, A., Cutcutache, I., Koressaar, T., Ye, J., Faircloth, B. C., Remm, M., et al. (2012). Primer3-new capabilities and interfaces. Nucleic Acids Res. 40:e115. doi: 10.1093/nar/gks596
Valentini, A., Taberlet, P., Miaud, C., Civade, R., Herder, J., Thomsen, P. F., et al. (2016). Next-generation monitoring of aquatic biodiversity using environmental DNA metabarcoding. Mol. Ecol. 25, 929–942. doi: 10.1111/mec.13428
Keywords: aquatic plants, ITS1, freshwater, biodiversity, monitoring, environmental DNA, metabarcoding
Citation: Drummond JA, Larson ER, Li Y, Lodge DM, Gantz CA, Pfrender ME, Renshaw MA, Correa AMS and Egan SP (2021) Diversity Metrics Are Robust to Differences in Sampling Location and Depth for Environmental DNA of Plants in Small Temperate Lakes. Front. Environ. Sci. 9:617924. doi: 10.3389/fenvs.2021.617924
Received: 15 October 2020; Accepted: 10 March 2021;
Published: 10 May 2021.
Edited by:
Hiroki Yamanaka, Ryukoku University, JapanReviewed by:
Inger Greve Alsos, Arctic University of Norway, NorwayKevin Leempoel, Royal Botanic Gardens, Kew, United Kingdom
Copyright © 2021 Drummond, Larson, Li, Lodge, Gantz, Pfrender, Renshaw, Correa and Egan. This is an open-access article distributed under the terms of the Creative Commons Attribution License (CC BY). The use, distribution or reproduction in other forums is permitted, provided the original author(s) and the copyright owner(s) are credited and that the original publication in this journal is cited, in accordance with accepted academic practice. No use, distribution or reproduction is permitted which does not comply with these terms.
*Correspondence: Jennifer A. Drummond, amVubkByaWNlLmVkdQ==; amVubi5kcnVtbW9uZEBnbWFpbC5jb20=