 Salih Kalaycı1*
 Cihan Özden2
- 1Faculty of Humanities and Social Sciences, Department of International Trade and Logistics, Bursa Technical University, Bursa, Turkey
- 2Graduate School of Social Sciences, Near East University, Nicosia, Cyprus
The major goal of this paper is to focus on the linkage between sea transportation, trade liberalization and industrial development in the context of carbon dioxide emission. With this respect, it is attempted to analyze the effects of independent variables on the dependent variable carbon dioxide emission for China by using annual data ranging from 1960 to 2019 with the help of econometric methods such as fully modified least square, dynamic ordinary least square, canonical co-integrating regression, autoregressive distributed lag bound test and generalized moments method. According to the results of fully modified least square, dynamic ordinary least square and canonical co-integrating regression models, there is a significant long-term relationship between sea transportation, trade liberalization, industrial development and carbon dioxide emissions. On the other hand, short term autoregressive distributed lag bound test estimation results reveal that the main determinants of carbon dioxide emission in the short-run are industrial development and sea transportation. The empirical tests reveal important results for policy-makers in China.
Introduction
One of the most frequently discussed global issues in recent years has been environmental destruction in the context of global warming and climate change. The leading cause of global warming is the rapid increase in greenhouse gases in the atmosphere. The main gas causing the greenhouse effect is carbon dioxide (CO2) gas emitted to the atmosphere by using fossil fuels such as gasoline, coal and natural gas. Mass production and excessive consumption, which started with the industrial revolution, increased energy needs and this requirement were met mostly from fossil fuels. For many years, fossil fuel energy demand has reached exponential growth, causing pollution on the environment. Thus, the countries that focused on the economic growth target caused CO2 emissions and led to global warming. The emergence of environmental pollution as a result of industrialization has begun to be discussed in academic literature in recent years. One of the most important sources of this trend is the report “The Limits to Growth” prepared by the Roman Club in 1972. According to the report, “If the current growth of industrialization continues in terms of food production, consumption of natural resources and CO2 emissions, economic growth will damage the environment in our world in the next 100 years” (Meadows et al., 1972). The report achieved to attract the needed attention to the concept of sustainability.
Many studies have examined the dynamic relationships between environmental pollution and economic variables by using various econometric models. This nexus is mainly investigated by the environmental Kuznets curve (EKC) hypothesis, stating an inverted-U shaped relationship between environmental degradation and economic growth, as a base model in the relevant literature. However, the linkage among sea transportation, trade liberalization and industrial development in the context of CO2 emissions is a new topic to be studied. China has witnessed tremendous economic growth, as well as rapid expansion in both the financial and labor sectors for the last 20 years. Nowadays, China is the second-largest economy in the world. Besides, economic growth was accompanied by increased fuel energy consumption and thus CO2 emissions. Therefore, selecting China for such a study would be ideal, as studying China would provide us with significant results that could be used for other developing countries.
The primary goal of this paper is to contribute to the existing literature by investigating the relationship between maritime transportation, trade liberalization and industrial development in the context of CO2 by using various econometrical models. In this context, it is attempted to reveal the effects of independent variables on China’s CO2 emissions covering the years between 1960 and 2019.
On the other hand, the main purpose of this research is to address the problems in terms of environmental economy by giving some suggestions to Chinese government. As stated in the Kyoto Protocol, emissions from shipping cannot be attributed to any national economy. The maritime industry’s significant emission reductions require all sanctions for the fundamental and continuous elimination of carbon leakage. In this sense, the major questions of interest are whether sea transportation activities enhance industrial development and if sea transportation activities increase energy use and CO2 emissions.
Finally, the consequences of trade taxes including sum of exports and imports of goods and services along with its coefficient of influence in terms of CO2 emissions are discussed in order to contribute the which policy should Chinese government follow.
The study is structured as follows: Following the introduction, “Literature Review” section presents the theoretical background of relevant literature; “Methodology and Data Analysis” section includes Methodology and Data Analysis and consequently “Conclusion” section conclude this article by providing some policy recommendations.
Literature Review
The logistics sector is directly or indirectly interacting with many sectors in today’s globalizing world and plays a vital role in trading activities. With the invention of the steamship and shipping container, transportation costs decreased significantly, leading to the golden age of international trade. In this respect, maritime transportation has made significant progress in national/international freight and passenger transport, enabling it to take a more active role in transportation activities. Looking at the history of maritime transport, which has shown a positive development in the logistics sector from the past to the present; it can be stated that it has a significant role in the development of national and international economies as well as in the regulation of social and political events.
The transportation sector has developed through the industrialization process, and as a result, carbon emissions have increased day by day, especially in industrialized countries. Trade liberalization, transportation, and industrial development are some of the variables discussed regarding the environmental consequences in academic literature. Hassan and Nosheen (2018) investigate the effects of trade openness, energy usage and economic growth on carbon dioxide leakage based on the EKC hypothesis for Pakistan. According to their findings, economic growth is positively connected to carbon dioxide emissions. Population growth and trade liberalization have a considerably negative effect on CO2 leakage during the short-term, whereas, in the long-term, the course is the opposite. In addition, Granger causality test indicates that a bi-directional causality exists from energy consumption and economic growth to CO2 emission. One-way causality exists running from trade liberalization to CO2 emissions. Jebli and Belloumi (2017) state that sea transportation, waste usage and combustible renewables significantly affect the carbon dioxide emissions, while any rise in sea transportation reduce the consumption of combustible renewables and waste usage. Besides, sea transportation is significantly correlated with carbon dioxide leakage, demonstrating that Tunisian transportation is so contaminated due to excessive non-renewable energy consumption. Consequently, sea transportation is the main contributor to air pollution and leads to carbon dioxide emissions in Tunisia. Nakayama et al., 2015 find that continental sea transportation in Japan is one of the main causes of CO2 emissions. Zhu et al., 2018 indicate that carbon emissions arising from sea transportation can motivate main actors to benefit from new technologies, provide more carbon-efficient vessels allowing green energy. Besides, the efficacy of sea transport emissions trading system is more obvious when bunker fuel prices are excessive. In this sense, the findings ascertain that bunker fuel prices have a larger impact on CO2 reduction than implementing stricter CO2 allowance allocation. Their work involves the formulation of sea transport emissions trading system policies and ensures suggestions in order to decrease the sea transport emissions to fulfill the shipping industry’s impetus by providing its environmental performance.
Katircioğlu (2014a) demonstrates that energy usage has positive, while incoming tourists and economic growth have a negative effect on carbon dioxide emission in the long-run. It is further clarified that Singapore has an inverted U-shaped environmental Kuznets curve, and regardless of the energy usage level, carbon dioxide emission follow a declining trend in Singapore. Besides, the relationship among sustainability of the environment, energy efficiency and tourism industry development can be clarified by the tourism-induced environmental Kuznets curve hypothesis. According to which, in the beginning period of its trend, the tourism sector lead to environmental pollution until the Frontier point of country income is reached. In addition, as this point of income is reached, however, it is expected to follow a downward point in the declining level.
Katircioglu et al. (2018a) express that industrial development, aggregate households, and urban areas result in additional energy demand, which causes an expansion in carbon dioxide emissions. They empirically proved the urbanization-induced environmental Kuznets curve hypothesis and thus searched the long-run equilibrium linkage causality among CO2 emissions and urban development from energy usage and real income growth in the world. Katircioglu et al. (2018b) assert that the tourism industry is relied majorly on infrastructure potentials including highways, airports, harbors, hotels and holiday village. However, it can be inevitable that the tourism industry and its factors will considerably influence environmental quality. Besides, abuse of natural resources is one of the required operations in terms of attracting more individuals and ensuring a competitive tourism industry. Deforestation, abusing the raw materials and over-utilizing the natural water are some of the compromises made to engender the tourism industry by constructing hotels and other facilities. Thus, exploitation of natural resources can cause undesirable environmental effects including excessive CO2 emission, air pollution and erosion. In this sense, the findings of their work demonstrate that U-shaped is confirmed in the context of the EKC hypothesis for the main tourist attracting countries. Consequently, leading tourist attracting countries operate tourism and urban development by controlling environmental pollution in the right manner.
Katircioğlu (2014b) indicates that the tourism industry causes the rise of CO2 emission for Cyprus, an economy known for its extreme demand for tourism activities. Köksal et al. (2020) confirm the EKC hypothesis in Turkey by using shadow economies in their model. Mehrara and ali Rezaei (2013) examine the linkage among economic growth, CO2 emissions and trade openness through econometric models of cointegration test and a panel data analysis from 1960 to 1996 for BRICS countries. They reveal a cointegration linkage among CO2 emissions, economic growth and trade openness by using Kao panel cointegration test. They find proof demonstrating that in the long-term trade openness has a considerable positive effect on CO2.
Kuik and Gerlagh (2003) find out the impact of trade openness on CO2 emissions. They use quantitative estimates of CO2 emissions by taking into account the Kyoto Protocol and free trade through lowering the import tariff, which is determined in the Uruguay Round of the multilateral trade agreement. In addition, lowering import tariff causes CO2 emissions and the costs of abating the trade-induced CO2 emission are relative to the welfare gains of free trade. In this context, analysis of the trade-induced CO2 emissions demonstrates distinct differences among emissions caused by lowering import tariff on energy products and by on non-energy products. It demonstrates distinct differences in leakage responses between developing countries as well. Managi et al. (2008) point out that the effect of trade liberalization on environmental pollution by implementing the instrumental variables technique. They show that the effect is considerable in the long-run, after the dynamic adjustment process, although it is small in the short-run and trade is determined as an advantageous factor in terms of the environment in OECD economies. It has a prejudicial impact, however, on CO2 leakage and sulfur dioxide SO2 in non-OECD economies, although it does lower biochemical oxygen demand (BOD) emissions in these countries. Consequently, trade liberalization affects CO2 leakage by way of the environmental regulation impact and capital influence.
Baek and Kim (2014) reveal that trade volume to CO2 leakage and energy causality holds for the developed economies; changes in the degree of trade liberalization lead to corresponding changes in the rates of growth in emissions and energy usage. In this sense, CO2 leakage and energy usage to trade volume is found to hold for the developing economies; any shocks in emissions and energy consumption influence the fluctuations in terms of trade liberalization. Shahbaz et al. (2013) point out the impact of trade liberalization, economic growth and coal consumption on CO2 leakage by implementing time series analysis from 1965 to 2008 for South Africa. Autoregressive distributed lag (ARDL) bounds testing approach to cointegration has been implemented to analyze the long-term linkage between the variables while short-term dynamics have been examined by using ECM model. Their results verified the long-term linkage between the relevant variables. Findings indicate that an increase in GDP raises CO2 leakage, while financial development decreases it. Moreover, coal consumption has a remarkable effect of polluting the environment in South Africa. Trade liberalization factor has a positive impact on environmental quality by decreasing the growth of energy pollutants. Finally, their findings confirm the existence of EKC.
Shen (2008) demonstrates that the factor endowment hypothesis is considered by several pollutants in academic works, while there seems no proof of the pollution haven hypothesis. Combining with all the estimated elasticities of scale and technique influences, composition impacts and trade intensity on CO2 leakage, found that raising trade volume has opposite effects on CO2 emissions because of different pollutants. Both SO2 and dust fall cause emissions, while trade openness decreases emissions. Oh and Bhuyan (2018) examine the linkage among energy usage, GDP, trade liberalization, and carbon dioxide (CO2) leakage in Bangladesh from 1975 to 2013. They use ARDL bounds test to cointegration for establishing the existence of a long-term linkage. Conversely, the estimated coefficients for trade openness and GDP are negative both in short-term and long-term. They recommend that the government of Bangladesh support the appropriate policy to use alternative energy facilities that would not emit much CO2 emission.
Zandi et al. (2019) investigate the effect of trade openness on CO2 emissions. They implemented the panel data analysis for 105 developed and developing countries from the period of 1990–2017. The findings of FMOLS and DOLS verify that all variables are linked in the long-term. The results of long-term coefficient verify that the trade openness has a positive impact on CO2 emissions and cause to increase environmental pollution. The findings of heterogeneous panel causality verify that there is a one-way causal linkage among trade openness and environmental pollution where causality is running from trade openness to environmental pollution. Besides, they determine a two-way causal linkage of environmental pollution with renewable energy utilization in all chosen countries.
Ozatac et al. (2017) examine the EKC hypothesis for Turkey from 1960–2013 by considering the energy usage, trade openness, financial development and CO2 emissions. The findings of the ARDL bound test and the error correction model through autoregressive distributed lag mechanism demonstrated long-term linkage between the relevant variables as well as evidence of the EKC hypothesis. They confirmed causal linkage between the variables and proposed a “polluter pays” mechanism to maintain the awareness of a clean environment. Ali et al. (2019) show a statistically inconsequential correlation among CO2 emissions, GDP and industrial development of Pakistan. Li et al. (2018) discuss the immense and widening energy consumption, Air Quality Index and CO2 efficiency score gap among Chinese regions. The lower CO2 and Air Quality Index efficiency scores mainly focused in the western cities. They recommend that China needs to pay more attention to the different economic levels, social development, industrial structures, energy consumption, and R&D in the western regions and apply systematic solutions based on domestic meteorological and climatic conditions, economic and social development.
Dong et al. (2019) apply the Stochastic Impacts by Regression on Population, Affluence, and Technology model and an unbalanced panel dataset of 128 countries from 1990 to 2014 in order to investigate the effects of the local and global CO2 emissions by considering the effectiveness of renewable and non-renewable energies. According to their results, renewable energy can lead to a decline in CO2 emissions and confirm the causality relationships between the variables across regions.
Dong et al. (2020) examine the impact of renewable energy consumption on CO2 emissions classifies economies with different income levels, the emission growth renewables relations for a global panel of 120 economies and four income based subpanels from 1995–2015. Cross-sectional dependence and slope heterogeneity are verified for the global panel including for all four subpanels. High-income subpanel and upper-middle-income subpanel is confirmed the environmental Kuznets curve hypothesis considering the global panel. Finally, according to their empirical work, renewable energy consumption has a negative impact on CO2 emissions which is not crucial; the mitigation impact may be camouflaged by higher economic growth and increasing non-renewable energy consumption.
Sarkodie et al. (2020) accentuate a policy-driven factors in terms of human capital, trade, natural resource exploitation, and income level in a pollution and carbon emissions function by implementing the Prais-Winsten first-order autoregressive regression, Utest, SIMPLS, and dynamic ARDL, through robust standard errors from 1961 to 2016 for China. Research results reveal that human capital and fossil fuel energy usage are causative factors for climatic variation. The abrupt rise in renewable energy, income level, and environmental sustainability has a decreasing influence on pollution and carbon emissions. The environmental Kuznets curve (EKC) hypothesis is confirmed in both degradation function and carbon emissions.
The theoretical influencing factors are taken into consideration in terms of environmental Kuznets curve (EKC) hypothesis by considering the relationship sea transportation, trade liberalization and industrial development on CO2 from 1960–2019. According to empirical work of this manuscript, entire independent variables statistically conduce to environmental pollution which does not confirm the EKC. In this context, there is no U-shape or inverted U-shape due to the steady course of correlation coefficient, the EKC hypothesis is not confirmed for China. The Chinese government should separate industrial activity as dirty and clean, by focusing the characteristics of the industries, it can be seen that these are classified as sectors that create high levels of environmental pollution, release intensive toxic waste per unit production, high pollution reduction cost per unit operating cost, energy-intensive per unit production in order to diminish the environmental pollution. The choice of mode of production is mainly determined by the convenience of local availability of raw materials and energy, trends in the trade of semi-finished products, environmental regulations in the country, their implementation and related policies. It can be said that dirty industries endanger the environment, because they have to use unclean production techniques at different stages of their production processes. In the light of these facts, it can be predicted that China can reduce environmental pollution by supporting companies that produce in environmentally friendly sectors by concentrating more on the solar energy, water filtration, and drainage systems through government subsidized incentives.
The other crucial method in order to reduce China’s environmental footprint is decreasing vessel’s fuel consumption through ambitious fuel saving targets and hold to maintain the fuel-saving system across the fleet. Thus, marine transportation sector will be operating on fuels developed from renewable energy. This would ensure China to carry out vessels thriftily by positive environmental effect.
Methodology and Data Analysis
This manuscript examines the nexus between sea transportation, trade liberalization, industrial development and carbon dioxide emissions by implementing FMOLS, DOLS, CCR and ARDL model. Annual data are obtained by CO2 Emissions Indicator, Industry (Including Construction), goods and services (BPM5): Trade Openness Indicators and World Merchant Fleet from UNCTAD (2020) and World bank (2020a), World bank (2020b), World bank (2020c) official website. In this context, Perron (1989) and Zivot and Andrews (2002) unit root tests are implemented in order to analyze whether variables are stationary or not. Afterward, FMOLS, DOLS, CCR and ARDL method are used to reveal the cointegration relationship among sea transportation, trade liberalization, industrial development and carbon dioxide emissions. In the last part of the analysis, GMM test is undertaken to demonstrate the impact of sea transportation, trade liberalization and industrial development on carbon dioxide emissions for China from 1960–2019 using yearly data. In this manuscript, log-linear specifications of the variables are implemented to estimate the equation below:
where CO2t, Sea_trnst, Trade_lbrt, Indust_devt indicate carbon dioxide emissions, sea transportation, trade liberalization and industrial development respectively. β1, β2 and β3 provide the elasticity of the explanatory variables.
Perron (1989) (see Table 1.) test is undertaken in order to reveal the structure of the series in terms of stationarity. In this sense, according to Perron (1989) test results, all series including sea transportation, trade liberalization, industrial development and carbon dioxide emissions are not stationary. For this reason, first differences of all series are taken to comprehend the structure of series in terms of stationarity. According to results of Perron (1989) test, series become stationary after taking first differences of variables. Thus, FMOLS, DOLS, CCR test can be implemented. However, performing traditional (Perron, 1989) unit root test without considering these structural breaks in the model may give false results and lose reliability in terms of estimation. Therefore, Zivot and Andrews (2002) develop a series of tests to consider endogenous structural changes. The test allows the evaluation of the presence of a unit root against the alternative of a stationary process through a structural change both in level or trend. Thus, the ZA test investigates the possibility of the existence of a segmented trend (see Table 2). ZA test tries to determine the structural break and treat it as endogenous in the selected sample. The following equation regarding ZA test is indicated below;
Consequently, the model for CO2 emissions in China would be as follows:
CO2 is the logarithm of carbon dioxide emissions expressed in levels, α is a constant, DU (λ) is a dummy variable that takes the value as 1 from the series in which the structural change is considered to have the value of 0 in previous years, the variable of t represents the time, CO2 −1 is carbon dioxide emissions lagging one period. DT (λ) = t − Tλ if t > Tλ and 0 if this is not the case. The next term is the sum of the change in the variable of interest for periods t − j through k; The regressors of this term are added to eliminate the possible dependence on the limit distribution used in statistical tests, caused by the temporal dependence of the distributions. Finally, ε is the error term.
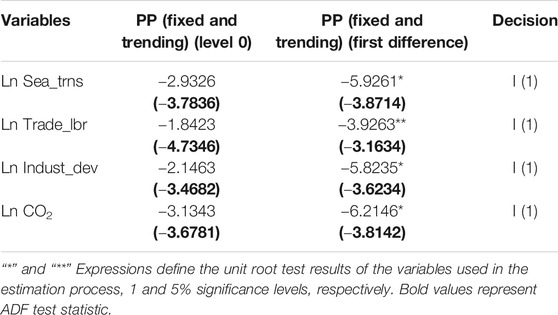
TABLE 1. Phillips-perron (PP) unit root test results of China.
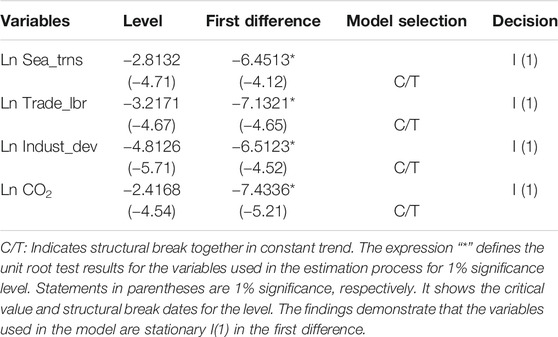
TABLE 2. Zivot-andrews unit root test results of China.
According to results of FMOLS, DOLS and CCR models there is a long-term stable relationship between sea transportation, trade liberalization, industrial development and carbon dioxide emissions which is demonstrated empirically. The p-value of sea transportation, trade liberalization and industrial development is less than 0.05 in Table 3. Thus, the independent variables affect the dependent variable (CO2). Considering the coefficients of the FMOLS model; 1 per cent increase in industrial development increases CO2 by 0.2472 per cent, a 1 per cent increase in trade liberalization increases CO2 by 0.4223 per cent, a 1 per cent increase in maritime transport increases CO2 by 0.3856 per cent. According to coefficients of the DOLS model; a 1 per cent increase in industrial development increases CO2 by 0.2861 per cent, a 1 per cent increase in trade liberalization increases CO2 by 0.4524 per cent, and a 1 per cent increase in maritime transport increases CO2 by 0.3237 per cent. Finally, considering the coefficients of the CCR model; a 1 per cent increase in industrial development increases CO2 by 0.3463 per cent, a 1 per cent increase in trade liberalization increases CO2 by 0.4326 per cent, a 1 per cent increase in maritime transport increases CO2 by 0.3652 per cent.
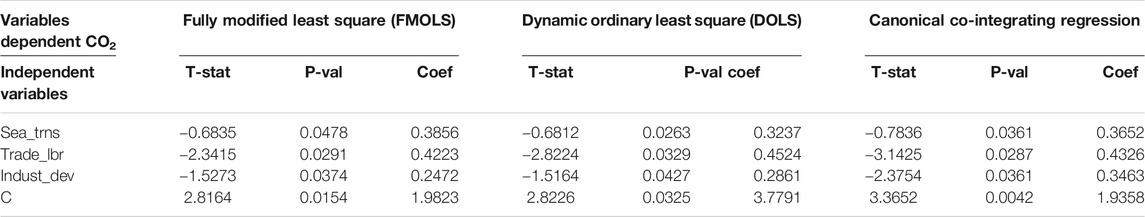
TABLE 3. Cointegration estimation results (FMOLS, DOLS and CCR models of China).
ARDL method is then implemented to determine whether there is a long-term causality relationship between sea transportation, trade liberalization, industrial development and carbon dioxide emissions. Table 4 presents the results obtained with the ARDL method. Results of ARDL model are consistent with FMOLS, DOLS and CCR models.
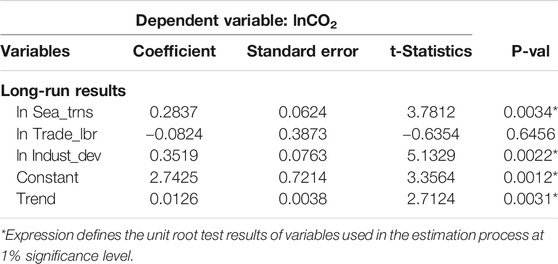
TABLE 4. Long-term ARDL estimation results of China.
FMOLS, DOLS and CCR cointegration analysis depends on the condition that the series are stationary. In addition, having the possibility to interpret the derived coefficients to provide course of process in terms of CO2 emissions through considering independent variables including sea transportation, trade liberalization and industrial development. The ARDL equation is indicated as econometric symbols, where the determinants of long-term economic growth are investigated in Eq. 5 below:
The long-run relationship between carbon dioxide emissions CO2t sea transportation Seatrnst trade liberalization Tradelbrt and industrial development Industdevt is investigated through f bounds test, which is considered as the zero hypotheses.
Findings from FMOLS, DOLS and CCR models indicate that maritime transport, trade liberalization and industrial development are the determinants of long-term carbon emissions, just as in the results of the ARDL model. It is also noteworthy that the findings obtained from FMOLS, DOLS and CCR models, which are described as new cointegration techniques and allowed the separation of short and long-term relationships, consistent with the long-term results obtained from the ARDL model in Table 4. In this context, trade relations should be increased by policy-makers through improving their maritime transport infrastructures and further accelerate their industrial growth via research and development.
Considering the ARDL F-bound test, long-term ARDL estimates were made, respectively, through the revealing long-term cointegration by empirical model which is used among the variables. Long term ARDL forecast results are given in Table 5. Long-term ARDL forecast results reveal that the main determinants of CO2 changes in sea transportation, trade liberalization, industrial development.
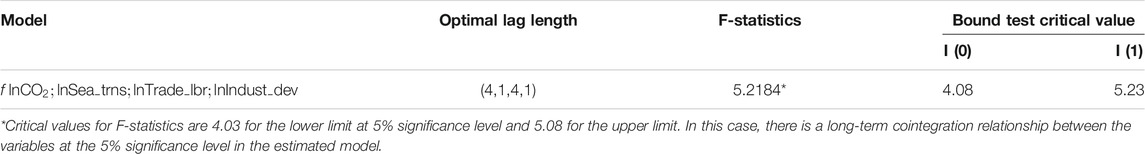
TABLE 5. ARDL bound test results of China.
According to the long-run ARDL results summarized in Table 4; If sea transport increases by 1 per cent, CO2 increases by 0.2837%. A 1 per cent increase in industrial development increases CO2 by 0.3519%. Unlike other econometric models (FMOLS, DOLS and CCR), trade liberalization has no statistically significant effect on CO2. Long-run ARDL results in terms of the relationships between CO2 and key economic determinants are similar to short-term ARDL test findings. Short term ARDL estimation results reveal that the main determinants of CO2 in the short-run are changed in industrial development and maritime transport at a 1% significance level. Table 6 summarizes the short-term ARDL results and the findings regarding the error correction model. According to Table 6, error correction model works in order to reach short-run adjustment. In the short term, approximately 87% of shocks in industrial development, maritime transport and trade liberalization are compensated within a period of time and the system is re-established in the long term.
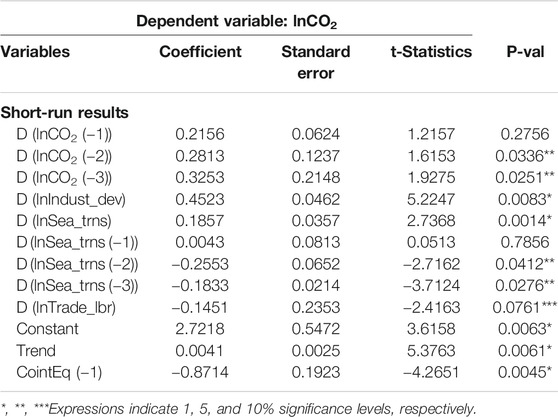
TABLE 6. Short term ARDL results and error correction model of China.
In the final part of methodology, the generalized moments method (GMM) is implemented to reveal the linear relationship between variables. In econometrics, the generalized moments (GMM) is a general used analysis in order to estimate the parameters in terms of a statistical approach. In this context, the generalized moments method (GMM) is a form of statistical model which pairs up the macroeconomic data with the information of population moment conditions to forecast the unknown components of the economic analysis. After obtaining these components, it should be investigated at the probability values to make inferences regarding the basic questions.
(GMM) the equation of linear relationship among relevant variables;
Instrumental variables are;
wt,{yt, zt, xt} represent the vector of the unique and non-constant elements. {wt} is supposed to be a static and ergodic stochastic process.
Time series may have self-relationships, and it can be said that this can lead to false results and endogeneity problems. GMM technique has been applied to minimize the internality problem. Different TSLS (Two-Stage Least Squares), White and HAC, were implemented by applying different GMM methods by choosing TSLS method. The analysis results of GMM are indicated below (Table 7).
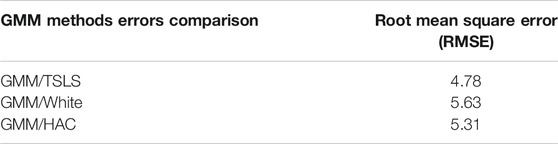
TABLE 7. GMM root mean square error results of China.
Table 7, the lowest root mean square error, is found in the GMM-TSLS methods. Therefore, GMM–TSLS method is selected for the analysis. According to GMM–TSLS analysis (Table 8), there is no validation problem since the t-statistic value is more than 0.05. AR 1) is significant, and AR 2) is meaningless. The correlation among the variables of time series and the variables leading to or behind by a constant amount of time in terms of these parameters has been confirmed clearly. Furthermore, when considering the generalized moments method—TSLS (TwoStage Least Squares) model, there is no autocorrelation problem since the Durbin Watson value (1.85—see Table 8.) is close to 2.
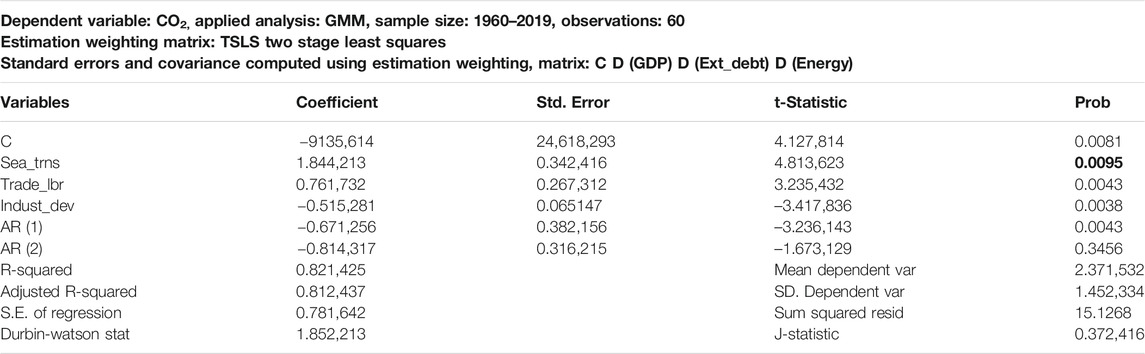
TABLE 8. GMM (generalized method of moments) test results of China.
Instrumental variables are added to the analysis as well. For the periodic intervals, three dummy variables are added into the model. The first dummy variable is GDP, which indicates China’s total economic growth from 1960 to 2019. Another dummy variable indicates the overall external debt of China for the years 1960–2019. Energy consumption for China is used as the last dummy variable. In the generalized moments method, sea transportation, trade liberalization, industrial development significantly affect the CO2 emissions in China.
Conclusion
It is possible to transport large amounts of cargo from one place to another via maritime transport. Intercontinental trade, bulk cargo transport, import/export of processed food, and goods will not be possible without naval transport. In recent years, the efficiency and low costs in maritime transport have made industrial production shifting to Asia, which has improved global living standards. Sea transport is carried out three and a half times cheaper than rail transport and seven times cheaper than road transport. International maritime shipping is the mode of transportation that causes the least carbon emissions, and today, approximately ninety per cent of world trade is carried out by sea transportation. Therefore, the effect of sea transportation is examined empirically in this article.
In this study, empirical results proved the impact of sea transportation, trade liberalization and industrial development on carbon dioxide emissions for China from 1960 to 2019. In order to examine these dynamic relationships, the researchers applied many kinds of econometrical methods. Findings from FMOLS, DOLS and CCR models indicate that maritime transport, trade liberalization and industrial development are the long term determinants of carbon emissions, just as in the results of the ARDL model. It is also noteworthy that the findings obtained from FMOLS, DOLS and CCR models, which are described as new cointegration techniques and allowed the separation of short and long-term relationships, consistent with the long-term results obtained from the ARDL model. According to long-run ARDL, if sea transport increases by 1 per cent, CO2 increases by 0.3017%. A 1 per cent increase in industrial development increases CO2 by 0.2972%. Unlike other econometric models (FMOLS, DOLS and CCR), trade liberalization has no statistically significant effect on CO2 emission. Long-run ARDL results in terms of the relationships between CO2 and key economic determinants are similar to short-term ARDL test findings. Short term ARDL estimation results reveal that the main determinants of CO2 in the short-run are industrial development and maritime transportation.
Transforming the transport industry to run on renewable energy is vital for a more sustainable society, and many countries are concerned with their carbon footprint. The clean energy revolution is also sweeping through the Chinese transport sector. In 2017 China produced half of the 1.2 million electric media used worldwide; the government directs its attention to the rehabilitation and reuse of all these lithium-ion batteries. Large-scale production of biofuels can still be several years away. Crude oil might be very difficult to promote alternative fuels on a national scale unless crude oil prices surge so high as to become unaffordable. Developing battery science, solar panels and electricity are obtained from the Sun rays. This obtained energy is also included in the systems to assist the ship’s shipbuilding auxiliary power or ship’s daily use needs. Some certain industries are using the solar panels for production. First looked at the solar panel due to the attitude and the cost of initial setup, it is necessary to actively wait for the future in the maritime industry. Therefore, first step reuse of waste energy CO2 emissions can be reduced. Thus, since the amount of fuel consumed by the ship decreases, the amount of CO2 emissions decreases. Moreover, methods to reduce CO2 emissions include reducing fuel costs and using alternative fuels with low or zero carbon content. Therefore, carbon emissions will be greatly reduced with burning low emission's fuel in diesel engines.
According to results of this paper, industrial development, sea transportation, and trade liberalization empirically contribute to ecological footprint changes which does not confirm the EKC. In this sense, there is no inverted U-shape or U-shape relationship owing to the steady course of correlation coefficient, the EKC hypothesis is not confirmed for China. The Chinese government should separate industrial activity as dirty and clean, by concentrating more on the characteristics of the industries, it can be seen that these are classified as sectors that create high levels of environmental pollution, release intensive toxic waste per unit production, high pollution reduction cost per unit operating cost, energy-intensive per unit production to decrease the CO2 emissions. The preference of mode of production is mostly specified by the convenience of existance of raw materials and energy, trends in the trade of semi-finished products, environmental regulations in the country, their implementation and related policies. It can be said that dirty industries endanger the environment, because they have to use unclean production techniques at different stages of their production processes. In the light of these facts, it can be predicted that China can reduce environmental pollution by supporting companies that produce in environmentally friendly sectors by concentrating more on the solar energy, water filtration, and drainage systems through government subsidized incentives.
The other crucial method in order to reduce China’s environmental footprint is decreasing vessel’s fuel consumption through ambitious fuel saving targets and hold to maintain the fuel-saving system across the fleet. Thus, marine transportation sector will be operating on fuels developed from renewable energy. This would ensure China to carry out vessels thriftily by positive environmental effect.
Policy Recommendation:
Maritime transportation, trade liberalization and industrial development are found to be drivers of CO2 emissions; China should focus on through using more renewable energy sources in its transportation technology. Following the membership of China in the World Trade Organization in 2001, the liberalization process of its trade policy increased, allowing them to export more than before. This membership then led developed countries to carry most of their polluting industries in China benefiting from their cheap labor force and lighter environmental standards. Although attracting FDI is favourable for industrial development and economic growth, CO2 emissions started to rise rapidly. As this kind of growth is not sustainable in the long term, China should focus on developing a more balanced industrial production model using more environmentally friendly technologies by focusing more on the solar energy, water filtration, and drainage systems through government subsidized incentives to reduce its ecological footprints in the world. More research can be carried out to analyze the environmental degradation of various countries using trade, logistics and industrial data.
Data Availability Statement
The original contributions presented in the study are included in the article/Supplementary Material, further inquiries can be directed to the corresponding author.
Author Contributions
SK and CÖ contributed to conception and design of the study. SK organized the database. SK performed the statistical analysis. CÖ wrote the first draft of the manuscript. SK wrote sections of the manuscript. All authors contributed to manuscript revision, read, and approved the submitted version.
Funding
Our university will partially pay the publication fee, Salih Kalayci and Cihan Ozden will pay the rest of fee and agreed to pay USD 1992.
Conflict of Interest
The authors declare that the research was conducted in the absence of any commercial or financial relationships that could be construed as a potential conflict of interest.
Abbreviations
ARDL, Autoregressive Distributed Lag Bound Test; CCR, Canonical Co-integrating Regression; DOLS: Dynamic Ordinary Least Square; ECM: Error Correction Model; EKC: Environmental Kuznets Curve; FMOLS: Fully Modified Least Square; GMM: Generalized Moments Method; HAC: Heteroskedastic and Autocorrelation Consistent; PP Test: Phillips–Perron Test; TSLS: Two-Stage Least Squares.
References
Ali, S., Liu, L., Shah, T., Tariq, A., Ali Chandio, A., and Ali, I. (2019). Analysis of the Nexus of CO2 Emissions, Economic Growth, Land under Cereal Crops and Agriculture Value-Added in Pakistan Using an ARDL Approach. Energies 12 (23), 4590. doi:10.3390/en12234590
Baek, J., and Kim, H. S. (2014). Trade Liberalization, Economic Growth, Energy Consumption and the Environment: Time Series Evidence from G-20 Economies. East Asian Econ. Rev. 15 (1), 3–32. doi:10.11644/KIEP.JEAI.2011.15.1.224
Dong, K., Dong, X., and Dong, C. (2019). Determinants of the Global and Regional CO2 Emissions: What Causes what and where? Appl. Econ. 51 (46), 5031–5044. doi:10.1080/00036846.2019.1606410
Dong, K., Dong, X., and Jiang, Q. (2020). How Renewable Energy Consumption Lower Global CO 2 Emissions? Evidence from Countries with Different Income Levels. World Econ. 43 (6), 1665–1698. doi:10.1111/twec.12898
Hassan, S. A., and Nosheen, M. (2018). The Impact of Air Transportation on Carbon Dioxide, Methane, and Nitrous Oxide Emissions in Pakistan: Evidence from ARDL Modelling Approach. Ijied 3 (6), 7–32. doi:10.18775/ijied.1849-7551-7020.2015.36.2001
Jebli, M. B., and Belloumi, M. (2017). Investigation of the Causal Relationships between Combustible Renewables and Waste Consumption and CO2 Emissions in the Case of Tunisian Maritime and Rail Transport. Renew. Sust. Energ. Rev. 71, 820–829. doi:10.1016/j.rser.2016.12.108
Katircioglu, S., Gokmenoglu, K. K., and Eren, B. M. (2018a). Testing the Role of Tourism Development in Ecological Footprint Quality: Evidence from Top 10 Tourist Destinations. Environ. Sci. Pollut. Res. 25 (33), 33611–33619. doi:10.1007/s11356-018-3324-0
Katircioglu, S., Katircioglu, S., and Kilinc, C. C. (2018b). Investigating the Role of Urban Development in the Conventional Environmental Kuznets Curve: Evidence from the Globe. Environ. Sci. Pollut. Res. 25 (15), 15029–15035. doi:10.1007/s11356-018-1651-9
Katircioğlu, S. T. (2014a). Testing the Tourism-Induced EKC Hypothesis: The Case of Singapore. Econ. Model. 41, 383–391. doi:10.1016/j.econmod.2014.05.028
Katircioğlu, S. T. (2014b). Estimating Higher Education Induced Energy Consumption: The Case of Northern Cyprus. Energy 66, 831–838. doi:10.1016/j.energy.2013.12.040
Köksal, C., Işik, M., and Katircioğlu, S. (2020). The Role of Shadow Economies in Ecological Footprint Quality: Empirical Evidence from Turkey. Environ. Sci. Pollut. Res. 27 (12), 13457–13466. doi:10.1007/s11356-020-07956-5
Kuik, O., and Gerlagh, R. (2003). Trade Liberalization and Carbon Leakage. Ej 24 (3), 97–120. doi:10.5547/ISSN0195-6574
Li, Y., Chiu, Y.-H., and Lu, L. (2018). Regional Energy, CO2, and Economic and Air Quality Index Performances in China: A Meta-Frontier Approach. Energies 11 (8), 2119–2120. doi:10.3390/en11082119
Managi, S., Hibiki, A., and Tsurumi, T. (2008). Does Trade Liberalization Reduce Pollution Emissions? Res. Inst. Econ. Trade. Ind. 8. 1–45. doi:10.1016/j.reseneeco.2010.04.009
Meadows, D. H., Meadows, D. L., Randers, J., and Behrens, W. W. (1972). The Limits to Growth. London: Earth Island. doi:10.1349/ddlp.1
Mehrara, M., and ali Rezaei, A. (2013). A Panel Estimation of the Relationship between Trade Liberalization, Economic Growth and CO2 Emissions in BRICS Countries. Hyperion Econ. J. 1 (4), 3–27. doi:10.5296/ber.v6i2.10235
Nakayama, M., Zhu, C., Hirokawa, J., Irino, T., and Yoshikawa-Inoue, H. (2015). Ozone Depletion in the Interstitial Air of the Seasonal Snowpack in Northern Japan. Tellus B: Chem. Phys. Meteorol. 67 (1), 24934–25013. doi:10.3402/tellusb.v67.24934
Oh, K.-Y., and Bhuyan, M. I. (2018). Trade Openness and CO2 Emissions: Evidence of Bangladesh. Ajae 12 (1), 30–36. doi:10.5572/ajae.2018.12.1.030
Ozatac, N., Gokmenoglu, K. K., and Taspinar, N. (2017). Testing the EKC Hypothesis by Considering Trade Openness, Urbanization, and Financial Development: The Case of Turkey. Environ. Sci. Pollut. Res. 24 (20), 16690–16701. doi:10.1007/s11356-017-9317-6
Perron, P. (1989). The Calculation of the Limiting Distribution of the Least-Squares Estimator in A Near-Integrated Model. Econom. Theor. 5, 241–255. doi:10.1017/s026646660001241x
Sarkodie, S. A., Adams, S., Owusu, P. A., Leirvik, T., and Ozturk, I. (2020). Mitigating Degradation and Emissions in China: the Role of Environmental Sustainability, Human Capital and Renewable Energy. Sci. Total Environ. 719, 137530. doi:10.1016/j.scitotenv.2020.137530
Shahbaz, M., Kumar Tiwari, A., and Nasir, M. (2013). The Effects of Financial Development, Economic Growth, Coal Consumption and Trade Openness on CO2 Emissions in South Africa. Energy Policy 61, 1452–1459. doi:10.1016/j.enpol.2013.07.006
Shen, J. (2008). Trade Liberalization and Environmental Degradation in China. Appl. Econ. 40 (8), 997–1004. doi:10.1080/00036840600771148
UNCTAD (2020). World Merchant Fleet/UNCTADstat (Merchant Fleet by Flag of Registration and by Type of Ship, Annual Table Summary). Available at: https://unctadstat.unctad.org/wds/ReportFolders/reportFolders.aspx.
World Bank (2020a). Goods and Services (BPM5): Trade Openness Indicators, Sum of Imports and Exports, Goods and Services for China. Available at: https://tcdata360.worldbank.org/.
World Bank (2020b). CO2 Emissions Indicator. Available at: https://data.worldbank.org/.
World Bank (2020c). Industry (Including Construction). Available at: https://data.worldbank.org/.
Zandi, G., Haseeb, M., and Malaysia, J. T. S. J. S. (2019). The Role of Trade Liberalization in Carbon Dioxide Emission: Evidence from Heterogeneous Panel Estimations. Ijfr 10 (5), 228–240. doi:10.5430/ijfr.v10n5p228
Zhu, M., Yuen, K. F., Ge, J. W., and Li, K. X. (2018). Impact of Maritime Emissions Trading System on Fleet Deployment and Mitigation of CO2 Emission. Transp. Res. D: Transport Environ. 62, 474–488. doi:10.1016/j.trd.2018.03.016
Keywords: sea transportation, liberalization, industrial development, carbon dioxide, fully modified least square, dynamic ordinary least square, canonical co-integrating regression, generalized moments method test
Citation: Kalaycı S and Özden C (2021) The Linkage Among Sea Transport, Trade Liberalization and Industrial Development in the Context of CO2: An Empirical Investigation From China. Front. Environ. Sci. 9:633875. doi: 10.3389/fenvs.2021.633875
Received: 26 November 2020; Accepted: 20 April 2021;
Published: 10 June 2021.
Edited by:
Samuel Asumadu Sarkodie, Nord University, NorwayReviewed by:
Kangyin Dong, University of International Business and Economics, ChinaEhsan Rasoulinezhad, University of Tehran, Iran
Copyright © 2021 Kalaycı and Özden. This is an open-access article distributed under the terms of the Creative Commons Attribution License (CC BY). The use, distribution or reproduction in other forums is permitted, provided the original author(s) and the copyright owner(s) are credited and that the original publication in this journal is cited, in accordance with accepted academic practice. No use, distribution or reproduction is permitted which does not comply with these terms.
*Correspondence: Salih Kalaycı, c2FsaWgua2FsYXljaUBidHUuZWR1LnRy