 Tianyun Dong
 Shanshan Zhao
 Ying Mei
 Xiaoqiang Xie1
 Shiquan Wan
 Wenping He
- 1School of Atmospheric Sciences, and Key Laboratory of Tropical Atmosphere-Ocean System (Sun Yat-sen University), Ministry of Education, and Southern Marine Science and Engineering Guangdong Laboratory, Zhuhai, China
- 2Collaborative Innovation Center on Forecast and Evaluation of Meteorological Disasters, Nanjing University of Information Sciences and Technology, Nanjing, China
- 3National Climate Center, China Meteorological Administration, Beijing, China
- 4Yangzhou Meteorological Office, Yangzhou, China
In this study, we investigated the performance of nine CMIP5 models for global daily precipitation by comparing with NCEP data from 1960 to 2005 based on the detrended fluctuation analysis (DFA) method. We found that NCEP daily precipitation exhibits long-range correlation (LRC) characteristics in most regions of the world. The LRC of daily precipitation over the central of North American continent is the strongest in summer, while the LRC of precipitation is the weakest for the equatorial central Pacific Ocean. The zonal average scaling exponents of NCEP daily precipitation are smaller in middle and high latitudes than those in the tropics. The scaling exponents are above 0.9 over the tropical middle and east Pacific Ocean for the year and four seasons. Most CMIP5 models can capture the characteristic that zonal mean scaling exponents of daily precipitation reach the peak in the tropics, and then decrease rapidly with the latitude increasing. The zonal mean scaling exponents simulated by CMCC-CMS, GFDL-ESM2G and IPSL-CM5A-MR show consistencies with those of NCEP, while BCC_CSM1.1(m) and FGOALS-g2 cannot capture the seasonal variations of daily precipitation’s LRC. The biases of scaling exponents between CMIP5 models and NCEP are smaller in the high latitudes, and even less than the absolute value of 0.05 in some regions, including Arctic Ocean, Siberian, Southern Ocean and Antarctic. However, for Western Africa, Eastern Africa, Tropical Eastern Pacific and Northern South America, the simulated biases of scaling exponents are greater than the absolute value of 0.05 for the year and all four seasons. In general, the spatial biases of LRC simulated by GFDL-ESM2G, HadGEM2-AO and INM-CM4 are relatively small, which indicating that the LRC characteristics of daily precipitation are well simulated by these models.
Introduction
Precipitation changes not only affect the global hydrographic cycle (Trenberth, 2011; Ma and Zhou, 2015), but also play an essential role for human societal and economic development (Wang et al., 2012; IPCC, 2013; Zhang et al., 2018; Chen et al., 2020). Global climate models are widely used to reproduce the current climate and project future climate change (Zhou and Yu, 2006; Xu and Xu, 2012; Knutson et al., 2013; Kumar et al., 2013; Jiang et al., 2015; Dong et al., 2018; He et al., 2019). It’s crucial to evaluate and investigate the models’ performance in simulating daily precipitation for developing adaptation strategies to reduce uncertainties of projecting precipitation in the future (Jiang et al., 2007; Jiang et al., 2009; Wang and Chen, 2013; Li et al., 2015; Li et al., 2018; Lin et al., 2019).
The Coupled Model Intercomparison Project Phase 5 (CMIP5) includes more comprehensive global climate models enabling researchers to address many scientific questions (Taylor et al., 2012). At present, assessment methods for different models’ performance are transforming from traditional qualitative methods to quantitative methods (Sillmann et al., 2013; Jiang et al., 2016; Li et al., 2017). A lot of studies evaluate models based on some traditional statistical methods, such as linear trend analysis (Guo et al., 2013; Dong et al., 2018), the spatial correlation coefficients (Zhao et al., 2014; Tian et al., 2015), the standard deviation (STD) (Yang et al., 2014), signal-to-noise ratio (SNR) (Peng et al., 2019) and so on. However, these evaluation methods cannot reproduce the inner dynamical characteristics of climate system. Therefore, a nonlinear method, long-range correlation (LRC) is needed to understand the intrinsic dynamical characteristics of climate system (Koscielny-Bunde et al., 1998; Malamud and Turcotte 1999; Fu et al., 2016; He et al., 2016; Zhao et al., 2017).
The LRC method is characterized by a timescale and shows the scaling law of an autocorrelation function (Peng et al., 1994; Bunde et al., 2005). For a random system, it is uncorrelated in both temporal and spatial evolution, so the scaling exponent of its time series is 0.5. However, for the climate system, which is a nonlinear complex system with multi-scale interactions, the persistence of external forcing and transmission of energy and information between different subsystems make it no longer isolated. Moreover, the large scale system will have a continuous impact on the small scale system, which makes its time evolution nonrandom. Therefore, its previous state will have a strong or weak impact on its future evolution, which is the LRC revealed in this paper. The value of LRC reflects the strength of nonlinear interaction between different subsystems, and to some extent, it reflects the internal dynamic characteristics of climate system (Bunde and Havlin., 2002; Lennartz and Bunde 2011; Yuan et al., 2015). For example, the LRC in equatorial Pacific is larger than that in land, which shows relatively strong interaction between ocean and atmosphere (Yeo and Kim, 2014). Therefore, we try to address the question about whether the CMIP5 models can reproduce the LRC of daily precipitation. It is very important and urgent to consider the LRC besides the traditional statistical methods.
The detrended fluctuation analysis (DFA) is a useful tool to estimate the LRC for assessing models’ simulate performance (Kantelhardt et al., 2001; Kantelhardt et al., 2002; Blender and Fraedrich, 2003; Kumar et al., 2013; Zhao and He, 2014; Zhao and He, 2015; He and Zhao, 2017). Govindan et al. (2002) found that seven models failed to reproduce the LRC of temperature. Kumar et al. (2013) assessed the performance of 19 CMIP5 models based on long-term persistence and concluded that these models show poor performance in the long-term persistence of precipitation, however, they show better performance in temperature. Different models show different performance in the LRC of climatic variables. Most continents exhibit the long-range correlation of temperature in global coupled general circulation models (Rybski et al., 2008). Daily precipitation also shows long-range correlation both for the Beijing Climate Center Climate System Model [BCC_CSM1.1(m)] and observational data in China (Zhao and He, 2015). The LRC is present in many aspects of climate system, such as air temperature (Du et al., 2013; Yuan et al., 2015; Koscielny-Bunde, et al., 1998; Talkner and Weber, 2000), precipitation (Kantelhardt et al., 2006; Zhao and He, 2015; He and Zhao, 2017), sea surface temperature (Zhang and Zhao, 2015), geopotential height (Tsonis et al., 1999), extreme climate events (Feng et al., 2009) and so on. Therefore, in terms of the LRC of climate system, it is an effective way to assess CMIP5 models’ performance in global daily precipitation. Based on this, we will have a deeper understanding for intrinsic dynamical characteristics of the climate system and make contributions to improve models’ development.
The remainder of this paper is organized as follows. The data sets and DFA method are introduced in Methods and Data. Results presents the features of the LRC for the year and four seasons based on NCEP and CMIP5 data. Moreover, the spatial differences of LRC from different regions are shown in Results. Finally, a summary and discussion are given in Discussion and Conclusion.
Methods and Data
Data
The global daily precipitation datasets used in this study are composed of reanalysis data from the National Centers for Environmental Prediction and National Center for Atmospheric Research (NCEP) (Kalnay et al., 1996). The performance of NCEP reanalysis dataset has been assessed based on LRC characteristics (He and Zhao, 2017; Zhao et al., 2017), which are similar to the results of the observation. So we can use NCEP dataset as the benchmark to evaluate CMIP5 models’ LRC characteristic of daily precipitation.
The simulated daily precipitation data is retrieved from the Earth System Grid (ESG) data portal for nine CMIP5 models (https://esgf-node.llnl.gov/search/cmip5/) (Taylor et al., 2012), which are from historical experiments. Only one realization of each model is analyzed. The more detailed information of each model is listed in Table 1. The horizontal resolution is different in different models. In order to facilitate model intercomparison and validation against observation, the inverse distance weighting method is used to regrid the model outputs to 2.5° × 2.5°grid. Considering the length of time series both for reanalyzed and simulated data, we chose 1960–2005 as the study period.
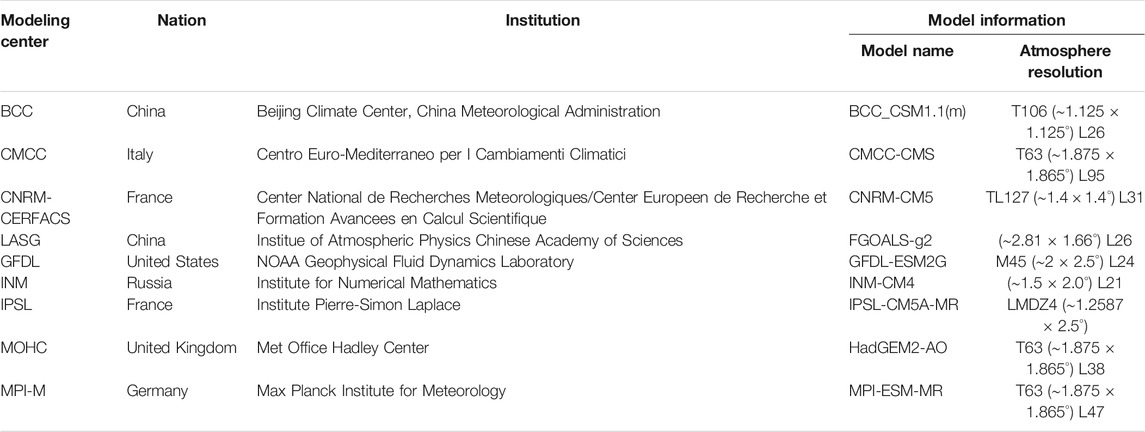
TABLE 1. Details of the nine CMIP5 climate models.
To reveal the geographical heterogeneity of DFA for the daily precipitation in the world, we divided the global world into 34 regions, including 12 ocean basins and 22 sub-continental land regions (Table 2 and Figure 1). The 22 sub-continental regions are defined based on Giorgi (2002), and the 12 ocean basins are modified based on Chan and Wu (2015). We calculated the area-averaged LRC in each region for NCEP and model data, the differences between NCEP and CMIP5 models are compared.
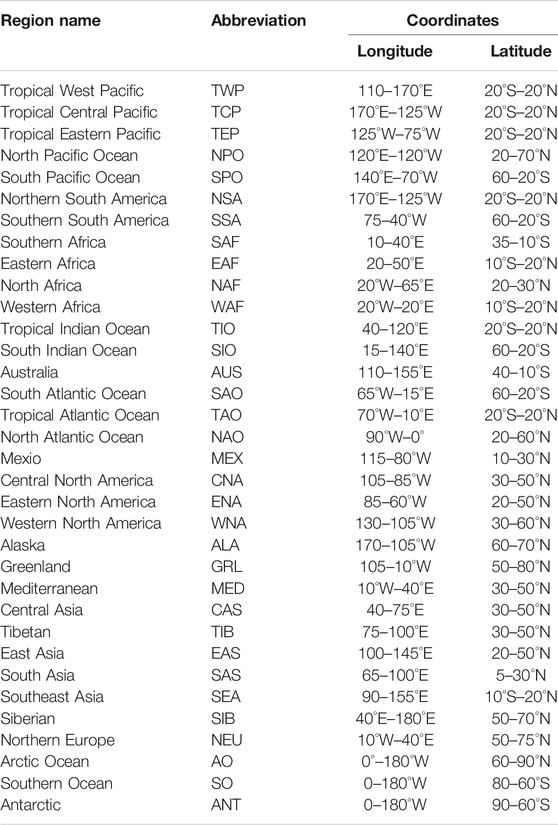
TABLE 2. Names and coordinates for 34 regions in the world.
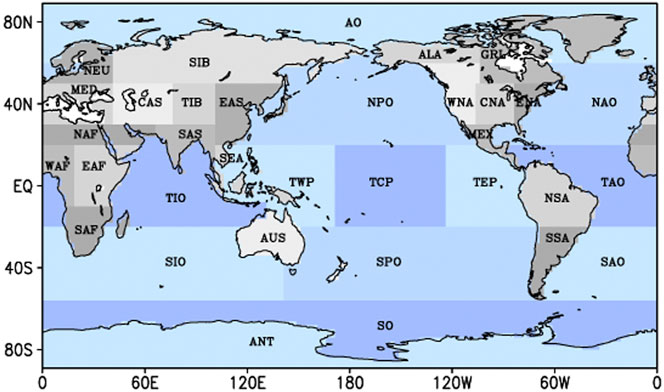
FIGURE 1. Divisions of the world.
Method
The DFA method is often used to estimate the LRC of time series and an index of power law exponent, namely scaling exponent, can be used to quantitatively quantify the strength of LRC, which could be obtained by DFA (Peng et al., 1994; Bunde and Havlin, 2002; Bunde et al., 2005). DFA has been extensively applied to investigate LRC in climate variability (Talkner and Weber, 2000; Kantelhardt et al., 2006; Gan et al., 2007; Jiang et al., 2015). For a giving time series, {Xi, i = 1, 2, …, N}, the departures of Xi is calculated to eliminate the periodic seasonal trends in the climate system.
In this study,
Next, the profile
Typically,
If 0.5<a<1, the time series {Xi, i = 1, 2, …, N} is long range correlation. If a = 0.5, the time series is uncorrelated. If 0<a<0.5, the series {Xi} has anti-persistent correlation. In this study, the DFA2 method is used to estimate the scaling exponent in a time series.
Results
The LRC Characteristics of Daily Precipitation Based on NCEP and CMIP5 Models
Two grid points in the central of North American continent (110°W, 35°N) and the equatorial central Pacific Ocean (175°W, 0°) are randomly selected as examples to show the detailed information of precipitation’s LRC on land and ocean, respectively. The scaling exponent of NCEP daily precipitation is 0.62 (typical LRC characteristic) at the point of North American continent. The daily precipitation simulated by all nine CMIP5 models exhibits the LRC characteristic (Figure 2A). The scaling exponents of CMCC-CMS, FGOALS-g2 and MPI-ESM-MR range from 0.5 to 0.55, while the scaling exponents for the other models are close to 0.62 at the grid point (110°W, 35°N) (Figure 3A). In spring, the scaling exponent of NCEP precipitation is 0.66 at this point. Except for CMCC-CMS, FGOALS-g2 and MPI-ESM-MR, the other models show greater scaling exponents than 0.59, and even the value for GFDL-ESM2G is 0.7 (Figures 2B, 3A). In summer, the LRC of NCEP daily precipitation at this point is the strongest, and the scaling exponent reaches 0.84. Except for CMCC-CMS, FGOALS-g2 and MPI-ESM-MR, the other models’ scaling exponents are greater than 0.6. In autumn, the scaling exponent of NCEP precipitation is 0.6, which is the smallest among four seasons (Figure 3A). The scaling exponents of CMCC-CMS and MPI-ESM-MR are smaller (0.55), while that of INM-CM is the largest (0.7) among nine models. In winter, the scaling exponent for daily precipitation of NCEP is 0.63. Except for BCC_CSM1.1(m), the LRC value of most CMIP5 models are underestimated.
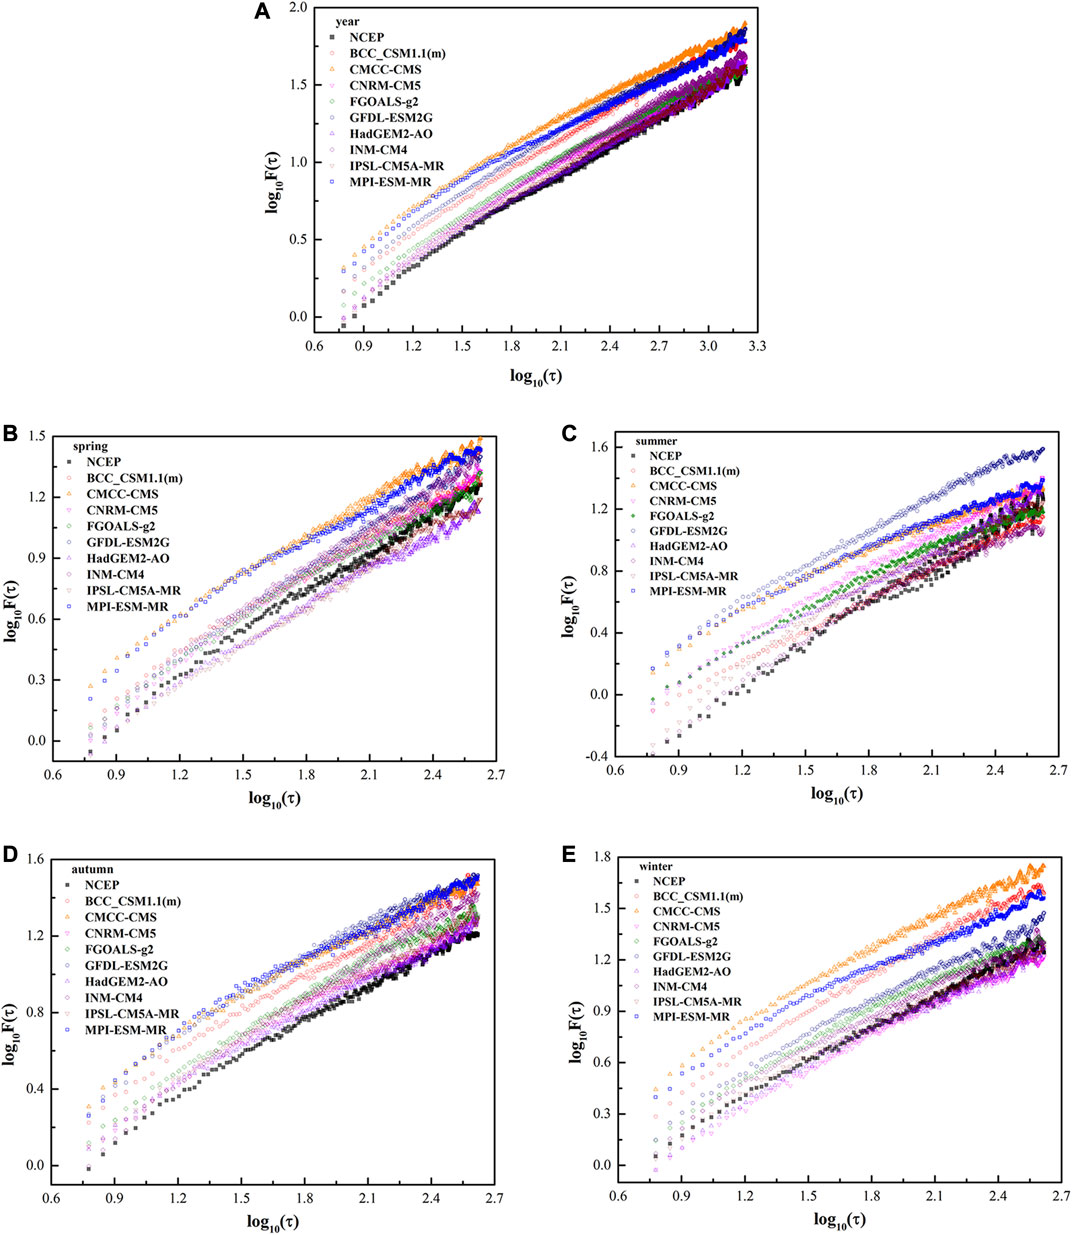
FIGURE 2. The DFA2 results of daily precipitation from NCEP and CMIP5 models at the point of (110°W, 35°N) for (A) year, (B) spring, (C) summer, (D) autumn, and (E) winter.
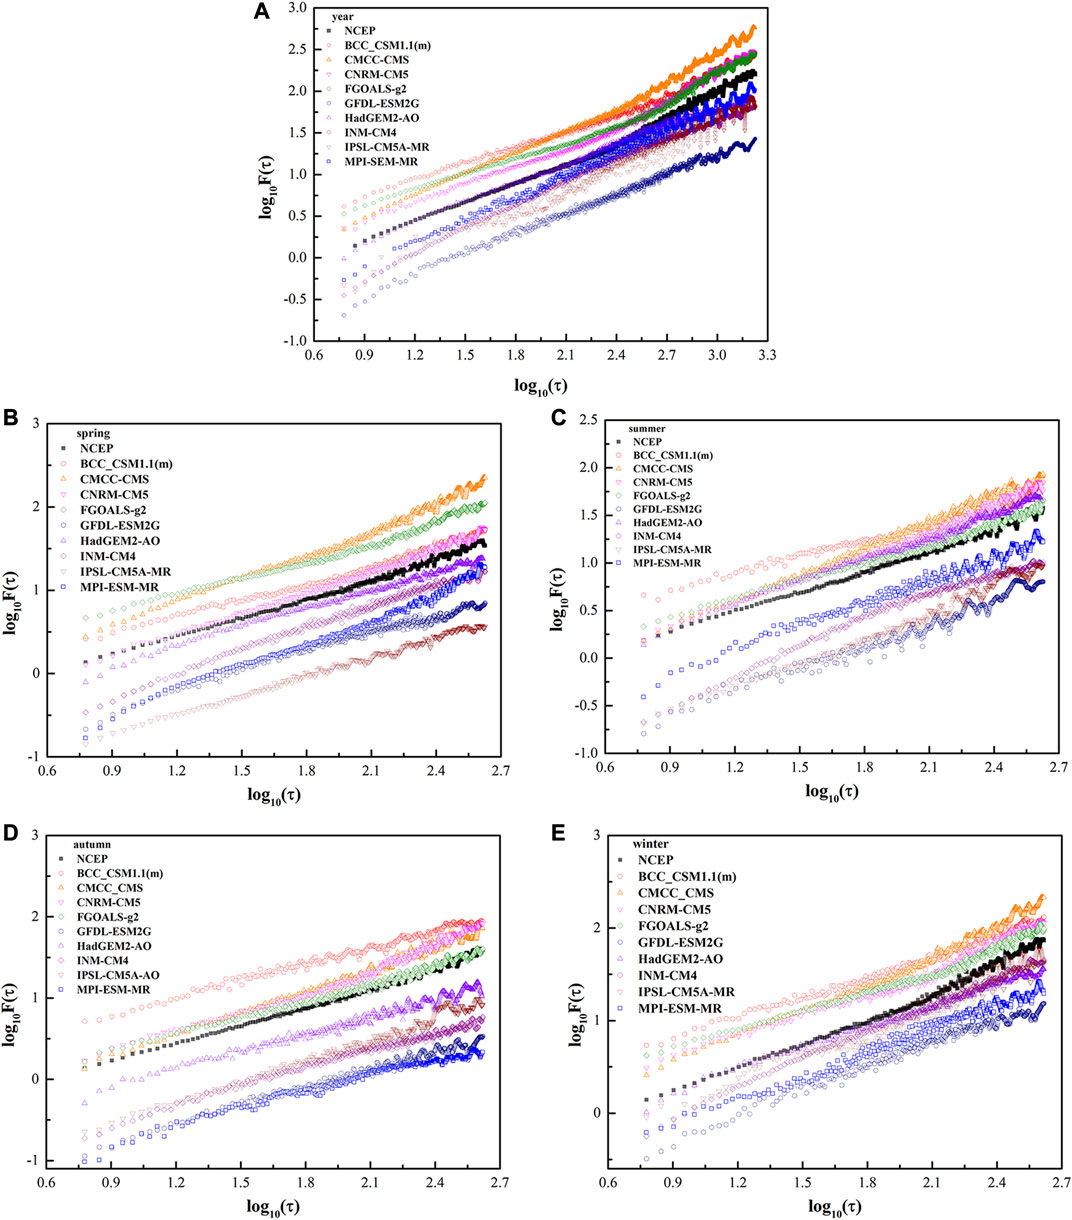
FIGURE 3. The DFA2 exponents of daily precipitation obtained from NCEP and CMIP5 models at (A) point of (110°W, 35°N), (B) point of (175°W, 0°) for year and all four seasons.
In general, the scaling exponent of NCEP daily precipitation at the central of North American continent (110°W, 35°N) is the biggest in summer and the smallest in autumn (Figures 2, 3A). The seasonal variations of scaling exponents simulated by CNRM-CM5, GFDL-ESM2G, HadGEM2-AO and IPSL-CM5A-MR are similar to those of NCEP. These four models can capture the main characteristics that the scaling exponents are the largest in summer and the smallest in autumn, while the seasonal differences of scaling exponents simulated by the other models are various.
At the grid point (175°W, 0°) of the equatorial central Pacific Ocean, the scaling exponent of NCEP precipitation is 0.96 for the whole year, and the values simulated by nine CMIP5 models range from 0.71 to 1.0 (Figure 4A). In spring, the scaling exponent of NCEP precipitation is 0.81. The scaling exponents of daily precipitation simulated by CMCC-CMS and MPI-ESM-MR are both 1.03, while the values of the other models are closer to NCEP (Figure 4B). The scaling exponent of NCEP precipitation in summer is 0.76, which is slightly lower than that in spring. Except for BCC_CSM1.1(m) and FGOALS-g2, the scaling exponents of the other models are greater than 0.7, among which CMCC-CMS, CNRM-CM5 and IPSL-CM5A-MR are greater than 0.9 (Figures 3B, 4C). The scaling exponent of NCEP in autumn is 0.76, which is the same as that in spring. For the results of models, the scaling exponents of BCC_CSM1.1(m) and MPI-ESM-MR are less than 0.7, while those of CMCC-CMS and CNRM-CM5 are greater than 0.9 (Figures 3B, 4D). In winter, the scaling exponent of NCEP precipitation is 1.0. The scaling exponents of CMCC-CMS, CNRM-CM5, INM-CM4 and IPSL-CM5A-MR are close to 1.0 value, meanwhile, CMCC-CMS shows the biggest scaling exponent among nine models, which is 1.06 (Figures 3B, 4E).
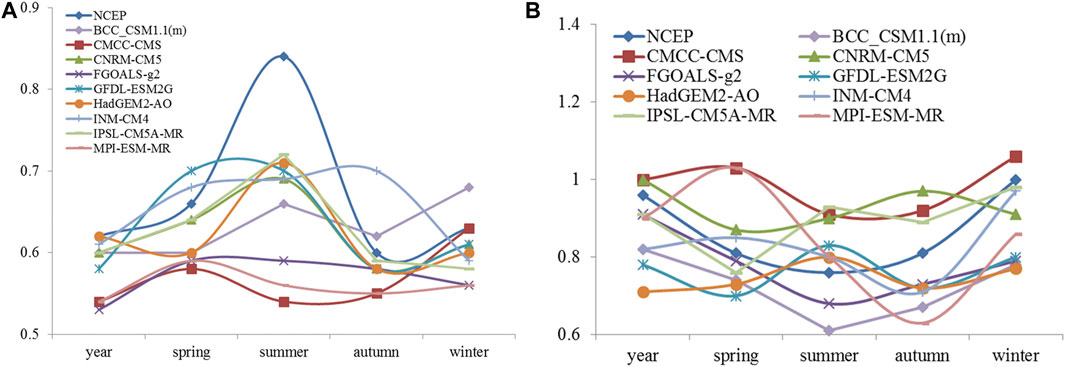
FIGURE 4. The same as Figure 2, but for the point of (175°W, 0°).
We also calculated the median values of the scaling exponents for year and four seasons (Figure is not shown). The median values of the scaling exponents’ biases throughout the year range from −0.04 to −0.02, and most of them are closer to zero. From the 5% and 95% ranking values, GFDL-ESM2G and HadGEM2-AO show smaller biases band, FGOALS-g2 shows bigger biases band. The differences of scaling exponents of global daily precipitation simulated by models are smaller in spring than those of other seasons.
Generally, the scaling exponents of daily precipitation in the equatorial central Pacific Ocean are the smallest in summer, followed by spring and autumn. While for winter and the whole year, the scaling exponents fluctuate around the value of 1.0 (Figure 3B). The seasonal differences of scaling exponents simulated by BCC_CSM1.1(m), CMCC-CMS and FGOALS-g2 are smaller than the other models in summer.
The Spatial Distribution of LRC for nine CMIP5 Models’ Daily Precipitation
The zonal average scaling exponents of NCEP daily precipitation are smaller in middle and high latitudes (Figure 5A). The zonal mean scaling exponents decrease rapidly from the equator to middle latitudes and decrease to about 0.6 near 30°S and 30°N. Subsequently, the reduction rate slows down and the zonal average scaling exponents range from 0.5 to 0.6 in the high latitude regions. The scaling exponents of daily precipitation simulated by CMIP5 models also show similar characteristics, the zonal average scaling exponents are smaller in middle and high latitudes. However, the scaling exponents of CMIP5 models’ daily precipitation are underestimated, especially in the tropics. The zonal mean scaling exponents simulated by CMCC-CMS, GFDL-ESM2G and IPSL-CM5A-MR are closer to those of NCEP, while BCC_CSM1.1(m) and FGOALS-g2 show relatively poor performance.
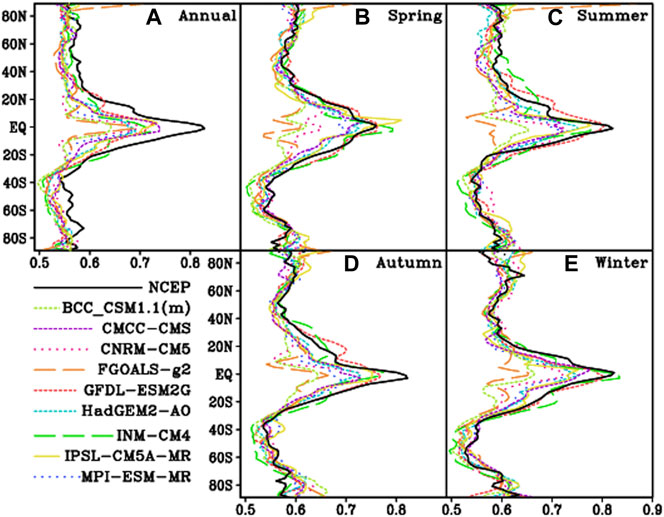
FIGURE 5. Zonal distribution of daily precipitation’s scaling exponents obtained from NCEP and nine CMIP5 models for (A) year; (B) spring; (C) summer; (D) autumn; (E) winter.
In spring, the zonal mean scaling exponents of NCEP are larger in the northern hemisphere than those in the southern hemisphere, and reach a peak value more than 0.7 in the equatorial region (Figure 5B). The zonal average scaling exponents in the northern hemisphere vary slightly from extratropical areas to high latitudes. In the southern hemisphere, the zonal average scaling exponents reach the minimum near 40°S, and then increase to 0.6 with the increase of latitudes. The zonal mean scaling exponents simulated by most models in the mid-latitude region are closer to those of NCEP, while the differences simulated by BCC_CSM1.1(m), CNRM-CM5, FGOALS-g2 are greater in the tropical region. The zonal mean scaling exponents of daily precipitation simulated by CMIP5 models are generally smaller than those of NCEP in low and middle latitudes. Seasonal characteristics in summer and autumn are similar to those in spring (Figures 5C,D). INM-CM4 performs worse at the middle latitudes in summer. In winter, the scaling exponents of NCEP daily precipitation reach the minimum near 60°S in the southern hemisphere, and then increase rapidly (Figure 5E).
In conclusion, most CMIP5 models can capture the characteristic that zonal mean scaling exponents of daily precipitation reach the peak in the tropics, and then decrease rapidly with the latitude increasing. Among nine CMIP5 models, the zonal mean scaling exponents simulated by CMCC-CMS, GFDL-ESM2G and IPSL-CM5A-MR are similar to those of NCEP, while BCC_CSM1.1(m) and FGOALS-g2 cannot capture the feature of seasonal variations.
According to the annual average scaling exponents of daily precipitation in each region, the differences between CMIP5 models and NCEP are generally no more than the absolute value of 0.25. In addition, the differences are larger in the middle and low latitudes (Figure 6A). In AO, SIB, ALA, GRL, MED, CAS, NPO, ENA, NAO, SIO, SPO, SAO, SO and ANT regions, the differences of scaling exponents between CMIP5 models and NCEP are less than the absolute value of 0.05. While the scaling exponent biases are greater than the absolute value of 0.05 in TIB, EAS, EAF, TEP and NSA.
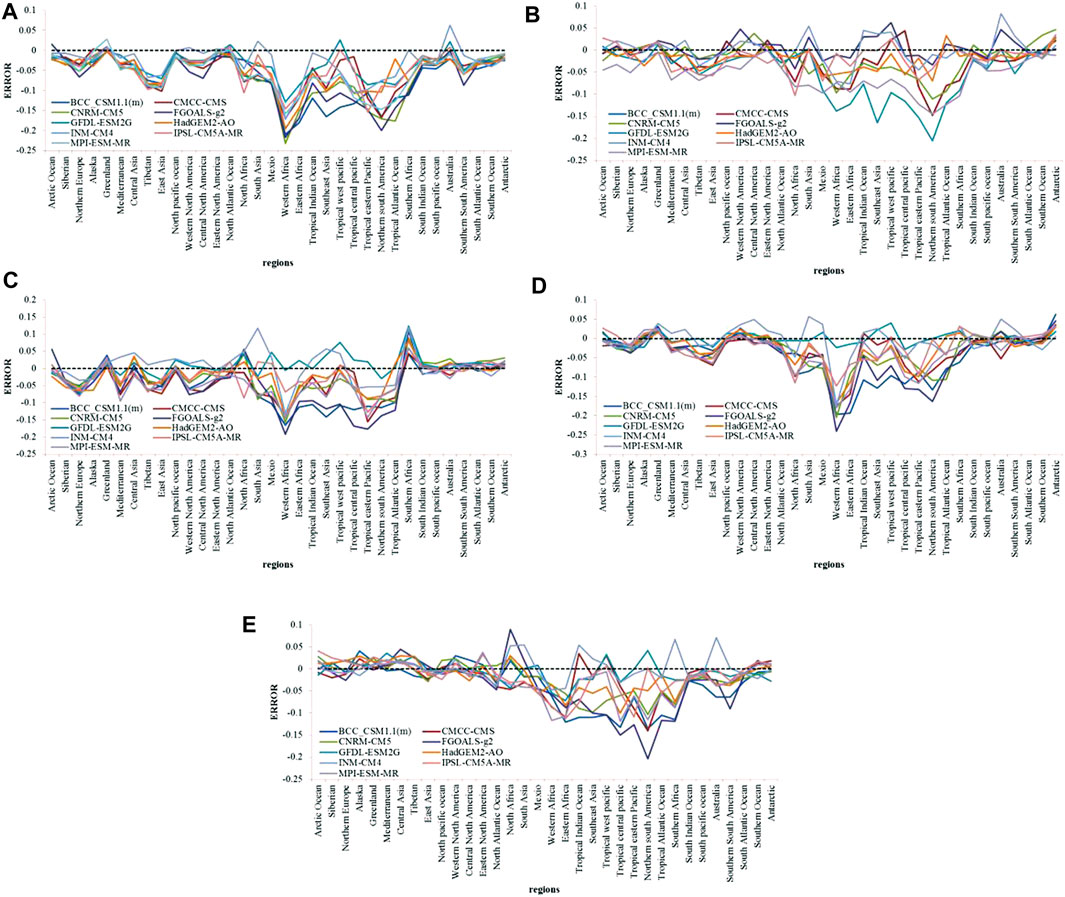
FIGURE 6. The biases of the region average scaling exponents between CMIP5 models and NCEP for (A) year; (B) spring; (C) summer; (D) autumn; (E) winter.
In spring, the differences of scaling exponents between NCEP and CMIP5 models are less than the absolute value of 0.05 in most of the world, while the differences are greater in tropical areas (Figure 6B). In MEX, WAF, EAF, TEP, NSA, TAO, more than half of the models show the absolute value of biases more than 0.05. In summer, models performs relatively well in the middle and high latitudes of the southern hemisphere. In SIO, SPO, AUS, SSA, SAO, SO, ANT, AOGRL, CASNPO, ENA and NAO, the absolute value of biases simulated by CMIP5 models are less than 0.05. In WAF, EAF, NEU, SAS, SEA, TCP, TEP, NSA, TAO, SAF, there are more than half of models, which show the absolute value of differences greater than 0.05 (Figure 6C). In autumn, the absolute value of the model’s biases are less than 0.05 in the most extratropical areas, while the absolute value of more than half of simulated models’ biases are greater than 0.05 in WAF, EAF, SEA and TEP areas (Figure 6D). In winter, the absolute value of the CMIP5 models’ simulated biases are less than 0.05 in most parts of the northern hemisphere and middle and high latitudes in the southern hemisphere. In WAF, EAF, TIO, TCP, TEP, NSA and SAF areas, there are more than half of the models’ absolute value of biases greater than 0.05 (Figure 6E).
The global daily precipitation of NCEP shows LRC characteristic in most parts of the world. The scaling exponents are generally range from 0.65 to 0.9 in tropical areas and even above 0.9 in the tropical middle and east Pacific Ocean, which are significant at a significance level of 0.05 (Figure 7A). Compared with NCEP data, the scaling exponents simulated by most models are smaller in the tropics. Seven models overestimate the LRC in the equatorial western Pacific except for BCC_CSM1.1(m) and HadGEM2-AO. There are larger biases in Northwest Africa, while smaller biases in the extratropical areas for most models. Overall, the biases of GFDL-ESM2G, INM-CM4 and HadGEM2-AO are relatively small. For seasonal variations, global spatial distributions of scaling exponents obtained by NCEP data are similar to those of annual mean distributions. Taking summer as an example, the scaling exponents of NCEP precipitation in the tropics and most regions of Eurasia are above 0.65, and the values in the equatorial Middle East and Pacific are above 0.9, which are significant at a significance level of 0.05 (Figure 8). Compared with NCEP, the scaling exponents of BCC_CSM1.1(m), CNRM-CM5, FGOALS-g2 and MPI-ESM-MR are smaller in the tropics, most of Eurasia and North America. The scaling exponents of CMCC-CMS and INM-CM4 in the tropical western Pacific and Indian Ocean are bigger than those in other tropical regions. The scaling exponents obtained by GFDL-ESM2G and HadGEM2-AO show similar spatial distribution to that of NCEP precipitation in most of the world, except for the equatorial eastern Pacific. In other seasons, the performance of nine CMIP5 models also varies in different regions, and the biases’ distribution of higher values and lower values are similar to those in summer. Generally, the biases of precipitation’s scaling exponents simulated by GFDL-ESM2G, HadGEM2-AO and INM-CM4 are relatively small, which means the inner dynamical characteristics of climate systems are well simulated by these models.
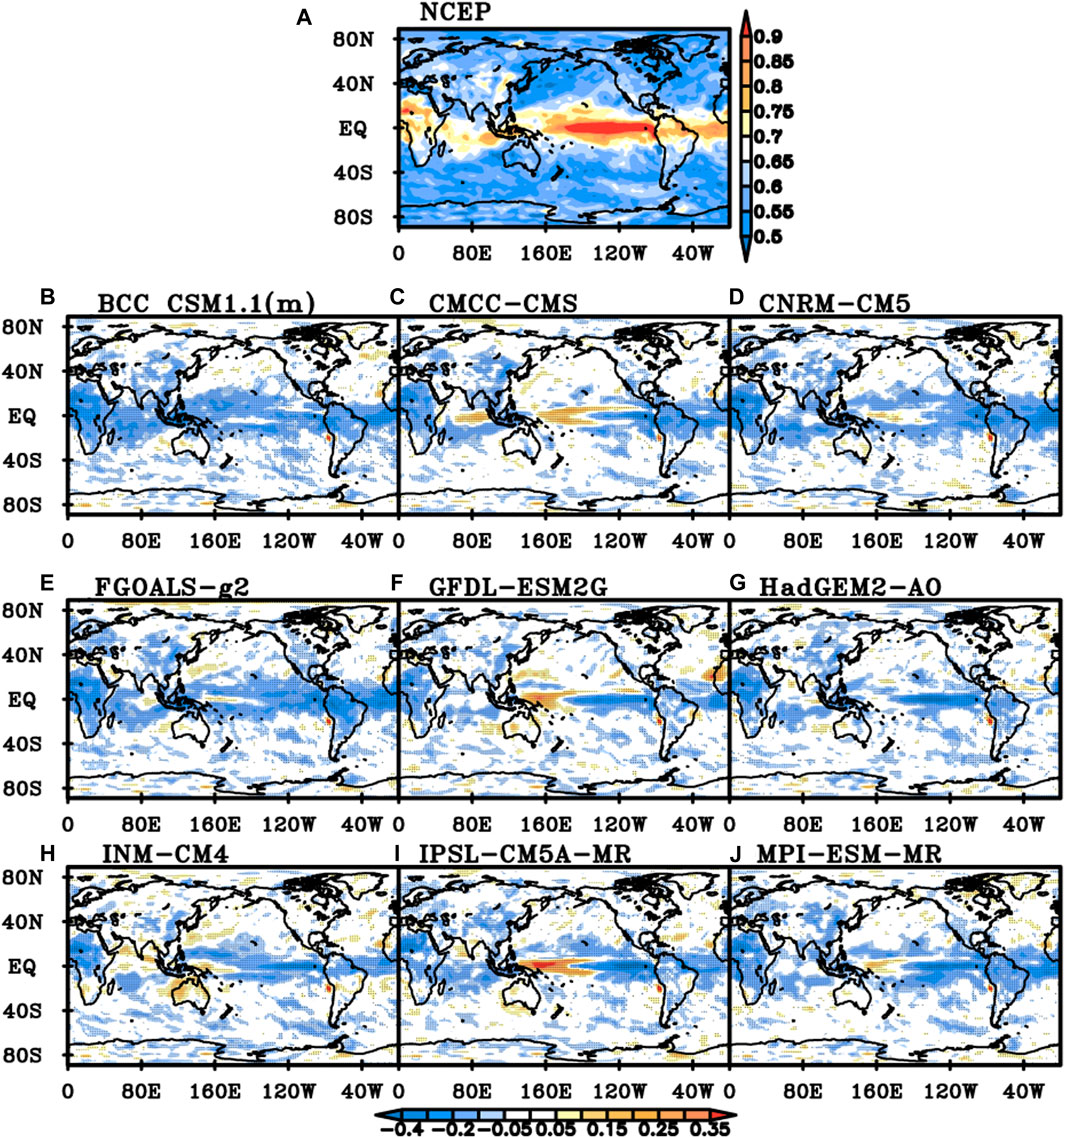
FIGURE 7. Scaling exponents of NCEP daily precipitation and differences between NCEP and nine CMIP5 models for annual average. (A) NCEP daily precipitation, (B) BCC_CSM1.1(m), (C) CMCC-CMS, (D) CNRM-CM5, (E) FGOALS-g2, (F) GFDL-ESM2G, (G) HadGEM2-AO, (H) INM-CM4, (I) IPSL-CM5A-MR, (J) MPI-ESM-MR (Black dot represents the difference is significant at a significance level of 0.05).
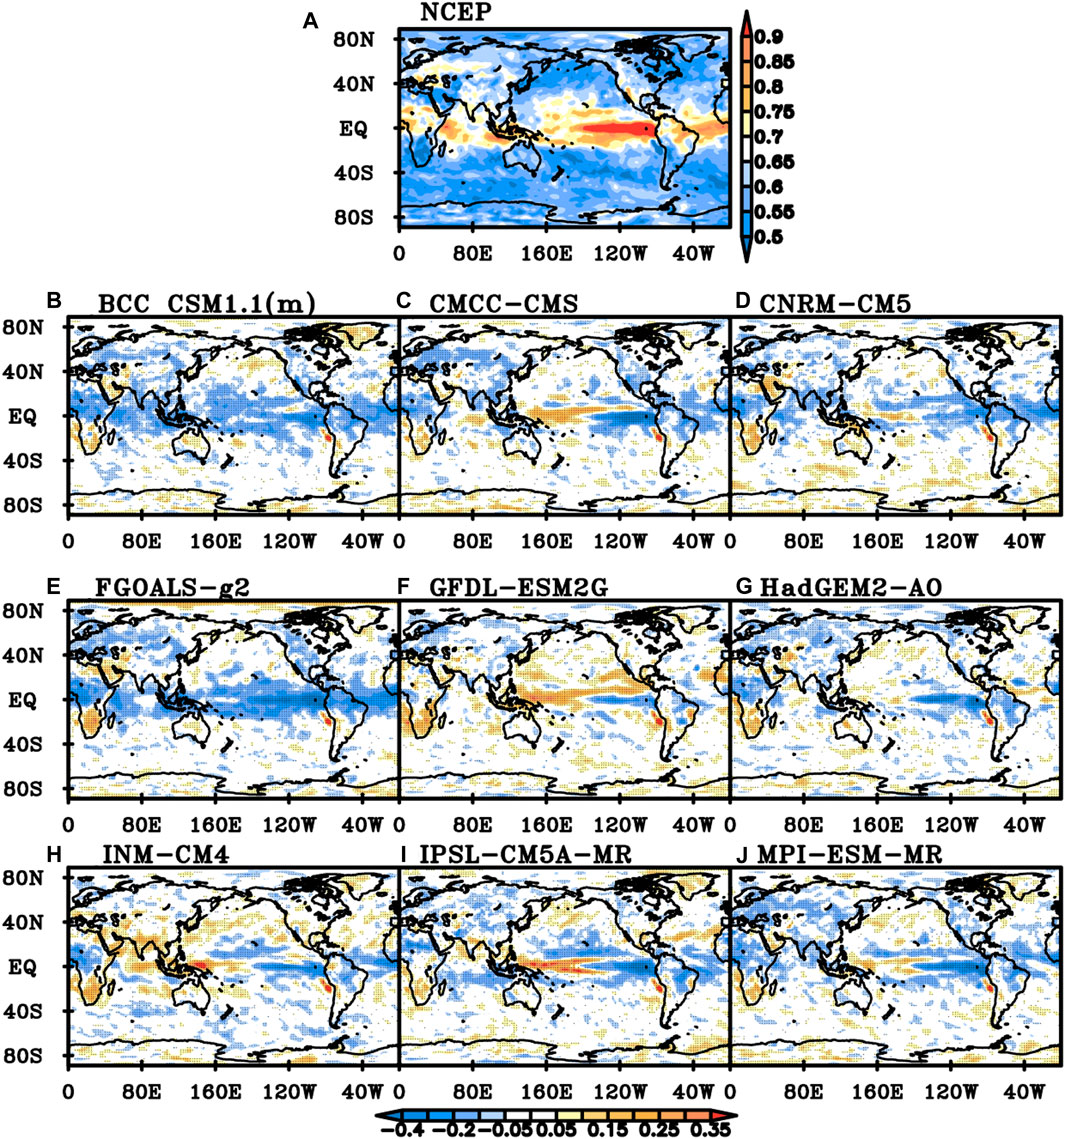
FIGURE 8. The same as Figure 7, but for summer.
Discussion and Conclusion
Based on the DFA method, this paper evaluates the performance of nine CMIP5 models for global daily precipitation from 1960 to 2005. The DFA results of NCEP daily precipitation present long-term correlation characteristics in most regions of the world. The scaling exponents of precipitation in the central part of North America are the largest in summer. The seasonal variations of daily precipitation’s scaling exponents simulated by CNRM-CM5, GFDL-ESM2G, HadGEM2-AO and IPSL-CM5A-MR are similar to those of NCEP, which can capture the characteristics that scaling exponents are the biggest in summer and the smallest in autumn. The scaling exponents of precipitation in the equatorial central Pacific are the smallest in summer, indicating the LRC in this region is the weakest in summer. Moreover, the scaling exponents in winter are around 1.0 value.
The zonal average scaling exponents of NCEP daily precipitation are smaller in middle and high latitudes. In spring, the zonal mean scaling exponents of NCEP are larger in the northern hemisphere than those in the southern hemisphere. The zonal average scaling exponents in the northern hemisphere vary slightly with the latitudes increasing and the scaling exponents are around 0.6. In the southern hemisphere, the zonal average scaling exponents reach the minimum near 40°S, and then increase to 0.6 with the increase of latitudes. Seasonal characteristics in summer and autumn are similar to those in spring. In winter, the scaling exponents of NCEP reach the minimum near 60°S in the southern hemisphere and then increase rapidly. Most CMIP5 models can capture the characteristics that zonal mean scaling exponents of daily precipitation reach the peak in the tropics and then decrease rapidly with the latitudes increasing. The zonal mean scaling exponents simulated by CMCC-CMS, GFDL-ESM2G and IPSL-CM5A-MR are similar to those of NCEP, while BCC_CSM1.1(m) and FGOALS-g2 cannot capture this feature of seasonal variations.
The global daily precipitation of NCEP shows LRC in most parts of the world, in which the scaling exponents are generally bigger and above 0.9 over the tropical middle and east Pacific Ocean for the year and four seasons. The differences between models and NCEP are larger in the middle and low latitudes. In AO, SIB, SO and ANT regions, the differences of scaling exponents’ absolute value between CMIP5 models and NCEP are less than 0.05. While in WAF, EAF, TEP and NSA, the absolute value of scaling exponents’ biases are greater than 0.05 for the year and all four seasons. The biases of GFDL-ESM2G, HadGEM2-AO and INM-CM4 are relatively small, which means that the dynamical characteristics of climate systems are well simulated by these models.
The present study provides a reference for different CMIP5 models’ performance in simulating the LRC of global daily precipitation. Comparing the individual models for certain regions reveals that most CMIP5 models can capture the dynamical characteristics of climate system, while there are inter-model differences in various regions. Therefore, appropriate models should be selected according to different research regions.
Data Availability Statement
The datasets presented in this study can be found in online repositories. Further inquiries can be directed to the corresponding author.
Author Contributions
TD: Draft paper. Approve the final edition of the paper to be published WH: Make important revisions to the paper. Provide overall thinking. Approve the final edition of the paper to be published SZ, YM, XX, and SW offered the suggestion. All author1s235contributed to the article and approved the submitted version.
Funding
This work was funded by National Key R&D Program of China (2016YFA0602703), the National Natural Science Foundation of China (Grant Nos. 41775092, 41975086, 41905063, and 91644225), and the Fundamental Research Funds for the Central Universities (Grant No. 20lgzd06), and Guangdong Basic and Applied Basic Research Foundation (No. 2021A1515011428).
Conflict of Interest
The authors declare that the research was conducted in the absence of any commercial or financial relationships that could be construed as a potential conflict of interest.
References
Blender, R., and Fraedrich, K. (2003). Long Time Memory in Global Warming Simulations. Geophys. Res. Lett. 30, 1769–1722. doi:10.1029/2003GL017666
Bunde, A., Eichner, J. F., Kantelhardt, J. F., and Havlin, S. (2005). Long-Term Memory: A Natural Mechanism for the Clustering of Extreme Events and Anomalous Residual Times in Climate Records. Phys. Rev. Lett. 94, 048701. doi:10.1103/PysRevLett.94.048701
Bunde, A., and Havlin, S. (2002). Power-law Persistence in the Atmosphere and in the Oceans. Physica A: Stat. Mech. its Appl. 314, 15–24. doi:10.1016/s0378-437102)01050-6
Chan, D., and Wu, Q. (2015). Attributing Observed SST Trends and Subcontinental Land Warming to Anthropogenic Forcing during 1979-2005. J. Clim. 28, 3152–3170. doi:10.1175/JCLI-D-14-00253.1
Chen, Z., Zhou, T., Zhang, W., Li, P., and Zhao, S. (2020). Projected Changes in the Annual Range of Precipitation under Stabilized 1.5°C and 2.0°C Warming Futures. Earth's Future 8, e2019EF001435. doi:10.1029/2019EF001435
Dong, T.-Y., Dong, W.-J., Guo, Y., Chou, J.-M., Yang, S.-L., Tian, D., et al. (2018). Future Temperature Changes over the Critical Belt and Road Region Based on CMIP5 Models. Adv. Clim. Change Res. 9 (1), 57–65. doi:10.1016/j.accre.2018.01.003
Du, H., Wu, Z., Li, M., Jin, Y., Zong, S., and Meng, X. (2013). Characteristics of Extreme Daily Minimum and Maximum Temperature over Northeast China, 1961-2009. Theor. Appl. Climatol. 111, 161–171. doi:10.1007/s00704-012-0649-3
Feng, G. L., Gong, Z. Q., Hou, W., Wang, Q. G., and Zhi, R. (2009). Long-range Correlation of Extreme Events in Meteorological Field (In Chinese). Acta Phys. Sin. 58 (4), 2853–2861. doi:10.3321/j.issn:1000-3290.2009.04.115
Fu, Z., Shi, L., Xie, F., and Piao, L. (2016). Nonlinear Features of Northern Annular Mode Variability. Physica A: Stat. Mech. its Appl. 449, 390–394. doi:10.1016/j.physa.2016.01.014
Gan, Z., Yan, Y., and Qi, Y. (2007). Scaling Analysis of the Sea Surface Temperature Anomaly in the South China Sea. J. Atmos. Ocean. Tech. 24, 681–687. doi:10.1175/JTECH1981.1
Giorgi, F. (2002). Variability and Trends of Sub-continental Scale Surface Climate in the Twentieth century. Part I: Observations. Clim. Dyn. 18, 675–691. doi:10.1007/s00382-001-0204-x
Govindan, R. B., Vyushin, D., Bunde, A., Brenner, S., Havlin, S., and Schellnhuber, H.-J. (2002). Global Climate Models Violate Scaling of the Observed Atmospheric Variability. Phys. Rev. Lett. 89, 028501–028504. doi:10.1103/PhysRevLett.89.028501
Guo, Y., Dong, W. J., Ren, F. M., Zhao, Z. C., Huang, J. B., et al. (2013). Surface Air Temperature Simulations over China with CMIP5 and CMIP3. Adv. Clim. Chang. Res. 4, 145–152. doi:10.3724/SP.J.1248.2013.145
He, W.P., and Zhao, S.S. (2018). Assessment of the Quality of NCEP-2 and CFSR Reanalysis Daily Temperature in China Based on Long-Range Correlation. Clim. Dyn. 50, 493–505. doi:10.1007/s00382-017-3622-0
He, W.P., Zhao, S.S., Wu, Q., Jiang, Y.D., and Wan, S. (2019). Simulating Evaluation and Projection of the Climate Zones over China by CMIP5 Models. Clim. Dyn. 52 (5), 2597–2612. doi:10.1007/s00382-018-4410-1
He, W., Zhao, S., Liu, Q., Jiang, Y., and Deng, B. (2016). Long-range Correlation in the Drought and Flood index from 1470 to 2000 in Eastern China. Int. J. Climatol. 36, 1676–1685. doi:10.1002/joc.4450
IPCC (2013). Climate Change 2013: The Physical Science Basis. Contribution of Working Group I to the Fifth Assessment Report of the Intergovernmental Panel on Climate Change. Cambridge and New York: Cambridge University Press. http://www.ipcc.ch/report/ar5/wg1/.
Jiang, D., Tian, Z., and Lang, X. (2016). Reliability of Climate Models for China through the IPCC Third to Fifth Assessment Reports. Int. J. Climatol. 36, 1114–1133. doi:10.1002/joc.4406
Jiang, L., Li, N., Fu, Z., and Zhang, J. (2015). Long-range Correlation Behaviors for the 0-cm Average Ground Surface Temperature and Average Air Temperature over China. Theor. Appl. Climatol. 119, 25–31. doi:10.1007/s00704-013-1080-0
Jiang, Z. H., Chen, W. L., Song, J., and Wang, J. (2009). Projection and Evaluation of the Precipitation Extremes Indices over China Based on Seven IPCC AR4 Coupled Climate Models (In Chinese). Chin. J. Atmos. Sci. 33, 109–120. doi:10.3878/j.issn.1006-9895.2009.01.10
Jiang, Z. H., Ding, Y. G., and Chen, W. L. (2007). Projection of Precipitation Extremes for the 21st Century over China (In Chinese). Adv. Clim. Chang. Res. 3, 202–207.
Jiang, Z., Li, W., Xu, J., and Li, L. (2015). Extreme Precipitation Indices over China in CMIP5 Models. Part I: Model Evaluation. J. Clim. 28 (21), 8603–8619. doi:10.1175/JCLI-D-15-0099.1
Kalnay, E., Kanamitsu, M., Kistler, R., Collins, W., Deaven, D., Gandin, L., et al. (1996). The NCEP/NCAR 40-Year Reanalysis Project. Bull. Amer. Meteorol. Soc. 77, 437–471. doi:10.1175/1520-0477(1996)077<0437:tnyrp>2.0.co;2
Kantelhardt, J. W., Koscielny-Bunde, E., Rego, H. H. A., Havlin, S., and Bunde, A. (2001). Detecting Long-Range Correlations with Detrended Fluctuation Analysis. Physica A: Stat. Mech. its Appl. 295, 441–454. doi:10.1016/s0378-4371(01)00144-3
Kantelhardt, J. W., Koscielny-Bunde, E., Rybski, D., Braun, P., Bunde, A., and Havlin, S. (2006). Long-term Persistence and Multifractality of Precipitation and River Runoff Records. J. Geophys. Res. 111, D01106. doi:10.1029/2005JD005881
Kantelhardt, J. W., Zschiegner, S. A., Koscielny-Bunde, E., Havlin, S., Bunde, A., and Stanley, H. E. (2002). Multifractal Detrended Fluctuation Analysis of Nonstationary Time Series. Physica A: Stat. Mech. its Appl. 316, 87–114. doi:10.1016/S0378-4371(02)01383-3
Knutson, T. R., Zeng, F., and Wittenberg, A. T. (2013). Multimodel Assessment of Regional Surface Temperature Trends: CMIP3 and CMIP5 Twentieth-Century Simulations. J. Clim. 26, 8709–8743. doi:10.1175/JCLI-D-12-00567.1
Koscielny-Bunde, E., Roman, H. E., Bunde, A., Havlin, S., and Schellnhuber, H. J. (1998). Long-range Power-Law Correlations in Local Daily Temperature Fluctuation. Philosophical Mag. B 77, 1331–1340. doi:10.1080/13642819808205026
Kumar, S., Merwade, V., Kinter, J. L., and Niyogi, D. (2013). Evaluation of Temperature and Precipitation Trends and Long-Term Persistence in CMIP5 Twentieth-century Climate Simulations. J. Clim. 26, 4168–4185. doi:10.1175/JCLI-D-12-00259.1
Lennartz, S., and Bunde, A. (2011). Distribution of Natural Trends in Long-Term Correlated Records: A Scaling Approach. Phys. Rev. E 84, 021129. doi:10.1103/PhysRevE.84.021129
Li, C., Zwiers, F., Zhang, X., and Li, G. (2019). How Much Information Is Required to Well Constrain Local Estimates of Future Precipitation Extremes? Earth's Future 7, 11–24. doi:10.1029/2018ef001001
Li, Q., Zhang, L., Xu, W., Zhou, T., Wang, J., Zhai, P., et al. (2017). Comparisons of Time Series of Annual Mean Surface Air Temperature for China since the 1900s: Observations, Model Simulations, and Extended Reanalysis. Bull. Amer. Meteorol. Soc. 98, 699–711. doi:10.1175/BAMS-D-16-0092.1
Li, W., Jiang, Z. H., Xu, J., and Li, L. (2015). Extreme Precipitation Indices over China in CMIP5 Models, Part I: Model Evaluation. J. Clim. 28, 8603–8617. doi:10.1175/JCLI-D-15-0099.11
Lin, L., Gettelman, A., Xu, Y., Wu, C., Wang, Z., Rosenbloom, N., et al. (2019). CAM6 Simulation of Mean and Extreme Precipitation over Asia: Sensitivity to Upgraded Physical Parameterizations and Higher Horizontal Resolution. Geosci. Model. Dev. 12, 3773–3793. doi:10.5194/gmd-12-3773-2019
Ma, S., and Zhou, T. (2015). Precipitation Changes in Wet and Dry Seasons over the 20th century Simulated by Two Versions of the FGOALS Model. Adv. Atmos. Sci. 32 (6), 839–854. doi:10.1007/s00376-014-4136-x
Malamud, B. D., and Turcotte, D. L. (1999). Self-affine Time Series: I. Generation and Analyses. Adv. Geophys. 40, 1–90. doi:10.1016/S0065-2687(08)60293-9
Peng, C.-K., Buldyrev, S. V., Havlin, S., Simons, M., Stanley, H. E., and Goldberger, A. L. (1994). Mosaic Organization of DNA Nucleotides. Phys. Rev. E 49, 1685–1689. doi:10.1103/PhysRevE.49.1685
Peng, D., Zhou, T., Zhang, L., Zhang, W., and Chen, X. (2019). Observationally Constrained Projection of the Reduced Intensification of Extreme Climate Events in Central Asia from 0.5 °C Less Global Warming. Clim. Dyn. 54, 543–560. doi:10.1007/s00382-019-05014-6
Rybski, D., Bunde, A., and von Storch, H. (2008). Long-term Memory in 1000-year Simulated Temperature Records. J. Geophys. Res. 113, D02106. doi:10.1029/2007JD008568
Sillmann, J., Kharin, V. V., Zhang, X., Zwiers, F. W., and Bronaugh, D. (2013). Climate Extremes Indices in the CMIP5 Multimodel Ensemble: Part 1. Model Evaluation in the Present Climate. J. Geophys. Res. Atmos. 118, 1716–1733. doi:10.1002/jgrd.50203
Talkner, P., and Weber, R. O. (2000). Power Spectrum and Detrended Fluctuation Analysis: Application to Daily Temperatures. Phys. Rev. E 62, 150–160. doi:10.1103/PhysRevE.62.150
Taylor, K. E., Stouffer, R. J., and Meehl, G. A. (2012). An Overview of CMIP5 and the experiment Design. B. Am. Meteorol. Soc. 93, 485–498. doi:10.1175/BAMS-D-11-00094.1
Tian, D., Guo, Y., and Dong, W. (2015). Future Changes and Uncertainties in Temperature and Precipitation over China Based on CMIP5 Models. Adv. Atmos. Sci. 32, 487–496. doi:10.1007/s00376-014-4102-7
Trenberth, K. (2011). Changes in Precipitation with Climate Change. Clim. Res. 47 (1), 123–138. doi:10.3354/cr00953
Tsonis, A. A., Roebber, P. J., and Elsner, J. B. (1999). Long-range Correlations in the Extratropical Atmospheric Circulation: Origins and Implications. J. Clim. 12, 1534–1541. doi:10.1175/1520-0442(1999)012<1534:lrcite>2.0.co;2
Wang, B., Liu, J., Kim, H.-J., Webster, P. J., and Yim, S.-Y. (2012). Recent Change of the Global Monsoon Precipitation (1979-2008). Clim. Dyn. 39 (5), 1123–1135. doi:10.1007/s00382-011-1,266-z
Wang, L., and Chen, W. (2013). A CMIP5 Multimodel Projection of Future Temperature, Precipitation, and Climatological Drought in China. Int. J. Climatol. 34, 2059–2078. doi:10.1002/joc.3822
Xu, Y., and Xu, C. H. (2012). Preliminary Assessment of Simulations of Climate Changes over China by CMIP5 Multi Models. Atmos. Oceanic Sci. 5, 489–494. doi:10.1080/16742834.2012.11447041
Yang, S., Feng, J., Dong, W., and Chou, J. (2014). Analyses of Extreme Climate Events over China Based on CMIP5 Historical and Future Simulations. Adv. Atmos. Sci. 31, 1209–1220. doi:10.1007/s00376-014-3119-2
Yeo, S.-R., and Kim, K.-Y. (2014). Global Warming, Low-Frequency Variability, and Biennial Oscillation: an Attempt to Understand the Physical Mechanisms Driving Major Enso Events. Clim. Dyn. 43 (3-4), 771–786. doi:10.1007/s00382-013-1862-1
Yuan, N., Ding, M., Huang, Y., Fu, Z., Xoplaki, E., and Luterbacher, J. (2015). On the Long-Term Climate Memory in the Surface Air Temperature Records over Antarctica: a Nonnegligible Factor for Trend Evaluation. J. Clim. 28, 5922–5934. doi:10.1175/JCLI-D-14-00733.1
Zhang, W. F., and Zhao, Q. (2015). Asymmetric Long-Term Persistence Analysis in Sea Surface Temperature Anomaly. Physica A: Stat. Mech. its Appl. 428, 314–318. doi:10.1016/j.physa.2015.01.081
Zhang, W., Zhou, T., Zou, L., Zhang, L., and Chen, X. (2018). Reduced Exposure to Extreme Precipitation from 0.5 °C Less Warming in Global Land Monsoon Regions. Nat. Commun. 9 (1), 3153. doi:10.1038/s41467-018-05633-3
Zhao, S., and He, W. (2015). Evaluation of the Performance of the Beijing Climate Centre Climate System Model 1.1(m) to Simulate Precipitation across China Based on Long-Range Correlation Characteristics. J. Geophys. Res. Atmos. 120, 12576–12588. doi:10.1002/2015JD024059
Zhao, S., He, W., and Jiang, Y. (2017). Evaluation of NCEP-2 and CFSR Reanalysis Seasonal Temperature Data in China Using Detrended Fluctuation Analysis. Int. J. Climatol. 38, 252–263. doi:10.1002/joc.5173
Zhao, S. S., and He, W. P. (2014). Performance Evaluation of Chinese Air Temperature Simulated by Beijing Climate Center Climate System Model on the Basis of the Long-Range Correlation (In Chinese). Acta Phys. Sin. 63, 209201. doi:10.7498/aps.63.209201
Zhao, S. S., and He, W. P. (2015). Performance Evaluation of the Simulated Daily Average Temperature Series in Four Seasons in China by Beijing Climate System Model (In Chinese). Acta Phys. Sin. 64, 049201. doi:10.7498/aps.64.049201
Zhao, T., Chen, L., and Ma, Z. (2014). Simulation of Historical and Projected Climate Change in Arid and Semiarid Areas by CMIP5 Models. Chin. Sci. Bull. 59, 412–429. doi:10.1007/s11434-013-0003-x
Keywords: detrended fluctuation analysis, CMIP5, daily precipitation, scaling exponent, long-range correlation
Citation: Dong T, Zhao S, Mei Y, Xie X, Wan S and He W (2021) Whether the CMIP5 Models Can Reproduce the Long-Range Correlation of Daily Precipitation?. Front. Environ. Sci. 9:656639. doi: 10.3389/fenvs.2021.656639
Received: 21 January 2021; Accepted: 27 May 2021;
Published: 16 June 2021.
Edited by:
Qingxiang Li, Sun Yat-Sen University, ChinaCopyright © 2021 Dong, Zhao, Mei, Xie, Wan and He. This is an open-access article distributed under the terms of the Creative Commons Attribution License (CC BY). The use, distribution or reproduction in other forums is permitted, provided the original author(s) and the copyright owner(s) are credited and that the original publication in this journal is cited, in accordance with accepted academic practice. No use, distribution or reproduction is permitted which does not comply with these terms.
*Correspondence: Wenping He, d2VucGluZ19oZUAxNjMuY29t