 Janna M. Barel
 Vincent Moulia
 Samuel Hamard
 Anna Sytiuk
 Vincent E. J. Jassey
- Laboratoire Ecologie Fonctionelle et Environnement, Université de Toulouse, CNRS, Toulouse, France
Precipitation patterns are becoming increasingly extreme, particularly at northern latitudes. Current climate models predict that this trend will continue in the future. While droughts have been repeatedly studied in many ecosystems over the last decades, the consequences of increasingly intense, but less frequent rainfall events, on carbon (C) cycling are not well understood. At northern latitudes, peatlands store one third of the terrestrial carbon and their functioning is highly dependent on water. Shifts in rainfall regimes could disrupt peatland C dynamics and speed-up the rates of C loss. How will these immense stocks of C be able to withstand and recover from extreme rainfall? We tested the resistance and resilience effects of extreme precipitation regimes on peatland carbon dioxide (CO2) and methane (CH4) fluxes, pore water dissolved organic carbon (DOC) and litter decomposition rates by exposing intact peat cores to extreme, spring-time rainfall patterns in a controlled mesocosm experiment. We find that more intense but less frequent rainfall destabilized water table dynamics, with cascading effects on peatland C fluxes. Decomposition and respiration rates increased with a deeper mean water table depth (WTD) and larger WTD fluctuations. We observed similar patterns for CO2 uptake, which were likely mediated by improved vascular plant performance. After a three-week recovery period, CO2 fluxes still displayed responses to the earlier WTD dynamics, suggesting lagged effects of precipitation regime shifts. Furthermore, we found that CH4 emissions decreased with deeper mean WTD, but this showed a high resilience once WTD dynamics stabilised. Not only do our results illustrate that shifting rainfall patterns translate in altered WTD dynamics and, consequentially, influence C fluxes, they also demonstrate that exposure to altered rainfall early in the growing season can have lasting effects on CO2 exchange. Even though the increased CO2 assimilation under extreme precipitation patterns signals peatland resistance under changing climatic conditions, it may instead mark the onset of vascular plant encroachment and the associated C loss.
Introduction
Climatic change includes shifting precipitation patterns along with increases in temperature and drought (Dai, 2013). Moreover, current observations of increased heavy precipitation confirm earlier predictions (Fischer and Knutti, 2016). In the past three decades, extreme precipitation events have become more common (Lehmann et al., 2015), particularly in North America and Europe (Ummenhofer and Meehl, 2017). As a consequence of more intense but less frequent rainfall events in northern temperate to arctic regions, local carbon (C) dynamics are expected to change (Blodau and Moore, 2003; Gerten et al., 2008; Knapp et al., 2008; Frank et al., 2015; Dai et al., 2018). Heavy rain might temporarily invoke waterlogged and anoxic soil conditions and thus limit processes that require oxygen such as respiration (by plants and soil biota) and decomposition (Knapp et al., 2008; Reichstein et al., 2013) and promote methanogenesis. Conversely, increasingly long intervals between heavy rain events could lead to drought stress, affecting both plant and soil microbial physiology (Zeppel et al., 2014; Schimel, 2018), as well as related ecosystem functions, including photosynthesis, respiration, and methanogenesis (Knapp et al., 2002; Reichstein et al., 2013; Zeppel et al., 2014; Helfter et al., 2015). While the effects of drought and flooding are reasonably well understood, the combined impact of more intense rain and increased duration of dry intervals on ecosystem C dynamics is little researched.
At northern latitudes, peatlands are one of the dominant ecosystems (Leifeld and Menichetti, 2018) and their C dynamics heavily depend on their hydrology (Limpens et al., 2008). Predominant shallow water tables lead to C sequestration because of an imbalance of C entering the system through photosynthesis, while little assimilated C is lost because of repressed decomposition and respiration (Dise 2009; Turetsky et al., 2012). As a result peatlands store the equivalent of 25–50% of the global soil organic C stock (i.e., 500–1000 GtC) (Yu, 2012; Wieder et al., 2013; Jackson et al., 2017; Nichols and Peteet, 2019). Peatland C stocks are vulnerable to ongoing climatic change (Dise 2009) and especially to hydrological shifts (Swindles et al., 2019). Hydrological shifts such as caused by extreme rainfall patterns or drought threaten peatland C dynamics (Radu and Duval, 2018b; Evans et al., 2021), pushing peatlands toward becoming a C source by increasing decomposition rates (Belyea, 1996; Moore et al., 2007) and CO2 respiration (Lund et al., 2012; Helfter et al., 2015) and reducing CO2 uptake (Kuiper et al., 2014; Helfter et al., 2015). As a consequence of extreme drought, methanogenesis may decrease while methanotrophy increases, thus reducing CH4 emissions (Bubier and Moore, 1994; Turetsky et al., 2014; Evans et al., 2021).
Hydrological shifts do not always translate into peatland C loss (Robroek et al., 2009; Muhr et al., 2011; Nijp et al., 2014; Wang et al., 2015). Small but frequent rain events can be readily exploited by the crucial peat-forming Sphagnum mosses, maintaining the moisture level at the peat surface sufficiently for CO2 uptake (Robroek et al., 2009; Strack and Price, 2009; Adkinson and Humphreys, 2011; Nijp et al., 2014). The influence of rain is particularly relevant when water tables are low (Strack and Price, 2009). Sphagnum mosses are prone to drying because they lack vascular tissue and roots to cope with dry conditions. Then again, Sphagnum photosynthesis can recover within 1 h when rewetted after a long period of drought (Jassey and Signarbieux, 2019). Yet, this quick recovery of Sphagnum C assimilation might not be sufficient to off-set autotrophic respiration costs of restarting photosynthesis (McNeil and Waddington, 2003; Nijp et al., 2014). At the same time, under dry conditions vascular plants may take-over the C sink function from Sphagnum (Huth et al., 2018; Schwieger et al., 2020; Radu and Duval, 2018b), making the effects of shifting rainfall regimes on net ecosystem exchange harder to predict. Influence of precipitation shifts on peatland C dynamics may also act through dissolved organic carbon (DOC). Flooding and heavy rains can result in a temporary increase in DOC concentration (Moore and Dalva, 2001; Blodau and Moore, 2003) and DOC loss by run-off (Pastor et al., 2003; Leach et al., 2016; Rosset et al., 2019). Furthermore, recent evidence showed that prolonged drought has little effect on the concentration of DOC, although lowering of the water table decreased DOC aromaticity and/or lower its molecular weight (Jassey et al., 2018). These observations highlight the uncertainty and the need for a better understanding of peatland C dynamics responses to more extreme precipitation patterns.
Besides its hydrological state, seasonal timing also controls an ecosystem’s response to precipitation shifts. Indeed, disturbances to vegetation phenology can have cascading effects on peatland C uptake (Helfter et al., 2015; Koebsch et al., 2020). While repeated drought stress early in the growing season may lead to a loss of resilience regarding CO2 uptake, its effect on other C fluxes, such as decomposition, DOC, respiration, and CH4 efflux, is little studied. This underlines the need to investigate the influence of redistribution of rainfall early in the growing season on peatland C dynamics, which may be substantial given the hydrological control on C uptake, turn-over and loss. Moreover, effects of extreme rainfall patterns on peatland C dynamics in spring could have immediate as well as longer term consequences when the response mechanisms include lasting physiological and community changes among plants and microorganisms (Frank et al., 2015; Schimel 2018).
Here, we evaluated the capacity of peatland C dynamics to tolerate severe spring rainfall redistribution. We studied how peatland C dynamics continue to function during (i.e., resistance) and “bounce back” from (i.e., resilience) increasingly extreme precipitation regimes during spring (sensuNimmo et al., 2015; Ingrisch and Bahn 2018), in order to understand how C storage in peatlands may be affected by prospective climatic change early in the growing season. For wet systems, such as peatlands, Knapp et al. (2008) postulated that low frequent but intense rainfall events will reduce the number of days during which the system experiences anoxic conditions. That is why we expected that 1) under more intense but less frequent rainfall C cycling rates speed up with increased assimilation, decomposition, and respiration but reduced CH4 emissions as caused by larger fluctuations of the water table over time. Moreover, 2) peatland C dynamics are expected to be resilient and C dynamics recover after rewetting without lasting effects. We tested our hypotheses in a mesocosm experiment in which intact peat cores were exposed to increasingly intense, but less frequent rainfall for nearly 3 months, followed by rewetting and a three-week recovery period.
Materials and Methods
Study Site
To construct the experimental mesocosms, peat monoliths with homogeneous vegetation cover were extracted from a poor fen near Counozouls in the French Pyrenees (42o41′16 N; 2o14′18E, altitude 1,350 m, 7.9°C mean annual temperature, 1,027 mm mean annual precipitation). The site is situated within the Special Area of Conservation Natura 2,000 site “Massif du Madres Coronat.” The vegetation has a moss layer dominated by Sphagnum warnstorfii Russow and S. palustre L., the vascular vegetation was characterized by Molinia caerulea (L.) Moench, Eriophorum angustifolium L., Calluna vulgaris (L.) Hull, Potentilla anglica Laich. and Drosera rotundifolia L. Intact peat monoliths (14 cm h, 27 cm l, 17 cm d) were extracted in November 2019 and climatized for 3 months in a greenhouse in watertight containers, during which time the water table was kept at approximately−4 cm below the peat surface by watering regularly (for timeline see Table 1).

TABLE 1. Time line of the mesocosm experiment.
Meteorological field observations at the Counozouls site served as a baseline for the precipitation regimes (Supplementary Figure S1). In spring 2019 (March-May) 248 mm of rain fell at the site, varying from 0 to 31 mm a day, while in summer (June-Aug) 177 mm of rain fell, varying from 0 to 33 mm a day. The longest consecutive period without rain was 12 days during spring and 11 days during the summer months. We further calculated the rain frequency (% of days with rain), rain intensity (average mm of rain on a rainy day), and drought intensity (average length of dry spell in days) to characterize the rainfall regime at the field site during spring and summer (Figure 1).
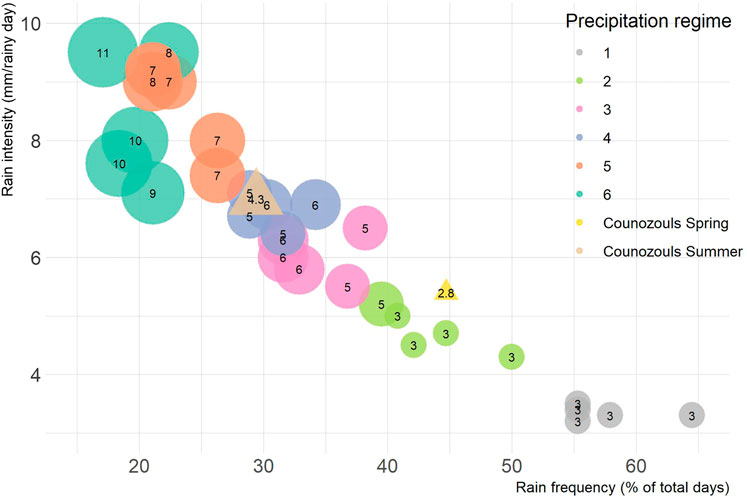
FIGURE 1. Characteristics of rainfall patterns to which the mesocosms (circles) were exposed during the resistance phase, along with those observed at the reference site Counozouls (triangles) during spring and summer 2019. Experimental rainfall treatments fell into one of six precipitation regimes of reducing rainfall frequency but increasing intensity. Size of the bubbles is scaled to drought intensity, given as the average number of days between rainfall events.
Experimental Design
A week before the start of the experiment, intact cores were taken from the acclimated peat monoliths to construct 30 mesocosms in watertight plant pots (13 cm d, 9.5 cm h). The depth of the mesocosms covered the actively growing Sphagnum capitula, recently senesced Sphagnum stems and approximately 5 cm bulk peat including vascular plant roots. For 11 weeks the mesocosms were exposed to experimental precipitation regimes. Each pot was randomly assigned to one of six regimes. The precipitation regimes entailed the same amount of precipitation over the 11 weeks, but administered in increasingly extreme patterns sensuKnapp et al. (2008), namely 133–187 mm except for the most extreme regime (regime 6) which received 106–160 mm (Supplementary Figure S2). Every regime included 8–14 drought intervals (6–7 for regime 6) that intermitted the rain events. The regimes became increasingly extreme in three aspects: increase in rainfall intensity, reduction in rainfall frequency and consequentially lengthening of dry intervals between rain events (Figure 1). Dry intervals in the least extreme regime lasted maximum 5 days and increased to maximum 29 days in the most extreme regime. In all this, regime 2 most closely resembled precipitation patterns observed at the field site during spring. In order to mimic natural variation, the five replicates within a regime varied slightly in the amount of precipitation per rain event and the exact length of a drought spell, but the order of the drought spells was synchronized to prevent pseudo-replication. The mesocosms were watered according to the precipitation treatments with artificial rain water based on the protocol by Garrels and Christ (1965), with addition of micronutrients, see Supplementary Table S1.
The resistance and resilience responses to the experimental precipitation regimes were observed during two experimental phases (Table 1). The precipitation regimes were applied during the resistance phase (I) which lasted 11 weeks. The resilience phase (II) immediately followed the resistance phase. This lasted 20 days during which the water table was restored to pre-experimental conditions in all pots (−4 cm) by watering the pots with approximately 50 ml every 2 days. We considered this duration to be sufficient to measure recovery as photosynthetic activity in Sphagnum mosses resumes within an hour after rewetting (Jassey and Signarbieux, 2019), and net CO2 assimilation of intact peat cores was previously shown to recover in about 2 weeks (Robroek et al., 2009), while photosynthetic potential of vascular plants is not or much less affected by reduced rainfall (Rastogi et al., 2019).
Peat C dynamics were measured as litter decomposition rates (during phase I), CO2 and CH4 gas fluxes on a weekly basis, during phase I, and biweekly basis during phase II, and as dissolved organic carbon (DOC) concentrations and quality in the pore water at five time points to cover the start, middle and end of phase I, and start and end of phase II (Table 1). Mid-way the resistance phase (week 7), we counted the number of graminoid and ericoid shoots and their average length to verify whether the abundance of vascular plants was similar across the six precipitation regimes.
The 30 mesocosms (5 reps, 6 regimes) were first placed in the greenhouse in a randomized design. Unfortunately, we were forced to move the experiment to a new location in week 5, because the greenhouse facilities closed due to the outbreak of the COVID-19 pandemic. The mesocosms were moved to a sheltered location with natural, albeit reduced light at ambient outdoor temperature. The precipitation regimes were maintained and continuous monitoring of the experimental conditions and inclusion of location in our statistical analysis (both see below) safeguarded the continuation and interpretation of our measurements.
Experimental Conditions
Throughout the experiment, peat temperature (at−5 cm), volumetric moisture content and light intensity were registered every 30 min. Soil temperature and moisture loggers (5TM sensor, Decagon devices Inc., United States) were placed in three pots from precipitation regimes 1, 3, and 6, randomly chosen from among the 5 replicates per regime. We monitored the light intensity by placing a photosynthetic active radiation (PAR) light sensor (QSO-S, Decagon Devices Inc., United States of America) in the middle between the mesocosms. Water table depth (WTD), as the distance (cm) from the top of the Sphagnum layer, was measured once every 2 days during the resistance phase, and twice a week during the resilience phase.
Measurements Peatland C Dynamics
Decomposition Rates
Decomposition rates were measured during the resistance phase by incubating graminoid litter in litter bags (Cornelissen, 1996). The graminoid litter was collected at the field site in January 2020, dried at 60°C for 72 h, cut to fragments (1 cm) and put in nylon bags (5 × 6 cm, mesh size <1 mm), approx. 0.75 g per litterbag. The litterbags were inserted vertically into the peat at−5 cm at the start of the resistance phase and retrieved after 75 days, at the end of the resistance phase. The collected litterbags were cleaned with tap water and dried (60°C) before weighting. Decomposition rates were measured as constant k, following the exponential decay model by Olson (1963):
where decomposition rate constant k is calculated based on the remaining mass (Xt) after t days of incubation as a fraction of the initial mass (X0).
Dissolved Organic Carbon
We monitored the DOC concentration and quality by sampling 10 ml porewater from each mesocosm, and replacing the sampled amount by equal amounts of artificial rainwater to compensate for the water removal. Porewater was filtered at 1 µm to remove particles and micro-organisms (Whatman GmbH, Dassel, Germany) and stored at −20°C before determining DOC concentration (mg C L−1) by combustion on a TOC analyser (TOC-L, Shimadzu Europe GmbH, Duisburg, Germany) (Pastor et al., 2003; Hamard et al., 2019). For DOC quality we measured the spectral absorbance along 15 wavelengths between 250–465 nm of 200 µl sample aliquots in 96-well quartz microplates using a BioTek SynergyMX plate reader (BioTek Instruments Inc., Vermont, United States) spectrofluorometer (Jaffrain et al., 2007). Spectral slope [S250–465 (nm−1)], calculated using linear regression with Ln-transformed absorptions along the 250–465 nm range, as indication of DOC quality: high S250–465 values indicate low molecular weight compounds and or decreasing aromaticity (Hansen et al., 2016).
Gas Fluxes (CO2, CH4)
Gas flux rates were measured using the chamber method (Riutta et al., 2007). Mesocosms were placed in airtight flux chambers (17.4 cm × 25.7 cm x 17.4 cm) to simultaneously measure CO2 and CH4 fluxes using a trace gas analyser (LI-COR 7810, Li-Cor Environmental-GmbH, Bad Homburg, Germany) set to record the CO2 and CH4 concentration every second during 5 min. Net ecosystem exchange of CO2 (NEE) was measured using a transparent chamber while ecosystem CO2 respiration (Reco) was measured using a darkened chamber. Gross primary productivity (GPP), CO2 uptake as a result of photosynthesis, was calculated as the difference between NEE and Reco. All gas fluxes were measured at ambient temperature and light conditions in the greenhouse (week 1–4) or outdoors (week 5–14). After visually confirming that for all measurements CO2 and CH4 concentrations in the chamber headspace changed linearly when plotted against time, gas flux rates were calculated with linear regression models using the R package gasfluxes (Fuss, 2020). Gas fluxes were corrected for the container volume, mesocosm surface area, light intensity and soil temperature following the package guidelines. Positive values for the CO2 and CH4 fluxes indicate C release from and negative values C uptake by the mesocosm.
Cumulative CO2 and CH4 fluxes
To assess the resistance and resilience responses of the C balance to extreme precipitation, we reconstructed the C fluxes on an hourly basis for each mesocosm. Often process-based models based on the physical processes that regulate energy, carbon and water fluxes are used to predict C fluxes (f.e. Lai, 2009). However, application of these models has some limitations due to the inherent complexity of the model structure and related parameters (Tramontana et al., 2015). Empirical models, and especially machine learning algorithms such as random forests, are increasingly employed to develop quantitative predictive models of C fluxes while giving more accurate predictions (Cutler et al., 2007). Therefore, we used random forests models trained with all the environmental variables and flux data recorded.
Random forests (RF) algorithm for regression trees creates successive and independent regression trees using bootstrap samples of the data (i.e., a random forest) to classify data and make predictions (Liaw and Wiener, 2002; Breiman, 2001; Cutler et al., 2007). We trained a RF model with different combinations of environmental variables (soil temperature, PAR, water table depth, and volumetric water content) for each flux data type (i.e., NEE, Reco and CH4; Supplementary Table S2). To get the best performing models, we iteratively tuned RF parameters in R using the randomForest package (Liaw and Wiener, 2002): number of trees to grow (“ntree”) and the number of predictor variables randomly sampled as candidate at each split (“mtry”) to determine the best predictor to split the response variable at each node. We further performed a 10-fold bootstrap resampling to test the performance and overfitting of the final model. For each fold, we created a bootstrap data set by randomly collecting observations from the original dataset with replacement. In other words, we repeatedly sampled data with replacement from the original training set in order to produce separate training sets. These sets were then used to allow the RF algorithm to reduce the variance of its prediction, thus greatly improving its predictive performance. We repeated this procedure 10 times and evaluated model performance using the root mean squared error (RMSE) and R2 values calculated from the results of the bootstrapping. RMSE measures the ability of the model to predict new data, and the result are easily interpretable as they are on the same scale as the original data. The R2 value describes the fit of the model to the data. The final RMSE and R2 values for the ensembled C fluxes are given in Supplementary Figure S3.
The final RF models tended to underestimate NEE, Reco, and CH4 fluxes at high flux rates (Supplementary Figure S4). Nevertheless, all models performed well in cross-validation and gave high predictive strengths (R2 > 0.9 for all fluxes). The final RF models were used to predict NEE, Reco, and CH4 fluxes per hour, during the resistance and resilience phases. Hourly flux rates for GPP were calculated as the difference between NEE and Reco, for day time hours, see Supplementary Figure S10 for daily averages. Finally, all hourly flux rates were summed to obtain cumulative fluxes for the resistance and resilience phases.
Data Analyses
Calculation Resilience Response
We quantified the resilience responses to rewetting during the resilience phase for DOC concentration, S250–465, CO2 and CH4 flux rates. It is recommended to express resilience responses relatively to a baseline or a control (Ingrisch and Bahn 2018). Since regime 2 most closely resembled the rainfall regime we observed at our field site (Figure 1), we took the regime 2 as a reference treatment to control for seasonal change. We calculated the resilience response per treatment (T) as the difference in observed values for measurements in week 11 (W11, end resistance phase) and 14 (W14, end resilience phase) proportional to the median of the change in the reference treatments (R):
Resulting response values that are > 1 express a larger increase (a greater capacity to “bounce back”) in the treatment compared to the reference regime, and vice versa.
Statistical Analyses
All numerical analyses were performed using R 3.6.1 (R Core Team 2019).
Differences in rainfall characteristics and vascular plant abundance between precipitation regimes were checked with separate generalized least squares (gls) models with regime as a fixed factor, using the nlme package (Pinheiro et al., 2016). Effects of the precipitation regimes on the WTD dynamics were tested with in separate linear-mixed effects (lme) models for the resistance and resilience phase, also using the nlme package. We used the square-root transformed WTD observations as a response variable, precipitation regime and sampling date and their interaction term as fixed factors, with mesocosm identity as a random factor to account for repeated measurements. Heterogeneity of variance between regimes was controlled by applying a varIdent variance structure (Zuur et al., 2010). We used the standard deviation (SD) of the WTD as an index for the WTD fluctuation and tested for differences between precipitation regimes with a gls model. Per mesocosm we calculated the mean and SD WTD during the resistance phase and used both as explanatory variables in subsequent analyses.
Prior to testing the responses, we verified whether the DOC concentration and quality (S254–465) and C gas fluxes were equal upon the start of the experiment, by running a linear model on the measurements of week 0 with precipitation regime as an explanatory variable (see Supplementary Tables S3, S4, Supplementary Figure S9). Since Reco values differed between regimes (F5,24 = 2.80, p = 0.0398) and GPP values differed marginally (F5,24 = 2.60, p = 0.052), we normalized the data for DOC concentration, S254–465, NEE, Reco, GPP, and CH4. For each pot, the difference between the observation (X0) and the overall mean (µ0) at week 0 was subtracted from all observations (Xn).
The normalized data, excluding data from week 0, were used for subsequent analysis described below.
Decomposition rates were analyzed for effects of precipitation regimes with a gls model as above. We also used separate gls models to test the relationship between decomposition rates and the mean and SD WTD. For all normalized DOC concentration and S254–465 observations we ran lme models with precipitation regime and sampling date and their interaction term as fixed factors, with mesocosm identity as a random factor. For both DOC concentration and S254–645 the models included a varIdent on regime to account for heteroscedasticity.
The normalized gas flux rates were likewise tested for effects of precipitation regime and sampling date with lme models. Data for the resistance and resilience phase were tested separately. First, we tested whether experiment location was a significant random factor in addition to mesocosm identity for the resistance phase observations, which was the case for Reco, and GPP (Supplementary Table S5). We used the CH4 flux rate observations from both the transparent and darkened chamber measurements and added date as an additional random factor to correct for repeated measurements. CH4 flux rates were ln transformed before analysis. A varIdent variance structure on sampling date was applied to all gas flux rate models on the resistance phase data and for the Reco model on the resilience phase data.
Cumulative fluxes (NEE, Reco, GPP, and CH4) were analyzed for effects of precipitation regime, mean, and SD WTD in separate gls models, for both the resistance and the resilience phase. Likewise, the resilience responses for all fluxes, DOC concentration and S254–465 were tested for effects of precipitation regime, mean and SD WTD with gls models. Models testing the resilience responses of CH4 and S254–465 were fitted including varIdent on precipitation regimes.
Parameters of all gls and lme models were estimated with restricted maximum likelihood (REML). Normality and homogeneity of all model residuals were verified through Kolmorgorov-Smirnov and Levene’s tests as well as diagnostic plots. Differences between precipitation regimes were inspected using Tukey post-hoc test. Variance explained by fixed factors (Rm2) and full mixed effects models (Rc2) were calculated according to Johnson (2014) using the MuMIn package (Barton, 2020). All graphs were made using the ggplot2 (Wickham, 2016), RColorBrewer (Neuwirth, 2014) and cowplot (Wilke, 2019) packages.
Results
Experimental Conditions
Throughout the resistance phase the mesocosms received approximately the same amount of rainfall (145–159 mm), except for the most extreme regime, regime 6 (125 mm). Although this was part of the design to avoid overflowing of the pots, the difference was significant (Supplementary Figure S2; F5,30 = 4.24, p = 0.007). As planned the regimes differed significantly in rain frequency (F5,24 = 98.49, p < 0.0001), rain intensity (F5,24 = 56.01, p < 0.0001) and drought intensity (F5,24 = 62.36, p < 0.0001) (Figure 1). The vascular plant abundance that had developed during the resistance phase did not differ between regimes (Supplementary Table S6).
The experimental rainfall patterns during the resistance phase lead to a temporal differences in WTD (Time: F1,1370 = 75.49, p < 0.0001). While the WTD differed between regimes over time (Regime*Time: F5,1370 = 8.80, p < 0.0001), the overall differences between regimes were not significant (Regime: F5,1370 = 0.92, p = 0.48). We further inspected the WTD dynamics and found that the standard deviation (SD) of WTD per mesocosm (on average 2.2 cm), differed significantly between precipitation regimes (F5,24 = 4.975, p = 0.0029), indicating that the mesocosms underwent WTD fluctuations with different intensities. Therein, regimes 3 and 6 had highest SD WTD values (Figure 2C).
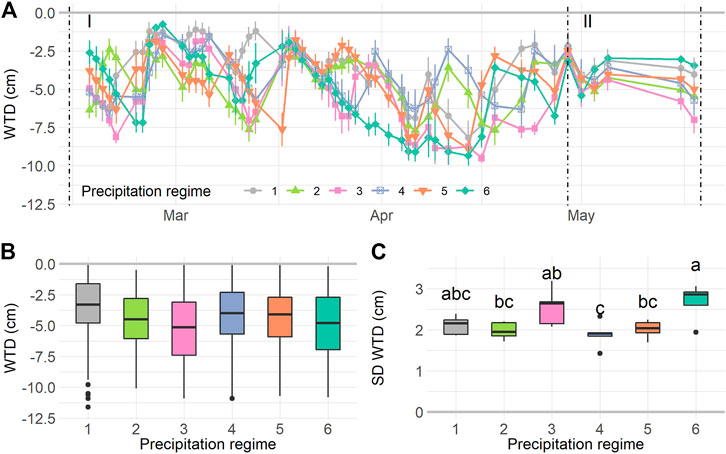
FIGURE 2. Water table depth (WTD) dynamics during the experiment. WTD over time (A) during the resilience phase (I) and resistance phase (II). For the resilience phase boxplots are given for mean WTD (B) and standard deviation of the WTD (C) per precipitation regime. Values in A are means ± SE, n = 1,560. In B: n = 1,410, in C: n = 30. Letters in C indicate significant differences (p < 0.05) based on Tukey post-hoc test. For details on precipitation regimes, please see Figure 1.
During the resilience phase WTD was kept more or less constant, although a temporal trend was still significant (Time: F1,114 = 8.65, p = 0.004) and differed between regimes (Regime*Time: F5,114 = 6.37, p < 0.0001). No overall differences between precipitation regimes were found (Regime: F5,114 = 1.00, p = 0.44, Supplementary Figure S5A). Notably, the WTD fluctuation during the resilience phase was small compared to the resistance phase (SD on average 0.94 cm), and the SD WTD did not differ between regimes (Supplementary Figure S5B).
Carbon Dynamics
Decomposition Rate
Graminoid litter lost between 2–22% of its mass during the 11 weeks of incubation in the mesocosms. This equated to values for the decomposition rate constant k varying between 0.00026–0.00328 days−1 (Figure 3, Supplementary Figure S6). Although the decomposition rates did not significantly differ between precipitation regimes (F5,24 = 1.14; p = 0.366), it significantly decreased along with the mean WTD (F1,28 = 7.01, p = 0.0132, Radj2 = 0.17), and increased with the SD WTD (F1,28 = 12.05, p = 0.0017, Radj2 = 0.28), respectively. In other words, decomposition was faster in mesocosms with a deeper mean WTD and a high SD WTD (Figure 3).
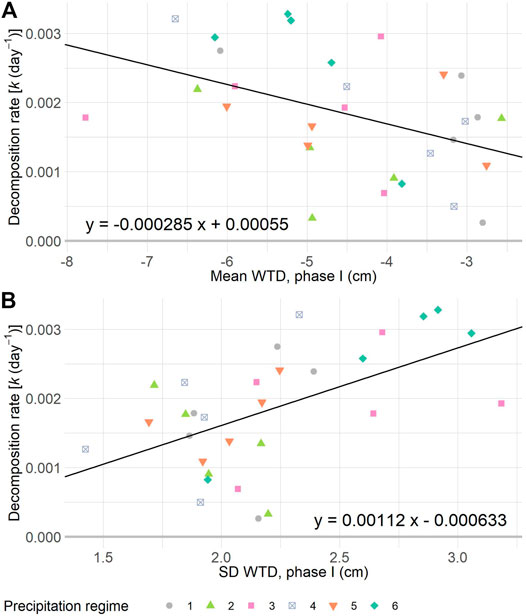
FIGURE 3. Decomposition rate constant k of graminoid litter plotted against the mean WTD (A) and standard deviation (SD) of the WTD (B) per mesocosm, during one of six precipitation regimes. Shown regression lines are significant at p < 0.05. In A: R2adj = 0.17, in B: R2adj = 0.28. For details on precipitation regimes, please see Figure 1.
Dissolved Organic Carbon
The concentration of DOC in the porewater of the mesocosms increased over time (F1,53 = 38.34 p < 0.0001). The normalized DOC concentration initially increased, then leveled off during the resistance phase, and increased again during the resilience phase (Figure 4A), with normalized values ranging from 32.78 ± 0 mg C L−1 at the start of the experiment, to a mean of 49.94 ± 2.78 mg C L−1 at the final sampling date. There were no overall differences in DOC concentration between precipitation regimes (F5,53 = 1.02, p = 0.426), nor did the temporal increase vary between precipitation regimes (Time * Regime: F5,53 = 1.43, p = 0.228). Values for S254–465 became more negative as time progressed (F1,54 = 13.03, p = 0.0007, Figure 4B), ranging from −0.012 ± 0 to −0.014 ± 0.0004 nm−1 from the start to end of the experiment. We did not find significant differences between precipitation regimes (F5,54 = 1.65, p = 0.186) nor was the interaction term significant (F5,54 = 0.81, p = 0.547). Variance explained by fixed factors (Rm2) and full model (Rc2) for DOC concentration was: Rm2 = 0.24 Rc2 = 0.89; and for S254-465: Rm2 = 0.19, Rc2 = 0.56.
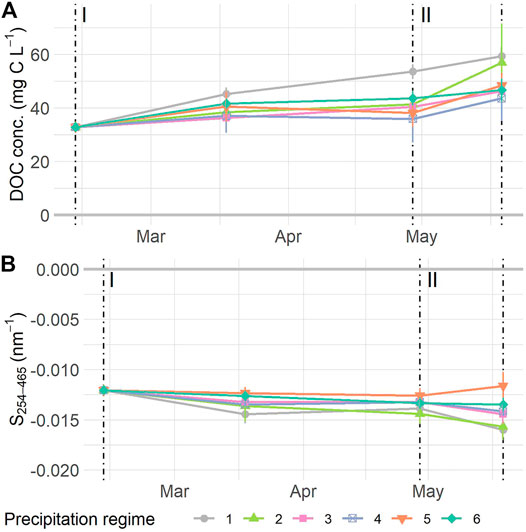
FIGURE 4. Normalized dissolved organic carbon (DOC) concentration (A) and S254–465(B) measured at the start and middle of the resistance phase (I), the transition to and the end of the resilience phase (II). Values are means ± SE. A: n = 118, B: n = 114. For details on precipitation regimes, please see Figure 1. NOTE: data depicted have been normalized, see Supplementary Figure S7 for uncorrected data.
The resilience responses of DOC indicators did not differ between precipitation regimes, neither for DOC concentration nor S254–465. Resilience responses of DOC concentration did not relate to the WTD dynamics either. However, the S254–465 resilience responses displayed a significant positive relationship to the mean WTD (F1,23 = 11.31, p = 0.0027) (Supplementary Figure S8E) and related negatively to the SD WTD (F1,23 = 10.16, p = 0.0041, Supplementary Figure S8F).
CO2 and CH4 flux Rates
During the resistance phase, gas flux rates varied over time with (near) significant influence of precipitation regimes (Table 2). Normalized NEE rates became more negative as time progressed, except for precipitation regimes 1 and 4 as indicated by the significant interaction term. Reco values displayed a significant temporal effect and overall differences between regimes (Figure 5B, Supplementary Figure S11C). Specifically, Reco gradually increased over time, with higher respiration rates as precipitation regimes got more intense and displayed a significant increase of 55.5% between regimes 1 (mean Reco 198.94 mg CO2 m−2 h−1) and 5 (mean Reco = 309.45 mg CO2 m−2 h−1). Because Reco peaked mid-march (week 4, Figure 5B), we ran the same analysis without the week 4 measurements. After removing the peak, the results were similar with an overall effect of time (F1,201 = 25.33, p < 0.0001) and differences between precipitation regimes (F5,201 = 2.42, p = 0.0475) but no interaction between regime and time (F5,201 = 0.87, p = 0.504). GPP rates decreased with time with marginal significant differences between precipitation regimes, but the interaction term (Time * Regimes) was not significant. CO2 uptake rates tended to be stronger the more extreme the precipitation regime became, with largest differences between regime 1 and 5 (Supplementary Figure S11E). CH4 flux rates showed a significant interaction between time and precipitation regimes, along with a significant overall effect of time. CH4 fluxes increased gradually during the resistance phase in most precipitation regimes except in regime 6, where the flux rates decreased by 49.7% from 144.40 to 72.61 µg CH4 m−2 h−1 (Table 2; Figure 5D).
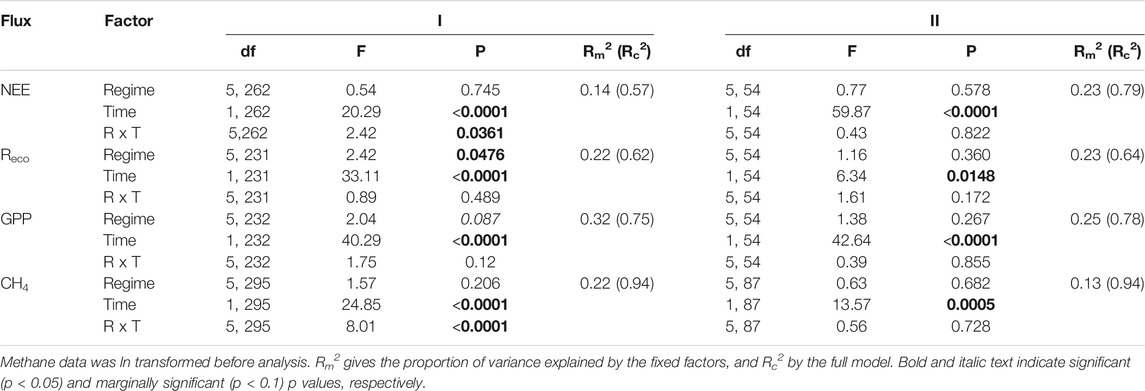
TABLE 2. Outcome of linear mixed effects models testing the influence of precipitation regime (Regime, R) and sampling date (Time, T) on rates of net ecosystem exchange (NEE), ecosystem respiration (Reco), gross primary productivity GPP), and methane (CH4), during the resistance phase (I, week 1–10), and resilience phase (II, week 10–14).
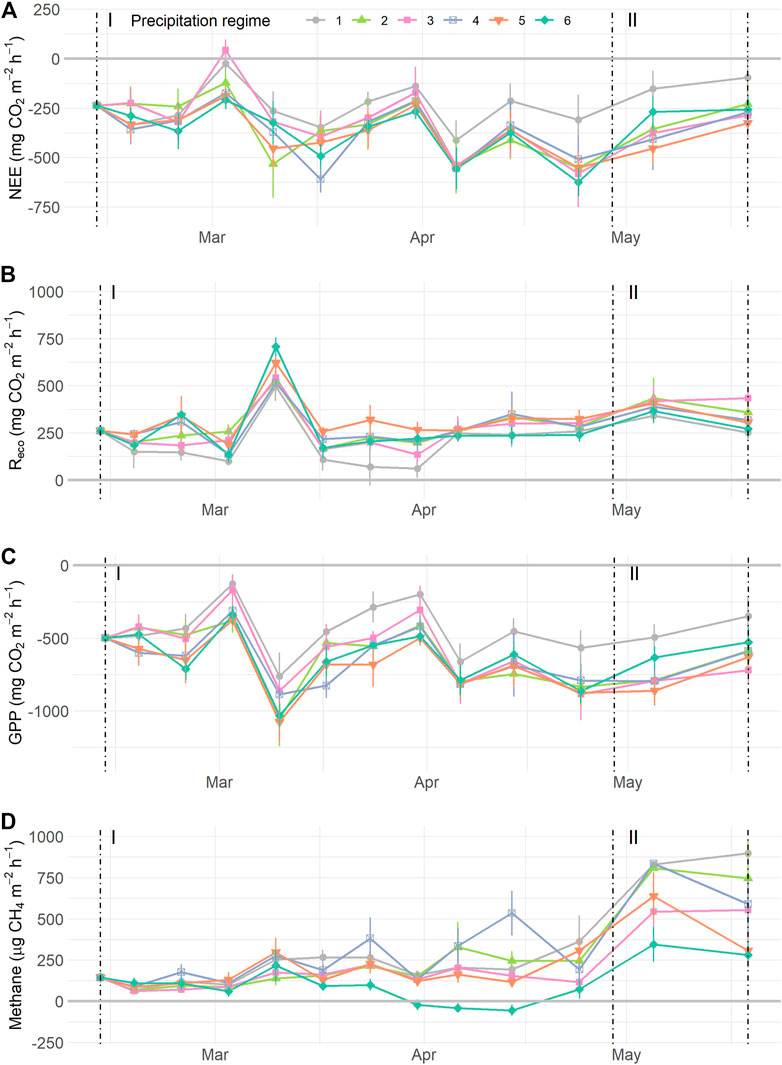
FIGURE 5. Normalized carbon flux dynamics during the resistance phase (I) and resilience phase (II): (A) net ecosystem exchange (NEE) of CO2, (B) ecosystem respiration (Reco), (C) gross primary production (GPP), and (D) methane (CH4), grouped by precipitation regimes as indicated by symbols and colours. Values are means ± SE. In panels (A–C), n = 420; in (D) n = 780. For details on precipitation regimes, please see Figure 1. NOTE: data depicted have been normalized, see Supplementary Figure S9 for uncorrected data.
Gas flux rates measured during the resilience phase all increased over time (Table 2; Figure 5). Yet, none of the fluxes showed significant differences between regimes, neither as main effect nor in interaction with time. The resilience response of the CO2 fluxes did not differ between precipitation regimes. The resilience response of CH4, however, tended to differ between regimes (F4,43 = 2.24, p = 0.080) with a smaller increase in CH4 flux rates for regime 5 compared to regime 2 (e.g. resilience < 1, Supplementary Figure S12D). Moreover, the resilience responses for NEE, Reco, and CH4 did not relate to the earlier WTD dynamics during the resistance phase, whereas the resilience response of GPP tended to relate negatively to the mean WTD of the mesocosms during the resistance phase (F1,23 = 3.25, p = 0.085, Supplementary Figure S12).
Cumulative CO2 and CH4 fluxes
The total uptake and release of CO2 and CH4 during the resistance phase related to the experimental WTD dynamics but did not differ significantly between precipitation regimes (Figure 6; Table 3). Most mesocosms released more CO2 than they took up, as shown by the positive NEE values (Figure 6A). Particularly, mesocosm which underwent little change in WTD (measured as SD WTD) emitted most CO2. The underlying fluxes, namely Reco and GPP, related to mean WTD (Table 3). Mesocosms with a deep mean WTD respired more CO2 than mesocosms with a shallow mean WTD, yet CO2 uptake was also higher at deep mean WTD than at shallow mean WTD (Figures 6C,E). Likewise, CH4 emissions were positively related to mean WTD, with highest emissions at shallow mean WTD (Figure 6G).
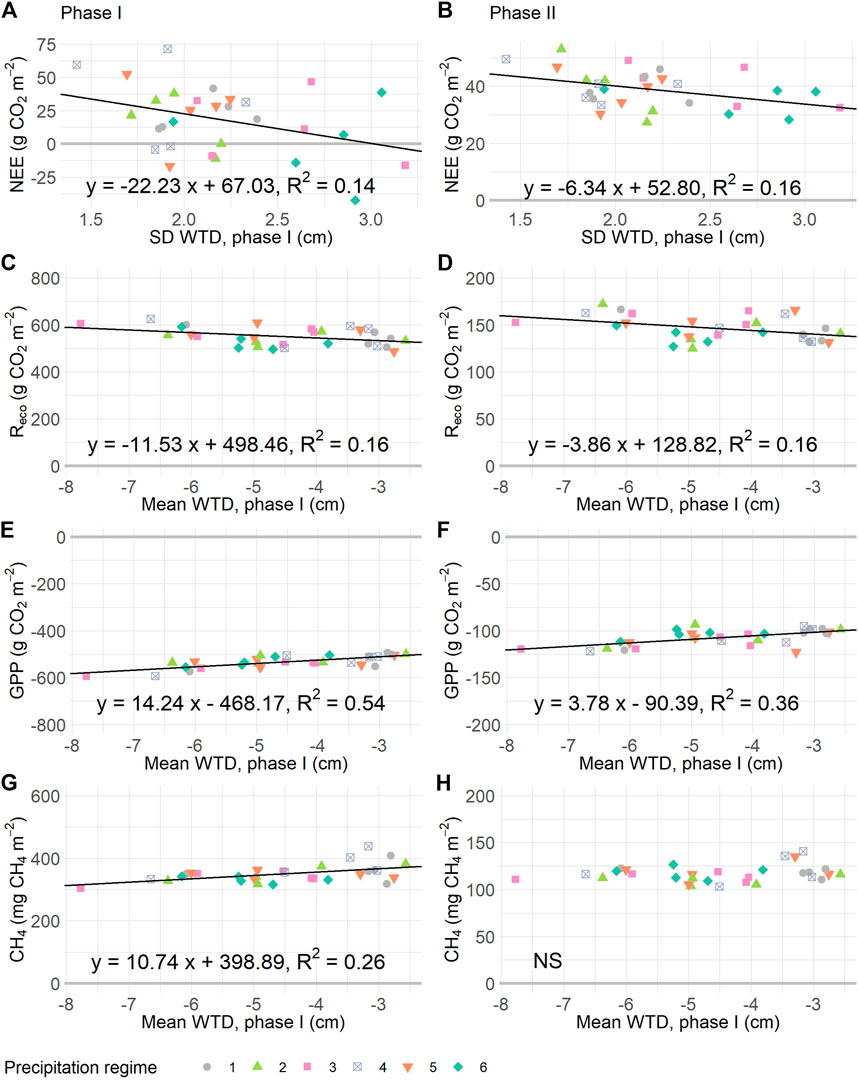
FIGURE 6. Relationships between cumulative gas fluxes during the resistance (I, panels A, C, E, G) and resilience (II, panels B, D, F, H) phases, and the WTD dynamics of the resistance phase. Panels (A), (B): net ecosystem exchange (NEE) is explained by the standard deviation water table depth (SD WTD). In (C), (D) ecosystem respiration (Reco) is plotted against WTD mean, as are gross primary production (GPP, in E and F) and methane (CH4, in G and H). Drawn relationships are significant at p < 0.05, based on linear regressions given in Table 3. For details on precipitation regimes, please see Figure 1.
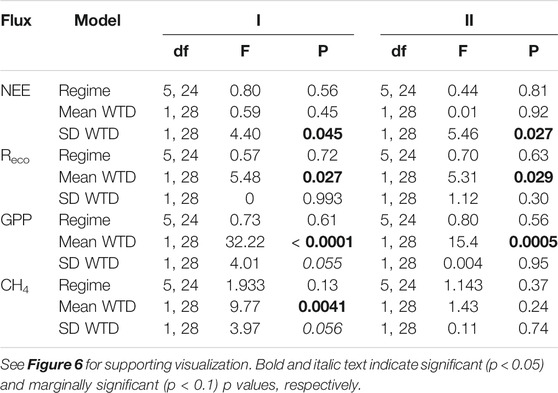
TABLE 3. Outcome of separate linear regression models testing the influence of precipitation regime (Regime), WTD mean or SD (measured during phase I) on cumulative net ecosystem exchange (NEE), ecosystem respiration (Reco), gross primary productivity (GPP), and methane (CH4) during the resistance phase (I, week 0–10), and resilience phase (II, week 10–14).
For the resilience phase, comparable relationships between CO2 exchange and WTD dynamics were found. In other words, the WTD dynamics of mesocosms under the experimental precipitation regimes were predictive of the CO2 dynamics when WTD dynamics were restored to pre-experimental conditions. Thus, mesocosms which underwent little variation in WTD (SD WTD) had a more positive overall CO2 balance during resilience phase compared to mesocosms for which a high SD WTD was measured in the resistance phase. However, the relationship between mean WTD and CH4 emission was not significant for the resilience phase; all mesocosm emitted 100–150 mg CH4 during this three-week period.
Discussion
Precipitation regimes are becoming more extreme, as is currently observed (Knapp et al., 2008; Lehmann et al., 2015) and predicted by climate models (Dai, 2013; Fischer and Knutti, 2016). While the consequences of deeper water levels on peatland C dynamics are relatively well known (Dise, 2009; Page and Baird, 2016), the relationship between peatland water table dynamics and carbon cycling under shifting rainfall patterns is not. We aimed to explore how changes in water table depth (WTD) dynamics (overall mean and fluctuations) in response to more extreme precipitation regimes affects peatland C dynamics. By exposing intact peat cores to approximately the same amount of rain but according to increasingly extreme patterns, we found that C uptake (GPP), decomposition rate of graminoid litter and C loss (DOC, Reco, and CH4) all relate to the altered WTD dynamics induced by the altered rainfall patterns. Most importantly, we showed that extreme rainfall early in the growing season had lasting effects on CO2 exchange in our mesocosms, while the effects on CH4 emission diminished quickly after restoration of the WTD dynamics. The limited depth of the mesocosms meant that hydrological conditions during the experiment could have been more extreme than under field conditions and the results represent amplified responses. Under natural conditions hydraulic lift and biological activity from deeper layers would contribute to the overall response. Nevertheless, WTD changes in the top 10 cm are considered relevant for peatland C dynamics (Evans et al., 2021). Our findings highlight the importance of WTD fluctuations under shifting rainfall patterns in addition to mean WTD in driving peatland C dynamics, and that short-term changes in conditions may have lasting effects.
Carbon Uptake Under Extreme Precipitation
Besides a general increase in C uptake as the growing season progressed (Figure 5), we found a near significant difference between precipitation regimes with higher uptake rates under the more extreme precipitation regime 5 than 1. In addition, cumulative C uptake (GPP) was found to be increased with deeper mean WTD (Figure 6), and tended to be higher with larger WTD fluctuations. Our findings contrast with those of Nijp et al. (2014) who showed that photosynthesis efficiency and CO2 uptake in Sphagnum is most efficient at high moisture content and can decline steeply as the volumetric moisture content decreases (Nijp et al., 2014). While high volumetric moisture content benefits Sphagnum photosynthesis, vascular plants benefit from increased aeration of the peat profile (Breeuwer et al., 2009; Jassey et al., 2018). A decrease of rainfall frequency in a field experiment resulted in reduced C uptake by Sphagnum dominated peat, while C uptake in vascular plant dominated peat increased (Radu and Duval, 2018b). Therefore, the observed negative relationship between GPP and mean WTD is most likely caused by increased performance of vascular plants. This could be experimentally verified by monitoring the plant photosynthetic activity and biomass more closely in future studies.
Upon rewetting, C uptake rates slowed down as GPP became less negative during the resilience phase. This resilience response was similar for all precipitation regimes. As a consequence, the cumulative C uptake during the resilience phase could still be predicted by the mean WTD of the peat cores during the resistance phase. These observations fit with our supposition that vascular plants grew better under extreme precipitation. Indeed, altered vascular plant growth during spring affected carbon uptake later in the growing season under field conditions (Lund et al., 2012; Helfter et al., 2015).
Moreover, the reduction in C uptake rates upon rewetting could have been dampened by the capacity of Sphagnum to recover quickly from drying. Jassey and Signarbieux (2019) found that Sphagnum photosynthetic activity can recover from droughts within an hour after rewetting. Although this shows that peatland functioning can bounce back from extreme meteorological conditions, repeated restarting of the photosynthetic pathway after droughts when rainfall frequency is low could come at the cost of increased autotrophic respiration (McNeil and Waddington, 2003; Nijp et al., 2014, 2015). We further note that under natural circumstances rain coincides with cloud cover and temporally limit photosynthesis. This could act as a secondary mechanism by which reduced rainfall frequency translates to reduced cloud cover and increased evapotranspiration thereby influencing peatland carbon dynamics (Nijp et al., 2015; Dai et al., 2018).
Carbon Loss Under Extreme Precipitation
Litter Decomposition
We found that graminoid litter mass loss varied between 2–22% during the resistance phase, and most importantly, that both the mean and fluctuation of the WTD explained this variation (Figure 3). These results suggest that intense rain interspersed with long dry intervals promote decomposition in peatlands. We inserted our litterbags just below the overall WTD (−4.49 cm). This finding agrees with previous studies which showed that decomposition in peatlands is optimal in the zone of water table fluctuation (Belyea, 1996; Belyea and Clymo, 2001). The graminoid litter we utilized represents recently senesced plant material entering the pool of organic matter. In general, the young organic C deposited in the acrotelm (surface layer of peat) has a higher potential to be lost by decomposition than older organic C in the deeper catotelm (Belyea 1996; Ise et al., 2008). Taken together, WTD fluctuations at the level of the acrotelm are likely to have more profound consequences than further draw down of the water table into the catotelm (Ise et al., 2008). Our results signify the sensitivity of C stored in the acrotelm to potential loss as a consequence of shift in rainfall patterns (Knapp et al., 2008; Leifeld and Menichetti, 2018).
Altered WTD dynamics could also have influenced decomposition indirectly. Increasing decomposition rates was concomitant with increasing photosynthetic C uptake (GPP). As photosynthesis and root exudation are strongly linked (Kuzyakov and Cheng, 2001), plant exudates may have influenced decomposition of organic matter by catalyzing degradation of organic molecules, triggering nutrient competition or even preferential substrate utilization by decomposers (Kuzyakov, 2010; Dijkstra et al., 2013; Saar et al., 2016; Barel et al., 2019). Indeed, vascular plants have been shown to promote C loss through increase heterotrophic respiration and enhance decomposition of peat carbon due to rhizosphere priming (Gavazov et al., 2018). Further studies are however necessary to establish whether these indirect drivers play a role in decomposition on relatively short time-frames of 3 months in peatlands.
Dissolved Organic Carbon
C lost from peatlands as DOC can reach 1–50 g m−2 y−1 and represent up to 64% of organic C in streams (Blodau, 2002; Rosset et al., 2019). DOC concentrations observed in our mesocosms (19.47–88.23 mg C L−1) approximated earlier observations at the same field site in June 2018 (22.91–65.20 mg C L−1) and fall within in the range (20–60 mg C L−1) of concentrations reported for northern peatlands (Blodau, 2002). We observed a seasonal increase in DOC concentration. DOC concentrations are often found to increase with temperature as a consequence of increased microbial and vegetation activity (Blodau, 2002; Pastor et al., 2003; Rosset et al., 2019). Moreover, C loss by stream export varies seasonally which has been attributed to seasonal variation in hydrological and biological processes in addition to streamflow and run-off after heavy rain (Leach et al., 2016). However, we found no indication that shifts in precipitation patterns affected the DOC concentration. Yet, the limited size of our mesocosms could have excluded mechanisms from occurring that play a role in natural DOC flows, such as the release of DOC from deeper peat layers.
Additionally, we observed a seasonal decrease in S254–645, indicating a decrease in low molecular weight compounds and/or increase in aromaticity (Hansen et al., 2016). Which is in line with long-term field observations that demonstrated an increase in DOC aromaticity during spring (Leach et al., 2016). The resilience response of S254–645 values continued to decrease in the reference precipitation regime (regime 2), whereas mesocosms exposed to more extreme rainfall patterns did not display a decrease in S254–465 values or to a lesser extent. As high molecular weight and aromatic compounds are presumably hard to break-down by microbial decomposers (Kalbitz et al., 2003; Cotrufo et al., 2013), these results could reflect the preferential break-down of low molecular weight/non-aromatic compounds under a normal compared to extreme precipitation regimes, regardless of differences in DOC concentration.
Ecosystem Respiration and Net Ecosystem Exchange
Besides a seasonal increase, CO2 respiration rates differed significantly between precipitation regimes, with lowest Reco values for the least extreme regime (regime 1) and highest respiration under extreme precipitation (regime 5). Based on this observation we would have expected a relationship between cumulative Reco and WTD fluctuation, but there was not. Field observations demonstrated that Reco flux rates are less responsive to WTD dynamics than GPP and NEE rates, because Reco is the combined result of autotrophic and heterotrophic respiration (Olefeldt et al., 2017). However, we did find a significant relationship of increased cumulative Reco at deeper mean WTD during the resistance phase. This relationship follows the earlier relationships of increased heterotrophic (decomposition) and autotrophic (GPP) activity with deeper WTD.
Responses of overall CO2 exchange (NEE) to the precipitation treatments reflected the observations in GPP and Reco. The seasonal increase in the CO2 sink function (negative NEE rates) was stronger under extreme precipitation than the least extreme regimes. This significant interaction between time and precipitation regime echoes the differences between precipitation treatments observed in Reco and GPP flux rates. When inspecting the cumulative NEE responses, mesocosms with increasing WTD fluctuations became a weaker source of CO2, even becoming a sink when WTD had a standard deviation of more than 3 cm, which represents the tendency for cumulative GPP to be controlled by SD WTD in a similar manner. Increased CO2 uptake, as we found under extreme precipitation, could signal a long-term change in peatland ecology. Notably, repeated exposure of peatlands to extreme rainfall and drought is likely to trigger vascular plant encroachment (Buttler et al., 2015; Dieleman et al., 2015; Jassey et al., 2018; Lamentowicz et al., 2019) with cascading effects on overall ecosystem functioning (Bardgett et al., 2013; Dieleman et al., 2015; Jassey et al., 2018). The fact that we found no significant relationship between cumulative NEE and mean WTD stresses the importance to include a measure of WTD fluctuation as a potential controlling factor in peatland studies researching hydrological effects on peatland carbon dynamics, in addition to the average WTD.
During the resilience phase, CO2 uptake rates lessened while respiration rates rose slightly and resulted in a rise in NEE rates. Moreover, the relationship between NEE and the WTD fluctuation observed during the resistance phase was still measurable during the resilience phase, as were the relationships between cumulative Reco and GPP values and the mean WTD. These lagged effects indicate that exposure to extreme precipitation early in the growing season may have prolonged effects on ecosystem functioning, even if meteorological conditions return to normal (Frank et al., 2015).
Methane Emissions
The evolution of CH4 flux over time differed between precipitation regimes (Table 2). In particular, CH4 emissions were low in mesocosms exposed to the most extreme precipitation regime (regime 6). The limited CH4 emission of these mesocosms in the second half of the resistance phase (April) coincided with an extended period without rainfall resulting in deeper WTD (Figures 2, 5). This link between WTD dynamics and CH4 emission is further evidenced by the positive relationship between cumulative CH4 flux and the mean WTD during the resistance phase (Figure 6).
However, these results should be interpreted with some caution. Our overall measured average CH4 flux rate of 162.2 μg m−2 hr−1 during the resistance phase, and 482.1 μg m−2 hr−1 during the resilience phase fall in the low end of the reported range (5–80 mg m−2 d−1) of rates in peatlands under field conditions (Blodau, 2002), probably because of the limited depth of our mesocosms. Under field conditions, CH4 production in deeper peat layers would contribute to overall emissions, while hydraulic lift could maintain moisture content in the peat surface layer under dry conditions. Interestingly, our findings contrast those from Radu and Duval (2018a). They found that more extreme regimes increased CH4 emission overall and stipulated that rainfall oscillations stimulated the build-up of labile substrate as result of aerobe respiration, which upon repeated rewetting boost CH4 production. Our S254–465 values for DOC indicate no such build-up, while the near-significant relationship of lower cumulative CH4 emission with increased WTD fluctuation imply a reduction of CH4 emission at more extreme precipitation. Instead, our findings are similar to patterns observed in other studies. WTD is a well-recognized driver of CH4 emissions (Bubier et al., 1994; Updegraff et al., 2001; Blodau et al., 2004; Turetsky et al., 2014; Riutta et al., 2020). Shallow WTD promote CH4 emissions because methanogenesis requires anaerobic conditions, while deep WTD increases the portion of aerated surface peat accommodating consumption of CH4 by methanotrophs as it diffuses toward the atmosphere (Bubier et al., 1994; Sundh et al., 1995).
Drying and rewetting of peat may lead to pulses of substrate and nutrients stimulating CH4 emissions (Turetsky et al., 2014). Recently, Huth et al. (2018) observed a strong CH4 increase after heavy precipitation in a German fen. We observed that rewetting during the resilience phase led to a steep increase in CH4 flux rates compared to the resistance phase which tended to be restricted in the more extreme precipitation treatments. Although these results indicate that more extreme rainfall reduces the CH4 emissions from peatlands, the contrasting results from Radu and Duval (2018a) and the variable rewetting responses between peatland types (Turetsky et al., 2014) make further investigation of gas flux responses to shifting rainfall across peatland types under field conditions advisable.
Synthesis
In summary, our results imply that shifts in precipitation patterns early in the growing season are likely to influence peatland C dynamics. In our mesocosm study, increased water table fluctuations induced by shifting rainfall patterns reduced overall C emission from peatlands, whereby a deeper overall water table improved CO2 uptake more than it increased ecosystem respiration, and reduced CH4 emissions. Despite the limitations of our mesocosm study, our findings are in line with observations under field conditions (Radu and Duval, 2018b). Although it may seem promising that precipitation shifts increase carbon uptake, this conclusion should be treated with caution as this may signal an increased dominance of vascular plants that could off-set peatland carbon dynamics on the long-term. Our findings further showed that extreme precipitation early in the growing season can invoke changes in CO2 fluxes that last beyond the period of altered precipitation. Therefore, in order to fully understand the consequences of shifting precipitation patterns for the capacity of peatlands to sequester carbon, the fluctuations in the water table have to be considered as a driving factor and both the immediate and lagged effects on peatland carbon dynamics should be taken into account.
Data Availability Statement
The data supporting the conclusions of this article are available at 10.6084/m9.figshare.c.5468205.
Author Contributions
JB and VJ conceived the experiment. SH collected the intact peat cores in the field. VM and VJ executed the experiment with support of JB, AS, and SH. JB, VM, and VJ analyzed the data. JB wrote the manuscript together with VJ to which all other authors contributed.
Funding
This work was funded by the French National Research Agency (MIXOPEAT project, grant no. ANR-17-CE01-0007 to VJ) and Fondation pour la Recherche sur la Biodiversité which acted in cooperation with the French Agency for Biodiversity (AFB), and its partners (FRB-www.fondationbiodiversite.fr).
Conflict of Interest
The authors declare that the research was conducted in the absence of any commercial or financial relationships that could be construed as a potential conflict of interest.
Acknowledgments
We thank the Plateforme Analyses Physico-Chimiques from the Laboratoire Ecologie Fonctionnelle et Environnement (Toulouse) for their analyses of dissolved organic carbon. We further thank Laure Gandois for insightful discussions, and the reviewers for their constructive feedback.
Supplementary Material
The Supplementary Material for this article can be found online at: https://www.frontiersin.org/articles/10.3389/fenvs.2021.659953/full#supplementary-material
References
Adkinson, A. C., and Humphreys, E. R. (2011). The Response of Carbon Dioxide Exchange to Manipulations of Sphagnum Water Content in an Ombrotrophic Bog. Ecohydrol. 4 (6), 733–743. doi:10.1002/eco.171
Bardgett, R. D., Manning, P., Morriën, E., and De Vries, F. T. (2013). Hierarchical Responses of Plant-Soil Interactions to Climate Change: Consequences for the Global Carbon Cycle. J. Ecol. 101 (2), 334–343. doi:10.1111/1365-2745.12043
Barel, J. M., Kuyper, T. W., de Boer, W., and De Deyn, G. B. (2019). Plant Presence Reduces Root and Shoot Litter Decomposition Rates of Crops and Wild Relatives. Plant Soil 438, 313–327. doi:10.1007/s11104-019-03981-7
Barton, K. (2020). “MuMIn: Multi-Model Inference.”, R Package version 1.43.17. Available at: https://cran.r-project.org/package=MuMIn
Belyea, L. R., and Clymo, R. S. (2001). Feedback Control of the Rate of Peat Formation. Proc. R. Soc. Lond. B 268 (1473), 1315–1321. doi:10.1098/rspb.2001.1665
Belyea, L. R. (1996). Separating the Effects of Litter Quality and Microenvironment on Decomposition Rates in a Patterned Peatland. Oikos 77 (3), 529. doi:10.2307/3545942
Blodau, C., Basiliko, N., and Moore, T. R. (2004). Carbon Turnover in Peatland Mesocosms Exposed to Different Water Table Levels. Biogeochemistry 67 (3), 331–351. doi:10.1023/B:BIOG.0000015788.30164.e2
Blodau, C. (2002). Carbon Cycling in Peatlands - A Review of Processes and Controls. Environ. Rev. 10 (2), 111–134. doi:10.1139/a02-004
Blodau, C., and Moore, T. R. (2003). Experimental Response of Peatland Carbon Dynamics to a Water Table Fluctuation. Aquat. Sci. - Res. Across Boundaries 65, 47–62. doi:10.1007/s000270300004
Breeuwer, A., Robroek, B. J. M., Limpens, J., Heijmans, M. M. P. D., Schouten, M. G. C., Berendse, F., et al. (2009). Decreased Summer Water Table Depth Affects Peatland Vegetation. Basic Appl. Ecol. 10 (4), 330–339. doi:10.1016/j.baae.2008.05.005
Bubier, J. L., and Moore, T. R. (1994). An Ecological Perspective on Methane Emissions from Northern Wetlands. Trends Ecol. Evol. 9 (12), 460–464. doi:10.1016/0169-5347(94)90309-3
Bubier, J. L., Moore, T. R., Bubier, J., and Moore, T. (1994). An Ecological Perspective on Methane Emissions from Northern Wetlands. Trends Ecol. Evol. 9 (12), 460–464. doi:10.1016/0169-5347(94)90309-3
Buttler, A., Robroek, B. J. M., Laggoun-Défarge, F., Jassey, V. E. J., Pochelon, C., Bernard, G., et al. (2015). Experimental Warming Interacts with Soil Moisture to Discriminate Plant Responses in an Ombrotrophic Peatland. J. Veg Sci. 26 (5), 964–974. doi:10.1111/jvs.12296
Cornelissen, J. H. C. (1996). An Experimental Comparison of Leaf Decomposition Rates in a Wide Range of Temperate Plant Species and Types. J. Ecol. 84 (4), 573. doi:10.2307/2261479
Cotrufo, M. F., Wallenstein, M. D., Boot, C. M., Denef, K., Paul, E., and Paul, Eldor. (2013). The Microbial Efficiency-Matrix Stabilization (MEMS) Framework Integrates Plant Litter Decomposition with Soil Organic Matter Stabilization: Do Labile Plant Inputs Form Stable Soil Organic Matter? Glob. Change Biol. 19 (4), 988–995. doi:10.1111/gcb.12113
Cutler, D. R., Edwards, T. C., Beard, K. H., Cutler, A., Hess, K. T., Gibson, J., et al. (2007). Random Forests for Classification in Ecology. Ecology 88 (11), 2783–2792. doi:10.1890/07-0539.1
Dai, A. (2013). Increasing Drought under Global Warming in Observations and Models. Nat. Clim Change 3 (1), 52–58. doi:10.1038/nclimate1633
Dai, A., Zhao, T., and Chen, J. (2018). Climate Change and Drought: A Precipitation and Evaporation Perspective. Curr. Clim. Change Rep. 4 (3), 301–312. doi:10.1007/s40641-018-0101-6
Dieleman, C. M., Branfireun, B. A., Mclaughlin, J. W., and Lindo, Z. (2015). Climate Change Drives a Shift in Peatland Ecosystem Plant Community: Implications for Ecosystem Function and Stability. Glob. Change Biol. 21 (1), 388–395. doi:10.1111/gcb.12643
Dijkstra, F. A., Carrillo, Y., Pendall, E., and Morgan, J. A. (2013). Rhizosphere Priming: A Nutrient Perspective. Front. Microbiol. 4 (216), 1–8. doi:10.3389/fmicb.2013.00216
Dise, N. B. (2009). Peatland Response to Global Change. Science 326 (5954), 810–811. doi:10.1126/science.1174268
Evans, C. D., Peacock, M., Baird, A. J., Artz, R. R. E., Burden, A., Callaghan, N., et al. (2021). Overriding Water Table Control on Managed Peatland Greenhouse Gas Emissions. Nature 593 (7860), 16. doi:10.1038/s41586-021-03523-1
Fischer, E. M., and Knutti, R. (2016). Observed Heavy Precipitation Increase Confirms Theory and Early Models. Nat. Clim Change 6 (11), 986–991. doi:10.1038/nclimate3110
Frank, D., Reichstein, M., Bahn, M., Thonicke, K., Frank, D., Mahecha, M. D., et al. (2015). Effects of Climate Extremes on the Terrestrial Carbon Cycle: Concepts, Processes and Potential Future Impacts. Glob. Change Biol. Blackwell Publishing Ltd 21, 2861–2880. doi:10.1111/gcb.12916
Fuss, R. (2020). “Gasfluxes: Greenhouse Gas Flux Calculation from Chamber Measurements.”, R Package Version 0, 4. Available at: https://cran.r-project.org/package=gasfluxes
Garrels, R. M., and Christ, C. L. (1965). Minerals, Solutions, and Equilibria. New York: Harper & Row, 450
Gavazov, K. A. Buttler., Albrecht, R., Buttler, A., Dorrepaal, E., Garnett, M. H., Gogo, S., et al. (2018). Vascular Plant-Mediated Controls on Atmospheric Carbon Assimilation and Peat Carbon Decomposition under Climate Change. Glob. Change Biol. 24 (9), 3911–3921. doi:10.1111/gcb.14140
Gerten, D., Luo, Y., Le Maire, G., Parton, W. J., Keough, C., Weng, E., et al. (2008). Modelled Effects of Precipitation on Ecosystem Carbon and Water Dynamics in Different Climatic Zones. Glob. Change Biol. 14 (10), 2365–2379. doi:10.1111/j.1365-2486.2008.01651.x
Hamard, S., Robroek, B. J. M., Allard, P.-M., Signarbieux, C., Zhou, S., Saesong, T., et al. (2019). Pierre Marie Allard, Constant Signarbieux, Shuaizhen Zhou, Tongchai Saesong, Flore de Baaker, et al.Effects of Sphagnum Leachate on Competitive Sphagnum Microbiome Depend on Species and Time. Front. Microbiol. 10 (September), 2042. doi:10.3389/fmicb.2019.02042
Hansen, A. M., Kraus, T. E. C., Pellerin, B. A., Fleck, J. A., Downing, B. D., and Bergamaschi, B. A. (2016). Optical Properties of Dissolved Organic Matter (DOM): Effects of Biological and Photolytic Degradation. Limnol. Oceanogr. 61 (3), 1015–1032. doi:10.1002/lno.10270
Helfter, C., Campbell, C., Dinsmore, K. J., Drewer, J., Coyle, M., Anderson, M., et al. (2015). Drivers of Long-Term Variability in CO2 Net Ecosystem Exchange in a Temperate Peatland. Biogeosciences 12 (6), 1799–1811. doi:10.5194/bg-12-1799-2015
Huth, V., Hoffmann, M., Bereswill, S., and Popova, Y., Zak, D., and Augustin, J. (2018). The Climate Warming Effect of a Fen Peat Meadow with Fluctuating Water Table Is Reduced by Young Alder. Trees” 21, 1–18. doi:10.19189/MaP.2017.OMB.291
Ingrisch, J., and Bahn, M. (2018). Towards a Comparable Quantification of Resilience. Trends Ecol. Evol. 33 (4), 251–259. doi:10.1016/j.tree.2018.01.013
Ise, T., Dunn, A. L., Wofsy, S. C., and Moorcroft, P. R. (2008). High Sensitivity of Peat Decomposition to Climate Change through Water-Table Feedback. Nat. Geosci 1 (11), 763–766. doi:10.1038/ngeo331
Jackson, R. B., Lajtha, K., Crow, S. E., Hugelius, G., Kramer, M. G., and Piñeiro, G. (2017). The Ecology of Soil Carbon: Pools, Vulnerabilities, and Biotic and Abiotic Controls. Annu. Rev. Ecol. Evol. Syst. 48 (1), 419–445. doi:10.1146/annurev-ecolsys-112414-054234
Jaffrain, J., Gérard, F., Meyer, M., and Ranger, J. (2007). Assessing the Quality of Dissolved Organic Matter in Forest Soils Using Ultraviolet Absorption Spectrophotometry. Soil Sci. Soc. Am. J. 71 (6), 1851–1858. doi:10.2136/sssaj2006.0202
Jassey, V. E. J., Reczuga, M. K., Zielińska, M., Słowińska, S., Robroek, B. J. M., Mariotte, P., et al. (2018). Tipping point in Plant-Fungal Interactions under Severe Drought Causes Abrupt Rise in Peatland Ecosystem Respiration. Glob. Change Biol. 24 (3), 972–986. doi:10.1111/gcb.13928
Jassey, V. E. J., and Signarbieux, C. (2019). Effects of Climate Warming on Sphagnum Photosynthesis in Peatlands Depend on Peat Moisture and Species‐specific Anatomical Traits. Glob. Change Biol. 25 (11), 3859–3870. doi:10.1111/gcb.14788
Johnson, P. C. D. (2014). Extension of Nakagawa & Schielzeth'sR2GLMMto Random Slopes Models. Methods Ecol. Evol. 5 (9), 944–946. doi:10.1111/2041-210x.12225
Kalbitz, K., Schmerwitz, J., Schwesig, D., and Matzner, E. (2003). Biodegradation of Soil-Derived Dissolved Organic Matter as Related to its Properties. Geoderma 113 (3–4), 273–291. doi:10.1016/S0016-7061(02)00365-8
Knapp, A. K., Beier, C., Briske, D. D., Classen, A. T., Luo, Y., Reichstein, M., et al. (2008). Consequences of More Extreme Precipitation Regimes for Terrestrial Ecosystems. BioScience 58 (9), 811–821. doi:10.1641/B580908
Knapp, A. K., Fay, P. A., Blair, J. M., Collins, S. L., Smith, M. D., Carlisle, J. D., et al. (2002). Rainfall Variability, Carbon Cycling, and Plant Species Diversity in a Mesic Grassland. Science 298 (5601), 2202–2205. doi:10.1126/science.1076347
Koebsch, F., Sonnentag, O., Järveoja, J., Peltoniemi, M., Alekseychik, P., Aurela, M., et al. (2020). Refining the Role of Phenology in Regulating Gross Ecosystem Productivity across European Peatlands. Glob. Change Biol. 26 (2), 876–887. doi:10.1111/gcb.14905
Kuiper, J. J., Mooij, W. M, Bragazza, L., and Robroek, B. J. M. (2014). “Plant Functional Types Define Magnitude of Drought Response in Peatland CO2exchange.” Ecology 95 (1): 123–131. doi:10.1890/13-0270.1
Kuzyakov, Y., and Cheng, W. (2001). Photosynthesis Controls of Rhizosphere Respiration and Organic Matter Decomposition. Soil Biol. Biochem. 33 (14), 1915–1925. doi:10.1016/S0038-0717(01)00117-1
Kuzyakov, Y. (2010). Priming Effects: Interactions between Living and Dead Organic Matter. Soil Biol. Biochem. 42 (9), 1363–1371. doi:10.1016/j.soilbio.2010.04.003
Lai, D. Y. F. (2009). Modelling the Effects of Climate Change on Methane Emission from a Northern Ombrotrophic Bog in Canada. Environ. Geol. 58 (6), 1197–1206. doi:10.1007/s00254-008-1613-5
Lamentowicz, M., Gałka, M., Marcisz, K., Słowiński, M., Kajukało-Drygalska, K., Dayras, M. D., et al. (2019). Unveiling Tipping Points in Long-Term Ecological Records from Sphagnum -Dominated Peatlands. Biol. Lett. 15 (4), 20190043–20190047. doi:10.1098/rsbl.2019.0043
Leach, J. A., Larsson, A., Wallin, M. B., Nilsson, M. B., and Laudon, H. (2016). Twelve Year Interannual and Seasonal Variability of Stream Carbon Export from a Boreal Peatland Catchment. J. Geophys. Res. Biogeosci. 121 (7), 1851–1866. doi:10.1002/2016JG003357
Lehmann, J., Coumou, D., and Frieler, K. (2015). Increased Record-Breaking Precipitation Events under Global Warming. Climatic Change 132 (4), 501–515. doi:10.1007/s10584-015-1434-y
Leifeld, J., and Menichetti, L. (2018). The Underappreciated Potential of Peatlands in Global Climate Change Mitigation Strategies. Nat. Commun. 9 (1), 1–7. doi:10.1038/s41467-018-03406-6
Liaw, A., and Wiener, M. (2002). Classification and Regression by RandomForest. R. News 2 (3), 18–22.
Limpens, J., Berendse, F., Blodau, C., Canadell, J. G., Freeman, C., Holden, J., et al. (2008). Peatlands and the Carbon Cycle: from Local Processes to Global Implications - a Synthesis. Biogeosciences 5 (5), 1475–1491. doi:10.5194/bg-5-1475-2008
Lund, M., Christensen, T. R., Lindroth, A., and Schubert, P. (2012). Effects of Drought Conditions on the Carbon Dioxide Dynamics in a Temperate Peatland. Environ. Res. Lett. 7 (4), 045704. doi:10.1088/1748-9326/7/4/045704
McNeil, P., and Waddington, J. M. (2003). Moisture Controls on Sphagnum Growth and CO2 Exchange on a Cutover Bog. J. Appl. Ecol. 40 (2), 354–367. doi:10.1046/j.1365-2664.2003.00790.x
Moore, T. R., Bubier, J. L., and Bledzki, L. (2007). Litter Decomposition in Temperate Peatland Ecosystems: The Effect of Substrate and Site. Ecosystems 10, 949–963. doi:10.1007/s10021-007-9064-5
Moore, T. R., and Dalva, M. (2001). Some Controls on the Release of Dissolved Organic Carbon by Plant Tissues and Soils. Soil Sci. 166 (1), 38–47. doi:10.1097/00010694-200101000-00007
Muhr, J., Höhle, J., Otieno, D. O., and Borken, W. (2011). Manipulative Lowering of the Water Table during Summer Does Not Affect CO2emissions and Uptake in a Fen in Germany. Ecol. Appl. 21 (2), 391–401. doi:10.1890/09-1251.1
Neuwirth, E. (2014). RColorBrewer: ColorBrewer Palettes, R Package Version 1.1-2, Available at: https://cran.r-project.org/package=RColorBrewer doi:10.1515/9783110339277
Nichols, J. E., and Peteet, D. M. (2019). Rapid Expansion of Northern Peatlands and Doubled Estimate of Carbon Storage. Nat. Geosci. 12 (11), 917–921. doi:10.1038/s41561-019-0454-z
Nijp, J. J., Limpens, J., Metselaar, K., Peichl, M., Nilsson, M. B., van der Zeevan der Zee, S. E. A. T. M., et al. (2015). Rain Events Decrease Boreal Peatland Net CO2uptake through Reduced Light Availability. Glob. Change Biol. 21 (6), 2309–2320. doi:10.1111/gcb.12864
Nijp, J. J., Limpens, J., Metselaar, K., Zee, S. E. A. T. M., Berendse, F., Robroek, B. J. M., et al. (2014). Can Frequent Precipitation Moderate the Impact of Drought on Peatmoss Carbon Uptake in Northern Peatlands? New Phytol. 203 (1), 70–80. doi:10.1111/nph.12792
Nimmo, D. G., Mac Nally, R. A. H., Cunningham, S. C., Haslem, A., and Bennett, A. F. (2015). Vive la résistance: reviving resistance for 21st century conservation. Trends Ecol. Evol. 30 (9), 516–523. doi:10.1016/j.tree.2015.07.008
Olefeldt, D., Euskirchen, E. S., Harden, J., Kane, E., McGuire, A. D., Waldrop, M. P., et al. (2017). A Decade of Boreal Rich Fen Greenhouse Gas Fluxes in Response to Natural and Experimental Water Table Variability. Glob. Change Biol. 23 (6), 2428–2440. doi:10.1111/gcb.13612
Page, S. E., and Baird, A. J. (2016). Peatlands and Global Change: Response and Resilience. Annu. Rev. Environ. Resour. 41 (1), 35–57. doi:10.1146/annurev-environ-110615-085520
Pastor, J., Solin, J., Bridgham, S. D., Updegraff, K., Harth, C., Weishampel, P., et al. (2003). Global Warming and the Export of Dissolved Organic Carbon from Boreal Peatlands. Oikos 100, 380–386. doi:10.1034/j.1600-0706.2003.11774.x
Pinheiro, J., Bates, D., DebRoy, S., and Sarkar, D., R Core Team (2016). “Nlme: Linear and Nonlinear Mixed Effects Models.”, R Package Version 3.1, Available at: http://cran.r-project.org/package=nlme
R Core Team (2019). R: A Language and Environment for Statistical Computing. ” Vienna, Austria: R Foundation for Statistical ComputingAvailable at: http://www.r-project.org/
Radu, D. D., and Duval., T. P. (2018a). Impact of Rainfall Regime on Methane Flux from a Cool Temperate Fen Depends on Vegetation Cover. Ecol. Eng. 114 (April), 76–87. doi:10.1016/j.ecoleng.2017.06.047
Radu, D. D., and Duval., T. P. (2018b). Precipitation Frequency Alters Peatland Ecosystem Structure and CO2 Exchange: Contrasting Effects on Moss, Sedge, and Shrub Communities. Glob. Change Biol. 24 (5), 2051–2065. doi:10.1111/gcb.14057
Rastogi, A., Stróżecki, M., Kalaji, H. M., Łuców, D., Lamentowicz, M., and Juszczak, R. (2019). Impact of Warming and Reduced Precipitation on Photosynthetic and Remote Sensing Properties of Peatland Vegetation. Environ. Exp. Bot. 160 (April), 71–80. doi:10.1016/j.envexpbot.2019.01.005
Reichstein, M., Bahn, M., Ciais, P., Frank, D., Mahecha, M. D., Seneviratne, S. I., et al. (2013). Climate Extremes and the Carbon Cycle. Nature 500 (7462), 287–295. doi:10.1038/nature12350
Riutta, T., Korrensalo, A., Laine, A. M., Laine, J., and Tuittila, E.-S. (2020). Interacting Effects of Vegetation Components and Water Level on Methane Dynamics in a Boreal Fen. Biogeosciences 17 (3), 727–740. doi:10.5194/bg-17-727-2020
Riutta, T., Laine, J., Aurela, M., Rinne, J., Vesala, T., Laurila, T., et al. (2007). Spatial Variation in Plant Community Functions Regulates Carbon Gas Dynamics in a Boreal Fen Ecosystem. Tellus B: Chem. Phys. Meteorology 59 (5), 838–852. doi:10.1111/j.1600-0889.2007.00302.x
Robroek, B. J. M., Schouten, M. G. C., Limpens, J., Berendse, F., and Poorter, H. (2009). Interactive Effects of Water Table and Precipitation on Net CO2assimilation of Three Co-occurringSphagnummosses Differing in Distribution above the Water Table. Glob. Change Biol. 15 (3), 680–691. doi:10.1111/j.1365-2486.2008.01724.x
Rosset, T., Gandois, L., Le Roux, G., Teisserenc, R., Durantez Jimenez, P., Camboulive, T., et al. (2019). Peatland Contribution to Stream Organic Carbon Exports from a Montane Watershed. J. Geophys. Res. Biogeosci. 124 (11), 3448–3464. doi:10.1029/2019JG005142
Saar, S., Semchenko, M., Barel, J. M., and De Deyn, G. B. (2016). Legume Presence Reduces the Decomposition Rate of Non-legume Roots. Soil Biol. Biochem. 94, 88–93. doi:10.1016/j.soilbio.2015.11.026
Schimel, J. P. (2018). Life in Dry Soils: Effects of Drought on Soil Microbial Communities and Processes. Annu. Rev. Ecol. Evol. Syst. 49, 409–432. doi:10.1146/annurev-ecolsys-110617-062614
Schwieger, S., Kreyling, J., Couwenberg, J., Smiljanić, M., Weigel, R., Wilmking, M., et al. (2020). Wetter Is Better: Rewetting of Minerotrophic Peatlands Increases Plant Production and Moves Them towards Carbon Sinks in a Dry Year. Ecosystems, 1–17. doi:10.1007/s10021-020-00570-z
Strack, M., and Price, J. S. (2009). Moisture Controls on Carbon Dioxide Dynamics of Peat-Sphagnummonoliths. Ecohydrol. 2 (1), 34–41. doi:10.1002/eco.36
Sundh, I., Mikkelä, C., Nilsson, M., and Svensson, B. H. (1995). Potential Aerobic Methane Oxidation in a Sphagnum-Dominated Peatland-Controlling Factors and Relation to Methane Emission. Soil Biol. Biochem. 27 (6), 829–837. doi:10.1016/0038-0717(94)00222-M
Swindles, G. T., Morris, P. J., Mullan, D. J., Payne, R. J., Roland, T. P., Amesbury, M. J., et al. (2019). Widespread Drying of European Peatlands in Recent Centuries. Nat. Geosci. 12, 922–928. doi:10.1038/s41561-019-0462-z
Tramontana, G., Ichii, K., Camps-Valls, G., Tomelleri, E., and Papale, D. (2015). Uncertainty Analysis of Gross Primary Production Upscaling Using Random Forests, Remote Sensing and Eddy Covariance Data. Remote Sensing Environ. 168 (October), 360–373. doi:10.1016/j.rse.2015.07.015
Turetsky, M. R., Bond‐Lamberty, B., Euskirchen, E., Talbot, J., Frolking, S., McGuire, A. D., et al. (2012). The Resilience and Functional Role of Moss in Boreal and Arctic Ecosystems. New Phytol. 196 (1), 49–67. doi:10.1111/j.1469-8137.2012.04254.x
Turetsky, M. R., Kotowska, A., Bubier, J., Dise, N. B., Crill, P., Hornibrook, E. R. C., et al. (2014). A Synthesis of Methane Emissions from 71 Northern, Temperate, and Subtropical Wetlands. Glob. Change Biol. 20 (7), 2183–2197. doi:10.1111/gcb.12580
Ummenhofer, C. C., and Meehl, G. A. (2017). Extreme Weather and Climate Events with Ecological Relevance: A Review. Phil. Trans. R. Soc. B 372 (1723), 20160135. doi:10.1098/rstb.2016.0135
Updegraff, K., Bridgham, S. D., Pastor, J., Weishampel, P., and Harth, C. (2001). Response of CO 2 and CH 4 Emissions from Peatlands to Warming and Water Table Manipulation. Ecol. Appl. 11 (2), 311–326. doi:10.2307/3060891
Wang, H., Richardson, C. J., and Ho, M. (2015). Dual Controls on Carbon Loss during Drought in Peatlands. Nat. Clim Change 5 (6), 584–587. doi:10.1038/nclimate2643
Wickham, H. (2016). Ggplot2: Elegant Graphics for Data Analysis. New York: Springer-VerlagAvailable at: http://ggplot2.org
Wieder, W. R., Bonan, G. B., and Allison, S. D. (2013). Global Soil Carbon Projections Are Improved by Modelling Microbial Processes. Nat. Clim Change 3 (10), 909–912. doi:10.1038/nclimate1951
Wilke, C. O. (2019). “Cowplot: Streamlined Plot Theme and Plot Annotations for ‘Ggplot2’.”, R Package Version 1.0.0. Available at: https://cran.r-project.org/package=cowplot. doi:10.1515/9783748602224
Yu, Z. C. (2012). Northern Peatland Carbon Stocks and Dynamics: A Review. Biogeosciences 9 (10), 4071–4085. doi:10.5194/bg-9-4071-2012
Keywords: resistance, resilience, dissolved organic carbon, decomposition, water table fluctuation, rewetting, carbon dioxide, methane
Citation: Barel JM, Moulia V, Hamard S, Sytiuk A and Jassey VEJ (2021) Come Rain, Come Shine: Peatland Carbon Dynamics Shift Under Extreme Precipitation. Front. Environ. Sci. 9:659953. doi: 10.3389/fenvs.2021.659953
Received: 15 February 2021; Accepted: 11 June 2021;
Published: 24 June 2021.
Edited by:
Björn Klöve, University of Oulu, FinlandReviewed by:
Maria Strack, University of Waterloo, CanadaSaraswati Saraswati, University of Waterloo, Canada
Copyright © 2021 Barel, Moulia, Hamard, Sytiuk and Jassey. This is an open-access article distributed under the terms of the Creative Commons Attribution License (CC BY). The use, distribution or reproduction in other forums is permitted, provided the original author(s) and the copyright owner(s) are credited and that the original publication in this journal is cited, in accordance with accepted academic practice. No use, distribution or reproduction is permitted which does not comply with these terms.
*Correspondence: Janna M. Barel, amFubmEuYmFyZWxAZ21haWwuY29t
†Present address: Vincent Moulia, University of Montpellier, CNRS, IEM/INRAE G-eau/INRAE LBE, 34000, Montpellier, France