 Dorte Herzke
 Peygham Ghaffari3
 Caroline Aas Tranang
 Claudia Halsband
- 1Norwegian Institute for Air Research, NILU, Fram Centre, Tromsø, Norway
- 2Institute for Arctic and Marine Biology, UiT The Arctic University of Norway, Tromsø, Norway
- 3Akvaplan-niva, Fram Centre, Tromsø, Norway
- 4Institute of Marine Research, Tromsø, Norway
Microfibers (MF) are one of the major classes of microplastic found in the marine environment on a global scale. Very little is known about how they move and distribute from point sources such as wastewater effluents into the ocean. We chose Adventfjorden near the settlement of Longyearbyen on the Arctic Svalbard archipelago as a case study to investigate how microfibers emitted with untreated wastewater will distribute in the fjord, both on a spatial and temporal scale. Fiber abundance in the effluent was estimated from wastewater samples taken during two one-week periods in June and September 2017. Large emissions of MFs were detected, similar in scale to a modern WWTP serving 1.3 million people and providing evidence of the importance of untreated wastewater from small settlements as major local sources for MF emissions in the Arctic. Fiber movement and distribution in the fjord mapped using an online-coupled hydrodynamic-drift model (FVCOM-FABM). For parameterizing a wider spectrum of fibers from synthetic to wool, four different density classes of MFs, i.e., buoyant, neutral, sinking, and fast sinking fibers are introduced to the modeling framework. The results clearly show that fiber class has a large impact on the fiber distributions. Light fibers remained in the surface layers and left the fjord quickly with outgoing currents, while heavy fibers mostly sank to the bottom and deposited in the inner parts of the fjord and along the northern shore. A number of accumulation sites were identified within the fjord. The southern shore, in contrast, was much less affected, with low fiber concentrations throughout the modeling period. Fiber distributions were then compared with published pelagic and benthic fauna distributions in different seasons at selected stations around the fjord. The ratios of fibers to organisms showed a very wide range, indicating hot spots of encounter risk for pelagic and benthic biota. This approach, in combination with in-situ ground-truthing, can be instrumental in understanding microplastic pathways and fate in fjord systems and coastal areas and help authorities develop monitoring and mitigation strategies for microfiber and microplastic pollution in their local waters.
Introduction
Microplastic fibers (MF) are major constituents of microplastic pollution in the aquatic environment. Especially wastewater effluents are reported as a major source (Mintenig et al., 2017). Global patterns of microplastic pollution and the diversity of microplastic types in the marine environment suggest that in many locations the majority of marine microplastics (up to 91%) consists of anthropogenic fibers (Browne et al., 2011; Lusher et al., 2015; Barrows et al., 2018; Gago et al., 2018; Suaria et al., 2020).
Fibers from industrially processed cellulose, containing dyes and other man-made chemicals, may also fall into this category (Suaria et al., 2020). Synthetic fibers consist mostly of polyester, but other polymers such as polyamide, polyacrylic, polyethylene, and polypropylene are also common in clothing (Singh et al., 2020). Estimates predict that over 7.0 × 10⁵ fibers could be released from an average 6 kg wash load of acrylic fabric (Napper and Thompson, 2016). As an example for natural fibers, one pair of used jeans can release (56 ± 4.1) × 103 microfibers per wash (Athey et al., 2020). MF’s are thus equally ubiquitous and persistent to degradation as other microplastics (Lots et al., 2017; Turner et al., 2019; Grbic´ et al., 2020; Roblin and Aherne, 2020). Due to their elongated shape, however, their physical properties differ from those of other microplastics, which in turn may influence their formation, sinking, lateral transport, and degradation behavior (Bagaev et al., 2017). Many marine organisms ingest microplastics, both under controlled laboratory conditions and in situ (Davison and Asch, 2011; Cole et al., 2013; Desforges et al., 2015; Gall and Thompson, 2015; Fang et al., 2018; Cole et al., 2020). Fibers are the dominant microplastic type ingested by marine organisms in situ, and ingestion of fibers in the wild has been documented for pelagic copepods and euphausiids (Desforges et al., 2015), pelagic and demersal fish (Lusher et al., 2013), and for benthic animals such as mussels (Mathalon and Hill, 2014). The effects of MF on marine biota are not well known but can include entanglement and ingestion, which in turn may affect their physiology and reproductive success (Cole et al., 2015). Transformation processes such as environmental degradation (weathering) and biofouling alter the plastic surface, buoyancy, and colonization with microbes (biofouling) and can increase microplastic ingestion rates (Vroom et al., 2017; Welden and Cowie, 2017; Bra°te et al., 2018). Despite an increasing knowledge base of effects from laboratory experiments, when and where organisms encounter microplastics in their natural habitats is poorly understood. Also, estimates of the number of microplastics and MF likely to interact with organisms in different environmental compartments are scattered, and many review articles consider concentrations causing effects in the laboratory as higher than those present in the environment. New data are thus needed to map spatial and temporal overlap between microplastics in general, and MF in particular, and marine biota to predict geographic areas where potential effects are likely to occur.
Fjord systems represent semi-enclosed coastal systems well suited as natural laboratories, are characterized by longer resident times of seawater and slower water exchange than the open ocean. Effluents thus become diluted slower and are less rapidly removed by tidal currents. As a result, microplastic particles emitted locally might circulate longer and distribute to particular sites within a given fjord system, making them available to resident organisms.
For the present study, we chose Adventfjorden as a case study for fiber distribution in the Arctic, where a single untreated wastewater effluent has been emitting into the fjord system. The wastewater is collected in a pump station serving the local settlement Longyearbyen, a small town with approximately 2,500 inhabitants. The station treats approximately 2 × 10⁵ m3 wastewater per year, but due to the lack of any treatment, it can be expected that large amounts of fibers are emitted into the fjord every year (Evenset et al., 2017). To estimate possible impacts of fibers on marine biota in different environmental compartments, spatial overlap between biota and fibers needs to be determined. This, in turn, requires an enhanced picture of the transport pathways of fibers after they leave the wastewater effluent. Besides fiber density, both wastewater plume dynamics and local oceanic processes are expected to play a vital role in fiber distribution and possible deposition. This study describes fiber dispersal in Adventfjorden as an example for an Arctic coastal marine system using a modeling approach to investigate potential hotspots of high MF concentrations, where marine organisms are expected to experience high encounter risk in the water column and on the seafloor.
Materials and Methods
Study Area, Sampling and Processing of Wastewater Samples
The Adventfjorden is part of the largest fjord complex in the Svalbard archipelago (78◦ N), branching out from the larger Isfjorden located on the west coast of Spitsbergen (Figure 1). Adventfjorden is approx. 7 km long, 3–5 km wide, and has no threshold, allowing free water exchange with the adjacent larger fjord system, which in turn is influenced by Atlantic water. The Adventfjorden-Isfjorden system is well studied, with a well-established understanding of physical and biological characteristics (Holte et al., 1996; Gooday et al., 2005; Winkelmann and Knies, 2005; Glahder et al., 2006; Majewski and Zajaczkowski, 2007; Levitan et al., 2008; Koziorowska et al., 2016). Adventfjorden is exposed to significant physical disturbances from river runoff by two rivers and high sedimentation rates of glacial origin in the summer. The wastewater outflow that introduces microfibers into Adventfjorden is located close to the northern boundary of the fjord (78◦ 14.815 N; 15◦ 39.102 E) near the seabed at approximately 50 m depth, 1 m above the seafloor (Figure 1). Two sampling periods of 1 week were chosen in June and September 2017. Samples for fiber particle determination were collected from wastewater at the pump station, handling the wastewater flow in Longyearbyen (Figure 2). In June and September 2017, three samples per day (morning, lunchtime, and evening) were taken on five consecutive days, including 3 weekdays and 2 weekend days. One-liter samples were collected in a stainless-steel container from the surface of the waste-water collector. Samples were stored in precleaned and burned (overnight at 450°C) glass bottles (SCHOTT; Germany) and were stored cool and dark before shipment to the laboratory. The samples were filtered over burned glass fiber filters (450°C, 8 h, Whatman GF/C, 90 mm, 1.2 μm pore size) in a clean cabinet (laminar flow cabinet; Bigneat, United Kingdom). Triplicate procedural blanks were included for each sampling campaign, in addition to laboratory blanks (to account for contamination from air), and microscope blanks. The average fiber count in the blank samples was 3.7 for June and 6.3 for September, resulting in LODs of 8 and 16 for fibers in June and September respectively. All samples were blank corrected accordingly.
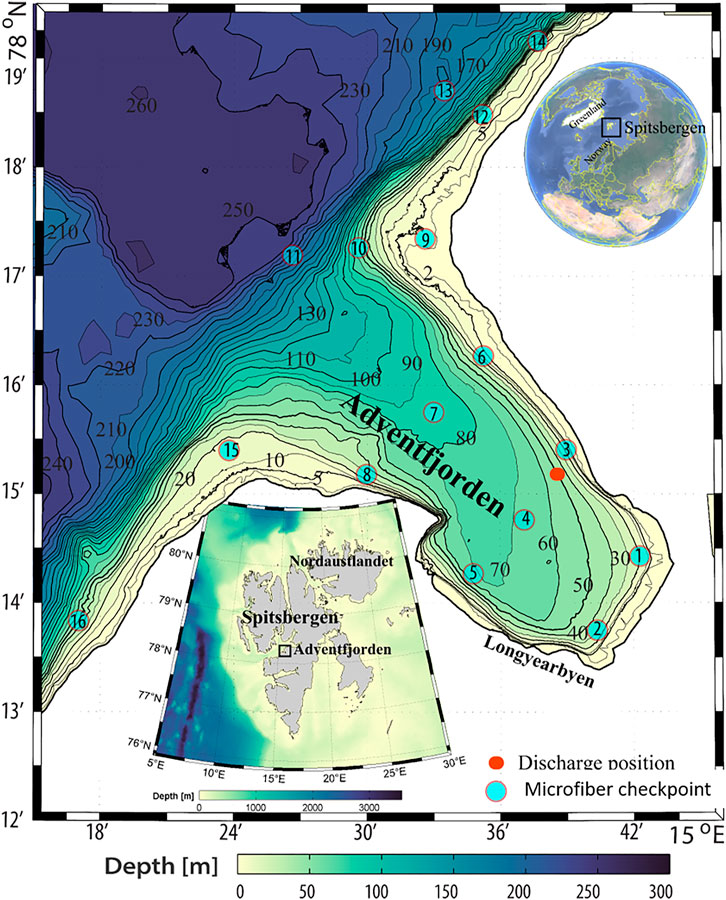
FIGURE 1. Overview map of Svalbard, Adventfjorden, illustrating the position of the discharge point of Longyearbyen wastewater effluent (red dot) and the checkpoints used in the modeling of fiber movements.
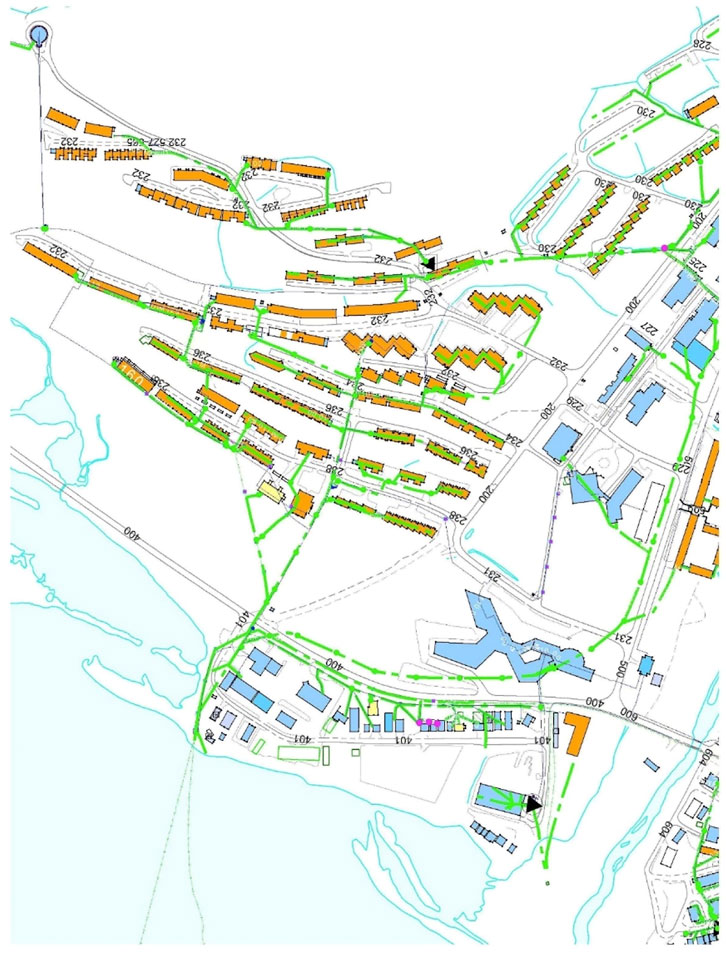
FIGURE 2. Map showing connected households to the effluent (orange shapes: buildings, green lines: effluent collection). Blue shapes represent commercial and governmental properties, not part of the sampling. Red star represents sampling location in pump station.
Quantification of Microfibers
The samples were visually analyzed under a dissecting microscope (Leica M205C; 475 nm visible structure width). The filters were overlaid with a transparent grid sheet (1 mm grid), enabling a systematic inspection of the filters square by square by working horizontally from the left to the right and vice versa in alternate rows (vertically). Microplastic particles were counted and categorized as either fibers, fragments, or beads. Only the fibers are discussed in this study. The color was determined for all particles, but transparent or white fibers were not counted to avoid an overestimation of cellulose. Additionally, fibers were categorized into two size groups: a) smaller than 1 mm and b) larger than 1 mm. The smallest particle size detectable was 50 µm. All data were blank corrected, using a method detection limit (MDL; MDL = average number of fibers in control samples + 2 × standard deviation).
Microfiber Transport Modeling
A high-resolution, coupled hydrodynamic-drift model Finite-Volume Community Ocean Model [FVCOM, Chen et al. (2003)] was used for mapping fiber distribution in Adventfjorden and incorporating variable sources in the drift scenarios. The present setup of FVCOM is a high-resolution grid that covers the entire fjord including the shallow eastern extension, using a synthetic detailed bottom topography, obtained, and improved from diverse sources, such as the General Bathymetric Chart of the Oceans (GEBCO), one arc-minute global relief model (ETOPO1), and the Norwegian Mapping Authority (www.kartverket.no), with approx. 50 m inner fjord resolution.
Since the main focus in the present study is microfiber distribution associated with the small-and mesoscale processes in the fjord interior, we set a high-resolution mesh (<10 m) in the inner fjord and the shallow eastern bay. A setup of Regional Ocean Modeling System (ROMS) covering the Nordic Seas and the adjacent Barents and North Seas (Røed and Kristensen, 2013) was used as the outer domain model for forcing the high-resolution Adventfjorden model on the open boundary. We built the transport model upon the high-resolution Adventfjorden grid which is forced by a higher resolution atmospheric dynamics model, AROME-Arctic.
Fibers were introduced as an adjustable tracer in FABM, which is an Eulerian drift-modeling framework for trajectory modeling. The wastewater outflow that introduces microfibers into Adventfjorden is located close to the northern shore of the fjord at the seabed at approx. 50 m depth. On average 2 × 10⁵ m3 of effluent discharge per year (400–900 m3 day −1), which according to the here presented data contains 60 microfibers per liter. We applied a conservative approach by initializing and forcing the model with the lower limit discharge rate, i.e., 334 microfibers per second. For more information see the results chapter.
We simulated fiber distribution patterns by releasing fibers in four density classes into the fjord: MF with high and very high densities (1.17 and 1.39 g cm−3) are “heavy,” and “very heavy,” MF with low density (0.9 g cm−3) are “light,” and neutrally buoyant MF (1.028 g cm−3) are “neutral” with respect to the ambient water. These represent typical densities of common textile fibers: polyamide (PA) as “heavy,” wool as “very heavy,” and polypropylene (PP) as “light,” respectively. The neutrally buoyant fiber was included for comparative reasons, as well as to cover light fibers becoming continuously heavier due to biofouling, but many consumer plastics are also neutrally buoyant (Moore, 2008). To provide sufficient coverage over the fjord, 16 checkpoints were selected for analysis of fiber concentrations. Checkpoint 3 is located close to the sewage pipe opening, with checkpoints 1 and 2 off-stream at the end of the fjord, stations four and five parallel to station three, and all other stations located along the shore or in the middle of the fjord in the off-shore direction. Stations 6, 9, 12, and 14 are located along the western shore, while stations 5, 8, 15, and 16 are located along the eastern shoreline (Figure 1). For more details in the transport model, please refer to the SI.
Simulation of Microfiber Distribution
In this study, we focused on the summer features of microfiber distribution, when the fjord is ice-free. We run the 3D version of the hydrodynamic model with full atmospheric and boundary forcing and river runoff for a typical summer regime. The outer model long-term flow field analysis (not shown here) indicates a relatively fixed trend for the hydrodynamic regime in summer. Particularly during July, which is one of the warmest months (Wesławski et al., 2010) and the flow field is not affected by the spring and autumn transition processes. Here, we used July (the year 2013) for typifying the summer regime in the Adventfjord, which falls in between the sampling campaigns in June and September.
Density-based classification of particles also facilitates parameterizing their vertical velocity, which is an important feature in microfiber distribution. We attributed a range of vertical velocities from 0.5 to −1 mm/s, proportional to the microfiber densities. To express the limiting cases, here, we assumed that the light microfiber parameters space process an upward velocity around 0.5 mm/s, and the other end, which is the heaviest microfiber, sink at a rate of −1 mm/sec. We also considered 0 and −0.5 mm/s vertical velocities for the “neutral” and “heavy” classes, respectively. In all scenarios, the discharge plume modeled using typical summer discharge conditions, i.e., temperature and salinity at the discharge point is 15° and 5 PSU, respectively. For simulations, we used the Norwegian e-infrastructure computing capacity (www.sigma2.no).
Biota Abundances and Estimation of Exposure Risk
Three habitats are considered for potential interactions between fibers and marine organisms: the water column (surface to 2 m above bottom) for plankton, the water body right above the seafloor for meroplankton, especially larvae released from benthic animals (approximately 5 m above bottom, see Kuklinski et al., 2013), and the seafloor sediment for benthos. Based on available abundance numbers for organisms and the modeled fiber concentrations in these compartments (Supplementary Table S3), we estimated the number of fibers different taxa may be exposed to at selected model checkpoints and depths over the study period of 100 h, expressed as fiber to organism ratio. Biota abundance and composition were derived from published studies in the same fjord (Supplementary Table S4). Plankton and meroplankton data Vereide, 2019; Kuklinski et al., 2013 are given per cubic meter, while benthic organisms in the sediment (Cochrane and Evenset, 2020) are quantified per m−2 seafloor. Plankton was collected with vertical net hauls, hyperbenthos with a water sampler, and benthos with a Van Veen grab (for further details the reader is referred to the references). For some stations data were averaged to estimate numbers in locations equivalent to model checkpoints (i.e. stations A and B in Kuklinski et al. (2013) and stations 13–15 in Cochrane and Evenset (2020), Supplementary Table S4). The plankton community composition in Adventfjord changes significantly over the season; here we used data for meroplankton near the seafloor collected in May/June and July (Kuklinski et al., 2013), pelagic holo-and meroplankton in the water column collected in May, June, and August (Vereide, 2019), and benthic data collected in August/September (Cochrane and Evenset, 2020).
The modeled fiber concentrations at selected locations and depths in the fjord were divided by the number of organisms of these different functional groups to give an estimate of how many fibers marine biota may be exposed to over the study period of 100 h. For the plankton, four depth intervals were chosen: 0–5, 5–20, 20–50, 50–100, and > 100 m depth, where some shallow checkpoints do not include all depth layers (Supplementary Table S3). For the meroplankton, the depth layer just above the bottom was used, equivalent to Sigma = 1 in Figure 3. As both the water body and the plankton it contains and the fiber movements were highly dynamic, fiber to organism ratios were calculated using the maximum number of fibers present in the respective location/depth during the modeled period of 100 h. For the benthos, in contrast, which is much more spatially stable, we used the sums.
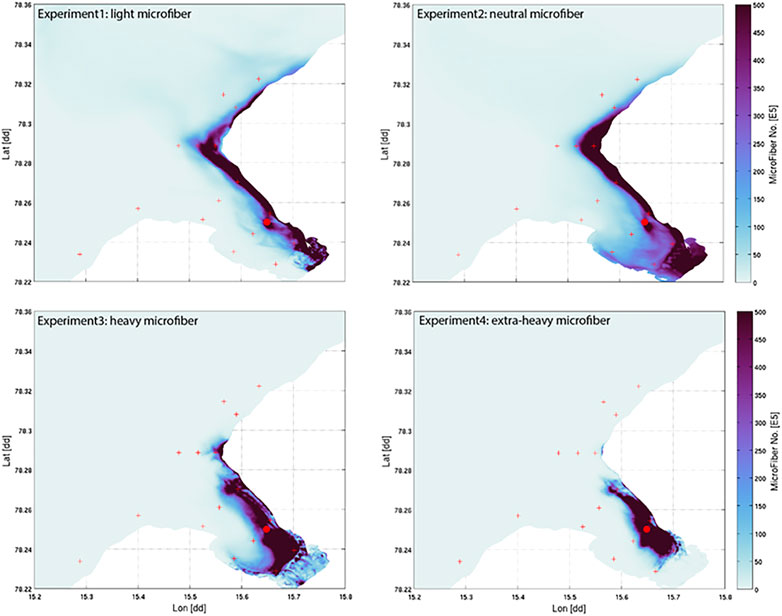
FIGURE 3. Map of depth-integrated accumulated MF distributions over 100 h for four different fiber densities (Exp1 = PP: 0.9 g cm−3, Exp2 = neutral particles: 1 g cm−3, Exp3 = PA: 1.17 g cm−3, Exp4 = Wool:1.39 g cm−3). Scale on right illustrates abundance of MF no. ×105 m−3.
Statistics
Statistical analyses of the emission data of fibers were performed using R (www.R-project.org). Since the data did not meet the assumptions of normal distribution or homogeneity of variance, the non-parametric Kruskal-Wallis test was used to investigate if the amount of microplastic particles in wastewater differed significantly between different times of the day, between days, or between sampling months.
Results
Emission Data
On average, 2 × 10⁵ m3 effluent discharged per year (400–900 m3 day−1), which is a mixture of sewage, food waste grinder, mush, and greywater (Ingerø, 2018). In June, a total of 30885 m3 wastewater was emitted into the Adventfjorden, compared to 21321 m3 in September (Ingerø, 2018). All collected wastewater samples contained microfibers, which dominated over other particles (microfibers average of 86% in June and 92% in September). Emissions of fibers at the sampled timepoints fluctuated considerably from 2 to 138 MFL−1in June (average 47 MF L−1) and not detected to 203 MF L−1 in September (average 73 MF L−1) (Figure 4). When comparing MF emissions between different times of the day, evenings showed higher emissions, however, no statistical difference between the time of day and between weekdays and weekends could be found (p = 0.431 and 0.904, Kruskal Wallis) (Figure 5, panels A and B). Although emissions in September were on averages slightly higher than in June, no statistical difference between June and September was found, allowing to combine all data to evaluate the emission pattern throughout the week (Figure 4, panels A and D). When comparing data for the whole week, emissions on Wednesdays, Thursdays, and Saturdays are higher than on the other days, possibly reflecting laundry habits, without being significant. In general, an average of 60 MF L−1 is emitted by the Longyearbyen settlement, respective to 1.4 × 10⁶ MF h−1 and almost 33 × 106 MF day−1. Particles only played a minor role with an average of 12.3 particles L−1 emitted in June and 5.8 particles L−1 in September. The total yearly emissions of MFs into the Adventfjorden by wastewater effluent amount to 18 billion non-white MF of the size 0.05–5 mm (Table 1).
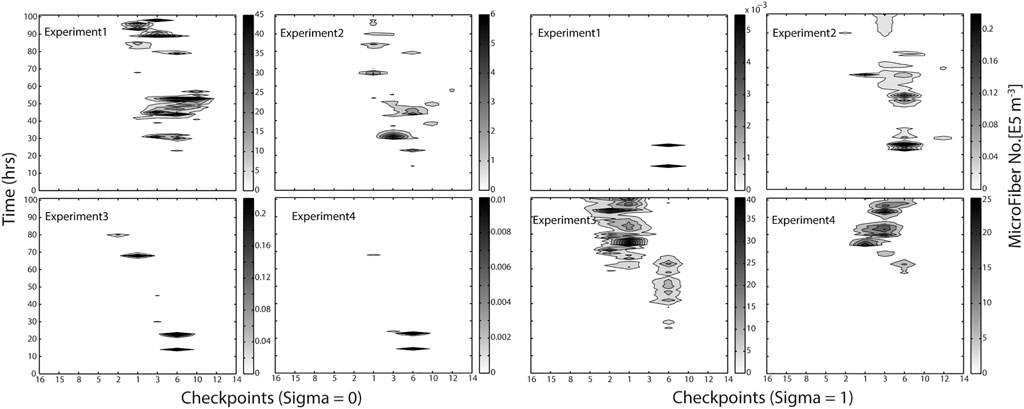
FIGURE 4. Hovmöller graph illustrating the modeled distribution of MF along the sites selected in the Adventfjord, Longyearbyen (MicroFiber check points), and time of accumulated continuous emission for four different MF densities (Exp1 = PP: 0.9 g cm−3, Exp2 = neutral particles: 1 g cm−3, Exp3 = PA: 1.17 g cm−3, Exp4 = Wool: 1.39 g cm−3). Scale on right illustrates abundance of MF no. ×105 m−3.
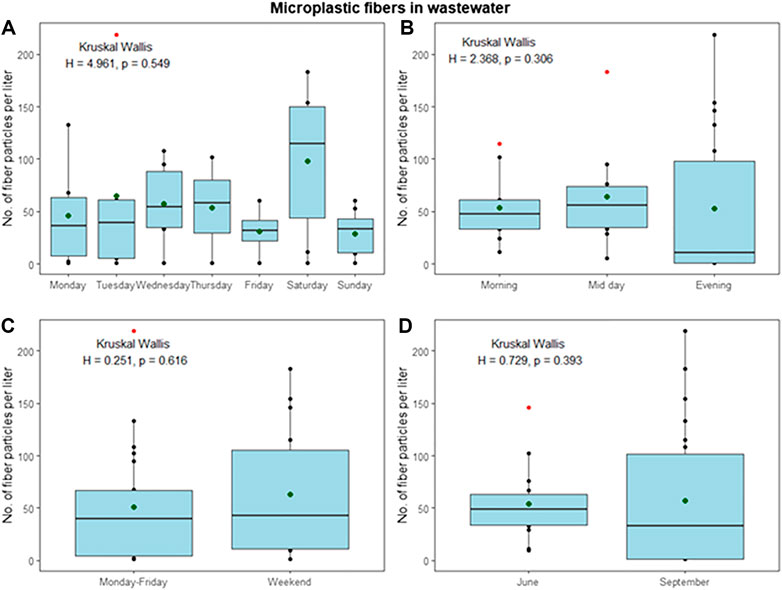
FIGURE 5. Overview over average fiber emissions during the observed sampling periods, with panel A showing emissions per day, panel B: Emissions per sampling time of the day, panel C: Comparison of weekdays and weekend days and panel D: Emissions during June and September sampling campaign; all in numbers of MFs per liter.

TABLE 1. Estimation of monthly and annual emissions of microfibers and microparticles by the wastewater effluent of the settlement of Longyearbyen, Svalbard.
Simulation of Microfiber Distribution in Adventfjorden
To compare the behavior of fiber types of differing densities (PP: 0.9 g cm−3, neutral particles: 1.0 g cm−3, PA 1.17 g cm−3, PES wool: 1.39 g cm−3), the modeled fiber distributions after 100 h of continuous emissions are shown in Figure 3. Most fibers peak along the northern shoreline (west side) of the fjord for all densities modeled at time point 100 h, indicating the southern shore (East side) of the fjord remains almost free of MF. Light and neutral MF leave the fjord within hours to days, while the heavier MF, will more easily deposit in the fjord under the summer conditions applied. This scenario indicates a high accumulation rate of heavy MF within the fjord system, (Figure 5). As the right-hand scale of the estimated number of MF (×105 m−3) indicates, 50 million MF particles per cubic meter are estimated to accumulate on the right shoreline after 100 h of accumulated emission alone. As the Hovmo¨ller graph for the surface water layer (Sigma0, upper 10% of water column) and seafloor-near water layer (Sigma1, lowest 10% of water column) illustrates, MF’s distribute quite differently within the water column according to their density as well as show diverse accumulation patterns in different checkpoints in the fjord (Figure 3). MF with a low density (Experiment 1) will stay in the surface waters also after 100 h of continuous emissions, moving along the shoreline toward the exit of the fjord between checkpoints 1, 3, 6, 10, but not passing over to the south side of the fjord. In contrast, heavy MF’s (Experiments 3 and 4) will mostly be found in the water layers close to the seafloor, nearby the discharge point, not immediately leaving the fjord. Neutral MF (Experiment 2) is present both in surface and bottom layers, which indicates distribution within the whole water column.
Spatial Overlap of Fibers and Marine Organisms
The plankton community exhibits spatial and seasonal variations in Adventfjorden, where the proportion of meroplankton is one of the strong seasonal features, mainly due to blooms of barnacle larvae (Cirripedia), among others (Kuklinski et al., 2013; Vereide, 2019). Large copepods of the genus Calanus dominate in June, while the community shifts to smaller copepod species by August (Figure 6). Just above the seafloor, a diverse meroplankton community is present in the summer in the deepest water layer of approximately 5 m above the bottom, with a seasonal succession of taxonomic groups (Figure 7). Maximum abundances for different plankton groups in the water column ranged from 500 Calanus copepodites m−3 in June and 9,000 individuals m−3 for small copepods in August to almost 19,000 m−3 Cirripedia larvae in May (Figure 6). In June, the plankton community was composed of almost equal proportions of Cirripedia larvae, Calanus copepodites, and small copepods (Figure 6). Meroplankton near the seafloor was also dominated by Cirripedia larvae in May-June, combined with high abundances of bivalve larvae, bryozoa and polychaete larvae and other trochophores (Figure 7), while an order of magnitude lower numbers of bivalve and gastropod larvae were present in July. Only few bivalve and gastropod larvae remained in this layer in August (Kuklinski et al., 2013). Benthic organisms were strongly dominated by polychaetes at the stations studied, and in particular by the common species Capitella capitata. In addition, bivalves and amphipods occurred in variable numbers (Cochrane and Evenset, 2020). Capitella capitata is an indicator for organic enrichment and was thus highly abundant close to the wastewater effluent pipe opening, where organic household waste enters the fjord (Figure 8). The corresponding fiber concentrations at these checkpoints ranged widely from zero to the maximum of >6.7 million fibers m−3 in the surface at checkpoint 3 and 6.2 million at checkpoint 6 (Supplementary Table S4). According to our calculations, over the course of 100 h, a maximum of >80 million fibers m−3 passes through the surface layer of checkpoint 6 (light MF) and the mid-water layer near the bottom at around 20 m depth at checkpoint 1 (heavy MF). The highest fiber concentrations at a given time point were recorded in the surface of checkpoints 3 and 6 with >6 million fibers m−3. As both modeled MF distributions and biota abundances show a large degree of spatial variation within the fjord, the encounter potential of marine species was variable depending on the horizontal and vertical position of each. The resulting fiber to plankton ratios for the water column and the seafloor are given in Figures 9–11. For the pelagic taxa, seasonal variations in abundance resulted in corresponding variations in exposure risk at the selected checkpoints (Figures 9, 10). The highest fiber to plankton ratios were observed in June (Figures 9E–H): ratios of >2,500 were observed for light MF at three checkpoints along the northern shore (1, 3, and 6), with a peak of 4,500 at the shallowest checkpoint 6 (Figure 9E). At checkpoint 4 the ratio was much lower with 510, followed by checkpoint 7 with 77, while the surface at checkpoints 5 and 15 was fiber-free. No light MF was observed in deeper layers. Neutral fibers exhibited the same pattern, but with lower ratios and distributed across the upper two depth layers down to 20 m. Heavy and very heavy fibers exhibited different patterns than light and neutral fibers and were also different from each other (Figures 9C,D,G,H,K,L). Not only did they occur deeper in the water column, but the ratios also increased from checkpoint 6 inward, with peaks at checkpoint 1. The ratios for heavy fibers were lower at checkpoint 3 and higher at checkpoint 5 than those of very heavy fibers. Meroplankton close to the bottom were studied at checkpoint 5 only (Figure 10). Only heavy fibers exhibited high fiber to organism ratios in this location, all other fiber types occurred in negligible numbers. The ratios were relatively low due to low fiber numbers vs. relatively high concentrations of benthic larvae. For benthic species, light fibers played no role at the checkpoints investigated (Figure 11A). The occurrence of some neutral fibers near the floor at the shallow checkpoint 3 increased the ratios there (Figure 11B), but most fibers encountered by the benthos were heavy or very heavy (Figures 11C,D). Despite high fiber concentrations, the ratios were relatively low compared with the plankton, ranging between 75 and 150 at checkpoints 3 and 6, due to very high abundances of Capitella sp.
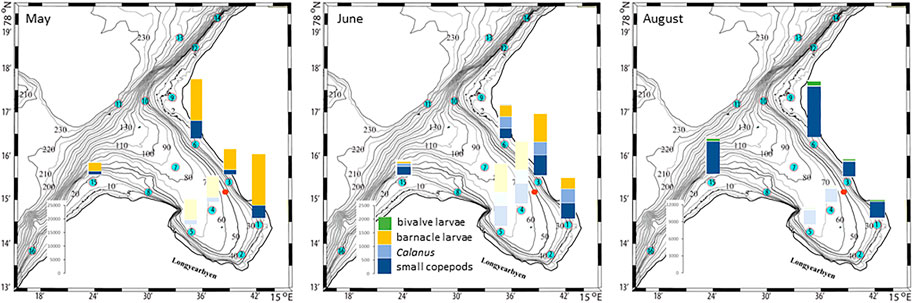
FIGURE 6. Plankton abundances in May, June, and August at selected checkpoints 1, 3, 6, and 15 in Adventfjord (data replotted from Vereide, 2019). Shaded bar plots represent the same numbers at checkpoints 4 and 5 as for checkpoint 3, used for subsequent fiber/organism ratio calculations in Figure 9. The red dot marks the wastewater pipe outlet.
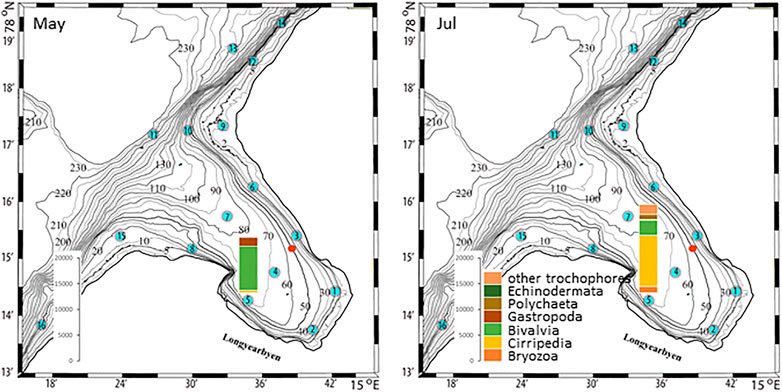
FIGURE 7. Meroplankton abundances in May-June, and July at checkpoint 5 in Adventfjord [data replotted from Kuklinski et al. (2013)]. The red dot marks the wastewater pipe outlet.
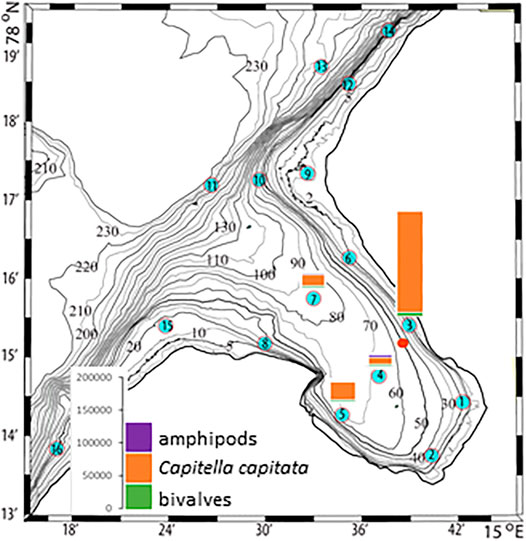
FIGURE 8. Benthos abundances at selected checkpoints 3, 4, 5, and 7 in Adventfjorden (data replotted from Cochrane and Evenset, 2020). The red dot marks the wastewater pipe outlet.
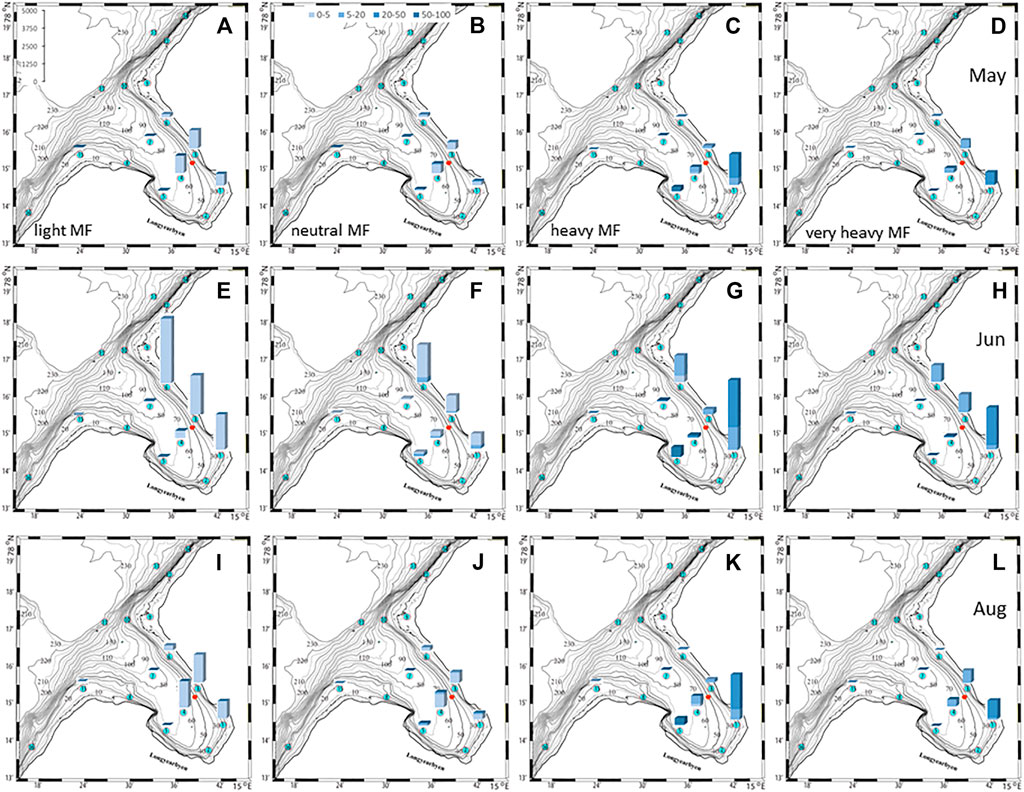
FIGURE 9. Fiber to plankton ratios in the water column at selected check points for four different fiber types in May (A–D), June (E–H), and August (I–L). The colors denote depth intervals in meter and scale in left panel indicates ratios.
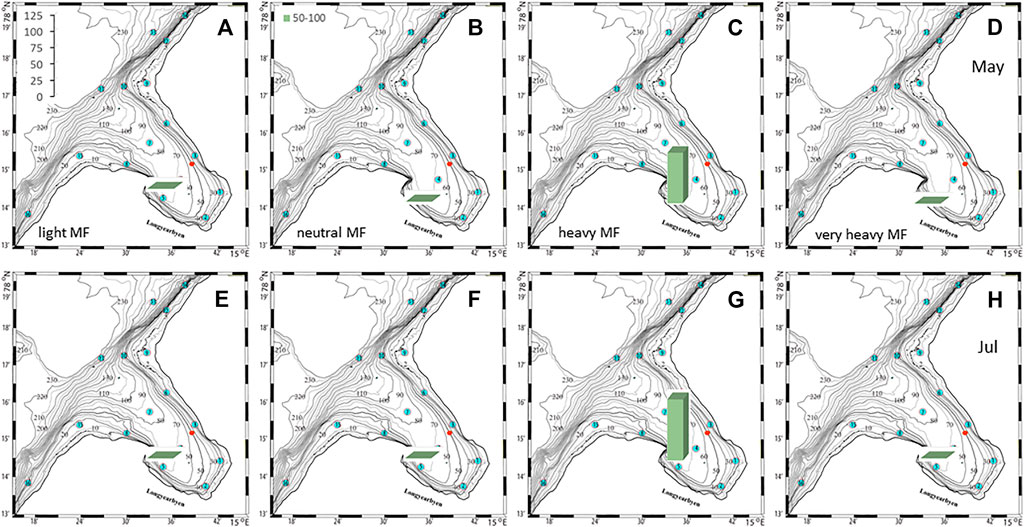
FIGURE 10. Fiber to meroplankton ratios (scale in left panel) in the deepest water layer (50–55 m depth) at checkpoint 5 for 4 different fiber types in May (A–D) and July (E–H).
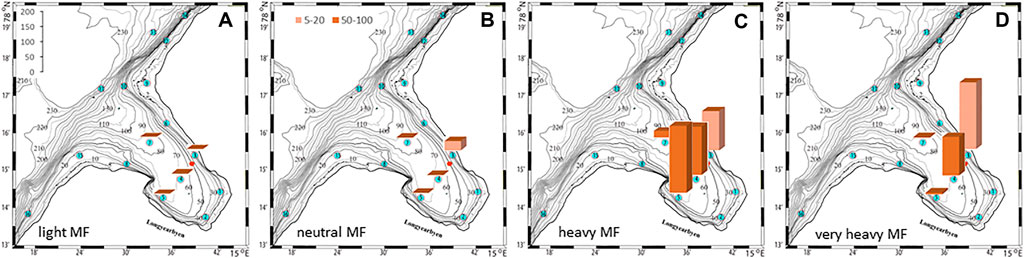
FIGURE 11. Fiber to benthos ratios at the seafloor at selected check points for 4 different fiber types. The colors denote depth intervals in depth intervals in meter.
Discussion
Our data indicate that total yearly emissions of fibers into the Adventfjord from wastewater effluent amount to about 18 billion non-white MF of the size 0.05–5 mm. This is equivalent to approximately 7.5 million MF per capita. In fact, 450 mg fibers can be released during an average washing machine cycle containing three pieces of clothing, which can be recalculated to 744 × 103 microfibers from one washing machine run alone (Cole et al., 2020; Napper et al., 2020). Using these numbers together with the assumption that one person performs 55 laundry cycles per year, 40 million MF particles would be emitted per person in Longyearbyen (Falco et al., 2020). These estimates are about 5 times higher than our findings. With about 2,400 inhabitants in Longyearbyen in 2020 (SSB, Population of Svalbard, 2. Halfyear of 2020; www.ssb.no/en/befolkning/statistikker/befsvalbard/halvaar), and assuming 55 laundry cycles per year per person, about 133,000 laundry cycles would contribute to the annual MF emissions by private households (Falco et al., 2020; Napper et al., 2020). This amounts to a range of 9.8 × 10¹⁰ – 7.2 × 10¹¹ MF particles annually emitted by the Longyearbyen population into the Adventfjord. These numbers align well with our findings of annual MF emissions of 1.8 × 10¹⁰. As not all inhabitants are connected to the wastewater station sampled in this study, the measured fiber numbers are slightly lower than the calculated estimate, but our approach represents realistic values. In Norway, about one million households are not connected to a wastewater treatment system or systems with coarse mechanic waste removal only. If all of these have similar emission rates as those observed here, annual emissions of 3 × 10¹² fibers (10 trillion MF) are to be expected nationally. Another recent study predicts a microplastic count of 1.3 × 10¹² particles for the North Atlantic basin (i.e., approximately 18 × 103 tons) and 23.6 × 10⁴ tons of microplastics in the oceans globally, where small microfibers are not included (van Sebille et al., 2015). A similar amount of 28 × 104 tons of MF has been estimated to reach the aquatic environment (Belzagui et al., 2020). For comparison Suaria et al., 2020 reported 9 × 10⁴ to 38 × 104 tons of fibers in the top meter of the world’s oceans, underlining the large contribution of MF to global emissions, while knowledge gaps remain, and hazard assessments are lacking (Suaria, et al., 2020).
The availability of efficient municipal wastewater treatment removing MF, as well as the need for innovation in developing garments shedding less MF, and washing machines equipped with filters removing MF from the wastewater before they reach the WWTPs could be successful measures to limit further releases of MF into the marine environment. Once emitted, the fate of MF is not well understood. We demonstrate here that fibers with different properties exhibit very different transport patterns in three-dimensional space. We distinguished fibers with four densities, which are equivalents of PP (light and neutral MF), PA (heavy MF), and wool (very heavy MF). These polymers are typical constituents of commonly used clothes. Fiber movement in the context of oceanic hydrodynamics, coupled with its own properties such as sinking behavior, is far from trivial and a function of several variables, including the fiber density, shape, spatial orientation, flow field energy, etc. Under turbulent marine conditions, the vertical movements of MF drastically vary from what can be measured under still lab conditions. In the environment, the terminal settling velocity will often be lower than 1 mm s−1 due to turbulence and upward convection (Bagaev et al., 2017). Furthermore, weathering and biofouling can alter physical behavior.
In general, settling at the seafloor and subsequent resuspension are complicated processes and little studied. A relatively weak current might be enough to detach fibers from the seabed. Thus, very low energy zones such as bottom depressions and coastal regions, where microfibers can entangle and settle among other particles, or in vegetation such as seagrass, could be possible accumulation zones (Cauwenberghe et al., 2013; Woodall et al., 2014). In porous bottom layer conditions, microfibers can be trapped in voids, or transported further by Lagrangian wave drift (Weber and Ghaffari, 2021). Harmonic forcing is one of the primary mechanisms for developing a flow field over the semi-enclosed basin of Adventfjorden. Atmospheric forcing also contributes to the flow field variability by its adjustments over the adjacent larger Isfjord and the entire region within a variety of temporal scales. Freshwater is of major importance for the coastal processes and the whole fjord dynamics not only due to introducing momentum to the fjord system but also because it acts as a controlling factor in developing water masses and the vertical structure of the fjord interior flow field. Furthermore, due to the topography, resulting flows are often spatially and temporally variable. Estimated MP concentrations of 150 MP m−3 were recently reported in near-surface water close to Svalbard, one of the highest concentrations observed within the sampling transect across the pole (Ross et al., 2021). A high contribution of MF to the overall MP count was found (92.8%), similar to our findings.
However, only surface water was investigated by these authors, whereas our study shows that even slightly denser MFs preferably accumulates on the seafloor and/or are suspended in the lowest water layer above the seafloor. These MF will not be accounted for by sampling approaches focusing on surface waters used, leading to an underestimation of the local MF abundance. Further, our modeling approach focused on a fjord system and not the open ocean where the potential for dilution will be higher. One modeling limitation has been in the restriction to single MF density classes in the simulation scenarios. Here, we initialized and forced modeling experiments with equally scaled MF classes, which is advantageous in identifying the accumulation zones and distribution patterns for each density class. Future model runs may represent more realistic fiber compositions of all four density classes simultaneously. Additionally, we have not considered the long-term effect of the marine environment, e.g. from biofouling or degradation, on the fiber characteristics, which might lead to modifications in fiber behavior. Our study shows that light fibers are highly mobile and may not reach the sediments for a very long time (if ever), when turbulent conditions and convective processes prevail.
MF consisting of cellulose were not considered in this study, even if they are an important part of wastewater emissions and environmental MF occurrence. The scientific community has not reached consensus yet, if this type of particle, often modified with dyes, surfactants and other chemicals, should be added to the category of semi-synthetic fibers. However, with a density of 1.55 g cm−3, according to our findings, they would move even slower along the seafloor, staying closer to the effluent than the heaviest fiber types discussed in our study. The present study shows that field data for the whole water column are essential for a full understanding and representation of microplastics and MF in marine systems. Although light MF can leave the fjord relatively shortly after they are emitted, their continuous emissions will cause a permanent resupply of MF leading to exposure of plankton species in the MF hot spots identified. These data will be valuable for future ground-truthing to verify if the identified patterns occur in situ. Laboratory studies of MF-biota interactions are still scarce. One study reports ingestion and retention of MF < 0.5 mm in blue mussels at concentrations as low as 3 MF ml−1 (Woods et al., 2018). The peak surface concentrations of MF reached to the surface layer were estimated to be six million MF m−3 in our study, equaling 6 MF ml−1, i.e., they are at the same order of magnitude as those concentrations showing effects under laboratory conditions. Benthic species will be most affected by heavy fibers sinking relatively close to emission points. The high abundances of Capitella sp. worms in the vicinity of the effluent pipe opening indicate local organic pollution, but these organisms will also experience the highest encounter risk for fibers, especially heavy or biofouled fibers that sink fastest.
Our study shows that small settlements, housing only a few thousand people, can introduce billions of MF particles annually. Poor wastewater treatment causes large emissions of various synthetic and non-synthetic fibers, which then travel to both the sea surface and the seafloor, depending on their physical properties. Emissions by the Longyearbyen settlement of approximately 2,400 inhabitants were found to be similar to those reported for a secondary wastewater treatment plant in the densely populated city of Vancouver, Canada, serving a population of 1.3 million people, with a microplastic retention capacity of up to 99% (Gies et al., 2018).
The implications are two-fold: 1) since numerous settlements without wastewater treatment exist in the Arctic, considerable local sources of MP and fibers are present in the Arctic, and 2) wastewater treatment technology that can effectively remove large proportions of small microplastics including fibers does already exist and should be implemented as much as possible also in small coastal communities. The need to invest in infrastructure able to treat wastewater effluents also from small communities is of considerable importance to prevent future emissions of synthetic MF with long environmental half-lives, high encounter rates with marine organisms, and the subsequent high potential for ingestion/entanglement.
Data Availability Statement
The raw data supporting the conclusions of this article will be made available by the authors, without undue reservation.
Author Contributions
DH and JS ensured funding and designed the sampling campaign. DH, JS, CH, and PG contributed to conception and design of the study. CT analyzed data and performed statistical analyses. DH wrote the first draft of the manuscript. DH, PG, and CH wrote sections of the manuscript. All authors contributed to manuscript revision, read, and approved the submitted version.
Conflict of Interest
The authors declare that the research was conducted in the absence of any commercial or financial relationships that could be construed as a potential conflict of interest.
Acknowledgments
The authors thank the Svalbard miljøvernfond and the Research program “Plastic in the Arctic” of the FRAM Center, Tromsø, Norway for supporting the here presented research (FiberTransport, # 042018). DH thanks the Norwegian Strategic Institute Program, granted by the Norwegian Research Council “Arctic, the Herald of Chemical Substances of Environmental Concern, CleanArctic”, #117031 together with the Project PlastPoll granted by the Norwegian Research Council, #275172. PG also gratefully acknowledges, Grant 288079 (the Norwegian Research Council- “MALINOR”). Further we thank Martine Røyset Eidem for assisting in the sampling campaign and Maria Jensen, IMR, for assistance in MF analyses.
Supplementary Material
The Supplementary Material for this article can be found online at: https://www.frontiersin.org/articles/10.3389/fenvs.2021.662168/full#supplementary-material
References
Athey, S. N., Adams, J. K., Erdle, L. M., Jantunen, L. M., Helm, P. A., Finkelstein, S. A., et al. (2020). The Widespread Environmental Footprint of Indigo Denim Microfibers from Blue Jeans. Environ. Sci. Technol. Lett. 7, 840–847. doi:10.1021/acs.estlett.0c00498
Bagaev, A., Mizyuk, A., Khatmullina, L., Isachenko, I., and Chubarenko, I. (2017). Anthropogenic Fibres in the baltic Sea Water Column: Field Data, Laboratory and Numerical Testing of Their Motion. Sci. Total Environ. 599-600, 560–571. doi:10.1016/j.scitotenv.2017.04.185
Barrows, A. P. W., Cathey, S. E., and Petersen, C. W. (2018). Marine Environment Microfiber Contamination: Global Patterns and the Diversity of Microparticle Origins. Environ. Pollut. 237, 275–284. doi:10.23912/9781911396796-3845
Belzagui, F., Gutiérrez-Bouzán, C., Álvarez-Sánchez, A., and Vilaseca, M. (2020). Textile Microfibers Reaching Aquatic Environments: A New Estimation Approach. Environ. Pollut. 265, 114889. doi:10.1016/j.envpol.2020.114889
Bra°te, I. L. N., Bla´zquez, M., Brooks, S. J., and Thomas, K. V. (2018). Weathering Impacts the Uptake of Polyethylene Microparticles from Toothpaste in Mediterranean Mussels (m. galloprovincialis). Sci. Total Environ. 626, 1310–1318. doi:10.1016/j.scitotenv.2018.01.141
Browne, M. A., Crump, P., Niven, S. J., Teuten, E., Tonkin, A., and Galloway, T. (2011). Accumulation of Microplastic on Shorelines Woldwide: Sources and Sinks. Environ. Sci. Technol. 45, 9175–9179. doi:10.1021/es201811s
Cauwenberghe, L. V., Vanreusel, A., Mees, J., and Janssen, C. R. (2013). Microplastic Pollution in Deep-Sea Sediments. Environ. Pollut. 182, 495–499. doi:10.1016/j.envpol.2013.08.013
Chen, C., Liu, H., and Beardsley, R. C. (2003). An Unstructured Grid, Finite-Volume, Three-Dimensional, Primitive Equations Ocean Model: Application to Coastal Ocean and Estuaries. J. Atmos. Oceanic Technol. 20, 159–186. doi:10.1175/1520-0426(2003)020<0159:AUGFVT>2.0.CO;2
Cochrane, S., and Evenset, A. (2020). “Resipientundersøkelse I Adventfjorden, 2020. Vurdering Av Kjemiske Og Biologiske Forhold,”. Tech. Rep. 2020 62020.01, Akvaplan-NIVA.
Cole, M., Liddle, C., Consolandi, G., Drago, C., Hird, C., Lindeque, P. K., et al. (2020). Microplastics, Microfibres and Nanoplastics Cause Variable Sub-lethal Responses in Mussels (mytilus spp.). Mar. Pollut. Bull. 160, 111552. doi:10.1016/j.marpolbul.2020.111552
Cole, M., Lindeque, P., Fileman, E., Halsband, C., and Galloway, T. S. (2015). The Impact of Polystyrene Microplastics on Feeding, Function and Fecundity in the marine Copepod calanus Helgolandicus. Environ. Sci. Technol. 49, 1130–1137. doi:10.1021/es504525u
Cole, M., Lindeque, P., Fileman, E., Halsband, C., Goodhead, R., Moger, J., et al. (2013). Microplastic Ingestion by Zooplankton. Environ. Sci. Tech. 47, 6646–6655. doi:10.1021/es400663f
Davison, P., and Asch, R. (2011). Plastic Ingestion by Mesopelagic Fishes in the north pacific Subtropicalgyre. Mar. Ecol. Prog. Ser. 432, 173–180. doi:10.3354/meps09142
Desforges, J.-P. W., Galbraith, M., and Ross, P. S. (2015). Ingestion of Microplastics by Zooplankton in the Northeast Pacific Ocean. Arch. Environ. Contam. Toxicol. 69, 320–330. doi:10.1007/s00244-015-0172-5
Evenset, A., Ranneklev, S., Leikvin, Ø., Cochrane, S., Oug, E., and Borgersen, G. (2017). “Adventfjorden Som Resipient,”. Tech. rep., Akvaplan-niva.
Falco, F. D., Cocca, M., Avella, M., and Thompson, R. C. (2020). Microfiber Release to Water, via Laundering, and to Air, via Everyday Use: A Comparison between Polyester Clothing with Differing Textile Parameters. Environ. Sci. Tech. 54, 3288–3296. doi:10.1021/acs.est.9b06892
Fang, C., Zheng, R., Zhang, Y., Hong, F., Mu, J., Chen, M., et al. (2018). Microplastic Contamination in Benthic Organisms from the Arctic and Sub-arctic Regions. Chemosphere 209, 298–306. doi:10.1016/j.chemosphere.2018.06.101
Gago, J., Carretero, O., Filgueiras, A., and Vinas, L. L. (2018). Synthetic Microfibers in the marine Environment: A Review on Their Occurrence in Seawater and Sediments. Mar. Pollut. Bull. 127, 365–376. doi:10.1016/j.marpolbul.2017.11.070
Gall, S., and Thompson, R. (2015). The Impact of Debris on marine Life. Mar. Pollut. Bull. 92, 170–179. doi:10.1016/j.marpolbul.2014.12.041410
Gies, E. A., LeNoble, J. L., Noe¨l, M., Etemadifar, A., Bishay, F., Hall, E. R., et al. (2018). Retention of Microplastics in a Major Secondary Wastewater Treatment Plant in Vancouver, Canada. Mar. Pollut. Bull. 133, 553–561. doi:10.1016/j.marpolbul.2018.06.006
Glahder, C., Fox, T., Hiibner, C. E., Madsen, J., and Tombre, I. (2006). Pre-nesting Site Use of Satellitetransmitter Tagged Svalbard Pink-Footed Geese anser Brachyrhynchus. Ardea 94, 679–690.
Gooday, A. J., Bowser, S. S., Cedhagen, T., Cornelius, N., Hald, M., Korsun, S., et al. (2005). Monothala-mous Foraminiferans and Gromiids (Protista) from Western Svalbard: A Preliminary Survey Published in Collaboration with the university of Bergen and the Institute of Marine Research, Norway, and the marine Biological Laboratory, University of Copenhagen, Denmark. Mar. Biol. Res. 1, 290–312. doi:10.1080/17451000510019150
Grbic´, J., Helm, P., Athey, S., and Rochman, C. M. (2020). Microplastics Entering Northwestern lake Ontario Are Diverse and Linked to Urban Sources. Water Res. 174, 115623. doi:10.1016/j.watres.2020.115623
Holte, B., Dahle, S., Gulliksen, B., and Næs, K. (1996). Some Macrofaunal Effects of Local Pollution and Glacier-Induced Sedimentation, with Indicative Chemical Analyses, in the Sediments of Two Arctic Fjords. Polar Biol. 16, 549–557. doi:10.1007/bf0232905110.1007/s003000050088
Koziorowska, K., Kulin´ski, K., and Pempkowiak, J. (2016). Sedimentary Organic Matter in Two Spitsbergen Fjords: Terrestrial and marine Contributions Based on Carbon and Nitrogen Contents and Stable Isotopes Composition. Continental Shelf Res. 113, 38–46. doi:10.1016/j.csr.2015.11.010
Kuklinski, P., Berge, J., McFadden, L., Dmoch, K., Zajaczkowski, M., Nygård, H., et al. (2013). Seasonality of Occurrence and Recruitment of Arctic marine Benthic Invertebrate Larvae in Relation to Environmental Variables. Polar Biol. 36, 549–560. doi:10.1007/s00300-012-1283-3
Levitan, M. A., Levchenko, O. V., Murdmaa, I. O., Peresypkin, V. I., Roshchina, I. A., and Tolmacheva, A. V. (2008). History of Sedimentation in Isfjord (Western Spitsbergen). Lithology Mineral. Resource 43, 520–541. doi:10.1134/s0024490208060023
Lots, F. A., Behrens, P., Vijver, M. G., Horton, A. A., and Bosker, T. (2017). A Large-Scale Investigation of Microplastic Contamination: Abundance and Characteristics of Microplastics in European beach Sediment. Mar. Pollut. Bull. 123, 219–226. doi:10.1016/j.marpolbul.2017.08.057
Lusher, A. L., Tirelli, V., O’Connor, I., and Officer, R. (2015). Microplastics in Arctic Polar Waters: the First Reported Values of Particles in Surface and Sub-surface Samples. Scientific Rep. 5. 14947. doi:10.1038/srep14947
Lusher, A., McHugh, M., and Thompson, R. (2013). Occurrence of Microplastics in Thegastrointestinal Tract of Pelagic and Demersal Fish from the English Channel. Mar. Pollut. Bull. 67, 94–99. doi:10.1016/j.marpolbul.2012.11.028
Majewski, W., and Zajaczkowski, M. (2007). Benthic Foraminifera in Adventfjorden, Svalbard: Last 50 Years of Local Hydrograpic Changes. J. Foraminiferal Res. 37, 107–124. doi:10.2113/gsjfr.37.2.107
Mathalon, A., and Hill, P. (2014). Microplastic Fibers in the Intertidal Ecosystem Surrounding Halifax Harbor, Nova Scotia. Mar. Pollut. Bull. 81, 69–79. doi:10.1016/j.marpolbul.2014.02.018
Mintenig, S. M., Int-Veen, I., Loder, M. G. J., Primpke, S., and Gerdts, G. (2017). Identification of Microplastic in Effluents of Wastewater Treatment Plants Using Focal Plane Array-Based Micro-fourier-transform Infrared Imaging. Water Res. 108, 365–372. doi:10.1016/j.watres.2016.11.015
Moore, C. J. (2008). Synthetic Polymers in the marine Environment: A Rapidly Increasing, Long-Term Threat. Environ. Res. 108 (2), 131–139. doi:10.1016/j.envres.2008.07.025
Napper, I. E., Barrett, A. C., and Thompson, R. C. (2020). The Efficiency of Devices Intended to Reduce Microfibre Release during Clothes Washing. Sci. Total Environ. 738, 140412. doi:10.1016/j.scitotenv.2020.140412
Napper, I. E., and Thompson, R. C. (2016). Release of Synthetic Microplastic Plastic Fibres from Domestic Washing Machines: Effects of Fabric Type and Washing Conditions. Mar. Pollut. Bull. 112, 39–45. doi:10.1016/j.marpolbul.2016.09.025
Roblin, B., and Aherne, J. (2020). Moss as a Biomonitor for the Atmospheric Deposition of Anthropogenic Microfibres. Sci. Total Environ. 715, 136973. doi:10.1016/j.scitotenv.2020.136973
Røed, L. P., and Kristensen, N. M. (2013). “The Triply Nested Model System (BaSIC Technical Report No. 1),”. Tech. rep., met.no.
Ross, P. S., Chastain, S., Vassilenko, E., Etemadifar, A., Zimmermann, S., Quesnel, S.-A., et al. (2021). Pervasive Distribution of Polyester Fibres in the Arctic Ocean Is Driven by Atlantic Inputs. Nat. Commun. 12. doi:10.1038/s41467-020-20347-1
Singh, R. P., Mishra, S., and Das, A. P. (2020). Synthetic Microfibers: Pollution Toxicity and Remediation. Chemosphere 257, 127199. doi:10.1016/j.chemosphere.2020.127199
Suaria, G., Achtypi, A., Perold, V., Lee, J. R., Pierucci, A., Bornman, T. G., et al. (2020). Microfibers in Oceanic Surface Waters: A Global Characterization. Sci. Adv. 6 (23), eaay8493. doi:10.1126/sciadv.aay8493
Turner, S., Horton, A. A., Rose, N. L., and Hall, C. (2019). A Temporal Sediment Record of Microplastics in an Urban lake, London, UK. J. Paleolimnology 61, 449–462. doi:10.1007/s10933-019-00071-7
van Sebille, E., Wilcox, C., Lebreton, L., Maximenko, N., Hardesty, B. D., van Franeker, J. A., et al. (2015). A Global Inventory of Small Floating Plastic Debris. Environ. Res. Lett. 10, 124006. doi:10.1088/1748-9326/10/12/124006
Vereide, E. H. (2019). “Seasonal Zooplankton Community Patterns along a Gradient from Land to Sea in Isfjorden, Svalbard,”. Master’s thesis (Norway: University of Oslo).
Vroom, R. J., Koelmans, A. A., Besseling, E., and Halsband, C. (2017). Aging of Microplastics Promotes Their Ingestion by marine Zooplankton. Environ. Pollut. 231, 987–996. doi:10.1016/j.envpol.2017.08.088
Weber, J. E. H., and Ghaffari, P. (2021). Lagrangian Wave Drift in an Anisotropic Porous Layer. Environmental Fluid Mechanics (submitted).
Welden, N. A., and Cowie, P. R. (2017). Degradation of Common Polymer Ropes in a Sublittoral marine Environment. Mar. Pollut. Bull. 118, 248–253. doi:10.1016/j.marpolbul.2017.02.072
Wesławski, J. M., Kendall, M. A., Włodarska-Kowalczuk, M., Iken, K., Kedra, M., Legezynska, J., et al. (2010). Climate Change Effects on Arctic Fjord and Coastal Macrobenthic Diversity-Observations and Predictions. Mar. Biodiversity 41, 71–85. doi:10.1007/s12526-010-0073-9481
Winkelmann, D., and Knies, J. (2005). Recent Distribution and Accumulation of Organic Carbon on the continental Margin West off Spitsbergen. Geochem. Geophys. Geosystems 6, n/a. doi:10.1029/2005gc000916
Woodall, L. C., Sanchez-Vidal, A., Canals, M., Paterson, G. L., Coppock, R., Sleight, V., et al. (2014). The Deep Sea Is a Major Sink for Microplastic Debris. R. Soc. Open Sci. 1, 140317. doi:10.1098/rsos.140317
Keywords: microplastic fiber, plankton, benthos, FVCOM model, encounter risk, arctic fjord, hydrodynamic model, waste water effluent
Citation: Herzke D, Ghaffari P, Sundet JH, Tranang CA and Halsband C (2021) Microplastic Fiber Emissions From Wastewater Effluents: Abundance, Transport Behavior and Exposure Risk for Biota in an Arctic Fjord. Front. Environ. Sci. 9:662168. doi: 10.3389/fenvs.2021.662168
Received: 08 February 2021; Accepted: 20 May 2021;
Published: 07 June 2021.
Edited by:
Rachel Hurley, Norwegian Institute for Water Research (NIVA), NorwayReviewed by:
Isaac Dennis Amoah, Durban University of Technology, South AfricaGiuseppe Suaria, National Research Council (CNR), Italy
Copyright © 2021 Herzke, Ghaffari, Sundet, Tranang and Halsband. This is an open-access article distributed under the terms of the Creative Commons Attribution License (CC BY). The use, distribution or reproduction in other forums is permitted, provided the original author(s) and the copyright owner(s) are credited and that the original publication in this journal is cited, in accordance with accepted academic practice. No use, distribution or reproduction is permitted which does not comply with these terms.
*Correspondence: Dorte Herzke, ZGhlQG5pbHUubm8=