 George G. Ndiritu1,2*
 Taita Terer2
 Peter Njoroge3
 Veronica M. Muiruri4
 Edward L. Njagi3Gilbert Kosgei3Laban Njoroge3
 Peris W. Kamau5
 Patrick K. Malonza3
 Mary Muchane5Joseph Gathua3
 Dickens Odeny2
 David Courtemanch6
- 1School of Natural Resources and Environmental Studies, Karatina University, Karatina, Kenya
- 2Centre for Biodiversity, National Museums of Kenya, Nairobi, Kenya
- 3Zoology Department, National Museums of Kenya, Nairobi, Kenya
- 4Earth Sciences Department, National Museums of Kenya, Nairobi, Kenya
- 5Botany Department, National Museums of Kenya, Nairobi, Kenya
- 6The Nature Conservancy, Brunswick, ME, United States
The biological condition gradient (BCG), a scientific framework that describes the change in ecosystem characteristics in response to human-induced levels of stressors, was modified and used to characterize watershed habitats in the Upper Tana River watershed, Kenya. The inbuilt utilities of BCG, including its simplicity, versatility, and its robust nature, allowed its use by seven taxonomic groups of macroinvertebrates, diatoms, fish, herpetofauna (amphibians and reptiles), plants, macrofungi, and birds to assess and monitor landscape conditions in both terrestrial and aquatic habitats. The biological data were described using taxa abundance distribution measures followed by multivariate analyses to determine their relationship with water or soil quality and thereafter assessment of taxa tolerant levels in response to environmental stress and disturbances. Preliminary findings reported that the taxonomic groups complemented each other, with each taxonomic group reliably assessing ecological conditions to a certain degree that supported assigning all 36 sampled sites into BCG tiers. The BCG models developed for all taxonomic groups assisted in the identification and selection of taxa indicating varying levels of landscape conditions. These taxa, referred to as flagship or indicator taxa, assist in simplifying the BCG model and, hence, are possible for use by parataxonomists or ordinary citizens to assess and monitor the ecological health of habitats under consideration. Furthermore, the capability of BCG models to assess landscape conditions shows how they can be used to identify important habitats for conservation, direct investment for restoration, and track progress.
Introduction
The development of a scientific-based environmental assessment and biomonitoring framework that is simple and robust enough for use by the general public remains a major limitation for sustainable management of ecosystems (Graham et al., 2004). Such a framework should be usable by the general population to monitor the ecological health of the environment, including having clear sustainable management targets to be achieved during rehabilitation and restoration initiatives (Leigh et al., 2019). The history of development and use of biological indicators show their use started with the Saprobien System (SS) concept in the early 1900s, which employed benthic macroinvertebrates and planktonic plants and animals as indicators of organic loading and low dissolved oxygen in aquatic ecosystems (Beck, 1954; Pantle and Buck, 1955; Vollenweider, 1968; Davis, 1995). The SS described the trophic state of a lake by classifying the ecological condition status along a disturbance response gradient due to pollution from human and natural influences. Today, it has evolved into indices of biotic integrity (IBIs) that are based on indices including community structure, richness, dominance and abundances as measures of pollution effects (e.g., Wilhm and Dorris, 1966; Karr, 1981; Davis 1995; Hawkins, 2006), and multivariate indices that combine weighted effects of the variates to predict membership in different water quality classes (e.g., Davies et al., 2016). Both multimetric and multivariate models use knowledge of species’ natural history traits to express ecosystem changes in response to increasing levels of stressors. These ecosystem gradient models use undisturbed or pristine habitat conditions as a reference point against arrays of habitats or sites experiencing varying levels of disturbances and are validated by actual measurement of environment variables.
One biomonitoring framework that can be simplified and used for the assessment of ecological conditions is the United States Environmental Protection Agency’s Biological Condition Gradient (BCG; Davies and Jackson, 2006; USEPA, 2016). The BCG is grounded on the concepts of stress ecology articulated by Odum et al. (1979), Odum (1985), Rapport et al. (1985), and Cairns et al. (1993). The BCG starts by describing the biological condition in natural or minimal disturbed habitats and the expected changes in biological conditions along a stressor gradient caused by human-induced environmental changes. Along this disturbance gradient, assemblages of taxa are selected and used to describe ecological conditions for the sites. The original BCG was developed based on common patterns of biological response to stressors observed empirically by aquatic biologists and ecologists from different geographic areas in the United States (Courtemanch et al., 1989; Courtemanch, 1995; Yoder and Rankin, 1995; Davies and Jackson, 2006). Using the practical experience of a diverse group of aquatic scientists from different biogeographic areas and independent of specific methods of assessment, the BCG is a heuristic model based on generalized observable changes in the aquatic community that can be used as a common language expressing habitat condition and change (Davies and Jackson, 2006; USEPA, 2016). The USEPA has extended the use of the BCG concept to other aquatic habitats including coral reefs, estuaries, and mangroves.
The initial use of SS, IBIs, and BCG was primarily for the monitoring and assessment of aquatic ecosystems. However, the strong links that exist between watersheds and water quality in wetlands (Masese et al., 2012; Minaya et al., 2013) suggest ecological conditions in terrestrial catchments can be used to describe the health of wetlands. As in aquatic habitats, changes in terrestrial ecological components of species composition, diversity, and ecosystems are likely to be reflected in ecosystem condition changes due to increasing levels of stress and disturbances. Therefore, the frameworks of using biological indices in monitoring and assessment of wetlands can be extended and applied in associated watersheds through using terrestrial biological components to describe ecosystems’ health. The approach of integrating both aquatic and terrestrial conditions is expected to promote holistic and integrated sustainable management of landscapes that is presently being promoted as a river to the basin to the ecological network (Ishiyama et al., 2017).
Methods
To monitor ecological conditions of aquatic and their linked terrestrial ecosystems in the Upper Tana River (UTR) watershed, this research settled on adapting the BCG framework, which has utilities that can be used to overcome challenges of obtaining and interpreting complex scientific data for sustainable management of waters resources (Davies et al., 2016). First, the six BCG tiers were categorized and then linked to the expected set of taxonomic group responses using a subset of the BCG attributes. This was followed by the collection of biological data along disturbance gradients in both aquatic and terrestrial ecosystems. Data collected were used to describe ecological conditions of studied sites for aquatic and terrestrial taxonomic groups of macroinvertebrates, diatoms, fish, herpetofauna, vegetation, macrofungi, and birds. Relevant attributes used to develop the BCG tiers in UTR were 1) historically documented, sensitive, long-lived, or regionally endemic taxa, 2) sensitive (intolerant) taxa, 3) intermediate tolerant taxa, 4) tolerant taxa, and 5) presence of non-native species. Thereafter, collected biological data were used to assess the ecological conditions for each study site and then appropriate sustainable management interventions were proposed.
Study Area
The UTR watershed is the upper part of the Tana River Catchment and is situated in Central Kenya. It lies between latitudes 0°30′N and 2°30′S and longitudes 37°00′E and 41°00′E. This study was undertaken in selected major rivers in Nyeri and Murang’a counties in the UTR (Figure 1). Both counties have an area of 4,919 km2 (with Nyeri having an area of 2,361 km2 and Murang’a with 2,558 km2) and a human population of 1.82 million with densities of 228 and 429 persons per km2 in Nyeri and Murang’a, respectively (KNBS Kenya National Bureau of Statistics, 2019). A large percentage of the land area lies between 914 and 3,000 m ASL, though a small portion comprises the high-elevation areas of Mount Kenya (3,000–5,199 m) and Aberdare Range (3,000–3,999 m). The area has an equatorial climate with two wet seasons (March–May and October–December) separated by dry seasons. The mean annual rainfall in low-lying areas is 790 mm, mid-elevations is 1,500 mm, and high-elevations is 2000 mm, while monthly mean temperature ranges from 16–20°C. Both rainfall and temperatures are functions of elevations, and the area has three major agroecological zones (AEZs) that are defined by climate, landform and soils, and land cover (FAO, 1996). The AEZ 1 represents alpine zones in the high-elevation areas, and AEZ 2 represents high-potential zones and AEZ 3 represents medium-potential zones, which are both found in the mid-elevation to low-lying areas. For instance, the AEZ 1 was confined to mountains and immediate surroundings acting as a watershed, whereas AEZ 2 was found in high-potential areas supporting forestry, tea, livestock rearing, and tourism, while AEZ 3 supported agricultural activities of coffee, food crops, horticulture, and livestock rearing. Approximately 80% of the population depends on subsistence agriculture for livelihoods and a majority of households have small- to medium-sized farm (0.5–2 ha). Agriculture is mainly rain-fed, but recently irrigation farming is becoming more practiced due to erratic and unreliable rains. The mountainous settings are a good source of fast-flowing rivers that have created topography with steep slopes and deep valleys that influence local climate and types of crops grown. The steep topographies are prone to gulley erosion and landslides. The major rivers flowing from Mt Kenya are Sagana, Thegu, and Nairobi and those from Aberdare Ranges are Honi, Muringato, Chania (in Nyeri County), Gura, Mathioya, Maragua, Thika, and Chania (bordering Murang’a and Kiambu counties). The area geology is of volcanic rocks of the Pleistocene age and Achaean type that have weathered to give fertile soils suitable for agriculture activities. The exploitation of land and water resources has resulted in the degradation of the UTR, and the consequences are an environmental crisis that is responsible for the water insecurity issues that now threaten the social, political, and economic systems in the region (MEMR, 2012). In addition, the area is endowed with small- to medium-sized wetlands that are experiencing different levels of human use that are associated with their degradation and loss (Sakané et al., 2011).
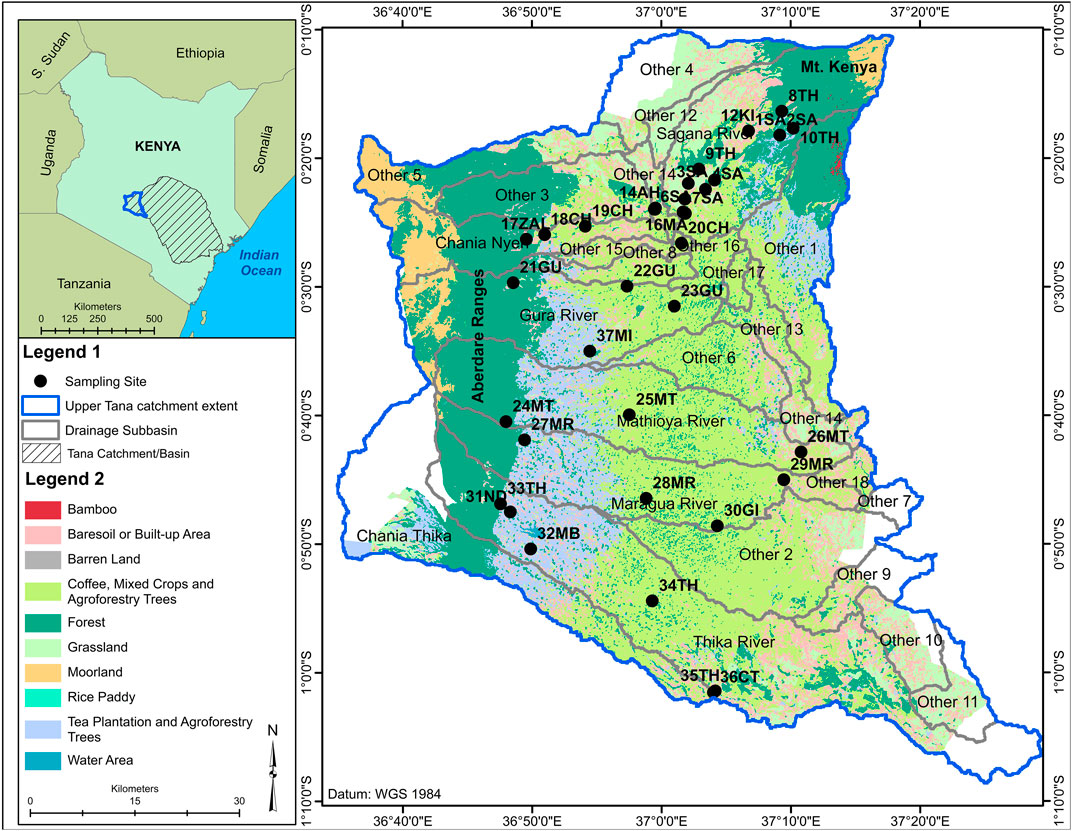
FIGURE 1. A map of the Upper Tana River watershed showing sampling sites and the six major sub-catchments of rivers Sagana, Chania (in Nyeri), Gura, Mathioya, Maragua, and Thika. Land use and cover represent levels of disturbances with forests, and tea is the least disturbed area, coffee and mixed agriculture are moderately disturbed areas, while intensive horticulture and livestock farming indicate severely disturbed areas. For full names of sampling sites’ abbreviations, see Table 1.
Sampling Design
Data on soil, water quality, and biological components were collected in the six major sub-catchments of Rivers Sagana, Chania (in Nyeri), Gura, Mathioya, Maragua, and Thika in the UTR catchment (Figure 1). For each sub-catchment, a minimum of three sampling sites were established along a disturbance gradient to represent undisturbed and then moderately to severely human-impacted areas. Overall stratified random sampling was used to select 36 permanent sites (9 sites in undisturbed, 19 in moderately disturbed, and 9 in severally disturbed areas). Sampling sites in undisturbed areas were located in the river headwaters, which had minimal human activities, and major land uses were natural forests and adjacent tea plantations. Moderately disturbed areas were found in midsections of the sub-catchments, and major types of land use were tea, coffee, zero-grazing of livestock, and moderate horticulture. Severely disturbed areas were found in the lower section of the sub-catchments, and major human activities were intensive horticultural farming and grazing of livestock in lowland floodplains and wetlands. The location coordinates of each sampling site were made using portable GPS and later aided in the mapping of species distribution and water parameters. Sampling was carried out during the end of the dry season (August–October, 2018). During this sampling regime, it was not possible to collect data for biological, water, and soil components in all sites due to logistical constraints especially time. However, efforts were made to have all components sampled in all three different land-use/-cover zones. For instance, all 36 sites were sampled for water quality and diatoms, fish were sampled in 30 sites, macroinvertebrates were sampled in 24 sites, soil parameters and macrofungi were sampled in 21 sites, vegetation was sampled in 17 sites, herpetofauna was sampled in 16 sites, and birds were sampled in 10 sites (Table 1).
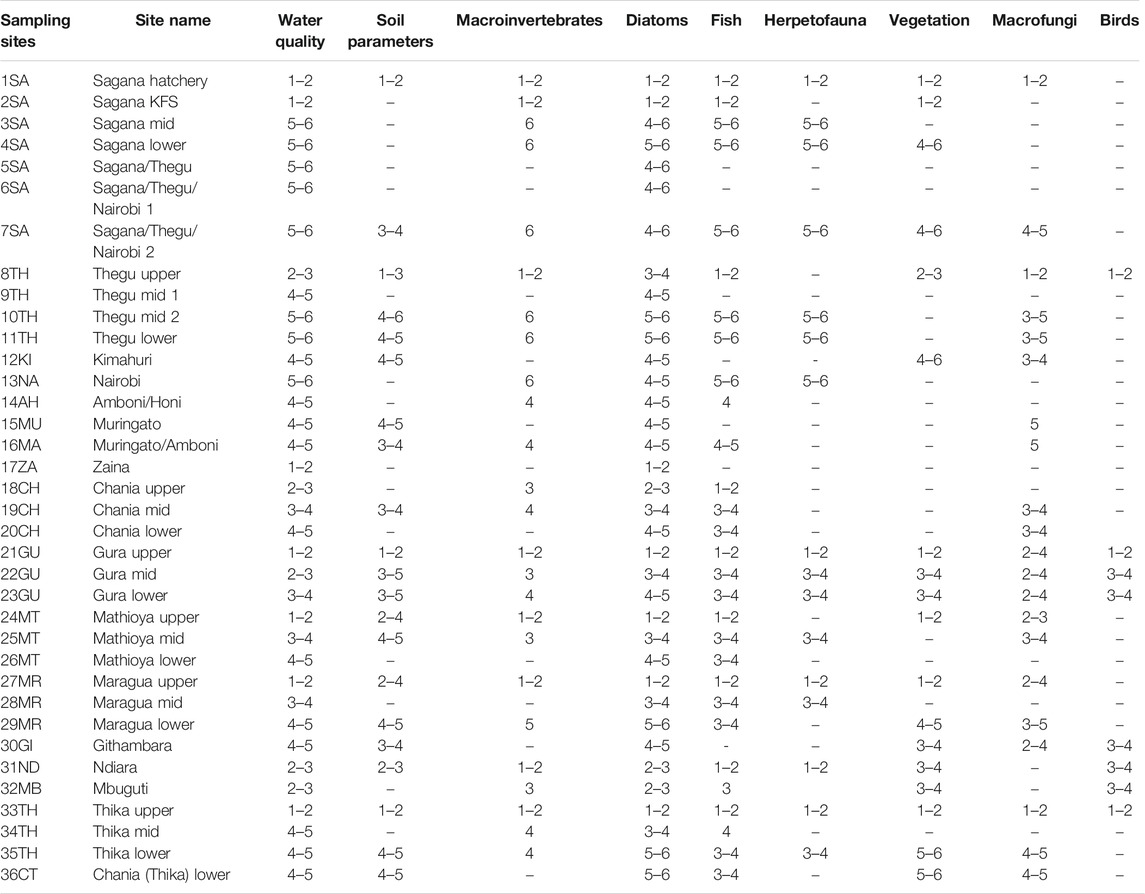
TABLE 1. Characterizing sampling sites into tiers using water quality, soil parameters, and various taxonomic groups (−) = signify no data or inadequate data.
Water Quality and Flow Regimes
Electric conductivity (EC) and turbidity were measured in situ using portable meters (Hanna Instruments models, i.e., HI 93703d and HI 99300, respectively). Total nitrogen (TN), total phosphates (TP), and chemical oxygen demand (COD) were determined using gravimetric methods using UV-spectroscopy and natural organic matter (NOM) with a UV-light emitting diode. Water flow velocity was measured using the float method (Harrelson, 1994; Davids et al., 2019). The selection of sampled water quality parameters determined was informed by our research experience in similar habitats in tropics on those known to be affected by effects of land-use and -cover changes (Ndaruga et al., 2004; Ndiritu et al., 2006).
Macroinvertebrates
Samples were collected in the riffles and runs using a 500-µm mesh size dip net. The runs and riffles’ biotopes were preferred because they are the most abundant and productive biotopes in the rivers’ headwaters and are known to support a great diversity of stress-sensitive taxa such as the mayflies, caddisflies, and stoneflies (Dallas, 2021). Also, it is common for rapid assessment protocols to go for a single or few biotopes. Samples were taken by dipping, jabbing, and sweeping upstream for 2 min (Barbour, 1999). Collected samples were sorted in the field, beginning with the removal of large debris, then picking all available specimens using forceps, and putting them in vials with 70% ethanol. In each site, a final simple random sampling was done from any other available biotopes (microhabitats), and the sample was combined in a separate vial for the development of a checklist. Taxonomic identification was carried out in the Invertebrate Zoology Laboratory in the National Museums of Kenya (NMK) based on morphospecies concept using standard monographs and identification keys (Day and de Moor, 2003; De Moor et al., 2003; Stals and Moor, 2007; Griffiths et al., 2015). Identification was done to order and family levels that are acceptable levels of taxonomic resolution for rapid macroinvertebrates’ assessment purposes (Graham et al., 2004). Thereafter, representative specimens were vouchered and stored permanently at the Invertebrates’ Collection in NMK.
Diatoms
Samples were collected from cobbles (boulders) that were close to the riverbank from riffles (Ndiritu et al., 2006). The flowing water at the edge of the mainstream (littoral zone) is assumed to be of the same physical and chemical quality as that in the mainstream. Streams and rivers considered were from order 1–3 and most had high flow velocities that are known to reduce water quality variabilities within the cross section of a given river reach (Rode and Suhr, 2007). Diatom samples were collected from all sites where water quality variables were collected.
Fish
Different methods were applied to sample fish depending on the suitability of the river habitats. These included hooks and line, monofilament gillnets, dip nets, and direct observations (Côté and Perrow, 2013). More information on fish was obtained by interviewing the local community within the study sites as well as checking fish collections and records at the Ichthyology Section of the NMK.
Herpetofauna: Amphibians and Reptiles
A timed limited search (TLS) method for a one-person hour was carried out in different amphibian and reptile microhabitats in the 16 sampled sites (Malonza et al., 2011). Sampling was done during the daytime, which means amphibians especially frogs that are active at night were relatively underestimated. However, interviews were conducted in the form of questions about amphibians and reptiles, especially those that are easy to identify and are found in the area, and this aided in increasing the body of data gathered. Local individuals were asked to describe the species and later showed the herpetofauna species pictures available in guide books (Spawls et al., 2002; Channing and Howell, 2006).
Vegetation
Vegetation data were collected in 17 sites targeting forest remnants along the valleys and riverine systems, pine and eucalyptus woodlots, and agricultural areas. In each site, three plots of 10 m × 10 m with 300 m intervals were laid out perpendicular to both sides of the river. The data were enriched with opportunistic surveys along with road networks in farms as well as in areas outside the established study plots. Data were collected on all different plant life forms present including tree, shrubs, lianas, herbs, climbers, and epiphytes, as well as estimations of their cover, abundance, and density. Human impacts and levels of disturbances were also captured. Special attention was also given to the invasive and alien species. Vegetation identification was done using the standard floras and books including Flora of Tropical East Africa (FTEA) for various families and relevant books (Beentje, 1994; Dalitz et al., 2011; Agnew, 2013).
Fungi
Macrofungi assemblages were sampled in riparians zones and watersheds adjacent to established permanent sampling sites. In each of the permanent sampling site, three plots 20 m × 20 m were systematically sampled along a belt transect 300 m × 20 m such that the distances between plots were approximately 100 m, with the first plot located near the river. The collection of macrofungi samples involved the use of standard sampling methods (Mueller et al., 2004). Encountered macrofungi were photographed in situ, and data were recorded on their densities and diversities. Representative fruit bodies were carefully collected, stored, and transported to Mycology Laboratory in the NMK for curation and preservation. The specimen was identified up to genera and species levels according to morphospecies concept using standard monographs (e.g., Harkonen et al., 2003; Ndong, et al. 2011).
Soil Parameters
Soil samples were collected in the same sites as macrofungi and analyzed for soil organic carbon, soluble phosphorus, soil texture, and pathogenic fungi taxa of Phytophora, Fusarium, and Phythium. Three 30 cm deep soil cores were collected in each of the 300 m bell transects and then mixed thoroughly to obtain a composite sample. Soil samples were analyzed following standard methods for tropical soils as described by Anderson and Ingram (1993). Soil electric conductivity was determined in water using a 1:2.5 soil solution ratio. Available phosphorus was measured using the modified Olsen’s method with pH at 8.5, and soil organic carbon was measured according to the routine colorimetric dichromate oxidation method. The soil pathogens Phytophora, Fusarium, and Phythium were isolated from the soil samples and then identified using morphological characteristics of colony motif, shape, and sporangium size scanned under a light microscope at ×400 magnification.
Birds
Three avian sampling methods, namely, point counts, mist netting, and timed species lists, were used. At least 10 point counts were conducted at intervals of 200 m along a 2 km transect (Bennun and Howell, 2002) in each sampling site. Mist netting was used in forested sites to capture the presence of skulking lower canopy and undergrowth species. The timed species counts were used to quickly build a comprehensive species list for each site as well as map species distributions following protocols of the Kenya Bird Map initiative for long-term monitoring of environmental changes at the landscape level (http://kenyabirdmap.adu.org.za/). We examined bird species richness along the condition gradient categorized as undisturbed (tiers 1 and 2), moderately disturbed (tiers 3 and 4), and severely degraded (tiers 5 and 6; Davies and Jackson, 2006). The data were further examined using a simple classification system for East African Forest birds developed by Bennun et al. (1996). The system goes further than a simple species list and detects subtle differences between forest avifauna in both space and time by classifying them based on their forest dependency. Thus, the classification system has three categories. 1) Forest specialists, which are the “true” forest birds’ characteristic of undisturbed forest. 2) Forest generalists, which may occur in undisturbed forest but are also regularly found in forest strips, edges, and gaps. They are likely to be relatively more common there and in the secondary forest than in the interior of intact forest. 3) Forest visitors, which are often recorded in the forest but are not dependent upon it. They are almost always more common in nonforest habitats, where they are most likely to breed. We used proportions of birds in each category in the classification system to develop indices that indicate various forest conditions (see Furness and Greenwood, 1993; Bennun et al., 1996; Bryce et al., 2002).
Data Synthesis and Presentation
To examine patterns in the composition of taxa assemblages in relation to ecological conditions, multivariate approaches of principal component analysis (PCA), detrended correspondence analysis (DCA), and canonical correspondence analysis (CCA) were carried out (ter Braak and Šmilauer, 1999). Before PCA, DCA, and CCA analyses, the distribution model exhibited by all set of data was checked by running a DCA by default to determine whether the data had monotonic or unimodal forms of distribution. Data sets with monotonic distribution have a total length of gradients of less than four, whereas those with more than four are treated as being unimodal. All species data sets displayed unimodal types of distribution and were analyzed using either DCA or CCA, while soil and water quality had monotonic distribution and were analyzed using PCA. The indirect PCA method was used to detect changes in soil and water quality by grouping sites according to environmental conditions. The DCA is unconstrained indirect gradient analysis and grouped sites according to taxa similarities. The biplots are interpreted indirectly by attributing the grouping of species and sites to some environmental factors. The CCA is a constrained direct gradient analysis and elucidates the relationships between biological assemblages of species and their environment (ter Braak et al., 1995). In summary, CCA is multiple linear regression that corrects for spatial autocorrelation by incorporating conditional autoregressive models and randomization test options during analyses. During these analyses, randomized 499 Monte Carlo unrestricted permutation tests under full model were performed to determine which water quality or soil variables exerted significant influences on the distribution of various biological components at p < 0.05, using conditional automatic forwarding options (Lepš and Šmilauer, 2003). Also, the significance of the first ordination axis and all four axes together was tested. During DCA and CCA analyses, rare taxa were excluded (i.e., those that were recorded from only a single site). Meanwhile, some biological components were described using taxa abundance distribution measures of diversities and richness (Magurran 2004).
BCG Development
The development of BCGs for the UTR commenced with the compilation and analysis of available biological data for the seven taxonomic groups. Following the USEPA’s method for BCG development (USEPA, 2016), knowledge and recommendations of experts were compiled during a workshop held in August 2018 during which experts familiar with each of the seven taxonomic groups were tasked to assess and define each of the species’ preferred ecological conditions (Ndiritu et al., 2018). In this workshop, the experts used five taxonomic characteristics or attributes of taxonomic composition and community structure to develop the BCG, which included historically documented, sensitive, long-lived, or regionally endemic taxa, sensitive (intolerant) taxa, intermediate tolerant taxa, tolerant taxa, and non-native or intentionally introduced species (Davies and Jackson, 2006 in USEPA, 2016). The final phase was a field trial collection of data and observations for each of the seven taxonomic groups at some or all of the 36 established permanent sampling sites, and then experts assigning various sampling sites to the six BCG tiers using the species data collected (Davies et al., 2016). The BCG is a descriptive model that interprets changes in ecological conditions in response to human disturbance in six tiers of 1) natural or native condition, 2) minimal changes in the structure of the biotic community and minimal changes in ecosystem function, 3) evident changes in the structure of the biotic community and minimal changes in ecosystem function, 4) moderate changes in the structure of the biotic community and minimal changes in ecosystem function, 5) major changes in the structure of the community, and 6) severe changes in the structure of the biotic community and major loss of ecosystem functions (Figure 2). And to the best of our knowledge, this is the first initiative where the BCG model has been used to assess ecological conditions of habitats outside the USA.
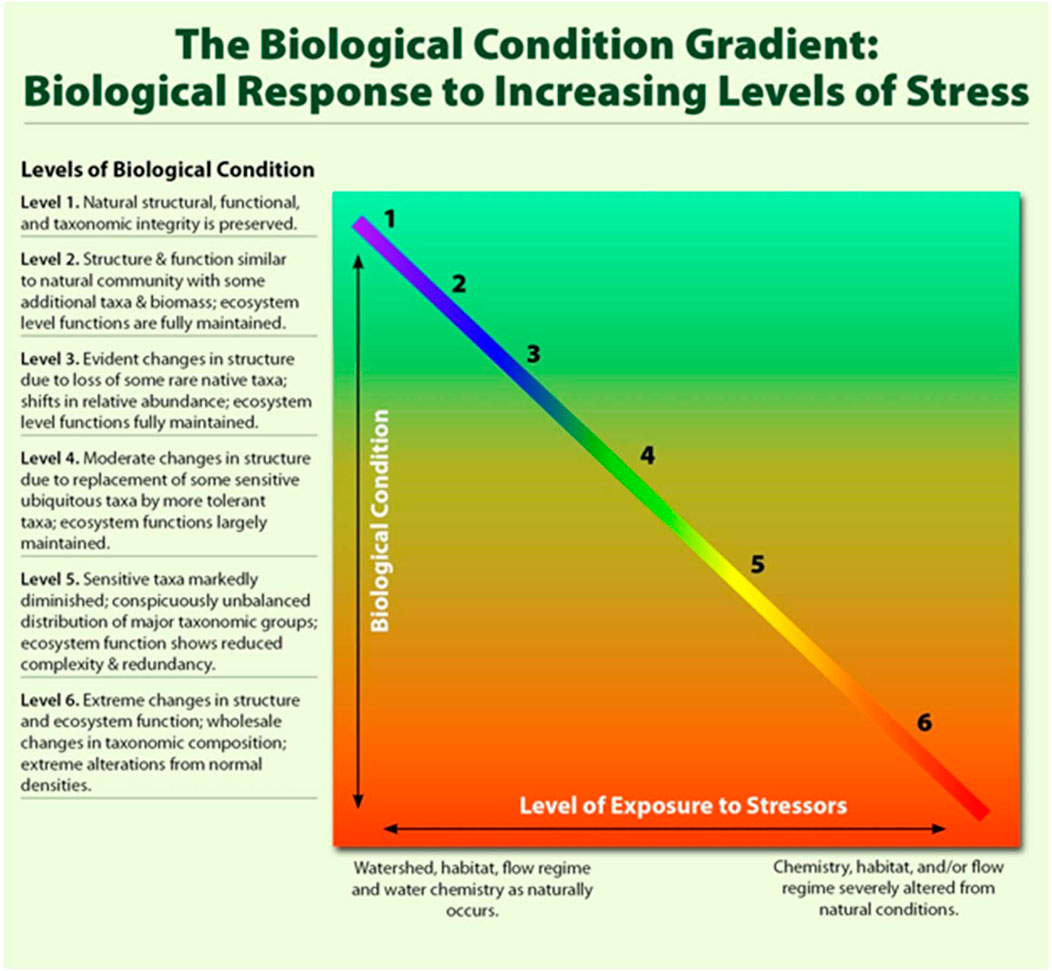
FIGURE 2. Conceptual model of the BCG. Although in reality, the relationship between stressors and their cumulative effects on the biota is likely nonlinear, and the relationship is presented as such to illustrate the concept (adapted from USEPA, 2016).
Results
Bioassessment of Habitats in the UTR Watershed
Characterization of Sites Using Water Quality
Examination of ordination results revealed that water in the Upper Tana River was strongly influenced by conductivity, elevation, turbidity, and discharges (Figure 3). Rivers in the drier zones of Sagana catchments had low discharges but high conductivity, a situation attributed to high water abstraction, drier environments, and land-use changes. Those in Chania, Gura, Mathioya, and Maragu’a catchments were characterized by high turbidity and water discharges in the lower sections, while the small streams in intensively farmed areas had elevated levels of TN, TP, and NOM. The headwater rivers originating from forests in Aberdare were found in higher elevations and with relatively clean water.
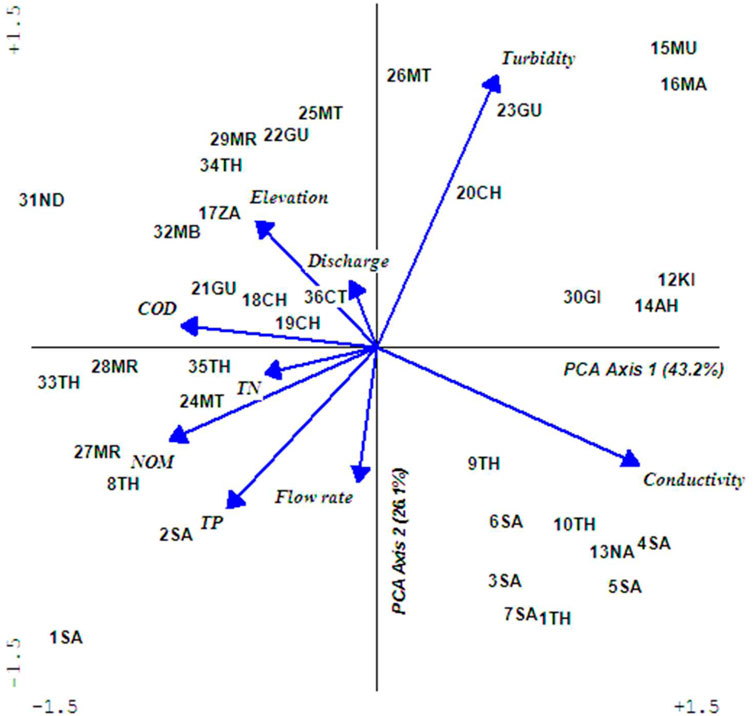
FIGURE 3. A PCA biplot showing the grouping of sampling sites according to water conditions. Abbreviated labels represent TP: total phosphates (mg/L), TN: total nitrogen (mg/L), COD: chemical oxygen demand (mg/L), and NOM: natural organic matter (mg/L). Units used to measure conductivity were (mS/cm), flow rate (m/sec), and discharge (m3/sec). The full names of abbreviated sampling sites is given in Table 1 and original water quality is provided as Supplementary Table S1.
Effects of Water Quality on Macroinvertebrates
The CCA analyses found most significant factors influencing macroinvertebrates were elevation (F = 2.77, p = 0.01), conductivity (F = 1.94, p = 0.01), and discharge (F = 1.84, p = 0.04). The CCA grouped sampling sites along ecological condition gradients (Figure 4). All four CCA axes had a strong relationship between macroinvertebrates and water quality parameters (r = 0.87–0.94) with the first axis having remarkable interaction with elevation and conductivity, the second axis with conductivity and flow rate, and the third axes with water discharges in rivers. A total of 51 macroinvertebrates’ taxa collected from 28 sites were used to determine ecological conditions in rivers and produced interesting findings. Macroinvertebrates associated with undisturbed sites (1SA, 2SA, 8TH, 21GU, 24MT, 27MR, 31IN, and 33TH) representing BCG tiers 1 and 2 were Scirtidae, Limoniidae, Oligoneuridae, Prosopistomatidae, Philopomatidae, and Hydroptilidae (Table 1). Macroinvertebrates somehow separated tiers 3 and 4, with tier 3 comprising sites 18CH, 22GU, 25MT, and 32MB that were characterized by high flow rates, moderate discharges, and turbidity. Indicator taxa were Sperchonidae, Unionicolidae, Potamonautidae, Dixidae, Empididae, Ceratopogonidae, Caenidae, Crambidae, Pleidae, Perlidae, Coenagrionidae, Libellulidae, and Oligochaetes, while tier 4 was represented by sites 14AH, 16MA, 19CH, 23GU, 34TH, and 35TH with high turbidity and discharges, and representative taxa were Arrenuridae, Dytiscidae, Gyrinidae, Muscidae, Ptychopteridae, Baetidae, and Trichorythidae. The lower sections of River Maragua site MR29 was classified as tier 5 with high turbidity and representative taxa were Tabanidae, Gomphidae, and Psephenidae. The mid and lower sections of Rivers Sagana, Thegu, and Nairobi had extremely low water discharge due to water abstraction that caused high conductivity levels in all the sites (3SA, 4SA, 7SA, 10TH, 11TH, and 13NA) and were placed in tier 6. Indicator taxa were Acarina, Ancylini, Psephenidae, Athericidae, and Aeshnidae. Meanwhile, other taxa displayed cosmopolitan distribution and had occasional to frequent abundances in the UTR such as Elmidae, Chironomidae, Simuliidae, Baetidae, Caenidae, Dicercomyzidae, Ephemerythidae, Heptageniidae, Leptophlebiidae, Hydropsychidae, and Leptoceridae.
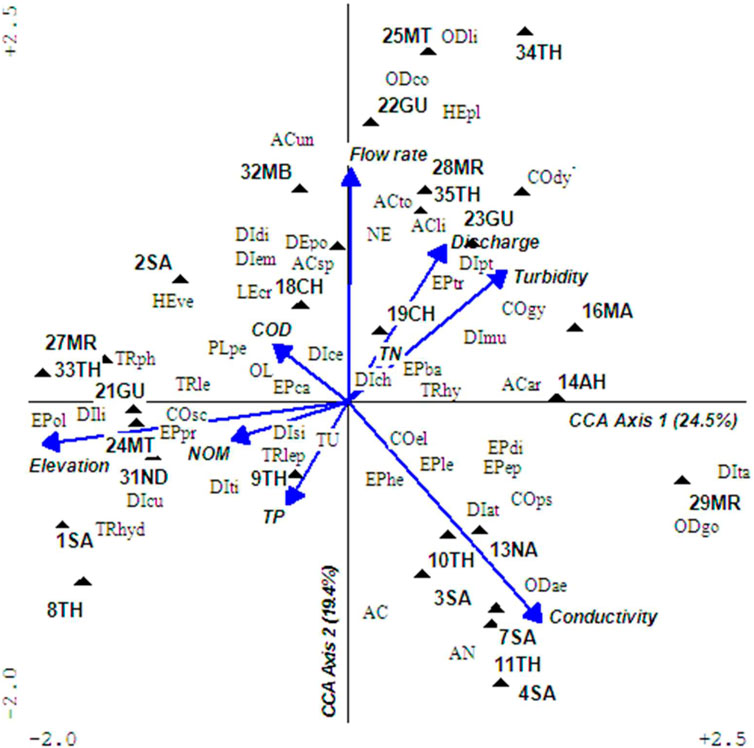
FIGURE 4. A triplot of macroinvertebrates assemblages and water quality during the dry season. The first four CCA axes explained significant relationships between macroinvertebrates and water quality (p = 0.05). Arrow represents water quality parameters and filled triangle sampling sampled sites. The abbreviated four-letter labels signify macroinvertebrates’ taxa with the first two-uppercase letters standing for order and the next two lower case letters for family. Full macroinvertebrates’ taxa names are provided as Supplementary Table S2.
Effects of Water Quality on Diatoms
The CCA found a significant relationship between diatom assemblages and water quality parameters of conductivity (F = 2.92 p = 0.01), elevation (F = 1.92, p = 0.01), and mildly with turbidity (F = 1.64, p = 0.07). Tests of significance of the first and all canonical axes were significant at F = 2.37, p = 0.03 and F = 1.43, p = 0.01, respectively. The interaction between diatoms and water quality axes in the triplots were strong ranging from r = 0.82–0.92. As predicted, diatom assemblages and water parameters grouped sampling sites along ecological condition gradients depending on land-use types, from undisturbed sites in headwaters to severely disturbed in the lower river sections (Figure 5). It was possible to identify flagship diatom species relating to certain key water quality parameters that changed and affected ecological conditions in rivers such as conductivity, elevation, and turbidity. Changes in conductivity and turbidity were attributed to human influences on watersheds, whereas elevation was due to natural influences primarily relating to temperatures. Preliminary findings show that diatoms associated with undisturbed sites representing BCG tiers 1 and 2 were Diploneis ovalis, Cymbella muereli, and Placoneis, moderately disturbed for BCG tiers 3 and 4 were Aulacoseira granulata, Achnathes affinis, A. hungarica, Coconeis placentula, Diatoma elangatum, Gomphonema affinis, G. clevei, G. gracile, G. parvulum, Melanosira varians, Nitzschia sigma, Pleurosira laevis, and Synedra ulna, while those in severely disturbed sites in BCG tiers 5 to 6 were Achnanthes hungarica, Amphora ovalis, Navicula cyptocephala, N. elkab, Nitzschia frustulum, and N. palea. A diatom summary of the description and categorization of sampled sites into the BCG tiers is provided in Table 1.
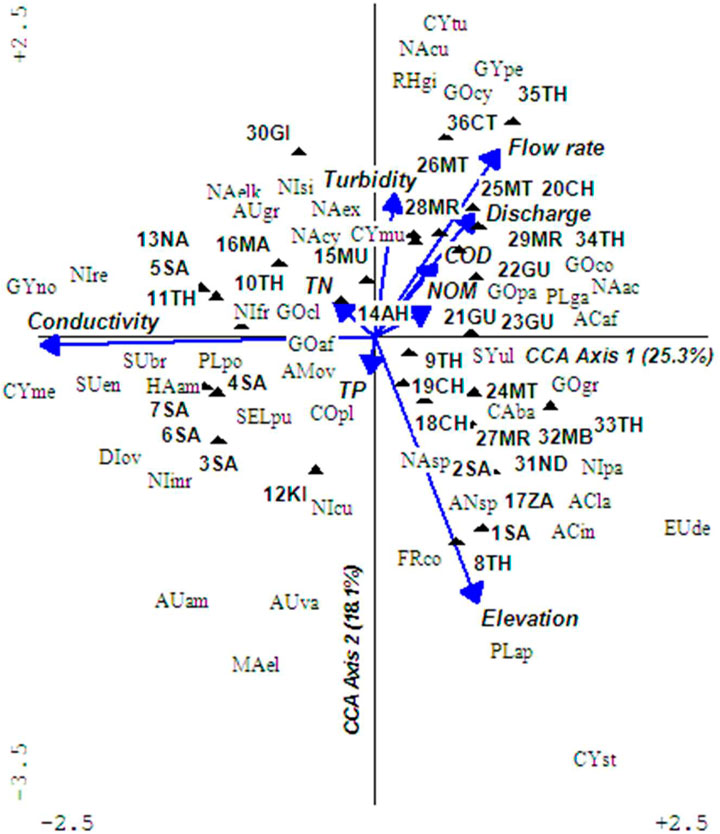
FIGURE 5. A triplot of diatom assemblages found in cobble microhabitat and water quality during the dry season. The first axis and all axis tests returned significant relationships, that is, F = 2.37, p = 0.03 and F = 1.43, p = 0.01, respectively, implying variation of diatoms explained by water quality on the triplot was strongly significant. Arrow represents water quality parameters and filled triangle sampled sites. The abbreviated four-letter labels signify diatoms with the first two upper case letters standing for genus and the next two lower case letters for species. Full diatom species names are provided as Supplementary Table S3.
Fish
A total of 12 fish taxa were recorded from 30 sampling sites. The most common fish taxa were Amphilius grandis that was found in 12 sites, followed by Enteromius kerstenii found in 10 sites, Garra dembensis found in 7 sites, and Oncorhyncus mykiss found in 6 sites, whereas Labeobarbus oxyrhyncus was found in 5 sites and Poecilia reticulata was moderately abundant in 4 sites. The other six species were occasional and in low populations. The CCA grouped sites into several groups in response to ecological conditions and were significantly influenced by elevation (F = 3.8, p = 0.00) and conductivity (F = 2.31, p = 0.03), Figure 6. Undisturbed sites in high-elevation areas consisted of 1SA, 8TH, 18CH, 21GU, 24MT, 27MR, and 33TH, and indicator species were Enteromius paludinosus, Oncorhryncus mykiss, and Salmo trutta (the latter two are introduced species). These sites were classified as tiers 1 and 2. Moderately disturbed sites were found in the mid-elevations where agriculture was the main type of land use and water ecological conditions were primarily influenced by turbidity and nutrients. Sites in this zone were 19GU, 20CH, 22GU, 23GU, 25MT, 26MT, 28MR, 29MR, 35TH, and 36CT, and fish supported were Amphilius grandis, Clarius gariepinus, Chiloglanis brevibarbis, Garra dembensis, Labeo cylindricus, Pseudocrenilabrus multicolor victoriae, Labeobarbus oxyrhyncus, and Poecilia reticulata, and sites were categorized as belonging to tiers 3 and 4. Sites 3SA, 4SA, 7SA, 10TH, 13NA, and 16MA were significantly influenced by conductivity, and the most abundant species found here (Enteromius kerstenii and Amphilius grandis) were infested with ectoparasites. The sites were categorized as severely degraded and were classified as belonging to tiers 5 and 6.
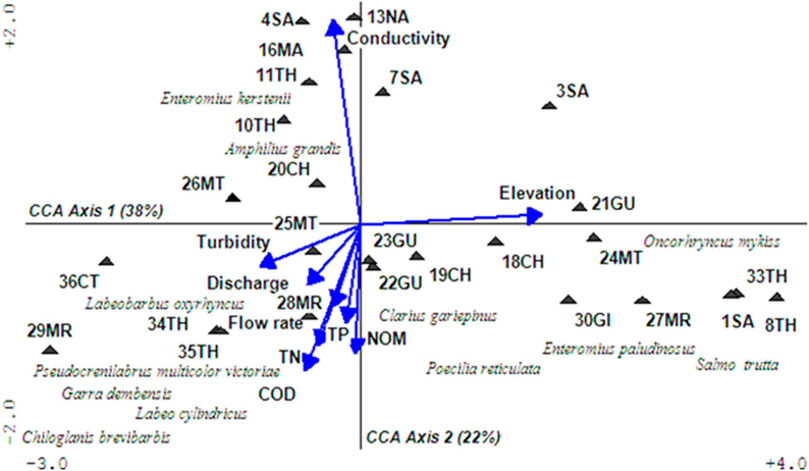
FIGURE 6. CCA triplot of fish and water quality in Upper Tana River Watershed.
Herpetofauna
A total of 15 herpetofauna taxa were found in 28 sites. This was a low number when compared to over 30 known taxa from the area, a situation attributed to the dry season when this group of organisms is generally dormant. In addition, no night searches were done for amphibians when they are most active. Analysis of the DCA biplot indicates that the distribution of taxa was influenced by elevation, land use, and cover (Figure 7). Taxa associated with undisturbed forests sites were found in 1SA, 21GU, 27MR, 31IN, and 33TH which were Adolfus kibonotensis, Amietia nutti, Trioceros hoehnelii, T. jacksonii, and Leptosiaphos kilimensis. Moderately disturbed sites such as 22GU, 23GU, 26MT, 28MR, and 35TH supported occasional to rare species such as Ptychadena mascareniensis, Phrynobatrachus kieniensis, Scherophrys gutturalis, Trachylepis striata, Xenopus borealis, and Phrynobatrachus natalensis. Ptychadena anchietae and Philothamnus battersbyi were the most abundant and widespread species, dominating the most environmentally stressed sites in the UTR watershed of 3SA, 4SA, 7SA, 10TH, 11TH, and 13NA.
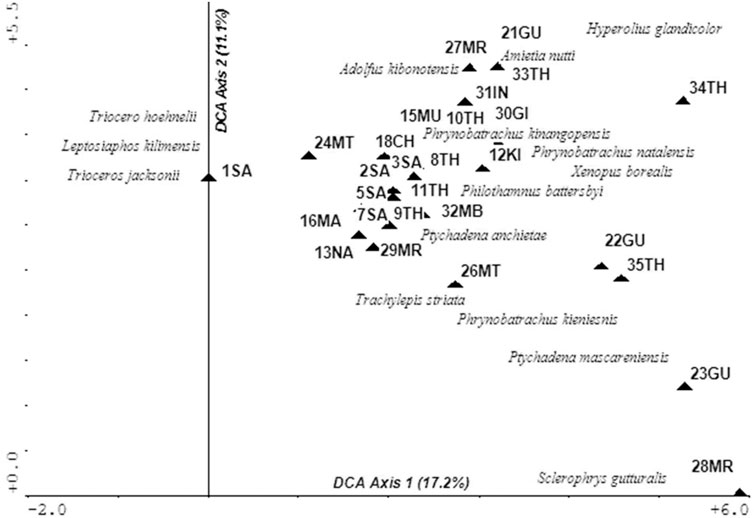
FIGURE 7. DCA biplot of herpertofauna of the Upper Tana River watershed.
Vegetation
Approximately 600 species were recorded from 17 sampling areas in UTR (Figure 8). A relatively high number of species were found in forest areas experiencing mild to severe disturbances in Mts Kenya and Aberdare, which implied species richness was an unreliable measure of forest ecological health. Meanwhile, the ecological conditions were evaluated using taxa composition. Both mountains supported primary and mature secondary forests, were protected, and had minimal human disturbances. Plant taxa recorded were indicators of undisturbed forest conditions and were closed canopy species such as Impatiens tinctoria, Impatiens fischeri, Arisaema mildbraedii, Polystachya cutriformis, Begonia meyeri-johannis, Asplenium rutifolium, Asplenium theciferum, Asplenium hypomelas, Cyathea manniana, Eulophia horsfallii, and Lobelia sp. Most of the trees in closed forests were covered by bryophytes, ferns, and orchids, another good indicator of an undisturbed environment. These sites (1SA, 8TH, 21GU, 24MT, 27MR, and 33TH) are classified as tiers 1 and 2. The midsection sites (22GU, 27MR, and 32MB) occurred in tea and coffee zones, categorized as moderately disturbed belonging to tiers 3 and 4. In addition, dominant taxa found along the riverine were represented by individuals that thrive well in secondary forests such as Neonotonia wightii, Bridelia micrantha, Polystachya cultriformis, and Croton alienus. The lower regions of UTR were dominated by farmlands, pastures, and floodplains that supported weedy species of Achyranthes aspera, Commelina benghalensis, Vernonia lasiopus, Biden pilosa, Ageratum conyzoides, and Tithonia diversifolia. The trees and shrubs included Rhus vulgaris, Maytenus arbutifolia, Croton macrostachyus, and Erythrina abyssinica, whereas the swampy areas were dominated by Typha domingensis, Cyperus dichrostachyus, Ludwigia stolonifera, Lemna gibba, Centella asiatica, and Rumex bequertii. Alien and invasive species were recorded in the disturbed areas and these included Ricinus communis, Verbena bonariensis, Lantana camara, and Datura stramonium.
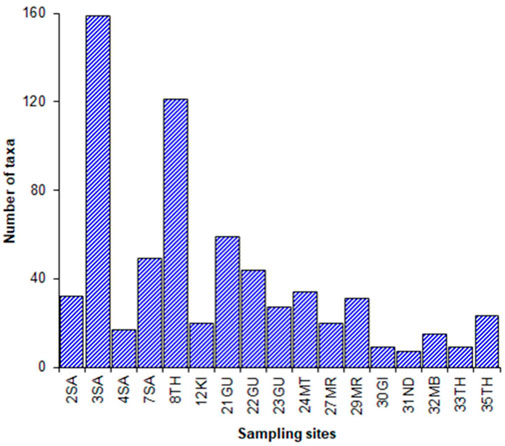
FIGURE 8. The number of vegetation taxa recorded per site in the UTR watershed.
Macrofungi Community and Soil Parameters
Results of PCA using relevant soil parameters grouped sampling sites according to their conditions with SOC and soluble phosphate decreasing downstream (Figure 9A). Similarly, Phytophora and Fusarium abundances increased in degraded agricultural soils, while Phythium was associated with soils with minimal disturbances. A total of 88 genera of macrofungi were recorded from 21 samples in UTR. Further analysis of CCA using 55 genera (that were occasional to abundant in occurrences) found that elevation (F = 1.53, p = 0.01) and soluble phosphorus (F = 1.4, p = 0.05) significantly interacted with macrofungi with elevation mildly correlating with CCA axis 1 (r = −0.5) and soluble phosphorus strong with CCA axis 2 (r = 0.7). However, no clear patterns were observed and macrofungi distribution seemed to be influenced by both micro- and macroenvironmental factors relating to habitats (Figure 9B). The undisturbed sites supported Agaricus, Cuphophyllus, Hygrocybe, Hygrophorus, and Marasmius, while moderately impacted areas had higher abundances of ectomycorrhiza species of Laccaria spp. It was evident that macrofungi abundances and diversity decreased downstream as a response to decreasing SOC. The majority of macrofungi community recorded in UTR were saprophytic (90%), colonizing dead wood, litter, and soil organic matter.
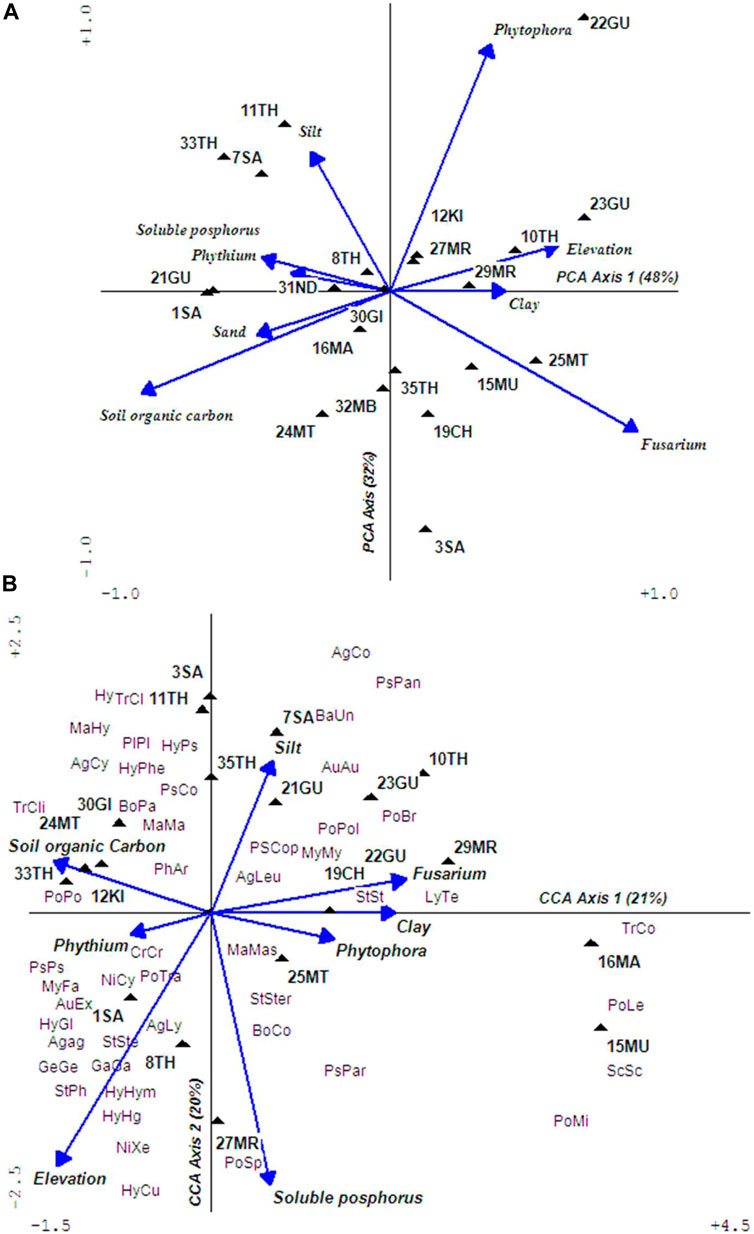
FIGURE 9. Ordination plots of PCA (A) and CCA (B) showing ordination of sites according to environmental variables and species compositions in the UTR watershed. The abbreviated four-letter labels signify macrofungi with the first two uppercase letters standing for family and the next two lowercase letters genus. Full taxon names are provided as Supplementary Table S4. Soil parameters used to prepare PCA are provided as Supplementary Table S5.
Birds
Birds were studied at 10 sites and richness was highest in tier 2 sites, gradually declining across the moderately disturbed sites (tiers 3 and 4) to the lowest in tiers 5 and 6 sites (Figure 10). Kenrick’s starling, Poeoptera kenricki, a regional endemic (Kenya and Tanzania) bird was recorded in the undisturbed forest sites (tiers 1 and 2). However, two local endemics Hinde’s babbler, Turdoides hindei, and Hunter’s cisticola, Cisticola hunteri, were recorded at tiers 3, 4, 5, and 6 sites. Species occurrence indices were not significantly higher at tiers 1 and 2 sites than at the other sites (tier 2 index = 5.95; tiers 3 and 4 index = 5.87; tiers 5 and 6 index = 5.16, p > 0.05). Severely modified sites (tiers 5 and 6) had the lowest average occurrence indices. Yellow-whiskered greenbul, Eurillas latirostris (forest generalist F), gray apalis, Apalis cinerea (a true forest specialist FF), and tropical boubou (a forest visitor f) were the most commonly encountered species at tier 2 sites, while at tiers 5 and 6 site, yellow-whiskered greenbul (F), gray-backed Camaroptera, Camroptera brachyura (f), and common bulbul, Pyconotus barbatus (f) were the most common. Baglafecht weaver, Ploceus baglafecht, red-eyed dove, Streptopelia semitorquata, and northern fiscal, Lanius humeralis, all forest visitors (f) were the most common in the severely modified sites. Predictably, the diversity of forest specialist species was higher in the tier 2 sites and completely absent in sites in tiers 3 to 6 (Figure 11). Conversely, the diversity of forest visitor species was highest in tiers 5 and 6 sites.
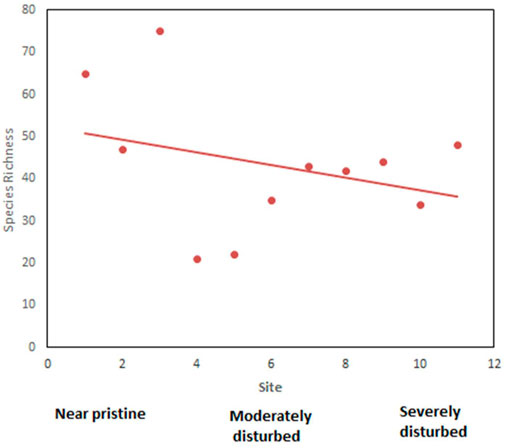
FIGURE 10. The relationship between species richness and habitat disturbance species richness declined progressively from undisturbed sites (1–3), through moderately disturbed sites (4–8) to severely disturbed sites (9–12).
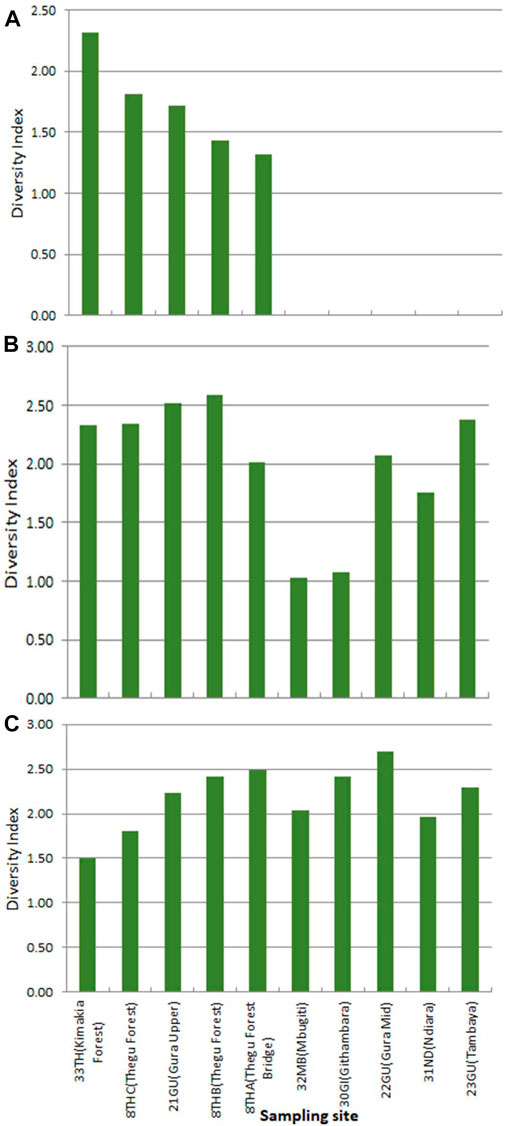
FIGURE 11. Bird species diversity of (A) forest specialists, (B) forest generalists, and (C) forest visitors at each sampling site.
Characterization of Sampled Sites into BCG Tiers
All data collected during this study were individually used to assign all 36 permanent sampled sites to various BCG tiers (Table 1). As predicted sites in undisturbed areas represented ecological conditions in tiers 1 and 2, moderately disturbed (tiers 3 and 4), and severely human-impacted areas were classified as tiers 5 and 6. The taxonomic groups were found to complement each other with each taxonomic group assessing ecological conditions of their habitats to a certain degree correctly. The use of multivariate analysis and examinations of taxa abundance and distributions assisted in the identification and selection of biological components (taxa), water, and soil quality parameters that were indicators of varying levels of landscape conditions. As predicted, ecological conditions deteriorated downstream in response to agricultural intensification.
Discussion
As predicted, analyses of water and soil parameter as well as biological data from both terrestrial and aquatic habitats assisted in placing sampled sites into BCG tiers (Table 1). Measurements of water and soil parameters validated changes in ecological conditions and more specifically the establishment of undisturbed reference sites. The decision to consider both terrestrial and aquatic taxa, followed by determination of their interactions with associated water or soil parameters assisted in identifying environmental stressors in UTR. More important was the identification of indicator species both in terrestrial and aquatic habitats that can be used to monitor and assess ecological conditions by parataxonomists or ordinary citizens, and the results can be appreciated at all levels of expertise.
This study revealed that all the seven taxonomic groups responded significantly to ecological condition changes in the UTR watershed. Both natural and anthropogenic factors influenced taxa abundances and distributions. Elevation, a natural factor, was one of the factors that interacted significantly with all taxonomic groups. Many of the undisturbed sites are found at higher elevation particularly in the headwaters draining protected lands. The elevation is also known to be a surrogate measure of temperature (McGuire et al., 2012). Global increments of temperatures are a consequence of climate change and land use driven by human activities such as impacts of land-cover changes that are found to be both intensive and widespread in parts of the watershed (Vitousek, 1994). Not surprisingly, land-use change was also found to affect water quality parameters in rivers such as conductivity, turbidity, and discharge. Land-cover change in watersheds of Rivers Thegu, Sagana, and Nairobi is suspected to be the major contributor of low water flow as well as increasing temperature. Also, uncontrolled water abstraction for irrigation agriculture contributes to high conductivity levels that are found to adversely affect most aquatic taxonomic groups. The high turbidity levels in mid to lower sections of rivers are also attributed to land-use cover changes and improper farming practices.
The overall goal of this study was to understand watershed degradation in UTR in order to restore and sustain its capacity to support and provide ecosystem services of water and biodiversity conservation (MEMR 2012). Specifically, the initiative was aimed at laying down a strong foundation for the establishment of a bioassessment framework to support rehabilitation of the UTR watershed under the auspices of the Upper Tana Nairobi Water Fund (UTNWF) initiative. A primary motivation for this study was to develop bioassessment tools that could reliably track condition and change attributable to activities of the NWF in a way that could be easily understood, communicate to the UTNWF and their cooperating partners, government agencies, academic institutions and the affected communities in the watershed, each of which has varying knowledge and expertise in interpreting biological condition. One of the major impediments to the implementation of successful rehabilitation activities is the lack of an official and structured biomonitoring network to gather and evaluate ecological data. A recent global analysis of the ecological conditions of rivers observed that most of them have poor waters, a situation attributed to lack of monitoring programs due to economic constraints, technical limitations, and limited knowledge of abiotic and biotic components, as well as poor awareness by decision makers (Feio et al., 2021). Also, insufficient citizen understanding and involvement contribute to reduced success and sustainability of rehabilitation initiatives.
The approach by UTNWF and NMK to develop a pilot BCG framework for a comprehensive bioassessment of rivers in the UTR watershed using seven taxonomic groups yielded promising results. The BCG assessment utilities were modified to accommodate terrestrial taxonomic groups, including vegetation, macrofungi, herpetofauna, and birds, which allow better incorporation of the river to the basin to ecological network biomonitoring. This approach has been generally ignored in the overall rehabilitation of rivers. There must be a long-term and extensive monitoring approach that considers ecological health that includes the suite of ecological components in watersheds or catchments (Buss et al., 2015). Many of the terrestrial biological components used to describe ecological conditions that have been used elsewhere including the use of bird feeding guilds, abundance, and distribution to indicate various forest conditions (Furness and Greenwood 1993; Bennun et al., 1996; Bryce et al., 2002), how vegetation is important in supporting ecological processes and functions in landscapes (Handa et al., 2012; Riis et al., 2020), the strong interactions that exist between macrofungi and their environments (Mangan et al., 2010; Segnitz et al., 2020), and herpetofauna are very sensitive sentinels of environmental change due to their permeable thin skin and complex life cycle that makes them vulnerable to chemical and physical changes in both terrestrial and aquatic habitats (Bell and Donnelly, 2006). A program with several biomonitoring taxa is likely to bring on board many stakeholders and in doing so, assist in overcoming challenges that bewilder biomonitoring programs such as poor knowledge of biodiversity especially in developing countries, as well as increasing public awareness on the importance of river ecosystems and ecosystems services as such the need for motivating landscapes rehabilitation projects (Leigh et al., 2019). These taxa are widespread and relatively well-known locally and so easy to popularize among the residents for monitoring.
As expected, the aquatic taxonomic groups of macroinvertebrates, diatoms, and fish grouped sampled sites into various tiers consistently and similarly to those of terrestrial taxa. The response of macroinvertebrates to water quality was consistent with other studies carried in Kenya (Cumberlidge, 1981; Mathooko and Mavuti, 1992; Mathooko, 2002; Dobson et al., 2002; Mwaura et al., 2002; Smart et al., 2002; Ndaruga et al., 2004; Muli, 2005; Kibichi et al., 2007; Kundu e t al, 2017; Ochieng et al., 2019; Raburu et al., 2009; Masese et al., 2009; Masese et al., 2012; Nyakeya et al., 2009; Aura et al., 2010, 2017; Ojunga et al., 2010; Raburu and Masese, 2012; Minaya et al., 2013; Ngodhe et al., 2013; Kilonzo et al., 2014; Mbaka et al., 2014a; Mbaka et al., 2014b; M'Erimba et al., 2014b; Odhiambo and Mwangi 2014; Gichana et al., 2015, Orwa et al., 2015; Minoo et al., 2016; Kundu et al, 2017). The availability of this huge body of literature offers opportunities to strengthen the use of BCG, especially overcoming problems of determining undisturbed ecological conditions as well as the knowledge needed during pre- and post-status of ecosystems during rehabilitation programs. Only a few studies exist on fish bioassessment (Raburu and Masese, 2012; Achieng et al., 2021), and we recommend their continued promotion because they are sensitive to effects of poor agricultural practices and deforestation, which cause sedimentation and loss of habitat diversity and heterogeneity (Hocutt et al., 1994; Ganasan and Hughes, 1998; Toham and Teugels, 1999). Similarly, the use of diatoms in bioassessment of rivers is still at a nascent stage in Kenya (Ndiritu et al., 2006; Triest et al., 2012); however, findings of this study found them to be very reliable in assessing river conditions, especially the effects of climate on water quality.
The application of multivariate analyses of PCA, DCA, and CCA assisted in identifying water quality parameters adversely compromised as well as grouped sampling sites according to their taxa similarities. Moreover, the analyses ordinated taxa and sampling sites along an elevation-environment stress gradient that assisted in identifying and placing all 36 permanent sampling sites in any of the six BCG tiers (Table 1). Agboola et al. (2020) employed a multivariate approach in the selection and validation of reference condition in monitoring and management in South Africa. By using the BCG, it was possible to prioritize sites requiring rehabilitation in the UTR watershed, nature of restoration, and to achieve specific ecological conditions. For instance, rivers draining dry sub-catchments of Thegu, Nairobi, Sagana, Honi, and Amboni were experiencing low water flow discharges during dry seasons which caused elevated levels of conductivity, consequently causing stress on aquatic taxa. Those rivers draining the Aberdare watershed were primarily affected by improper land-use practices that affected discharges and turbidity.
Going forward, there is an urgent need for countries to establish national bioassessment frameworks to increase the body of knowledge to support river rehabilitation programs. Rivers are major sources of water, and their protection is crucial if countries are to meet United Nations Sustainable Development Goals’ targets that depend on secured water future. Just like in other parts of the world, river monitoring initiatives in Kenya are limited by 1) coordination across institutions and between stakeholders, 2) scientific gaps, and 3) insufficient resources (Feio et al., 2021). The current attempts by UTNWF in the UTR to have bioassessment to support rehabilitation programs is laudable and should extend to other major watersheds (Crafter et al., 1992; MEMR 2012). The UTR watershed with an area of 8,340 km2 is experiencing environmental degradation due to poor land and water management practices, and the consequences are reduced surface water qualities and quantities resulting in environmental crises that now threaten the social, political, and economic systems in the region (WRMA Water Resources Management Authority, 2014). Crucially, this watershed is a major source of water for domestic, agricultural, and industrial sectors for a human population of 4.87 million in UTR and another 95% of 4.4 million people living in Nairobi City (County). Also, waters from UTR generate 60% of hydropower energy used in Kenya, with sedimentation being a major concern on the longevity of dams.
Conclusion
The development of BCG models using multiple taxa groups as a bioassessment framework helped describe ecological conditions in rivers and landscapes (watersheds) in UTR. The initial BCG metrics were developed based on aquatic taxonomic groups of fish, macroinvertebrates, and diatoms to support the objectives of restoring and maintaining the chemical, physical, and biological integrity of the USA’s water resources (Clean Water Act; CWA, 1972). However, it was discovered during this exercise that there was a strong case that the BCG framework can also be applied in terrestrial ecosystems using associated taxa such as birds, amphibians, macrofungi, and vegetation. The strong relationship between landscape and aquatic ecosystems demonstrated through this study informs this idea (Buss et al., 2015). Analyses of the relationship between all the seven taxonomic groups and environmental variables using analytical techniques of multivariate, species abundance, and distribution measures of richness, diversities and indicator species assisted in the grouping of 36 sites according to six BCG tiers. Indeed, the seven taxonomic groups complemented each other, with each taxonomic group reliably assessing the ecological conditions of each site. In building different BCG models, it was possible to identify taxa indicating various ecological conditions that in the long term can be proposed as indicator flagship taxa in the UTR. In most cases, flagship taxa are known by local communities and citizens and this makes it easier for them to contribute to data collection and bioassessment programs, which is one way to promote public or citizens’ environmental awareness, education, and participation (Graham et al., 2004; Leigh et al., 2019). The aim is to strengthen this long-term biomonitoring program as well as make it compatible with other taxa assessment programs such as national mapping of birds under the Kenya Bird Map (http://www.birdmap.africa/coverage/country/Kenya/; Wachira et al., 2015). In summary, the capacity of the BCG models to assess landscape conditions meant that they can be used to identify important habitats for conservation, direct investment for restoration, and track progress using measurable biological and environmental parameters targets under a long-term biomonitoring program.
Data Availability Statement
The original contributions presented in the study are included in the article/Supplementary Material; further inquiries can be directed to the corresponding author.
Ethics Statement
The research and findings presented in this manuscript were obtained under auspices of National Museums of Kenya (NMK) which is governed by its collection and research policy framework that abides by national and international research standards and mandated by an Act of Parliament, The National Museums and Heritage Act of 2006 (https://www.museums.or.ke/biodiversity-database/). Thus, NMK is a Kenyan government institution and its core mandate is to undertake biodiversity research and manage all biological collections in Kenya.
Author Contributions
GN conceived the manuscript with TT, PN, and DC and then supervised the study and contributed valuable comments. GN, TT, PN, VM, EN, GK, LN, PK, PM, MM, JG, and DO collected data. All authors contributed to the article and approved the submitted version.
Funding
This study was made possible through support provided by the International Fund for Agricultural Development (IFAD)-GEF 6th framework through the Nature Conservancy (TNC)-Upper Tana Nairobi Water Fund (NWF) initiative, under the terms of subaward Agreement ID. No. 270317 (TNC -project ID No. P104186, award ID No. A103672). The content and opinions expressed herein are those of the author(s) and do not necessarily reflect the position or the policy of such agency or The Nature Conservancy, and no official endorsement should be inferred.
Conflict of Interest
The authors declare that the research was conducted in the absence of any commercial or financial relationships that could be construed as a potential conflict of interest.
Acknowledgments
The project was implemented by the National Museums of Kenya (NMK), Centre for Biodiversity under the directorship of Mzalendo Kibunjia and coordinated by TT. We wish to thank local communities in Nyeri and Murang’a for their warm welcome during the study period. We are grateful to the TNC-NWF team led by George Njugi and Anthony Kariuki for introducing us to rehabilitation target sites in the Upper Tana River watershed.
Supplementary Material
The Supplementary Material for this article can be found online at: https://www.frontiersin.org/articles/10.3389/fenvs.2021.671051/full#supplementary-material
References
Achieng, A. O., Masese, F. O., Coffey, T. J., Raburu, P. O., Agembe, S. W., Febria, C. M., et al. (2021). Assessment of the Ecological Health of Afrotropical Rivers Using Fish Assemblages: A Case Study of Selected Rivers in the Lake Victoria Basin, Kenya. Front. Water 2, 620704. doi:10.3389/frwa.2020.620704
Agboola, O. A., Downs, C. T., and O’Brien, G. (2020). A Multivariate Approach to the Selection and Validation of Reference Conditions in KwaZulu-Natal Rivers, South Africa. Front. Environ. Sci. 8, 584923. doi:10.3389/fenvs.2020.584923
Agnew, A. D. Q. (2013). Upland Kenya Wild Flowers and Ferns. Nairobi, Kenya: Nature Kenya – The East Africa Natural History Society.
Anderson, J. M., and Ingram, J. S. I. (1993). A Handbook of Methods. Wallingford, Oxfordshire: CAB International, 221.
Aura, C. M., Kimani, E., Musa, S., Kundu, R., and Njiru, J. M. (2017). Spatio-temporal Macroinvertebrate Multi-index of Biotic Integrity (MMiBI) for a Coastal River basin: a Case Study of River Tana, Kenya. Ecohydrology & Hydrobiology 17 (2), 113–124. doi:10.1016/j.ecohyd.2016.10.001
Aura, C. M., Raburu, P. O., and Herrmann, J. (2010). A Preliminary Macroinvertebrate Index of Biotic Integrity for Bioassessment of the Kipkaren and Sosiani Rivers, Nzoia River basin, Kenya. Lakes Reservoirs: Res. Management 15 (2), 119–128. doi:10.1111/j.1440-1770.2010.00432.x
Barbour, M. T. (1999). Rapid Bioassessment Protocols for Use in Wadeable Streams and Rivers: Periphyton, Benthic Macroinvertebrates and Fish. Office of Water: US Environmental Protection Agency.
Beck, W. M. (1954). Studies in Stream Pollution Biology: I. A Simplified Ecological Classification of Organisms. Q. J. Fla. Acad. Sci. 17, 211–227. Available at: http://www.biodiversitylibrary.org/page/41493954#page/235/mode/1up. (Accessed November, 2020).
Bell, K.E., and Donnelly, M.A. (2006). Influence of forest fragmentation on community structure of frogs and lizards in northeastern Costa Rica. Conservation Biol. 20 (6), 1750–1760.
Bennun, L. A., and Howell, K. (2002). “Birds,” in African Forest Biodiversity- A Field Survey Manual for Vertebrates. Editor G. Davies (UK: Earthwatch Institute).
Bennun, L., Dranzoa, C., and Pomeroy, D. (1996). The forest Birds of Kenya and Uganda. J. East Afr. Nat. Hist. 85, 23–48. doi:10.2982/0012-8317(1996)85[23:tfboka]2.0.co;2
Bryce, S. A., Hughes, R. M., and Kaufmann, P. R. (2002). Development of a Bird Integrity index: Using Bird Assemblages as Indicators of Riparian Condition. Environ. Manage. 30, 294–310. doi:10.1007/s00267-002-2702-y
Buss, P., Carlisle, D. M., Chon, T. S., Culp, J., Harding, J. S., Keizer-Vlek, H. E., et al. (2015). Die Psychologie des Spenderverhaltens. Environ. Monit. Assess. 187 (1), 1–21. doi:10.1007/978-3-658-08461-5_9-1
Cairns, J., McCormick, P. V., and Niederlehner, B. R. (1993). A Proposed Framework for Developing Indicators of Ecosystem Health. Hydrobiologia 263, 1–44. doi:10.1007/bf00006084
Channing, A., and Howell, K. M. (2006). Amphibians of East Africa. Ithaca and Frankfurt: Cornell University Press and Edition Chimaira Press.
Côté, I. M., and Perrow, M. R. (2013). “Fish,” in Ecological Census Techniques. Editor W. J 2013 Sutherland (Cambridge, UK: Cambridge University Press).
Courtemanch, D. L. (1995). in Merging the Science of Biological Monitoring with Water Resource Management Policy: Criteria Development. Biological Assessment and Criteria: Tools for Water Resource Planning and Decision Making. Editors W. S. Davis, and T. P. Simon (Boca Raton, FL: CRC Press), 315–326.
Courtemanch, D. L., Davies, S. P., and Laverty, E. B. (1989). Incorporation of Biological Information in Water Quality Planning. Environ. Manage. 13, 35–41. doi:10.1007/bf01867585
Cumberlidge, N. (1981). A Revision of the Freshwater Crabs of Mt Kenya and the Aberdare Mountains, Kenya, East Africa (Brachyura: Potamoidea: Potamonautidae). Zootaxa 29 (42), 2009.
Dalitz, C., Dalitz, H., Musila, W., and Masinde, S., (2011). Illustrated Field Guide to the Common Woody Plants of Kakamega forest, 24. Germany: Beiheft.
Dallas, H. F. (2021). Rapid Bioassessment Protocols Using Aquatic Macroinvertebrates in Africa-Considerations for Regional Adaptation of Existing Biotic Indices. Front. Water 3, 628227. doi:10.3389/frwa.2021.628227
Davids, J. C., Rutten, M. M., Pandey, A., Devkota, N., van Oyen, W. D., Prajapati, R., et al. (2019). Citizen Science Flow - an Assessment of Simple Streamflow Measurement Methods. Hydrol. Earth Syst. Sci. 23, 1045–1065. doi:10.5194/hess-23-1045-2019
Davies, S. P., Drummond, F., Courtemanch, D. L., Tsomides, L., and Danielson, T. J. (2016). Biological Water Quality Standards to Achieve Biological Condition Goals in Maine Rivers and Streams: Science and Policy. Maine Agricultural and Forest Experiment Station. Technical Bulletin 208.
Davies, S. P., and Jackson, S. K. (2006). The Biological Condition Gradient: A Descriptive Model for Interpreting Change in Aquatic Ecosystems. Ecol. Appl. 16, 1251–1266. doi:10.1890/1051-0761(2006)016[1251:tbcgad]2.0.co;2
Davis, W. S. (1995). “Biological Assessment and Criteria: Building on the Past,” in Biological Assessment and Criteria: Tools for Water Resource Planning and Decision Making. Editors W. S. Davis, and T. P. Simon (Boca Raton, FL: Lewis Publishers), 15–29. Available at: https://www.researchgate.net/publication/235792912_Biological_Assessment_and_Criteria_Building_on_the_Past.
Day, J. A., and de Moor, F. C. (2003). Hemiptera, Megaloptera, Neuroptera, Trichoptera and Lepidoptera (Pretoria, Vol. 8.Guides to the Freshwater Invertebrates of Southern Africa Water Research Commission Report No. TT 214/03
De Moor, I. J., Day, J. A., and De Moor, F. C. (2003). Guides to the Freshwater Invertebrates of Southern Africa Volume 7: Ephemeroptera, Odonata & Plecoptera. in Water Research Commission Report No. TT 207/03. Pretoria.
Dobson, M., Magana, A., Mathooko, J. M., and Ndegwa, F. K. (2002). Detritivores in Kenyan highland Streams: More Evidence for the Paucity of Shredders in the Tropics? Freshw. Biol. 47 (5), 909–919. doi:10.1046/j.1365-2427.2002.00818.x
FAO (1996). Agro-ecological Zoning Guidelines. Available at: www.fao.org. FAO Soils Bulletin 73. Rom
Feio, M. J., Hughes, R. M., Callisto, M., Nichols, S. J., Odume, O. N., Quintella, B. R., et al. (2021). The Biological Assessment and Rehabilitation of the World's Rivers: An Overview. Water 13, 371. doi:10.3390/w13030371
Ganasan, V., and Hughes, R. M. (1998). Application of an index of Biological Integrity (IBI) to Fish Assemblages of the Rivers Khan and Kshipra (Madhya Pradesh), India. Freshw. Biol. 40, 367–383. doi:10.1046/j.1365-2427.1998.00347.x
Gichana, Z., Njiru, M., Raburu, P. O., and Masese, F. O. (2015). Effects of human activities on benthic macroinvertebrate community composition and water quality in the upper catchment of the Mara River Basin, Kenya. Lakes Reserv. Res. Manag. 20 (2), 128–137.
Graham, P. M., Dickens, C. W., and Taylor, R. J. (2004). miniSASS - A Novel Technique for Community Participation in River Health Monitoring and Management. Afr. J. Aquat. Sci. 29 (1), 25–35. doi:10.2989/16085910409503789
Griffiths, C. A., Day, J. A., and Picker, M. (2015). Freshwater Life: A Field Guide to the Plants and Animals of Southern Africa. Cape Town: Struik Nature.
Handa, C., Alvarez, M., Becker, M., Oyieke, H., Möseler, B. M., Mogha, N., et al. (2012). Opportunistic Vascular Plant Introductions in Agricultural Wetlands of East Africa. Int. J. AgriScience 2 (9), 810–830.
Harkonen, M., Niemela, T., and Mwasumbi, L. (2003). Tanzanian Mushrooms: Edible, Harmful and Other Fungi. Tanzania: Botanical Museum, Finnish Museum of Natural History, 200.
Harrelson, C. C. (1994). Stream Channel Reference Sites: An Illustrated Guide to Field Technique, Vol. 245. Fort Collins, Colorado: US Department of Agriculture, Forest Service, Rocky Mountain Forest and Range Experiment Station, 61.
Hawkins, C. P. (2006). Quantifying Biological Integrity by Taxonomic Completeness: Its Utility in Regional and Global Assessments. Ecol. Appl. 16 (4), 1277–1294. doi:10.1890/1051-0761(2006)016[1277:qbibtc]2.0.co;2
Hocutt, C. H. P. T., Johnson, C., Hay, C. J., and van Zyl, B. J. (1994). Biological Basis of Water Quality Assessment: the Okavango River, Namibia. Rev. Hydrobiology Tropics 27, 361–387.
Ishiyama, N., Nagayama, S., Iwase, H., Akasaka, T., and Nakamura, F. (2017). Restoration Techniques for Riverine Aquatic Connectivity: Current Trends and Future Challenges in Japan. Ecol. Civil Eng. 19, 143–164. doi:10.3825/ece.19.143
Kamdem Toham, A., and Teugels, G. G. (1998). Diversity Patterns of Fish Assemblages in the Lower Ntem River Basin (Cameroon), with Notes on Potential Effects of Deforestation. fal 141, 421–446. doi:10.1127/archiv-hydrobiol/141/1998/421
Karr, J. R. (1981). Assessment of Biotic Integrity Using Fish Communities. Fisheries 6, 21–27. doi:10.1577/1548-8446(1981)006<0021:aobiuf>2.0.co;2
Kibichii, S., Shivoga, W. A., Muchiri, M., and Miller, S. N. (2007). Macroinvertebrate Assemblages along a Land-Use Gradient in the Upper River Njoro Watershed of Lake Nakuru Drainage basin, Kenya. Lakes Reserv Res. Manage. 12 (2), 107–117. doi:10.1111/j.1440-1770.2007.00323.x
Kilonzo, F., Masese, F. O., Van Griensven, A., Bauwens, W., Obando, J., and Lens, P. N. L. (2014). Spatial-temporal Variability in Water Quality and Macro-Invertebrate Assemblages in the Upper Mara River basin, Kenya. Phys. Chem. Earth, Parts A/B/C 67, 93–104. doi:10.1016/j.pce.2013.10.006
KNBS Kenya National Bureau of Statistics (2019). Population by County and Sub County. 2019 Kenya Population and Housing Census, Vol. 1. Nairobi, Kenya. Available at: https://www.knbs.or.ke (Accessed November 2, 2020)
Kundu, R., Aura, C. M., Nyamweya, C., Agembe, S., Sitoki, L., Lung'ayia, H. B. O., et al. (2017). Changes in Pollution Indicators in Lake Victoria, Kenya and Their Implications for lake and Catchment Management. Lakes Reserv Res. Manage. 22 (3), 199–214. doi:10.1111/lre.12187
Leigh, C., Boersma, K. S., Galatowitsch, M. L., Milner, V. S., and Stubbington, R. (2019). Are All Rivers Equal? the Role of Education in Attitudes towards Temporary and Perennial Rivers. People Nat. 1 (2), 181–190.
Lepš, J., and Šmilauer, P. (2003). Multivariate Analysis of Ecological Data sing CANOCO. Cambridge, UK: Cambridge University Press.
M'Erimba, C., Mathooko, J., Karanja, H., and Mbaka, J. (2014a). Monitoring Water and Habitat Quality in Six Rivers Draining the Mt. Kenya and Aberdare Catchments using Macroinvertebrates and Qualitative Habitat Scoring. Egerton J. Sci. & Technol. 14, 81–104.
M'Erimba, C., Mathooko, J., and Ouma, K. (2014b). Macroinvertebrate Distributions in Relation to Human and Animal-Induced Physical Disturbance of the Sediment Surface in Two Kenyan Tropical Rift Valley Streams. Afr. J. Aquat. Sci. 39 (3), 337–346.doi:10.2989/16085914.2014.960790
Magurran, A. E. (2004). Measuring Biological Diversity. Malden Massachusetts, USA: Blackwell Publishing.
Malonza, P. K., Bwong, B. A., and Muchai, V. (2011). Kitobo Forest of Kenya, a Unique Hotspot of Herpetofaunal Diversity. Acta Herpetologica 6, 149–160.
Mangan, S. A., Schnitzer, S. A., Herre, E. A., Mack, K. M., Valencia, M. C., Sanchez, E. I., et al. (2010). Negative Plant-soil Feedback Predicts Tree-Species Relative Abundance in a Tropical Forest. Nature 466 (7307), 752–755.
Masese, F. O., Raburu, P. O., Mwasi, B. N., and Etiégni, L. (2012). Effects of Deforestation on Water Resources: Integrating Science and Community Perspectives in the Sondu-Miriu River Basin, Kenya. New Advances and Contributions to Forestry Research, 268. Rijeka: InTech, 1–18.
Masese, F., Raburu, P., and Muchiri, M. (2009). A Preliminary Benthic Macroinvertebrate index of Biotic Integrity (B-IBI) for Monitoring the Moiben River, Lake Victoria Basin, Kenya. Afr. J. Aquat. Sci. 34 (1), 1–14. doi:10.2989/ajas.2009.34.1.1.726
Mathooko, J. M., and Mavuti, K. M. (1992). Composition and Seasonality of Benthic Invertebrates, and Drift in the Naro Moru River, Kenya. Hydrobiologia 232 (1), 47–56. doi:10.1007/bf00014611
Mathooko, J. M. (2002). The Sizes, Maturity Stages and Biomass of Mayfly Assemblages Colonizing Disturbed Stream Bed Patches in central Kenya. Afr. J. Ecol. 40 (1), 84–93. doi:10.1046/j.0141-6707.2001.00342.x
Mbaka, J. G., M'Erimba, C. M., and Mathooko, J. M. (2014a). Impacts of Benthic Coarse Particulate Organic Matter Variations on Macroinvertebrate Density and Diversity in the Njoro River, A Kenyan highland Stream. J. East Afr. Nat. Hist. 103 (1), 39–48.
Mbaka, J., M'Erimba, C., Thiongo, H., and Mathooko, J. (2014b). Water and Habitat Quality Assessment in the Honi and Naro Moru Rivers, Kenya, Using Benthic Macroinvertebrate Assemblages and Qualitative Habitat Scores. Afr. J. Aquat. Sci. 39 (4), 361–368. doi:10.2989/16085914.2014.976168
McGuire, C. R., Nufio, C. R., Bowers, M. D., and Guralnick, R. P. (2012). Elevation-Dependent Temperature Trends in the Rocky Mountain Front Range: Changes over a 56- and 20-Year Record. PloS one 7 (9), e44370.doi:10.1371/journal.pone.0044370
MEMR (2012). Kenya Wetlands Atlas. Nairobi, Kenya: Ministry of Environment and Mineral ResourcesAvailable at: https://na.unep.net/siouxfalls/publications/Kenya_Wetlands.pdf (Accessed November 10, 2020).
Minaya, V., McClain, M. E., Moog, O., Omengo, F., and Singer, G. A. (2013). Scale-dependent Effects of Rural Activities on Benthic Macroinvertebrates and Physico-Chemical Characteristics in Headwater Streams of the Mara River, Kenya. Ecol. Indicators 32, 116–122. doi:10.1016/j.ecolind.2013.03.011
Minoo, C. M., Ngugi, C. C., Oyoo-Okoth, E., Muthumbi, A., Sigana, D., Mulwa, R., et al. (2016). Monitoring the Effects of Aquaculture Effluents on Benthic Macroinvertebrate Populations and Functional Feeding Responses in a Tropical Highland Headwater Stream (Kenya). Aquat. Ecosyst. Health Manag. 19 (4), 431–440.
Mueller, G. M., Bills, G. F., and Foster, M. S. (2004). Biodiversity of Fungi: Inventory and Monitoring Methods. Elsevier Academic Press.
Muli, J. R. (2005). Spatial Variation of Benthic Macroinvertebrates and the Environmental Factors Influencing Their Distribution in Lake Victoria, Kenya. Aquat. Ecosystem Health Management 8 (2), 147–157. doi:10.1080/14634980590953680
Mwaura, F., Mavuti, K. M., and Wamicha, W. N. (2002). Biodiversity Characteristics of Small High-Altitude Tropical Man-Made Reservoirs in the Eastern Rift Valley, Kenya. Lakes Reserv Res. Manage. 7 (1), 1–12. doi:10.1046/j.1440-1770.2002.00162.x
Ndaruga, A. M., Ndiritu, G. G., Gichuki, N. N., and Wamicha, W. N. (2004). Impact of Water Quality on Macroinvertebrate Assemblages along a Tropical Stream in Kenya. Afr. J. Ecol. 42 (3), 208–216. doi:10.1111/j.1365-2028.2004.00516.x
Ndiritu, G. G., Njagi, E. L., Terer, T., Njoroge, P., and Gilbert Kosgei, G. (2018). Biological Condition Gradient (BCG) for the Upper Tana, Kenya: Macroinveterbrates, Birds, Fish, Amphibians and Vegetation. Nairobi, Kenya: National Museums of Kenya/Karatina University/The National Conservancy, 90p.
Ndiritu, G. G., Gichuki, N. N., and Triest, L. (2006). Distribution of Epilithic Diatoms in Response to Environmental Conditions in an Urban Tropical Stream, Central Kenya. Biodivers. Conserv. 15 (10), 3267–3293. doi:10.1007/s10531-005-0600-3
Ndong, H. E., Degreef, J., and De Kesel, A. (2011). Champignons Comestibles des forêts denses d’Afrique centrale. in Taxonomie et identification. ABC Taxa 10.
Ngodhe, S. O., Raburu, P. O., Kasisi, G. M., and Orwa, P. O. (2013). Assessment of Water Quality, Macroinvertebrate Biomass and Primary Productivity of Small Water Bodies for Increased Fish Production in the Lake Victoria basin, Kenya. Lakes Reserv Res. Manage. 18 (2), 89–97. doi:10.1111/lre.12029
Nyakeya, K., Okoth, P., Onderi, F., and John, G. (2009). Assessment of Pollution Impacts on the Ecological Integrity of the Kisian and Kisat Rivers in Lake Victoria Drainage basin, Kenya. Afr. J. Environ. Sci. Technology 3 (4), 97–107.
Ochieng, H., Okot-Okumu, J., and Odong, R. (2019). Taxonomic Challenges Associated with Identification Guides of Benthic Macroinvertebrates for Biomonitoring Freshwater Bodies in East Africa: A review. Afr. J. Aquat. Sci. 44 (2), 113–126.
Odhiambo, C., and Mwangi, B. M. (2014). Influence of Large Woody Debris Accumulations on Macroinvertebrate Distribution in a Low Order Forested Tropical Stream, Sagana River, Kenya. J. Agric. Sci. Technol. 16 (3), 13–24.
Odum, E. P., Finn, J. T., and Franz, E. H. (1979). Perturbation Theory and the Subsidy-Stress Gradient. BioScience 29, 349–352. doi:10.2307/1307690
Odum, E. P. (1985). Trends Expected in Stressed Ecosystems. BioScience 35, 419–422. Available at: http://www.life.illinois.edu/ib/451/Odum%20(1985).pdf (Accessed November, 2020). doi:10.2307/1310021
Ojunga, S., Masese, F. O., Manyala, J. O., Etiegni, L., Onkware, A. O., Senelwa, K., et al. (2010). Impact of a Kraft Pulp and Paper Mill Effluent on Phytoplankton and Macroinvertebrates in River Nzoia, Kenya. Water Qual. Res. J. Can. 45 (2), 235–250. doi:10.2166/wqrj.2010.026
Orwa, P. O., Omondi, R., Ojwang, W., and Mwanchi, J. (2015). Diversity, Composition and Abundance of Macroinvertebrates Associated with Water Hyacinth Mats in Lake Victoria, Kenya. Afr. J. Environ. Sci. Tech. 9 (3), 202–209.
Pantle, R., and Buck, H. (1955). Biological Monitoring of Water Quality and the Presentation of Results. Gasund Wasserfach 96, 604.
Raburu, P. O., and Masese, F. O. (2012). Development of a Fish-Based index of Biotic Integrity (FIBI) for Monitoring Riverine Ecosystems in the Lake Victoria Drainage Basin, Kenya. River Res. Applic. 28 (1), 23–38. doi:10.1002/rra.1428
Raburu, P. O., Okeyo-Owuor, J. B., and Masese, F. O. (2009). Macroinvertebrate-based Index of Biotic Integrity (M-IBI) for Monitoring the Nyando River, Lake Victoria Basin, Kenya. Scientific Res. Essays 4 (12), 1468–1477.
Rapport, D. J., Regier, H. A., and Hutchinson, T. C. (1985). Ecosystem Behavior under Stress. The Am. Naturalist 125, 617–640. doi:10.1086/284368
Riis, T., Kelly-Quinn, M., Aguiar, F. C., Manolaki, P., Bruno, D., Bejarano, M. D., et al. 2020). Global Overview of Ecosystem Services provided by Riparian Vegetation. BioScience 70 (6), 501–514. doi:10.1093/biosci/biaa041
Rode, M., and Suhr, U. (2007). Uncertainties in Selected River Water Quality Data. Hydrol. Earth Syst. Sci. 11 (2), 863–874. doi:10.5194/hess-11-863-2007
R. W. Furness, and J. J. D. Greenwood (Editors) (1993). Birds as Monitors of Environmental Change (London: Chapman & Hall).
S. A. Crafter, S. G. Njuguna, and G. W. Howard (Editors) (1992). Wetlands of Kenya: Proceedings of the KWWG Seminar on Wetlands of Kenya (Nairobi, Kenya: National Museums of Kenya), 3–5. [the IUCN Wetlands Programme]
Sakané, N., Alvarez, M., Becker, M., Böhme, B., Handa, C., Kamiri, H. W., et al. 2011). Classification, Characterisation, and Use of Small Wetlands in East Africa. Wetlands 31 (6), 1103–1116. doi:10.1007/s13157-011-0221-4
Segnitz, R. M., Russo, S. E., Davies, S. J., and Peay, K. G. (2020). Ectomycorrhizal Fungi Drive Positive Phylogenetic Plant-Soil Feedbacks in a Regionally Dominant Tropical Plant Family. Ecology 101 (8), e03083.
Smart, A. C., Harper, D. M., Malaisse, F., Schmitz, S., Coley, S., and De Beauregard, A.-C. G. (2002). Feeding of the Exotic Louisiana Red Swamp Crayfish, Procambarus clarkii (Crustacea, Decapoda), in an African Tropical lake: Lake Naivasha, Kenya. Lake Naivasha, Kenya: Springer Netherlands, 129–142. doi:10.1007/978-94-017-2031-1_13
Spawls, S., Howell, K., Drewes, R., and Ashe, J. (2002). A Field Guide to the Reptiles of East Africa: Kenya, Tanzania, Uganda, Rwanda and Burundi. Academic Press.
Stals, R., and de Moor, I. J. (2007). Guides to the Freshwater Invertebrates of Southern Africa. in Coleoptera. Water Research Commission Report No. TT 320/07, Vol. 10. Pretoria.
ter Braak, C., and Šmilauer, P. (1999). Canoco for Windows 4.02. Wageningen, Netherlands: Centre for Biometry Wageningen, CPRO–DLO.
Ter Braak, C. J. F., Verdonschot, P. F. M., and Verdonschot, P. F. (1995). Canonical Correspondence Analysis and Related Multivariate Methods in Aquatic Ecology. Aquat. Sci. 57 (3), 255–289. doi:10.1007/bf00877430
Triest, L., Lung’ayia, H., Ndiritu, G., and Beyene, A. (2012). Epilithic Diatoms as Indicators in Tropical African Rivers (Lake Victoria Catchment). Hydrobiologia 695 (1), 343–360. doi:10.1007/s10750-012-1201-2
USEPA (2016). A Practitioner’s Guide to the Biological Condition Gradient: A Framework to Describe Incremental Change in Aquatic Ecosystems. Washington, DC: U.S. Environmental Protection Agency.
Vitousek, P. M. (1994). Beyond Global Warming: Ecology and Global Change. Ecology 75 (7), 1861–1876. doi:10.2307/1941591
Vollenweider, R. A. (1968). Water Management Research. Scientific Fundamentals of the Eutrophication of Lakes and Flowing Waters with Particular Reference to Nitrogen and Phosphorus as Factors in Eutrophication. Paris: Organisation for Economic Co-operation and Development, 20.Directorate forScientific AffairsMimeographed. 159 p. + 34 Figs. + 2 separately paged annexes:Bibliography, 61 p; Current status of research on eutrophication in Europe, the United States andCanada.
Wachira, W., Jackson, C., and Njoroge, P. (2015). Kenya Bird Map: an Internet-Based System for Monitoring Bird Distribution and Populations in Kenya. Scopus 34, 58–60.
Wilhm, J. L., and Dorris, T. C. (1966). Species Diversity of Benthic Macroinvertebrates in a Stream Receiving Domestic and Oil Refinery Effluents. Am. Midland Naturalist 76, 427–449.doi:10.2307/2423096
WRMA Water Resources Management Authority (2014). Tana River Area’s Catchment Management Strategy (2014-2022). Nairobi, Kenya: Government of Kenya.
Yoder, C. O., and Rankin, E. T. (1995). “Biological Response Signatures and the Area of Degradation Value: New Tools for Interpreting Multimetric Data,” in Biological Assessment and Criteria: Tools forWater Resource Planning and Decision Making. Editors W. S. Davis, and T. P. Simon (Boca Raton, FL: Lewis Publishers), 263–286.
Keywords: aquatic biodiversity, bioassessment, biomonitoring, watersheds, conservation
Citation: Ndiritu GG, Terer T, Njoroge P, Muiruri VM, Njagi EL, Kosgei G, Njoroge L, Kamau PW, Malonza PK, Muchane M, Gathua J, Odeny D and Courtemanch D (2021) Using the Biological Condition Gradient Model as a Bioassessment Framework to Support Rehabilitation and Restoration of the Upper Tana River Watershed in Kenya. Front. Environ. Sci. 9:671051. doi: 10.3389/fenvs.2021.671051
Received: 22 February 2021; Accepted: 14 June 2021;
Published: 20 July 2021.
Edited by:
Francis O. Arimoro, Federal University of Technology Minna, NigeriaReviewed by:
Tatenda Dalu, University of Mpumalanga, South AfricaArgaw Ambelu, Jimma University, Ethiopia
Copyright © 2021 Ndiritu, Terer, Njoroge, Muiruri, Njagi, Kosgei, Njoroge, Kamau, Malonza, Muchane, Gathua, Odeny and Courtemanch. This is an open-access article distributed under the terms of the Creative Commons Attribution License (CC BY). The use, distribution or reproduction in other forums is permitted, provided the original author(s) and the copyright owner(s) are credited and that the original publication in this journal is cited, in accordance with accepted academic practice. No use, distribution or reproduction is permitted which does not comply with these terms.
*Correspondence: George G. Ndiritu, Z2F0ZXJlZ0B5YWhvby5jb20=