 Bo Chen
 Meitong Ren
 Liye Chen
- 1Institute for Finance and Economics, Central University of Finance and Economics, Beijing, China
- 2Harris School of Public Policy, The University of Chicago, Chicago, IL, United States
- 3Division of Public Policy, The Hong Kong University of Science and Technology, Hong Kong
The spot inspection policy has been widely applied in environmental protection in China. This paper collects environmental enforcement announcements and green patent data published by Chinese government agencies from 2006 to 2015. First, it studies the impact of spot inspection on green innovation with the spatial Durbin model. Then, it analyzes spatial heterogeneity according to the eastern, central, and western regions including 29 provinces. The spot inspection policy significantly increases the green innovation of a current region with a negative spillover effect on neighboring regions. Even though this policy has the best performance in the eastern region, it leads to pollution transfer into the western region, while being ineffective in the central region. Further, analysis on the spatial spillover effects of the 29 provinces proves that 21 provinces have a positive spillover effect, while eight provinces have a negative spillover effect. The research study shows that although spot inspection is generally beneficial to green innovation, pollution transfer and policy failure exist because of spatial heterogeneity.
Introduction
Since the Porter hypothesis proposed that reasonably designed and desirably implemented environmental regulation policies can effectively improve the environment and promote technological innovation of enterprises (Porter, 1991; Porter and van der Linde, 1995), academic studies have seemingly focused more on the research on market-based tools (Jaffe et al., 1995; Jaffe et al., 2002), while fewer studies have been conducted on command and control tools (Bergquist et al., 2013). However, in practice, command and control tools have been vigorously developed and become an important means of environmental regulation in China.
Command and control policies have dominated Chinese environmental governance since 1996. A national spot inspection system has already covered most of the pollution sources in the country and formed continuous pressure on enterprises’ environmental violations after 2010. The spot inspection system uses a random approach, randomly selecting inspection objects and randomly assigning law enforcement inspectors for them to disclose checking- and penalty-related results in a timely manner to the public. Spot inspection aims to create sustained expectations through cost-effective strategies with two characteristics: spatial randomness (key regions of spot inspection being constantly changed) and time randomness (the timing of spot inspection is constantly adjusted).
This paper collects public data from China’s official websites of environmental protection systems at all levels. Between 2004 and 2015, the number of penalty records issued by the environmental protection systems had increased dramatically (Figure 1). Except for the eight regular types of environmental penalties, some local governments have made innovations on this basis, such as adjusting the frequency of checks by different environmental credit score levels. The results of enterprise environmental credit evaluation will be made public as a reference for government subsidies, financial credit rating, etc. This information has been proven to affect financing costs (Zou et al., 2017) and stock yields of enterprises (Jin et al., 2019).
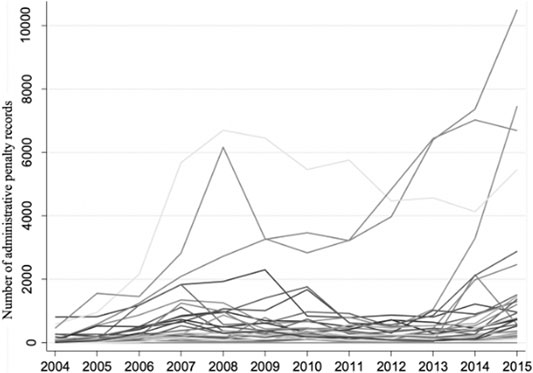
FIGURE 1. Number of environmental penalties in each Chinese province from 2004 to 2015 (unit: piece).
However, this governance model has been opposed by many scholars. Eaton and Kostka (2016), Eaton and Kostka (2017) criticized that binding environmental targets in China is “command without control” as the target-setting central government does not exercise a high degree of control over implementation and monitoring processes because of cyclical behavior, poor data quality, and the absence of an independent monitoring agency. By analyzing punishments in China, Van Rooij and Lo (2009) argued that the convergence of governmental, social, and economic institutional forces has been fragile as national pressures have lacked consistency and local community and government support evaporates when dominant sources of income are threatened. Van Rooij et al. (2017) pointed out that stricter and more frequent enforcement comes with only minor effects in reducing pollution. Moreover, they found a situation of uneven enforcement, with richer and more urbanized areas having much stronger and more frequent enforcement than inland areas do. In addition, corruption weakens the intensity of supervision (Sheng et al., 2019), and the trade-off between pollution control and employment goals will negatively influence the effectiveness of environmental enforcement (Guo et al., 2017).
Although there are many criticisms of China’s command and control policy, the spot inspection policy has been implemented on a large scale, while the market-based tool only plays a negligible role. Therefore, a valuable topic is whether spot inspection has replaced the role of the market mechanism and become an effective environmental regulation policy (Lamperti et al., 2015), which complements the Porter hypothesis (Jaffe and Palmer, 1997). However, except for a few studies on the impact of environmental penalties on the capital market (Zou et al., 2017; Jin et al., 2019), there are very few studies on spot inspection policy, and most of them are qualitative discussions or analysis of local samples, lacking comprehensive and quantitative research.
While the existing literature has discussed the effectiveness of different environmental regulatory tools, it does not specifically examine the impact of large-scale random check mechanism currently in use in China, which is based on the development of command-and-control tools. This paper uses web crawlers, text mining and other innovative methods to obtain data from various provinces, conducts quantitative analysis, supplements spatial heterogeneity analysis, and explores regional differences. This paper’s study of random sampling mechanisms is a further enrichment of command control tool is further enriched.
This paper studies whether spot inspection policy effectively promotes China’s green technology innovation and maintains consistency between regions. Green innovation instead of pollution indicators is used as the dependent variable because according to Porter’s hypothesis, green innovation can better reflect the effectiveness of policy design (Porter, 1991; Porter and van der Linde, 1995). Using the methods of a web crawler and text mining technologies, this paper constructs a database of spot inspection from the disclosed enterprise penalty information on 3,192 official Chinese environmental protection websites, then extracts green patent data from patent databases of Chinese enterprises and aggregates the enterprise-level data into the provincial panel data for spatial regression analysis, to study the impact of spot inspection on green technology innovation. Then, the spatial heterogeneity of the eastern, central, and western regions and the provinces of China is also analyzed.
The structure of this article is as follows: Hypothesis puts forward three hypotheses based on the latest relevant literature in the field of environmental regulation policies, spillover effect, etc. Spatial Regression Model uses Moran’s I index and other results to determine the adoption of the SDM model. Data Preparation introduces data preparation of green patents, environmental protection penalties, etc. Regression Results uses the SDM model to evaluate the impact of random checks on green technology innovation. Robustness Test uses spatial Hausman and other robustness test to ensure the reliability of the study findings. Direct Effect and Indirect Effect study the spillover effect of spot inspection on green technology innovation through direct effect and indirect effect result. Spatial Heterogeneity and Provincial Differences analyzed the spatial heterogeneity and provincial differences of the eastern, central, and western regions.
Methods
Hypothesis
Accelerating the pace of green technological innovation is essential to curb global climate change and build a clean energy system (Altıntas and Kassouri, 2020; Kassouri et al., 2021). The environmental regulation in China conforms to Porter’s hypothesis to a certain extent (Xiang and van Gevelt, 2020), strict but reasonable environmental regulations can simultaneously achieve the dual goals of net industrial output growth and green productivity and increased investment in green technology research and development (Sun et al., 2020; Li and Du, 2021). Although command-controlled regulations and economic-incentive regulations has been proved have nonlinear relationships with environment pollution (Zhang et al., 2020; Zhang et al., 2021; Pang et al., 2020; Wu et al., 2020), and the performance of command and control and market-based policy tools is different (Li et al., 2019; Li et al., 2019a), there are few quantitative analyses on the large-scale use of random inspection mechanisms in China. To analyze its impact on green innovation, this paper proposes hypothesis H1. During exploring the interaction between Socio-economic and Eco-environment system, contradictory behaviors in the process of regional environmental cooperation governance, such as regional differences in the intensity of environmental punishment, was shown to bring about spillover effects of green innovation technology. In addition, previous studies have shown that there is a regional imbalance in China’s environmental regulations (Wang and Wang, 2020; Yang, 2020), which was affacted by local government heterogeneity, regional environmental cooperation and others (Song et al., 2020; Song et al., 2020a), and the impact of its pressure on environmental innovation varies among regions (such as eastern, central, and western regions) (Li et al., 2019; Shangguan and Ge, 2020; Liu et al., 2021; Zhao et al., 2021). Therefore, this paper further proposes hypotheses H2 and H3. The three hypotheses are defined as follows:
H1: Environmental spot inspection policy promotes green technology innovation.
H2: Regional differences in environmental penalty intensity led to the spillover effect.
H3: Spot inspection policy exists regional imbalance phenomenon.
Spatial Regression Model
The spatial autocorrelation test can effectively judge the correlation between different regions and whether there is a spatial spillover effect. Moran’s I index is used to test the spatial autocorrelation of the observed region and is defined as:
where n is the number of individuals in the observation region,
Moran’s I index values of the number of green patents are significantly positive at the 10% level (p < 0.1), indicating that the number of green patents in 29 provinces has spatial correlation (Supplementary Tables S.1 and S.10, available online). The results of the likelihood ratio (LR) test and Wald test (Supplementary Tables S.2 and S.3, available online) show that an SDM model should be selected while the Hausman-test (p < 0.01) indicates that a fixed-effect model should be selected. Additionally, the log-likelihood value in SDM regression results also shows that two-way (unit and time) fixed-effect model is more suitable (Table 1).
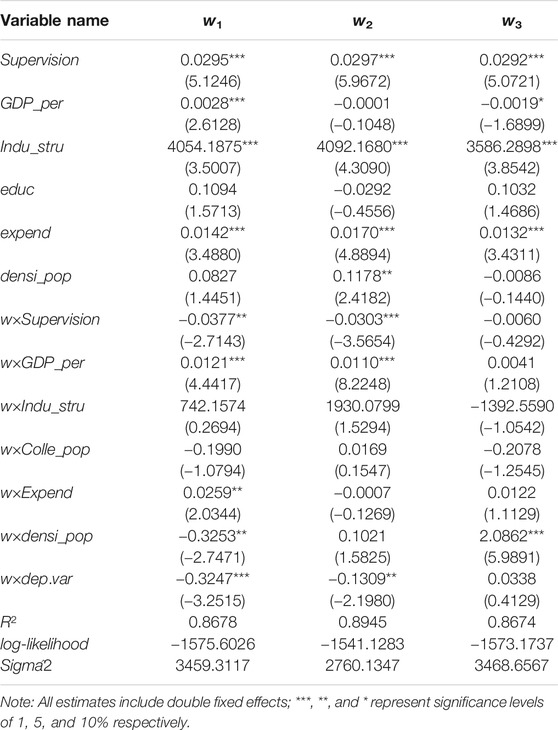
TABLE 1. Regression estimation results of spatial Durbin model.
The SDM is used to study the impact of spot inspection on green technology innovation. The benchmark form is:
In the above model, the explained variable is the number of green patents, and the primary explanatory variable is the number of environmental punishments. The control variables are: 1) economic development level: GDP per capita; 2) industrial structure: the proportion of output values of the second industry in GDP; 3) educational level: the proportion of the population with college degrees or above among residents; 4) resident consumption expenditure: resident consumption expenditures of the province; and 5) population density: the population per unit area of land. The panel data of nationwide 29 provinces and cities (excluding Hainan, Tibet, Hong Kong, Macao, and Taiwan) from 2006 to 2015 are used as the control variable data and come from the China Statistical Yearbook of the National Bureau of Statistics (Supplementary Table S.4, available online).
Data Preparation
The analysis of the theoretical model shows that the government can promote technological innovation activities of enterprises by adjusting the probability of spot inspection, but such activities may be less efficient due to diminishing marginal utility and corporate heterogeneity (Wang and Shen, 2016; Li and Ramanathan, 2018; Stavropoulos et al., 2018). To evaluate the actual performance of the spot inspection policy, this paper uses the SDM to study the impact of the spot inspection policy of Chinese government on green technology innovation.
Government statistical yearbook data are usually used as model variables in the study of environmental regulation (Ye et al., 2018; Li et al., 2019). However, the information disclosure of environmental protection penalties has no uniform standard, and instead, data are disclosed in a distributed manner through the official websites of environmental protection departments. Therefore, this paper collects data from penalty information disclosure modules of 3,192 official Chinese websites of the environmental protection systems by using a web crawler and manual collection. Since these data formats are not standardized (e.g., text-format data, table-format data, etc.), we use different methods to extract keywords according to different digital formats (e.g., company name, punishment amount, etc.). Since technical levels and disclosure methods of environmental protection websites in different regions vary dramatically, some data cannot be counted or are missing. To reduce the impact of data collection uncertainty on regression results, enterprise-level data are aggregated to the provincial level. The total number of collected punishment records between 2006 and 2015 is 273,941.
This paper does not use the number of patents in the National Statistical Yearbook and the like to measure green technology innovation capability since it cannot be distinguished whether the number of patents under the existing statistical caliber are green patents, and it cannot be determined whether the patents are “decorative patents.” To keep consistent with the environmental punishment data and more accurately depict the regional green technology innovation capability, this paper recalculates the number of green patents based on the industrial and commercial database and the national intellectual property database. Specific steps are as follows.
Step 1. Identify green enterprises. Five categories of classification standards (pollution prevention and control, resource conservation and recycling, clean transportation, clean energy, and ecological protection and adaptation to climate change) of green enterprises are determined by comprehensively considering the classification standards of the National Economic Industry Classification (GB/T 4754-2017), Catalogue of Supported Projects of Green Bonds (2015 Edition), and Industry Classification of Listed Companies. Their corresponding national economy industry codes are extracted, and green enterprises are selected from more than 40 million enterprises in the national industrial and commercial enterprise database. For enterprises that lack industry codes, the word vector model and the support vector machine are used to analyze their enterprise names and business scopes, to determine their industry codes, and then map to their corresponding categories. About 200,000 enterprises in operation are obtained.
Step 2. Identify active enterprises. Because some patent-holding enterprises have few actual business activities, they need to be screened out via recruitment records or registered capital, and annual reports. About 77,000 active green enterprises are obtained through screening.
Step 3. Extract feature data. Patent data of the 77,000 enterprises are extracted from the national intellectual property database, and the number of patents is correlated and counted according to the region and time.
Through the above-mentioned screening and cleaning process, “decorative patents” are largely removed so that the number of patents can better measure the capacity of green technology innovation. This research study applied several methods to reduce the risk of data loss and inaccuracy. First, it combines python programs and manual methods to obtain data from the websites and then hires a professional team to check the reliability of the data. Second, many random audits were performed on the data before the model regression to ensure reliability.
Results
Regression Results
Table 1 shows the regression results of the SDM model under three spatial weights. The three groups of regression results are consistent, indicating a robust model. The coefficient of the number of environmental protection penalties (Supervision) is positive, indicating that the spot inspection policy has a significant positive impact on the number of green patents of a current region, while the coefficient of the space lag item (w × Supervision) is negative, indicating that the spot inspection policy has a negative spatial spillover effect, that is, the increased intensity of the environmental protection penalties of the current region inhibits green technology innovation in the surrounding regions. Therefore, H1 and H2 cannot be rejected.
Robustness Test
In order to ensure the reliability of the study findings, four robustness tests are conducted in this section as follows.
1) Wald spatial lag and LR spatial lag tests rejected the original hypothesis that the SDM model was transformed into a SAR model (p-value<0.01), and Wald spatial error and LR spatial error tests rejected the original hypothesis that the SDM model was transformed into a SEM model (p value < 0.01) (see Supplementary Table S.3, available online), which further validates the robustness of the SDM model selection.
2) The spatial hausman estimate was 39.81, p-value < 0.01, thus rejecting the random-effects model, which further verified the robustness of the two-way (unit and time) fixed-effect model.
3) The spatial autocorrelation coefficient is statistically significant and positive, which verifies that the spot inspection still shows significant spatial correlation under different matrices. The R-squares range from 0.86 to 0.89 under different spatial weight matrices, further verifying that spot inspection significantly affects green technology innovation.
4) To avoid the endogeneity problem between explanatory and explained variables, the explained variables are differenced (Ariu, 2016):
Direct Effect and Indirect Effect
The results of SDM regression can be further divided into a direct effect (impact of an explanatory variable on an explained variable of the current region) and an indirect effect (impact of an explanatory variable of an adjacent region on an explained variable of the current region) (Table 2).
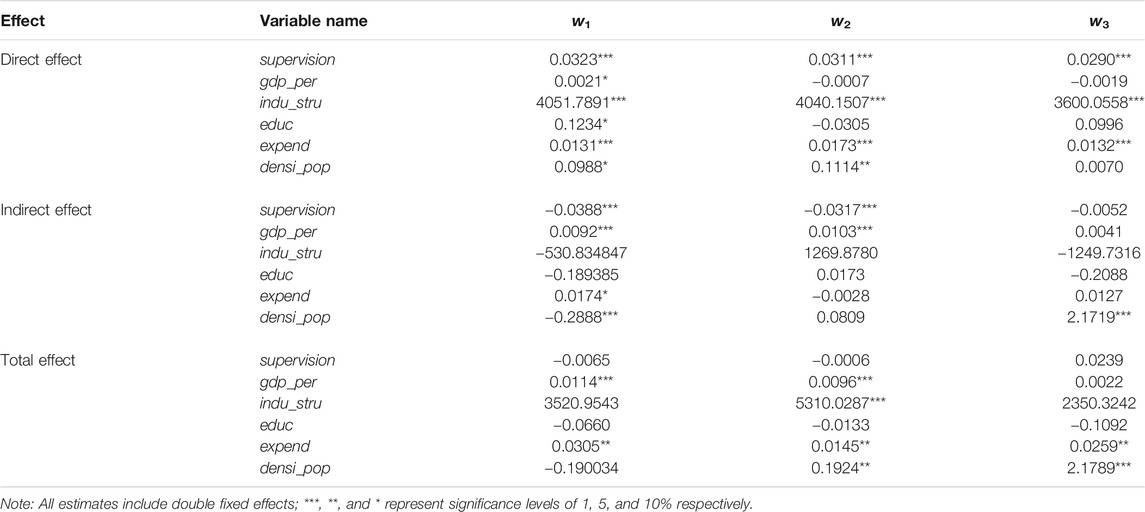
TABLE 2. Direct and indirect effect estimation results of spatial Durbin model.
Under the three spatial weight matrices, the direct effects of the number of environmental penalties are all significant, which shows that environmental protection penalties have a significant positive effect on green technology innovation within the region.
The indirect effect is significantly negative under the contiguity weight matrix (w1) and inverse distance weight matrix (w2), indicating that the spot inspection measures of the current region have a negative spillover effect on the technological innovation of enterprises in surrounding regions. However, under the economic distance weight (w3), the indirect effect is not significant, showing that pollution transfer is mainly achieved through the surrounding region. It implies that when relatively strict spot inspection measures are taken in the current region some enterprises transfer polluting projects to surrounding regions that are not punished by their policies for the “transferred” polluting enterprises. Therefore, due to the burden of innovation, the enthusiasm of green technology innovation in surrounding regions is weakened. Therefore, H2 cannot be rejected.
Spatial Heterogeneity
To prevent enterprises from grasping the spot inspection pattern and getting the opportunity of policy arbitrage, the spot inspection policy is implemented by using the strategy of spatial and time randomness. For the central government, there should be no significant regional differences in the fully randomly implemented check policies. However, due to the different levels of socioeconomic development and environmental enforcement, regional differences are inevitable.
Supplementary Table S.5 (available online) shows regression of China’s eastern, central, and western regions with the time-space two-way fixed Durbin model, and the economic distance weight matrix (w3) reflecting economic similarity is selected as the spatial weight matrix. Regarding the direct effect, the eastern and western regions have significant positive effects, while the central region is not significant. However, the spillover effect in the western region is negatively significant, showing the region’s spot inspection leads to the decline of green technology innovation in surrounding regions (meaning pollution transfer), while the spillover effect in the eastern and central regions is not significant. The spot inspection policy performs best in the eastern region and has successfully promoted green technology innovation, while in the western region, it has led to pollution transfer and in the central region it is ineffective.
The reasons for this may be: 1) the eastern region has a stringent environmental regulation system and higher cost of pollution transfer, causing enterprises to carry out more green technology innovation activities. 2) The economic development level and environmental enforcement strength of the western region differ significantly, allowing for more opportunities and lower costs for pollution transfer. 3) As an economic transition zone, the central region is insensitive to the spot inspection policy because of weak green technology innovation and poor environmental enforcement.
Provincial Differences
The spillover effect reflects the impact of the spot inspection policy of a province on other regions. The positive spillover effect indicates that the spot inspection policy of the province is conducive to the technological innovation of other provinces while otherwise it indicates the negative impact and there may be pollution transfer. To further understand the difference between the impacts of spot inspection on provinces, this paper uses the law of distance attenuation (Li and Chen, 2010). Then, based on the two-factor (capital and labor) production function in the extended Solow growth model (Solow, 1957), this paper introduces variables such as industrial structure and human capital, and considers technological innovation as exogenous variables, to measure the spillover effect of the spot inspection policy in 29 provinces on technological innovation in other provinces. The model is set as follows:
where
The sign and significance level of
Among 29 provinces and cities, spot inspection of 21 provinces and cities have positive spillover effects, and that of eight have negative spillover effects (Figure 2). Among the eight, Guangdong and Chongqing have serious negative spillover effects probably because they have broader development hinterlands for pollution transfer, which offsets the effect of the spot inspection policy significantly. Therefore, H3 cannot be rejected.
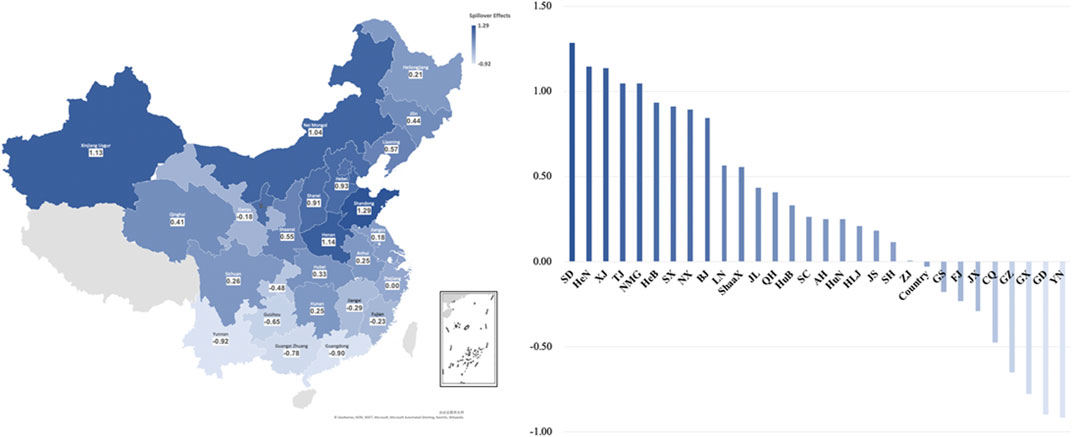
FIGURE 2. Distribution of spillover effects of spot inspection on technological innovation in each province.
To understand the results, we analyzed the environmental law enforcement documents published on the official websites and investigated relevant industry associations. We came to understand the reasons to be similar to three listed under the previous section, Spatial Heterogeneity.
Conclusion and Discussion
The results show that the spot inspection policy promotes green technology innovation to a certain extent, but there is pollution transfer and spatial heterogeneity. The main conclusions of this paper are as follows:
1) The spot inspection based on the command-and-control policy significantly promotes green technology innovation, but it also promotes the transfer of polluting enterprises and inhibits innovation in surrounding regions lacking strict environmental enforcement.
2) Pollution transfer caused by spot inspection is more likely to occur in adjacent regions, showing that there are significant regional differences in China's environmental penalty intensity and reducing the effectiveness of this policy. This may be because China's spot inspection policy adopts the mode of key check-in key regions, and some enterprises grasp the pattern of enforcement and move out of key regulatory regions, which leads to the formations of “Pollution Havens” (Sun, 2021).
3) There is a regional imbalance in the implementation of the random inspection policy, especially between the central and western regions. It is recommended that on-site inspection policies should pay more attention to regional imbalances, especially the opportunities for policy arbitrage. The government should continue to improve the existing monitoring technology, avoid defining the regulatory boundaries too clearly, and strengthen the randomness of inspections.
Overall, while maintaining a high-pressure posture on environmental protection, regulators should avoid the hedging of regulatory activities and strengthen expectations management when formulating regulatory strategies, i.e., by introducing more stochastic strategies to offset firms’ expectations of regulatory arbitrage, blurring the boundaries of regulatory regions and industries, and gradually eliminating regional differences.
This study has certain limitations. First, the data on random checks are obtained through public channels, so some information may be lost or inaccurate. Second, artificial intelligence algorithms are used in data collection and processing, but these methods have the problem of opacity, which may lead to uncertainties that are difficult to identify. However, this article proves that using big data methods to study environmental problems has potential, and the reliability of research can be improved by continuously improving algorithm technology. Additionally, although this study has found statistical correlation, the understanding of causality still needs to adopt richer methods for in-depth discussion.
Data Availability Statement
The original contributions presented in the study are included in the article/Supplementary Material, further inquiries can be directed to the corresponding authors.
Author Contributions
All authors listed have made a substantial, direct, and intellectual contribution to the work and approved it for publication. BC is responsible for methodology design and paper writing, MR is responsible for modeling and analysis, and LC is responsible for data collection and processing.
Funding
This work was supported by the Beijing Social Science Fund (No. 19JDLJB001).
Conflict of Interest
The authors declare that the research was conducted in the absence of any commercial or financial relationships that could be construed as a potential conflict of interest.
Supplementary Material
The Supplementary Material for this article can be found online at: https://www.frontiersin.org/articles/10.3389/fenvs.2021.676413/full#supplementary-material
Appendix
Contiguity weight matrix (0–1 contiguity weight matrix) w1 (see Supplementary Figure S.7, available online).
Inverse distance weight matrix w2 (see Supplementary Figure S.8, available online).
Economic distance weight matrix w3 (see Supplementary Figure S.9, available online).
References
Altıntaş, H., and Kassouri, Y. (2020). The Impact of Energy Technology Innovations on Cleaner Energy Supply and Carbon Footprints in Europe: A Linear versus Nonlinear Approach. J. Clean. Prod. 276, 124140. doi:10.1016/j.jclepro.2020.124140
Ariu, A. (2016). Crisis-proof Services: Why Trade in Services Did Not Suffer during the 2008–2009 Collapse. J. Int. Econ. 98, 138–149. doi:10.1016/j.jinteco.2015.09.002
Bergquist, A.-K., Söderholm, K., Kinneryd, H., Lindmark, M., and Söderholm, P. (2013). Command-and-control Revisited: Environmental Compliance and Technological Change in Swedish Industry 1970–1990. Ecol. Econ. 85, 6–19. doi:10.1016/j.ecolecon.2012.10.007
Eaton, S., and Kostka, G. (2017). Central Protectionism in China: The “central SOE Problem” in Environmental Governance. China Q. 231, 685–704. doi:10.1017/s0305741017000881
Guo, D., Bose, S., and Alnes, K. (2017). Employment Implications of Stricter Pollution Regulation in China: Theories and Lessons from the USA. Environ. Dev. Sustain. 19 (2), 549–569. doi:10.1007/s10668-015-9745-8
Jaffe, A. B., Newell, R. G., and Stavins, R. N. (2002). Environmental Policy and Technological Change. Environ. Resour. Econ. (Dordr) 22, 41–70. doi:10.1023/a:1015519401088
Jaffe, A. B., and Palmer, K. (1997). Environmental Regulation and Innovation: A Panel Data Study. Rev. Econ. Stat. 79 (4), 610–619. doi:10.1162/003465397557196
Jaffe, A. B., Peterson, S. R., Portney, P. R., and Stavins, R. N. (1995). Environmental Regulation and the Competitiveness of U.S. Manufacturing: What Does the Evidence Tell Us? J. Econ. Lit. 54 (33), 132–163. doi:10.2307/2728912
Jin, Y., Cheng, C., and Zeng, H. (2019). Is Evil Rewarded with Evil? the Market Penalty Effect of Corporate Environmentally Irresponsible Events. Bus. Strat. Env. 29 (3), 846–871. doi:10.1002/bse.2403
Kassouri, Y., Bilgili, F., and Peter Majok Garang, A. (2021). Are Government Energy Technology Research, Development, and Demonstration Budgets Converging or Diverging? Insights from OECD Countries. Tech. Anal. Strateg. Manag. 1–15. doi:10.1080/09537325.2021.1914330
Kostka, G. (2016). Command without Control: The Case of China's Environmental Target System. Regul. Governance 10 (1), 58–74. doi:10.1111/rego.12082
Lamperti, F., Napoletano, M., and Roventini, A. (2015). Preventing Environmental Disasters: Market-Based vs. Command-And-Control Policies. LEM, Working Papers. Available at: sciencedirect.com/science/article/pii/S0959652616316407 (Accessed January 2016).
Li, J., and Chen, A. (2010). A Study on the Spillover Effects and Transmission Channels of Inter-provincial Economic Growth in China. Ind. Technol. Econ. 29 (02), 138–142. doi:10.3969/j.issn.1004-910X.2010.02.033
Li, L., Liu, X., Ge, J., Chu, X., and Wang, J. (2019). Regional Differences in Spatial Spillover and Hysteresis Effects: A Theoretical and Empirical Study of Environmental Regulations on Haze Pollution in China. J. Clean. Prod. 230, 1096–1110. doi:10.1016/j.jclepro.2019.04.248
Li, R., and Ramanathan, R. (2018). Exploring the Relationships between Different Types of Environmental Regulations and Environmental Performance: Evidence from China. J. Clean. Prod. 196, 1329–1340. doi:10.1016/j.jclepro.2018.06.132
Li, W., Gu, Y., Liu, F., and Li, C. (2019a). The Effect of Command-And-Control Regulation on Environmental Technological Innovation in China: A Spatial Econometric Approach. Environ. Sci. Pollut. Res. Int. 26 (34), 34789–34800. doi:10.1007/s11356-018-3678-3
Liu, M., Chen, H., and Xu, Y. (2021). Study on the Effect of Environmental Regulation on Industrial Pollution Spillover: Empirical Evidence from 285 Cities Nationwide. J. Econ. Geogr. 02, 194–202. doi:10.15957/j.cnki.jjdl.2021.02.021
Pang, J., Mu, H., and Zhang, M. (2020). Interaction between Shadow Economy and Pollution: Empirical Analysis Based on Panel Data of Northeast China. Environ. Sci. Pollut. Res. 27 (17), 21353–21363. doi:10.1007/s11356-020-08641-3
Porter, M. E. (1991). Towards a Dynamic Theory of Strategy. Strat. Mgmt. J. 12 (S2), 95–117. doi:10.1002/smj.4250121008
Porter, M. E., and van der Linde, C. (1995). “Toward a New conception of the Environment-Competitiveness Relationship,” in A Reader on Environmental Law. Editor B. Hutter (Oxford: Springer).
Shangguan, X., and Ge, B. (2020). Scientific and Technological Innovation, Environmental Regulation and High-Quality Economic Development: Empirical Evidence from 278 Chinese Cities at Prefecture Level and above. China Popul. Resour. Environ. 06, 95–104.
Sheng, J., Zhou, W., and Zhang, S. (2019). The Role of the Intensity of Environmental Regulation and Corruption in the Employment of Manufacturing Enterprises: Evidence from China. J. Clean. Prod. 219, 244–257. doi:10.1016/j.jclepro.2019.02.113
Solow, R. M. (1957). Technical Change and the Aggregate Production Function. Rev. Econ. Stat. 39 (3), 312–320. doi:10.2307/1926047
Song, Y., Chen, S., and Zhang, M. (2020). Local Government Heterogeneity and Regional Environmental Cooperation—Evolutionary Game Analysis Based on Chinese Decentralization. Chin. J. Manag. Sci. 28 (1), 201–211. doi:10.16381/j.cnki.issn1003-207x.2020.01.017
Song, Y., Li, Z., Yang, T., and Xia, Q. (2020a). Does the Expansion of the Joint Prevention and Control Area Improve the Air Quality?-Evidence from China's Jing-Jin-Ji Region and Surrounding Areas. Sci. Total Environ. 706, 136034. doi:10.1016/j.scitotenv.2019.136034
Stavropoulos, S., Wall, R., and Xu, Y. (2018). Environmental Regulations and Industrial Competitiveness: Evidence from China. Appl. Econ. 50 (12), 1378–1394. doi:10.1080/00036846.2017.1363858
Sun, B. (2021). Research on Environmental Regulation and “Pollution Heaven Effect” of New Enterprises. Reg. Econ. Rev. 01, 131–143. doi:10.14017/j.cnki.2095-5766.2021.0017
Sun, Y., Du, J., and Wang, S. (2020). Environmental Regulations, enterprise Productivity, and green Technological Progress: Large-Scale Data Analysis in China. Ann. Oper. Res. 290 (1-2), 369–384. doi:10.1007/s10479-019-03249-4
Van Rooij, B., and Lo, C. W. H. (2009). Fragile Convergence: Understanding Variation in the Enforcement of China’s Industrial Pollution Law. L. Pol. 32 (1), 14–37. doi:10.1111/j.1467-9930.2009.00309.x
Van Rooij, B., Zhu, Q., Na, L., and Qiliang, W. (2017). Centralizing Trends and Pollution Law Enforcement in China. China Q. 231, 583–606. doi:10.1017/s0305741017000935
Wang, X., and Wang, T. (2020). Research on Local Government’s Competition Pressure, Environmental Regulation and Technological Innovation. Ecol. Econ. 11, 151–158.
Wang, Y., and Shen, N. (2016). Environmental Regulation and Environmental Productivity: The Case of China. Renew. Sust. Energ. Rev. 62, 758–766. doi:10.1016/j.rser.2016.05.048
Wu, W., Wang, W., and Zhang, M. (2020). Using China's Provincial Panel Data Exploring the Interaction between Socio-Economic and Eco-Environment System. Ecol. Complexity 44, 100873. doi:10.1016/j.ecocom.2020.100873
Xiang, C., and van Gevelt, T. (2020). Central Inspection Teams and the Enforcement of Environmental Regulations in China. Environ. Sci. Pol. 112, 431–439. doi:10.1016/j.envsci.2020.06.018
Yang, M., Yan, X., and Li, Q. (2020). Study on the Impact of Environmental Regulation on the Efficiency of Industrial Pollution Control in China. China Popul. Resour. Environ. 09, 54–61.
Ye, Q., Dai, S., and Zeng, G. (2018). Research on the Effects of Command-And-Control and Market-Oriented Policy Tools on China's Energy Conservation and Emissions Reduction Innovation. Chin. J. Popul. Resour. Environ. 16 (1), 1–11. doi:10.1080/10042857.2017.1418273
Zhang, M., Liu, X., Sun, X., and Wang, W. (2020). The Influence of Multiple Environmental Regulations on Haze Pollution: Evidence from China. Atmos. Pollut. Res. 11 (6), 170–179. doi:10.1016/j.apr.2020.03.008
Zhang, M., Sun, R., and Wang, W. (2021). Study on the Effect of Public Participation on Air Pollution Control Based on China's Provincial Level Data. Environ. Dev. Sustainability, 1–14. doi:10.1007/S10668-020-01186-Y
Zhao, L., Gao, H., and Xiao, Q. (2021). An Empirical Study on the Impact of Environmental Regulation on the Efficiency of green Technology Innovation. Stat. Decis. 03, 125–129. doi:10.13546/j.cnki.tjyjc.2021.03.027
Keywords: spot inspection, command and control, innovation, spillover effect, pollution transfer
Citation: Chen B, Ren M and Chen L (2021) Impact Analysis of Large-Scale Environmental Spot Inspection Policy on Green Innovation: Evidence From China. Front. Environ. Sci. 9:676413. doi: 10.3389/fenvs.2021.676413
Received: 05 March 2021; Accepted: 10 May 2021;
Published: 28 May 2021.
Edited by:
Faik Bilgili, Erciyes University, TurkeyReviewed by:
Luigi Aldieri, University of Salerno, ItalyYacouba Kassouri, Leipzig University, Germany
Copyright © 2021 Chen, Ren and Chen. This is an open-access article distributed under the terms of the Creative Commons Attribution License (CC BY). The use, distribution or reproduction in other forums is permitted, provided the original author(s) and the copyright owner(s) are credited and that the original publication in this journal is cited, in accordance with accepted academic practice. No use, distribution or reproduction is permitted which does not comply with these terms.
*Correspondence: Meitong Ren, cmVubWVpdG9uZzE5OThAdWNoaWNhZ28uZWR1; Liye Chen, Y2hlbl9saXllQDE2My5jb20=