 Dorcas Ofori-Boateng
 Huikyo Lee
 Krzysztof M. Gorski2
 Michael J. Garay
 Yulia R. Gel
- 1Fariborz Maseeh Department of Mathematics and Statistics, Portland State University, Portland, OR, United States
- 2Jet Propulsion Laboratory, California Institute of Technology, Warsaw University Observatory, Warszawa, Poland
- 3Department of Mathematical Sciences, University of Texas at Dallas, Dallas, TX, United States
Topological data analysis (TDA) combines concepts from algebraic topology, machine learning, statistics, and data science which allow us to study data in terms of their latent shape properties. Despite the use of TDA in a broad range of applications, from neuroscience to power systems to finance, the utility of TDA in Earth science applications is yet untapped. The current study aims to offer a new approach for analyzing multi-resolution Earth science datasets using the concept of data shape and associated intrinsic topological data characteristics. In particular, we develop a new topological approach to quantitatively compare two maps of geophysical variables at different spatial resolutions. We illustrate the proposed methodology by applying TDA to aerosol optical depth (AOD) datasets from the Goddard Earth Observing System, Version 5 (GEOS-5) model over the Middle East. Our results show that, contrary to the existing approaches, TDA allows for systematic and reliable comparison of spatial patterns from different observational and model datasets without regridding the datasets into common grids.
1 Introduction
While systematic, multi-model experimentation and evaluation have been undertaken for years (e.g., the Coupled Model Intercomparison Project—CMIP—Taylor et al. (2012); Eyring et al. (2016)), the development and application of methodologies for comparing spatial patterns in key climate variables from observational and model datasets with different spatial resolutions are less mature. For example, the following three metrics are widely used to quantitatively compare spatial patterns of climate variables of interest: 1) the bias of a two-dimensional map against another map, 2) the root mean square error (RMSE) between two maps, and 3) a pattern correlation coefficient. The Taylor diagram (Taylor, 2001) is also popular among climate modelers since it displays both RMSE and a pattern correlation coefficient simultaneously. In this way, Taylor diagrams provide a concise summary of the similarity in spatial patterns useful for quantitative comparison of different datasets. The main challenge in using these conventional metrics is the need to remap datasets onto a common grid prior to calculating the metrics. The regridding process eliminates native differences in spatial resolutions across datasets. In addition, there is no community standard for regridding datasets onto common grids, although datasets at higher resolutions are usually upscaled onto low-resolution grids for the quantitative comparison with lower resolution datasets. In this way, the regridding averages out fine-scale features contained in the high-resolution datasets without elucidating the information lost due to the upscaling.
Here, we test the ability to facilitate the comparison of two-dimensional datasets at different spatial resolutions by applying tools of topological data analysis (TDA). TDA is emerging machinery at the interface of algebraic topology, machine learning, statistics, and data science. The key goal of TDA is to evaluate the “shape” properties of data. These shape properties are invariant under continuous transformations such as stretching, bending, and twisting. TDA has shown high utility in a diverse range of applications, from social studies to digital health care, to power systems. However, the utility of TDA in Earth science applications remains largely unexplored. In particular, to the best of our knowledge, TDA techniques have been employed in only two previous Earth science studies–identifying atmospheric river patterns (Muszynski et al., 2019) and assessing the influence of various climate variables on wildfires (Kim and Vogel, 2019). In this study, we use TDA, specifically one of its tools known as persistent homology (PH), to build a robust and reliable methodology that compares spatial patterns in aerosol optical depth (AOD) maps at different spatial resolutions based on a systematic assessment of their topology and geometry. In particular, we assess two AOD datasets from the Goddard Earth Observing System, Version 5 (GEOS-5) model over the Middle East, and compare our findings to the two conventional metrics: biases and RMSEs.
2 Data
As a primary objective, we focus on comparing biases and RMSEs with results reported by our TDA measure. In particular, two different total column AOD simulations from GEOS-5 will be compared over the Middle East. The Middle East was chosen because it is one of the largest sources of dust aerosols on Earth (Yu et al., 2018), and the aerosols originating there significantly influence radiation budget (Tegen and Lacis, 1996), ocean biogeochemistry (Li et al., 2018), transportation, and public health (Thalib and Al-Taiar, 2012). As such, it is important to identify and characterize spatial patterns of dust storms over the region using various observational and model datasets.
The GEOS-5 Nature Run (G5NR, Modeling and Office (2014)) provides simulated AOD for the 2 years between June 2005 and May 2007. Thanks to its higher horizontal resolution of 7 km than most global models, G5NR has been used to simulate the radiance observed by satellite-based instruments. The Modern-Era Retrospective analysis for Research and Applications, Version 2 (MERRA-2, Randles et al. (2017); Buchard et al. (2017)) is also based on the GEOS-5 forecast model, but involves state-of-art reanalysis including assimilation of AOD from the ground- and satellite-based instruments, including the Aerosol Robotic Network (AERONET, Holben et al. (1998)), the Moderate Resolution Imaging Spectroradiometer (MODIS, Levy et al. (2013)), the Multi-angle Imaging SpectroRadiometer (MISR, Garay et al. (2020)), and the Advanced Very-High-Resolution Radiometer (AVHRR, Zhao et al. (2008)). As such, the AOD fields in MERRA-2 are expected to be more realistic than those in G5NR. The difference in AOD between G5NR and MERRA-2 shown in Figure 1 is the primary focus of the current study. A number of previous studies have demonstrated the added value of the AOD assimilation used in MERRA-2 through extensive comparisons with independent observations (e.g., Buchard et al., 2017). However, MERRA-2’s horizontal resolution of
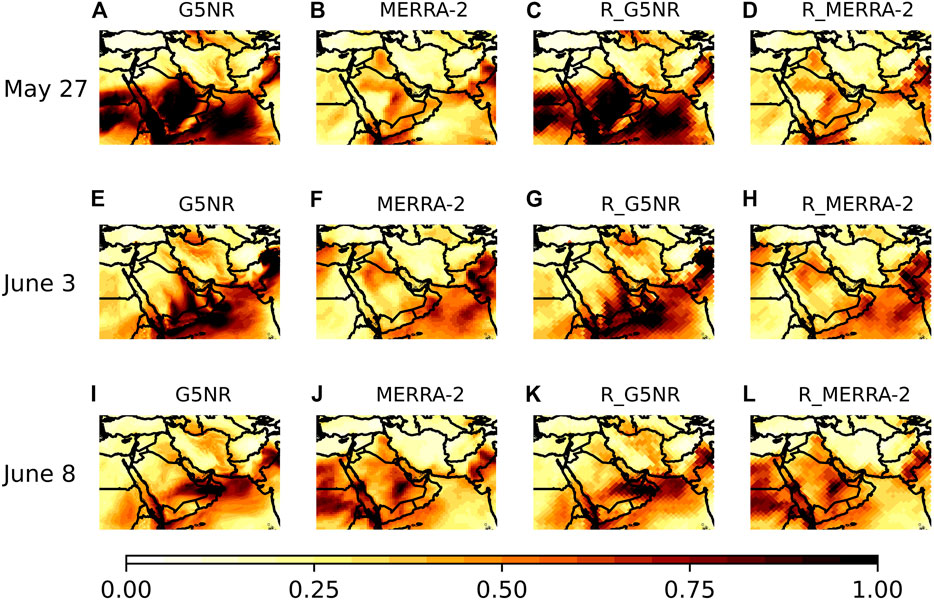
FIGURE 1. (Top) Daily mean AOD from (A) G5NR and (B) MERRA-2 on May 27th, 2006. (C) and (D) are remapped (A) and (B) into lower-resolution pixels with 102 km grid spacing. (Middle)(E)–(H) are same as (A)–(D), but for June 3rd, 2006. (Bottom)(I)–(L) are same as (A)–(D) but for June 8th, 2006.
3 Methods
To systematically quantify the latent shape of these AOD datasets, we employ the TDA tool known as persistent homology (PH). The key idea of PH is to track the evolution and/or lifespan of topological features related to the dataset of interest as the resolution changes. Since the current study focuses on the comparison of total column AOD maps (2-dimensional images) between G5NR and MERRA-2, the approach should ideally account for the natural representation of the gridded datasets. In the case of image and gridded datasets, a cubical complex has been found to be the best choice for the efficient extraction of topological properties (Wagner et al., 2012; Otter et al., 2017; Garin and Tauzin, 2019; Ramachandran et al., 2020).
The basic unit of a cubical complex is the elementary interval (i.e., an interval of the form [
The PH approach with cubical complexes is based on the following two key steps. First, we build a cubical complex by allocating a vertex to every pixel in the image data, connect the vertices of adjoining pixels that are less than or equal to a threshold/scale (
To quantify the shape properties of the AOD data and to assess the “life cycle” of appearing and disappearing topological features, we use the notion of the persistence diagram (PD, Carlsson (2009); Zomorodian (2010); Kerber et al. (2016)). A PD is a multi-set
Figure 2I,II illustrate the mechanism underlying the cubical complex filtration and how to obtain PDs using a simple array of 16 AOD values. With a sequence of AOD thresholds,
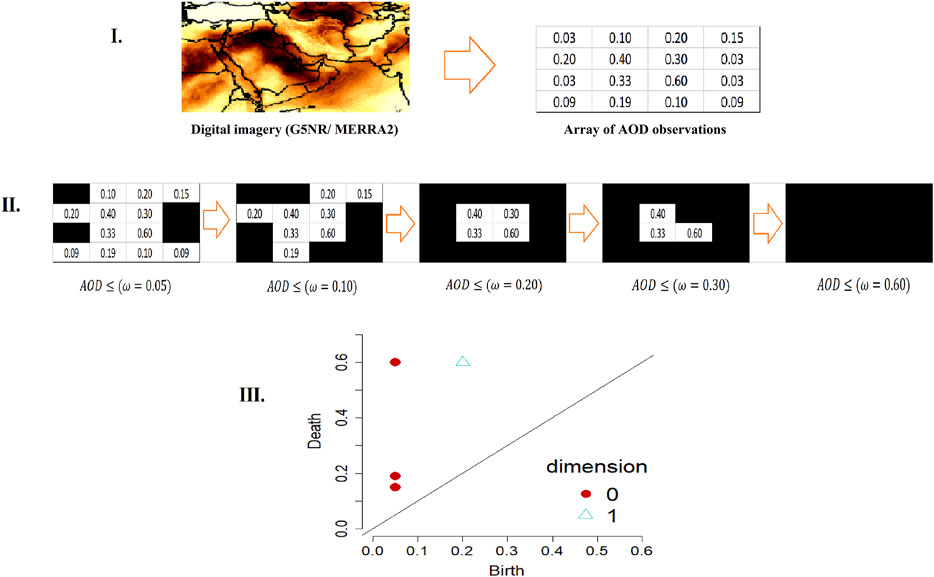
FIGURE 2. Illustration of cubical complex filtration with its respective summary of topological features. (I) A map of AOD observations, which can also be viewed as a two-dimensional array. (II) Filtration of cubical complexes from the array of AOD observations. Shaded regions constitute two-dimensional elementary cubes (i.e., squares) formed as the similarity scale changes. (III) Persistence diagram reflecting the lifespan of connected components (0-dimensional objects) and holes (1-dimensional objects) seen in II.
In our TDA approach, we do not directly compare AOD maps. Instead, two AOD maps from MERRA2 and G5NR,
where γ ranges over all bijections between
4 Results
On each day between May 16th and June 15th, 2006, we calculated the Wasserstein distances,
Figure 3 compares the results as a function of day. Each metric is normalized to fall in the range from 0 to 1. The first thing that is apparent is that all four metrics have similar overall behavior, which means that Wasserstein distances are consistent with biases and RMSEs. The time series of the remapped Wasserstein distances,
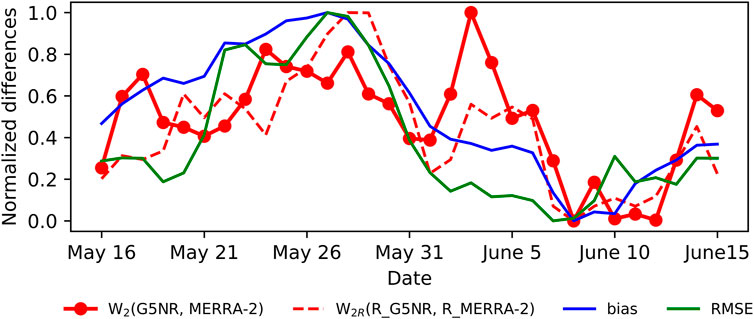
FIGURE 3. The red solid line represents normalized
In general, G5NR and MERRA-2 show poorer agreement between about May 21st and May 31st, with the worst agreement (highest bias and RMSE) on May 27th. According to Figure 1 (top row), this is when G5NR indicates a dust storm (high AODs), while MERRA-2 does not have significant dust. Conversely, on June 8th, all the metrics show the best agreement between G5NR and MERRA-2, which is consistent with Figure 1 (bottom row). Figure 4 presents PDs generated from the daily mean AOD maps from G5NR and MERRA-2 on May 27th (worst agreement) and June 8th (best agreement), respectively. Notice that the structure of the PDs (fraction of points close to the
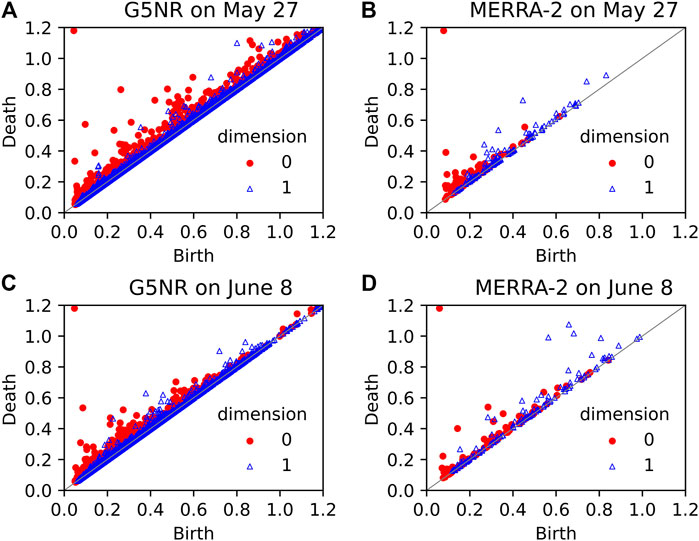
FIGURE 4. (Top) Persistence diagrams for (A) G5NR and (B) MERRA-2 on May 27th, 2006. (Bottom) Same as (A)–(B) but for June 8th, 2006.
What is perhaps most interesting are those few cases when the conventional metrics and
Until now, we have shown that there are considerable topological differences in the AOD maps between G5NR and MERRA-2, even during the relatively short period of one month. It is important to check if these differences are sensitive to biases in G5NR’s AOD. Overall, G5NR AOD exhibits a positive bias of 0.1 against MERRA-2, which is the difference averaged spatially and temporally. Figure 5 shows the sensitivity of
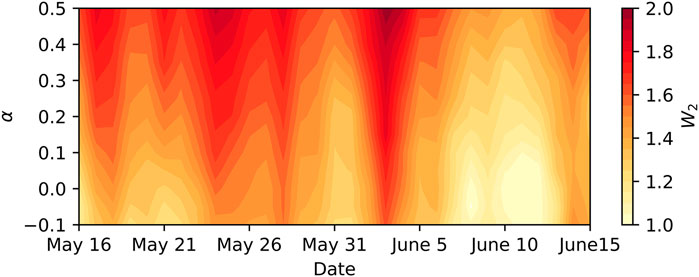
FIGURE 5.
5 Discussion
To the best of our knowledge, there is yet no quantitative metric to measure differences in spatial patterns between Earth science datasets at different spatial resolutions without regridding them onto a common grid. In this work, we have utilized TDA concepts and, in particular, persistence diagrams to summarize the spatial patterns in AOD maps. Our analysis suggests that the Wasserstein distance between the persistent diagrams of two datasets can be a competitive alternative for the conventional metrics and Taylor diagrams. The time series of the Wasserstein distance between the regridded datasets is consistent with the two conventional metrics, biases and RMSEs, which are widely used by climate scientists. Contrary to these existing approaches that require regridding the data to a common spatial scale, our new TDA-based measure allows us to systematically evaluate multi-resolution data without requiring regridding.
However, there are intrinsic uncertainties in any AOD output from the GEOS-5 model, including G5NR and MERRA-2. The issue is that these uncertainties are high variable spatially and temporally, thus cannot be reasonably represented by the mean bias, α, as in Figure 5. As such, examination of the sensitivity of these uncertainties to topological features and
In addition, theoretical analysis on consistency and stability as validation criteria for testing multi-resolution data yet does not exist, not only in applied sciences but also in pure mathematics in general, as it entails the development of new fundamental concepts in both algebraic and computational topology. However, most recently there have appeared some attempts to address topological properties associated with utilizing persistent homology as a measure of quality for Voronoi interpolation (Melodia and Lenz, 2020). Given the fundamental problems in pure mathematics and the applied nature of the journal, we leave the development of theoretical analysis for our proposed method to future research.
Nevertheless, the utility of TDA to address multi-resolution image data matching remains largely untapped not only in the Earth science applications but in image analyses, in general. Using the two AOD datasets from the GEOS-5 model as an illustrative case study, we have taken the first step toward a better understanding of the intrinsic relationships among topological properties in Earth science datasets at different spatial resolutions, to glean insight into what gains (if any) are delivered by an increasing spatial resolution of a dataset.
Our findings suggest that TDA enables us to quantify some higher-order image properties which are inaccessible with the standard multi-resolution matching routines. Consequently, this opens a wider prospect for the application of topological approaches in Earth sciences as demonstrating the added value of high-resolution datasets using the criterion of topological information loss and developing TDA-based toolkits for weather and climate model evaluation against observations at various spatial resolutions.
Data Availability Statement
The original contributions presented in the study are included in the article/Supplementary Material, further inquiries can be directed to the corresponding author.
Author Contributions
Conceptualization: YG and HL. Methodology: YG and DO. Software: DO and HL. Validation: MG. Formal Analysis: DO and HL. Original Draft Preparation: DO. Review and Editing: MG, and KG. Visualization: DO and HL.
Funding
This research was carried out at the Jet Propulsion Laboratory, California Institute of Technology, under a contract with the National Aeronautics and Space Administration and funded through the internal Research and Technology Development program and National Science Foundation DMS 1925346.
Conflict of Interest
The authors declare that the research was conducted in the absence of any commercial or financial relationships that could be construed as a potential conflict of interest.
Acknowledgments
This research was carried out at the Jet Propulsion Laboratory, California Institute of Technology, under a contract with the National Aeronautics and Space Administration.
References
Allili, M., Mischaikow, K., and Tannenbaum, A. (2001). Cubical Homology and the Topological Classification of 2d and 3d Imagery. In Proceedings 2001 International Conference on Image Processing (Cat. No.01CH37205). vol. 2, 173–176.
Buchard, V., Randles, C. A., da Silva, A. M., Darmenov, A., Colarco, P. R., Govindaraju, R., et al. (2017). The Merra-2 Aerosol Reanalysis, 1980 Onward. Part Ii: Evaluation and Case Studies. J. Clim. 30, 6851–6872. doi:10.1175/Jcli-D-16-0613.1
Eyring, V., Bony, S., Meehl, G. A., Senior, C. A., Stevens, B., Stouffer, R. J., et al. (2016). Overview of the Coupled Model Intercomparison Project Phase 6 (Cmip6) Experimental Design and Organization. Geosci. Model. Dev. 9, 1937–1958. doi:10.5194/gmd-9-1937-2016
Garay, M. J., Witek, M. L., Kahn, R. A., Seidel, F. C., Limbacher, J. A., Bull, M. A., et al. (2020). Introducing the 4.4 Km Spatial Resolution Multi-Angle Imaging Spectroradiometer (Misr) Aerosol Product. Atmos. Meas. Tech. 13, 593–628. doi:10.5194/amt-13-593-2020
Garin, A., and Tauzin, G. (2019). A Topological” reading” Lesson: Classification of Mnist Using Tda (arXiv preprint arXiv:1910.08345.
Holben, B. N., Eck, T. F., Slutsker, I., Tanré, D., Buis, J. P., Setzer, A., et al. (1998). AERONET-A Federated Instrument Network and Data Archive for Aerosol Characterization. Remote Sensing Environ. 66, 1–16. doi:10.1016/S0034-4257(98)00031-5
Kerber, M., Morozov, D., and Nigmetov, A. (2016). Geometry Helps to Compare Persistence Diagrams. In Proceedings of the 18th Workshop on Algorithm Engineering and Experiments (ALENEX), 103–112.
Kim, H., and Vogel, C. (2019). Deciphering Active Wildfires in the Southwestern usa Using Topological Data Analysis. Climate 7, 135. doi:10.3390/cli7120135
Levy, R. C., Mattoo, S., Munchak, L. A., Remer, L. A., Sayer, A. M., Patadia, F., et al. (2013). The Collection 6 Modis Aerosol Products over Land and Ocean. Atmos. Meas. Tech. 6, 2989–3034. doi:10.5194/amt-6-2989-2013
Li, W. Z., El-Askary, H., Qurban, M. A., Proestakis, E., Garay, M. J., Kalashnikova, O. V., et al. (2018). An Assessment of Atmospheric and Meteorological Factors Regulating Red Sea Phytoplankton Growth. Remote Sensing 10. doi:10.3390/rs10050673
Melodia, L., and Lenz, R. (2020). Persistent Homology as Stopping-Criterion for Voronoi Interpolation. Springer International Publishing), Combinatorial Image Analysis, 29–44. doi:10.1007/978-3-030-51002-2_3
Modeling, G., and Office, A. (2014). File Specification for the 7-km GEOS-5 Nature Run, Ganymed Release. Rep. Earth Sci. Division, NASA Goddard Space Flight Cent.
Muszynski, G., Kashinath, K., Kurlin, V., Wehner, M., and Prabhat, (2019). Topological Data Analysis and Machine Learning for Recognizing Atmospheric River Patterns in Large Climate Datasets. Geoscientific Model. Dev. (Online) 12. doi:10.5194/gmd-12-613-2019
Otter, N., Porter, M. A., Tillmann, U., Grindrod, P., and Harrington, H. A. (2017). A Roadmap for the Computation of Persistent Homology. EPJ Data Sci. 6, 17. doi:10.1140/epjds/s13688-017-0109-5
Ramachandran, R. K., Kakish, Z., and Berman, S. (2020). Information Correlated Levy Walk Exploration and Distributed Mapping Using a Swarm of Robots. IEEE Trans. Robotics.
Randles, C. A., da Silva, A. M., Buchard, V., Colarco, P. R., Darmenov, A., Govindaraju, R., et al. (2017). The Merra-2 Aerosol Reanalysis, 1980 Onward. Part I: System Description and Data Assimilation Evaluation. J. Clim. 30, 6823–6850. doi:10.1175/Jcli-D-16-0609.1
Taylor, K. E., Stouffer, R. J., and Meehl, G. A. (2012). An Overview of Cmip5 and the experiment Design. Bull. Am. Meteorol. Soc. 93, 485–498. doi:10.1175/Bams-D-11-00094.1
Taylor, K. E. (2001). Summarizing Multiple Aspects of Model Performance in a Single Diagram. J. Geophys. Res. 106, 7183–7192. doi:10.1029/2000jd900719
Tegen, I., and Lacis, A. A. (1996). Modeling of Particle Size Distribution and its Influence on the Radiative Properties of mineral Dust Aerosol. J. Geophys. Research-Atmospheres 101, 19237–199619244.
Thalib, L., and Al-Taiar, A. (2012). Dust Storms and the Risk of Asthma Admissions to Hospitals in kuwait. Sci. Total Environ. 433, 347–351. doi:10.1016/j.scitotenv.2012.06.082
Wagner, H., Chen, C., and Vuçini, E. (2012). Efficient Computation of Persistent Homology for Cubical Data. In Topological methods in data analysis and visualization II. Springer, 91–106. doi:10.1007/978-3-642-23175-9_7
Wasserman, L. (2018). Topological Data Analysis. Annu. Rev. Stat. Appl. 5, 501–532. doi:10.1146/annurev-statistics-031017-100045
Yu, Y., Kalashnikova, O. V., Garay, M. J., Lee, H., and Notaro, M. (2018). Identification and Characterization of Dust Source Regions across north Africa and the Middle East Using Misr Satellite Observations. Geophys. Res. Lett. 45, 6690–6701. doi:10.1029/2018gl078324
Zhao, T. X. P., Laszlo, I., Guo, W., Heidinger, A., Cao, C., Jelenak, A., et al. (2008). Study of Long-Term Trend in Aerosol Optical Thickness Observed from Operational Avhrr Satellite Instrument. J. Geophys. Research-Atmospheres 113. doi:10.1029/2007jd009061
Keywords: topological data analysis, aerosol optical depth, comparison of spatial patterns, spatial pattern analyses, aerosols
Citation: Ofori-Boateng D, Lee H, Gorski KM, Garay MJ and Gel YR (2021) Application of Topological Data Analysis to Multi-Resolution Matching of Aerosol Optical Depth Maps. Front. Environ. Sci. 9:684716. doi: 10.3389/fenvs.2021.684716
Received: 23 March 2021; Accepted: 25 May 2021;
Published: 23 June 2021.
Edited by:
Juergen Pilz, University of Klagenfurt, AustriaReviewed by:
Tianhai Cheng, Institute of Remote Sensing and Digital Earth (CAS), ChinaJian Xu, Helmholtz Association of German Research Centers (HZ), Germany
Copyright © 2021 Ofori-Boateng, Lee, Gorski, Garay and Gel. This is an open-access article distributed under the terms of the Creative Commons Attribution License (CC BY). The use, distribution or reproduction in other forums is permitted, provided the original author(s) and the copyright owner(s) are credited and that the original publication in this journal is cited, in accordance with accepted academic practice. No use, distribution or reproduction is permitted which does not comply with these terms.
*Correspondence: Huikyo Lee, aHVpa3lvLmxlZUBqcGwubmFzYS5nb3Y=