 S. M. Ayling
 Jill Thompson2
 A. Gray
 L. J. McEwen
- 1Department of Geography and Environmental Management, University of the West of England, Bristol, United Kingdom
- 2UK Centre for Ecology & Hydrology, Edinburgh, United Kingdom
In the United Kingdom, agricultural grasslands cover 40% of the land area, make up 89% of the total agricultural area and are an important land use for ecosystem services and food security. Climate change predictions suggest that the United Kingdom will experience more frequent and severe periods of drought that may impact these grasslands. As part of the Drought Risk and You (DRY) project, a field experiment in which rain shelters reduced precipitation reaching the vegetation by approximately 50%, was set up in the South West of England. The experiment ran for 3 years, from October 2015 to October 2018. The study was carried out at two locations in the catchment of the Bristol River Frome. Both sites were species-rich semi-natural pastures that had received no inputs of fertilizer or herbicide for many years. Automatic weather stations recorded environmental conditions, especially rainfall, within the experimental area. The existing agricultural management regimes were approximated by cutting the vegetation in the plots, by hand, at the appropriate times of year. The effect of rainfall reduction on plant growth was assessed by biomass sampling. At both sites, the rainfall reduction treatment had only small effects on total above ground dry matter production (biomass). These effects were much smaller than the year-to-year variation in total biomass. Our results suggested that well-established permanent pastures in the South West of England were able to tolerate a 3-year period of reduced water supply. The observed year-to-year variation in biomass demonstrated how important the timing of dry weather is for biomass production, and this will be reflected in effects on yield and quality of hay.
1 Introduction
The Earth is experiencing a period of rapid climate change that is likely to impact human activities (National Aeronautics and Space Administration, 2020). International organizations and national governments have raised concerns about how agricultural production, cropping systems, and food security will be affected by climate change (Rivington and Koo, 2010; Elliott et al., 2014). A particular concern is how changes in the distribution of rainfall amounts and events (Met Office, 2018a), particularly periods of drought, will affect agriculture and crop growing conditions.
Droughts and periods of water scarcity are a natural part of all climates. Droughts can be defined in many different ways: meteorological based on lack of rainfall, hydrological reflecting reduced run off or aquifer recharge and agricultural when the availability of soil water for crops is reduced (Marsh et al., 2007). Drought and water scarcity can have wide-ranging impacts: on crop growth (affecting both yield and quality); wildlife (for example, low river flows and associated decreases in water quality can increase mortality in aquatic life, dry conditions can cause newly planted vegetation to die and hasten the death of old or diseased plants); human health (for example, food shortages can lead to malnutrition, worry about food and water supplies can lead to mental health problems); and the economy (the cost of damage due to subsidence associated with the 1976 United Kingdom drought is estimated at £100 million) (Rodda and Marsh, 2011; Staniak and Kocoń, 2015; Edwards et al., 2018).
The United Kingdom has historically experienced periods of drought, for example in 1976, 1990–1992, 1995–1997, 2004–2006, and 2010–2012 (Marsh et al., 2007; Kendon et al., 2013; Met Office, 2013; Environment Agency, 2017). Although droughts can occur at any time of year, in United Kingdom periods of high pressure during the summer are often associated with high temperatures and low rainfall (Met Office, 2021a). The United Kingdom Climate Projections 2018 (UKCP18) (Met Office, 2018a) suggest that by 2050s, hot dry summers, such as the United Kingdom experienced in 2018, could become very common, happening around 50% of the time. Increased summer temperatures will increase rates of evaporation and demand for water. Met Office models show that there is now about a 12% chance of summer average temperatures being as high as the United Kingdom experienced in summer 2018 (Met Office, 2018b); these changes will make droughts and periods of water scarcity more frequent and more severe.
There have been many investigations of the effects of reduced rainfall and drought on grasslands (see for examples Knapp and Smith, 2001; Beier et al., 2012; Wilcox et al., 2017). This reflects the global importance of grasslands, the most widespread vegetation type in the World, covering 52.5 million km2 (FAO, 2005). Many of these studies are from semi-arid environments, where rainfall is likely to be a factor limiting productivity. There have been relatively few investigations in regions where annual rainfall is unlikely to limit productivity (Matos et al., 2020), and these have produced a range of results. Studies of United Kingdom grasslands have tended to be either on unproductive, but ecologically important, grasslands (Grime et al., 2008; Cole et al., 2019) or on recently established pastures (Grime et al., 2000; Fry et al., 2014). There is little published empirical information about the impact of reduced rainfall on well-established agriculturally productive grasslands.
Agricultural grasslands cover almost 40% of the United Kingdom (Office of National Statistics (ONS), 2018). Grasses are the most important agricultural crop in the country (by area); 89% of all United Kingdom agricultural lands are grasslands (including cereals) (Office of National Statistics (ONS), 2017; Office of National Statistics (ONS), 2018). In 2017 there were 5.363 × 10⁶ ha of pastures (22%), and 4.157 × 10⁶ ha (17%) of semi-natural grasslands (Office of National Statistics (ONS), 2018). This proportion has changed little over the last 60 years; in 1960, around 90% of farmland was under grass of some sort (Moore, 1966). These grasslands support around 10 million cattle and calves and 34 million sheep and lambs. In 2013/14, forage crops contributed £265 million to farm income and the livestock industry £8,889 million (Office of National Statistics (ONS), 2014).
Permanent pastures are agricultural grasslands that have not been ploughed for at least 5 years (Office of National Statistics (ONS), 2020). These pastures may support a wide range of plant and animal species (Bunce et al., 1999; Natural England, 2001; Johansen et al., 2019), and can include semi-natural grasslands with less intensive farming practices. Grassland soils, particularly those under grasslands with a high diversity of different species, can also be an important carbon store (Alonoso et al., 2012; Natural England 2012; Moxley et al., 2014; Moxley and Malcolm, 2014). Permanent pastures often have high water infiltration rates. Infiltration rates from 60 to 600 mm water per hour have been reported depending on the soil type, management and method used; rates are usually higher on permanent pastures than on arable fields and increase with biodiversity (Holtan and Kirkpatrick, 1950; Emmerling et al., 2015; Leimer et al., 2021). This suggests permanent pastures can be important to catchment flood management. In the United Kingdom, winters are predicted to become warmer and wetter, with more frequent episodes of heavy rain (Met Office, 2018a). Thus permanent pastures are important not only economically, but have potential to mitigate some of the impacts of climate change. The importance of permanent pastures is recognized within the United Kingdom Government Basic Payment Scheme for farmers. Farmers may not plough grassland that has been established for more than 15 years without an inspection and approval from Natural England (Rural Payments Agency, 2020). Permanent pastures are not uniformly distributed across the United Kingdom, and are more widespread in the South West of England where they make up 48% of the agricultural area than in the East of England where they are only 11% of the agricultural area (Defra, 2021).
We investigated the potential impact of changing climate on the productivity of pastures in the South West of England by studying the effects of reduced rainfall on two permanent pastures in the catchment of the Bristol River Frome, South Gloucestershire, United Kingdom. Summer rainfall in the Frome catchment is predicted to fall by 29% by the 2080s (based on the UKCP09 high emissions scenario; Afzal and Ragab, 2019). We selected a rainfall reduction of 50% to test of the resilience of productivity in permanent pastures to reductions in rainfall.
We set out to answer whether a 50% reduction in incident rainfall would reduce above ground dry matter (biomass) production; alter the biomass proportions from different plant functional types; and reduce regrowth of vegetation after a summer hay cut.
The rainfall manipulation experiment was set up as part of the Drought Risk and You project (DRY). This interdisciplinary project aimed to improve the evidence-base to support better catchment-based, drought risk decision-making in the United Kingdom. A part of DRY’s transdisciplinary research process was the engagement of citizen scientists in monitoring the experiment, and bringing professional stakeholders to the experiment to discuss drought impacts on grassland. For further information on the DRY project, see Bryan et al. (2020); Liguori et al. (2021) and McEwen et al. (2021).
2 Methods
A field experiment was set up at two sites, in the catchment of the Bristol Frome (South Gloucestershire, United Kingdom), approximately 12 km apart. The two sites, University of the West of England (UWE) and Oldwood Pit (OWP) (Figure 1), were species-rich semi-natural grasslands, chosen to reflect the typical permanent pastures of the catchment.
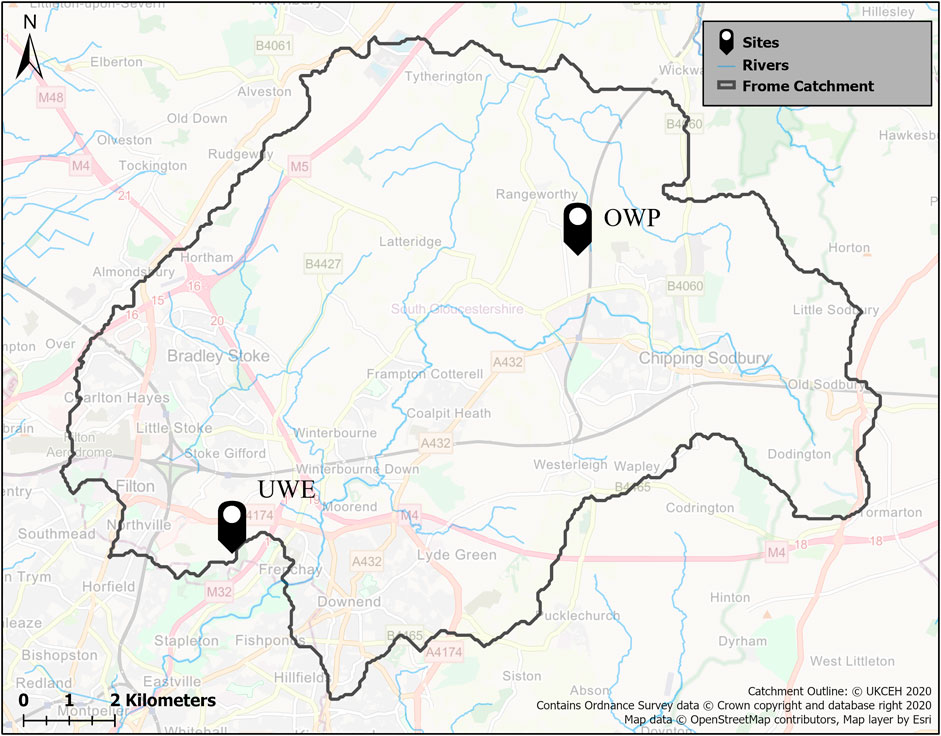
FIGURE 1. Location of DRY project field sites in the Bristol River Frome Catchment. Image courtesy of H. West (University of the West of England).
2.1 The River Frome Catchment
The Bristol Frome catchment covers approximately 149 km2, above the Frenchay flow gauging station, lying between 20 m and 194 m above ordnance datum (AOD). Mean annual rainfall (1961–2017 average, based on year 1 October to 30 September) is 816 mm [National River Flow Archive, 2021 (https://nrfa.ceh.ac.uk/)]. Average maximum and minimum air temperatures, for the nearest United Kingdom Met Office station at Filton, South Gloucestershire, (1981–2010 average) are 14.2°C and 7°C (Met Office, 2021b). Grassland is the largest land use in the catchment, covering around 48% of the catchment (Blake and Ragab, 2014); this high proportion of grassland is typical of the South West of England (Defra, 2021). The catchment has experienced numerous drought episodes over the last 60 years, most notably in 1976, 1990, 1995, 2005, and 2011 (Blake and Ragab, 2014). Evapotranspiration and soil moisture deficits within the catchment are predicted to increase in the future because of increased temperatures and reduced summer rainfall, and these changes will outweigh projected increases in winter rainfall (Afzal and Ragab, 2019).
2.2 Field Sites
2.2.1 University of the West of England
The UWE site is located between the University of West of England Frenchay campus and the M32 motorway (Grid ref ST629778). The site is about 135 m AOD and slopes gently (<1.5°) towards the northeast and the river Frome. The soil is a Worcester series gleyed brown earth (Chromic vertic luvisol) (Cranfield University, 2021) developed over Mercia mudstone (Findlay, 1976). The A horizon (0–20 cm) is clay loam above a reddish brown silty clay B horizon (20–50 cm), that has an angular blocky structure and shows some gleying. Below this is a BC horizon (50–100 cm) of silty clay, with a coarse prismatic structure, and at 100 cm mudstone is the C horizon (Findlay, 1976). Most land within the Worcester series is permanent grassland (Findlay et al., 1984). The field lies within United Kingdom soil scape 8 (Cranfield University, 2021) and is in an area of grade 1 and 2 soils. The field, at one time, was used for arable crops but has been grassland, grazed by sheep or cattle, with minimal artificial inputs for at least 30 years. In the 4 years preceding the start of this work, the field had been cut for hay in late September.
The vegetation at UWE (Figure 2A) is dominated by Arrhenatherum elatius (L.) (false oat grass), Holcus lanatus (L.) (Yorkshire fog) and Dactylis glomerata (L.) (cocksfoot) with Circium arvense (L.) (creeping thistle), and Heraculeum sphondylium (L.) (hogweed), Chrysanthemum leucanthemum (L.) (ox-eye daisy), and Rumex (L.) spp. (docks). There are also less common species such as Lathyrus nissolia (L.) (grass vetchling), and the orchids (Dactylorhiza fuchsii ((Druce) Vermeul.), Dactylorhiza praetermissa ((Druce) Vermeul.), and Ophrys apifera (Huds.)). Plant nomenclature follows Stace (2014).
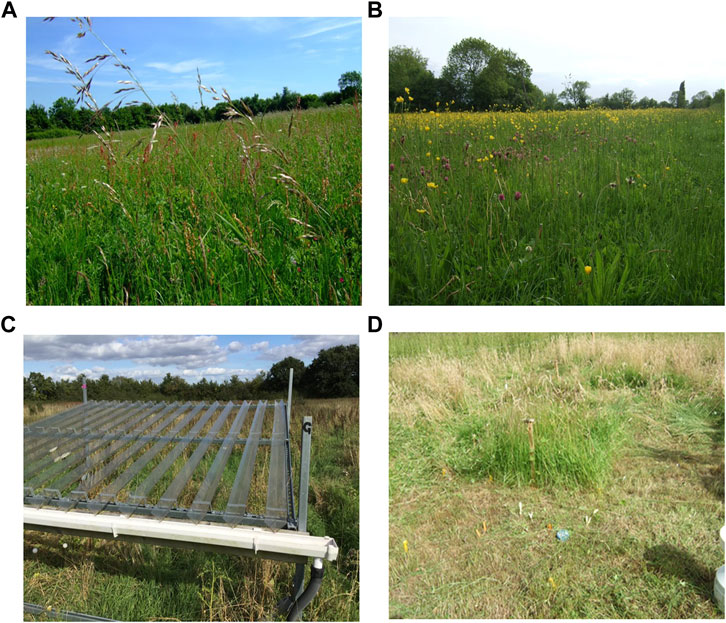
FIGURE 2. (A) Vegetation at UWE, (B) Vegetation at OWP, (C) One of the Reduced Rainfall plots at UWE, note metal frame, transparent “V” shaped gutters and pipe to carry intercepted water away from the plot, (D) A partly cut Control plot at OWP, note rain gauge in bottom right corner. The coloured markers indicate where samples have been taken. Blue circle is top of Adcon soil moisture sensor. Photographs © S. Ayling.
2.2.2 Oldwood Pit
The OWP site is a few miles outside Yate (Grid ref ST699853). The site is at 65 m AOD and level (slope <0.5°). The site lies within the North Bristol coalfield geological area. The soil is a Dale series surface water gley (Findlay, 1976), (Clayic eutric stagnosol (Cranfield University, 2021)). The A horizon (0–20 cm) is a clay loam; the B horizon (20–100 cm) is divided into two zones, both of clay with a coarse prismatic structure. At 20–50 cm, the soil is brown and mottled and 50–100 cm, the soil is grey with ochreous mottles. The BC horizon (100–120 cm) is grey clay with a coarse platy structure. All horizons show signs of gleying (Findlay, 1976). Dale series soils are mainly used for leys or permanent pasture (Findlay et al., 1984). The site lies within United Kingdom soil scape 17 (Cranfield University, 2021). The site is species-rich permanent pasture that is managed either by grazing during spring and summer with sheep, or for hay cut in early July, followed by late summer/autumn sheep grazing. The site has received no artificial fertilizer or herbicide since at least 1960, and probably not since before the Second World War.
The pasture (Figure 2B) contains Holcus lanatus (L.) (Yorkshire fog), Agrostis capillaris (common bent), Festuca rubra (L.) (red fescue) and Lolium perenne (L.) (rye), as well as numerous nitrogen fixing plants such as Trifolium repens (L.) and T. pratense (L.) (clover) and Lotus corniculatus (L.) (birdsfoot trefoil). The site has some uncommon plants, including Ophioglossum vulgatum (L.) (adder’s tongue fern) and Dactylorhiza fuchsii ((Druce) Vermeul.) (common spotted orchid).
2.3 Vegetation Management
Within the experimental plots at each site, we approximated the existing vegetation management regime by cutting the vegetation, with hand shears, to 1–2 cm above ground level and removing the cut vegetation (Figure 2D). In October 2015, when the experiment started, all plots were cut to ensure that samples collected in subsequent years only represented the current year of growth. At UWE, plots were cut each year in late September/early October to simulate autumn mowing. At OWP, plots were cut each year in late June/early July to simulate a hay cut, and again in late September/early October to simulate early autumn grazing. Plots were cut block by block (see Experimental design) to ensure any differences due to date of cutting were distributed across all treatments.
2.4 Experimental Design
At each site, twelve 3 m × 3 m plots, arranged in three replicate blocks were set out. Within each block, there were two reduced rainfall (RR) plots, consisting of metal frames (3 m × 3 m square, 1 m from the ground at the front and 1.5 m from the ground at the back). The frames supported V-shaped transparent gutters (Figure 2C), made from PEGT, that intercepted approximately 50% of the rainfall. The design was a variation of Yahdjian and Sala (2002). PEGT is Polyethylene Terephthalate (PET) with the addition of ethylene glycol. PEGT is transparent, flexible and can easily be moulded into V-shapes that are less likely to fracture than V-shapes made from acrylic. Intercepted rainfall flowed into PVC house roof gutters, and plastic pipes carried intercepted rainfall away from the plots. Two plots in each block were Control plots with ambient conditions, no metal frame or roof. The plots and frames were at least 3 m apart. The frames were put in place during April 2015 and the roofs installed on 19–20 October, 2015 at OWP and 21–22 October, 2015 at UWE. The experiment ran until October 2018.
In each (3 m × 3 m) plot, a 2 m × 2 m vegetation plot was marked out. A 0.5 m buffer strip surrounded this vegetation plot. The 2 m × 2 m plot was divided into four 1 m × 1 m subplots. One 1 m × 1 m subplot in each plot was randomly assigned for biomass sampling, and another was used to locate the rain gauge and for access to the other subplots.
The plots were not hydrologically isolated; lateral movement of water within the soil would have been possible. Experimental plots can be isolated, from the surrounding soil, by trenching but this can cause damage to the adjoining vegetation and influence hydrology within the trenched area (Beier et al., 2012). We needed to return the fields to the landowners in the same or better condition after the experiment had finished, this precluded use of trenching. The 3 m space between each plot represented a balance between having the plots far enough apart to minimize interactions in soil water between adjacent plots, need for electrical cables to connect environmental monitoring equipment to data loggers (see below), minimizing the likelihood of changes in soil type and conditions across the site, and the time needed to manage the experimental area by hand.
We collected data over three complete growing seasons and three hydrological years (1 October to September 30, 2015/2016, 2016/2017, and 2017/2018), to assess the impact of reduced rainfall on total grassland biomass production, and biomass of species representing different vegetation functional groups. At both sites, the growing season started from the time that the plots were cut in late September/early October, thus the growing season and hydrological year are the same.
2.5 Environmental Monitoring
At both sites, automatic weather stations recorded data about environmental conditions, including rainfall and soil moisture, every 30 min throughout the experiment. The weather stations were connected to Campbell data loggers (CR-1000, Campbell Scientific, Loughborough, United Kingdom) with mobile telephone data uplift. Supplementary Table S1 gives details of environmental monitoring instruments at the field sites.
There were six rain gauges at both UWE and OWP. There was one rain gauge in each of the three Control plots at UWE; one in each of two Control plots at OWP (one rain gauge at OWP failed); and one in each of three RR plots at both sites. Replicate gauges allowed us to calculate average rainfall at each site. The under roof rain gauges allowed an estimate of the rainfall reduction by the roofs.
Soil moisture tension and soil temperature were measured using Decagon MP6 ceramic sensors (Supplementary Table S1) installed horizontally at 10 cm depth near the centre of the 2 m × 2 m plots, with the sensor head towards the vegetation monitoring sub-plot. In pastures in the United Kingdom, and elsewhere, most roots (65–90%) occur in the top 10 cm of soil (Macklon et al., 1994; Dawson et al., 2000; Brown et al., 2010). Soil moisture content (%) was measured at 10 cm, 50 and 90 cm using Adcon SM1 Soil Moisture Sensors (Supplementary Table S1), installed close to the centre of the 2 m × 2 m vegetation plots. Although the majority of plant roots occur in the top 10 cm of soil, those of perennial plants often extend to, and take up water from, 50 cm depth or below (Dawson et al., 2000; Grieu et al., 2001). The soils at UWE and OWP have a C horizon at 1 m (Findlay et al., 1984) that would be difficult to penetrate without risking damage to the surrounding area and we did not anticipate root development and water uptake below this depth.
Photosynthetically active radiation (PAR) was measured using Licor PAR sensors (Supplementary Table S1). At each site, one sensor was mounted above and one sensor was mounted underneath the roof on one RR shelter.
2.6 Biomass Sampling
Above-ground dry matter production was assessed by biomass sampling. A randomly selected strip of vegetation (50 cm × 10 cm) was cut, as close to the ground surface as possible, within the subplot that had been assigned for biomass sampling. On each occasion, one sample was taken from each biomass sample subplot. The samples were collected block by block, to ensure any differences due to day of sampling were distributed across all treatments. Cut vegetation was immediately placed in a large plastic bag in a cool box. Samples were stored in a refrigerator at 4°C for not more than 2 days before processing. All samples were collected while kneeling on wooden boards outside the plots to minimize compaction of the soil.
The cut vegetation was sorted into all dead plant material, and live vegetation of different functional types: graminoid (grasses, rushes, and sedges), broadleaved plants, pteridophytes, bryophytes and woody material. After sorting, the different types of vegetation were dried at 60–80°C for at least 4 days and then again for 24 h before weighing.
Biomass samples were collected shortly before vegetation in the plots was cut. The sampling regime reflected the management regime in place at each site. At UWE, biomass samples were collected in autumn (late September/early October) of 2015, 2016, 2017, and 2018 and in summer (early July) 2018. At OWP, biomass samples were collected twice each year; in autumn (late September/early October) of 2015, 2016, 2017, and 2018 to simulate early autumn grazing and in summer (late June/early July) of 2016, 2017, and 2018 to simulate a summer hay cut. Supplementary Table S2 gives full details of site management and biomass sampling dates.
The weight of samples collected in September 2015 is included in the results because it gives an indication of the initial variability between plots, and the productivity of the fields. However, to be confident that we were making valid comparisons we have excluded data from samples collected in October 2015 (at the start of the experiment, before attaching the roofs) from the main statistical analysis. At UWE, mechanical cutting of the vegetation by the farmer in 2014 (before the experiment was set up in 2015) may not have cut to the same height as our hand cutting and collecting in 2015, 2016, 2017, and 2018. At OWP in 2015, while the experiment was being set up, sheep were kept in the field and no summer hay crop was taken; we then cut the plots in late September/early October.
To investigate the relationship between rainfall and total biomass, we compared the amount of biomass produced in Control or RR plots with rainfall over selected periods. These periods included: 1) Annual; 2) January to March, when rainfall is important for the recharge of groundwater reserves (Afzal and Ragab, 2019); 3) April to June, when grassland plants are growing quickly, flowers are developing, and plant growth may be partly dependent on incident rainfall as surface layers of soil contain less moisture; 4) December to April, when most incident rainfall moves into the soil (Afzal and Ragab, 2019); and 5) March to May, when grassland plants are susceptible to water stress (Grove and Monaghan, 2018). For OWP only, we compared July to September rainfall with the amount of biomass collected in the autumn.
2.7 Data Preparation and Statistical Analysis
Data on environmental variables and biomass from each field site, UWE and OWP, in the Frome catchment were analysed separately, because the vegetation management and sampling regime at the two sites was different.
2.7.1 Environmental data Processing and Analysis
Environmental data [rainfall, soil moisture (tension and content), air temperature, soil temperature and photosynthetically active radiation] were collated and summarized using Excel 2016 (Microsoft Corp., Redmond, United States). Data for days with incomplete records, resulting from equipment failure, were excluded. Comparisons between instruments in the plots, within each treatment, were used to identify any anomalous values; the data and field notes for that day were carefully examined, before making a decision whether or not to exclude those data. Comparisons between environmental variables for each treatment were made using t-tests performed in the statistical package SPSS26 (IBM, Armonk, United States).
2.7.1.1 Rainfall
At each site (OWP and UWE), the rain gauges recorded incident rainfall from July 2015 to October 2018. The average rainfall for each day during this period was calculated, for each site, and the rainfall recorded by each individual rain gauge was compared to the average to check the calibration and function of the rain gauges. The slope of the fitted line between daily rainfall recorded by each individual rain gauge and average daily rainfall was between 0.96 and 1.04 with a correlation (R2) of 0.99. This meant that if, for technical reasons, one rain gauge was not working we could extrapolate, with confidence, from the neighbouring gauge (within the same treatment) to fill in the missing data. Values of daily rainfall were calculated, for Control and RR plots at each site, by averaging the amount of rainfall recorded, each day, by each rain gauge.
2.7.1.2 Soil Moisture
Soil moisture tension gives an indication of the amount of work that a plant needs to do to acquire water. Water in a soil can be freely available, available, slightly available or unavailable to plants; these amounts depend on the water holding properties (texture and structure) of the soil. Freely available water can be defined as that when the soil moisture tension is less (more positive) than −59 kPa (Berglund, 2020). We calculated, for each plot, the number of days per month when average soil moisture tension was between 0 and −59 kPa (Ayling et al., 2020), and soil water was freely available for uptake by plants. We used these values to calculate an average across Control or RR plots at each site.
2.7.1.3 Soil Moisture Content (%)
Soil moisture content (%) recorded by each sensor was averaged for each day. These daily average values were used for within site quality control and to estimate monthly average soil moisture content for Control and RR plots at each site.
Data about soil moisture tension (kPa) and soil moisture content (%) were used to construct soil moisture characteristic curves for each site.
2.7.1.4 Air and Soil Temperature
For each day, average air temperature was calculated from the daily maximum and daily minimum air temperature (Kendon et al., 2019). Daily average soil temperature at 10 cm was calculated from the daily maximum and daily minimum soil temperature. These daily values were used to calculate monthly averages.
2.7.1.5 Photosynthetically Active Radiation
PAR changes throughout the day and is lower in winter when, in United Kingdom, daylight hours are shorter and the angle of the Sun’s rays lower. We calculated the average midday PAR value, between 11:00 and 13:30 for each day.
2.7.2 Vegetation Biomass Data
Vegetation biomass data (total biomass and biomass of different functional types) were analysed using a univariate general linear model in the statistical package SPSS26 (IBM, Armonk, United States): treatment and time of year were fixed factors; year was a random factor. Pearson correlation between rainfall and biomass was calculated using SPSS26.
3 Results
3.1 Environmental Data
3.1.1 Rainfall
At UWE, total rainfall for the year (1 October–30 September), in Control plots, in 2015/2016 was 979.1 mm, in 2016/2017 749.0 mm and in 2017/2018 782.4 mm. At OWP, equivalent totals were 990.5, 756.6, and 771.2 mm. There was no statistically significant difference between monthly total rainfall recorded in Control plots at OWP and UWE (p = 0.95, t-test) (Figure 3). Total rainfall recorded in Control plots between November 2015 and October 2018 was 2,508 mm at UWE and 2,506 mm at OWP. Over the 3 years of this study rainfall recorded in the RR plots at UWE was 52% of that in the Control plots and at OWP 48% (Figure 3).
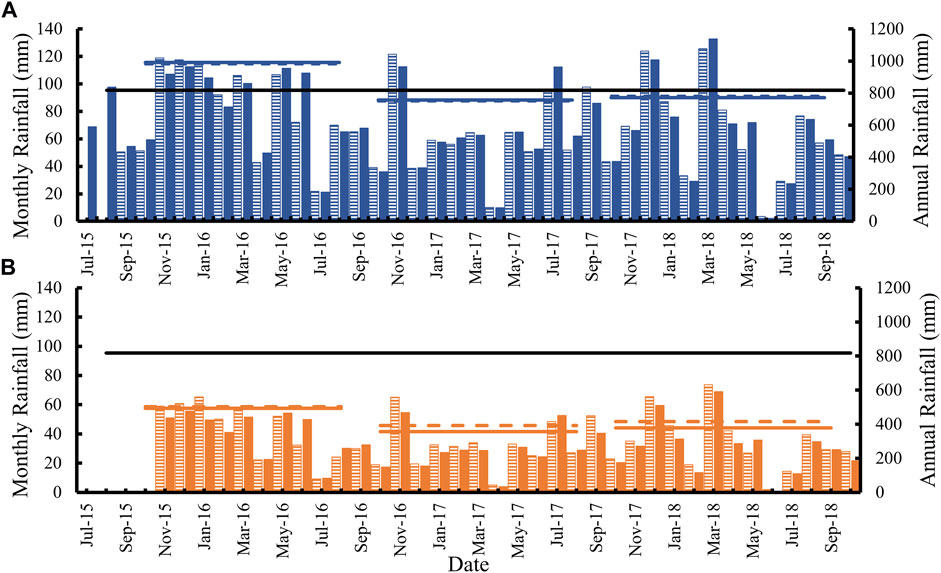
FIGURE 3. Monthly and annual total rainfall (mm) for (A) Control plots at University of the West of England (UWE) and Oldwood Pit (OWP) and (B) for reduced rainfall (RR) plots at UWE and OWP. Long-term total annual rainfall for the Frome catchment (1961–2017) is shown for comparison. In this study, the year was defined as 1 October to 30 September.
The 1961–2017 average rainfall for the Frome catchment, for year 1 October–30 September, is 816 mm (National River Flow Archive, 2021) (Figure 3). When compared to the long-term average, rainfall recorded in the experimental plots ranged from 44% in the RR treatment at OWP in 2016/2017 to 120% for the Control plots at UWE in 2015/2016 (Table 1).
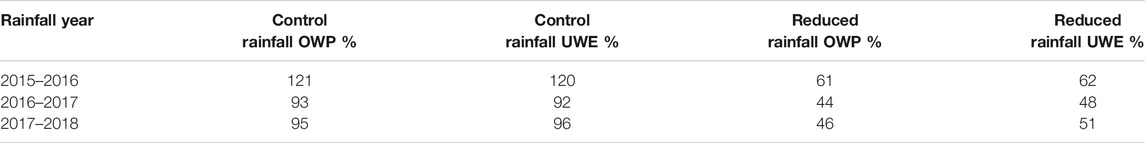
TABLE 1. Total rainfall in each year (1 October–30 September) for RR treatment and Control at UWE and OWP as percentage of catchment 1961–2017 average.
3.1.2 Soil Moisture
At both sites, the soil moisture tension in all plots was between 0 and –59 kPa (soil water deemed freely available to plants; Berglund, 2020) on every day of the month between December and March of each year (Figure 4). Soil moisture tension in the RR plots in each year (2015/2016, 2016/2017 and 2017/2018) was between 0 and –59 kPa for fewer days of each month during the peak growing season (April–September), than in Control plots (Figure 4).
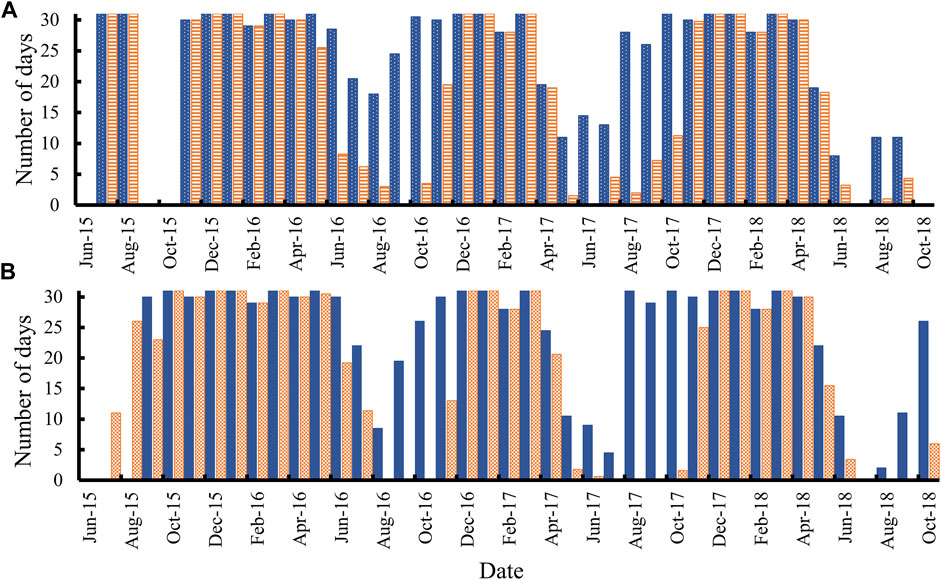
FIGURE 4. Number of days each month when soil moisture tension at 10 cm depth was between 0 and −59 KPa in Control or reduced rainfall (RR) plots at (A) UWE and (B) OWP.
Soil moisture content (%) at 10 cm showed large season variations; at UWE from 37 to ∼60%, and at OWP from below 30 to ∼60% (Figure 5). Changes in soil moisture content at 50 and 90 cm were smaller, for example at UWE moisture content at 50 cm ranged from 54–58%, and at 90 cm from 58–60%. Changes in soil moisture content (%) at 50 cm were greater at OWP than at UWE (Figure 5) particularly in the RR plots. The changes at 50 and 90 cm generally lagged, in time, behind the changes at 10 cm (Figure 5). At both sites, average soil moisture content at 10 cm was usually higher in Control plots than in RR plots. The soil in Control plots returned to field capacity (maximum water content after any excess water has drained away under the influence of gravity) more quickly than soil in the RR plots (Figure 5).
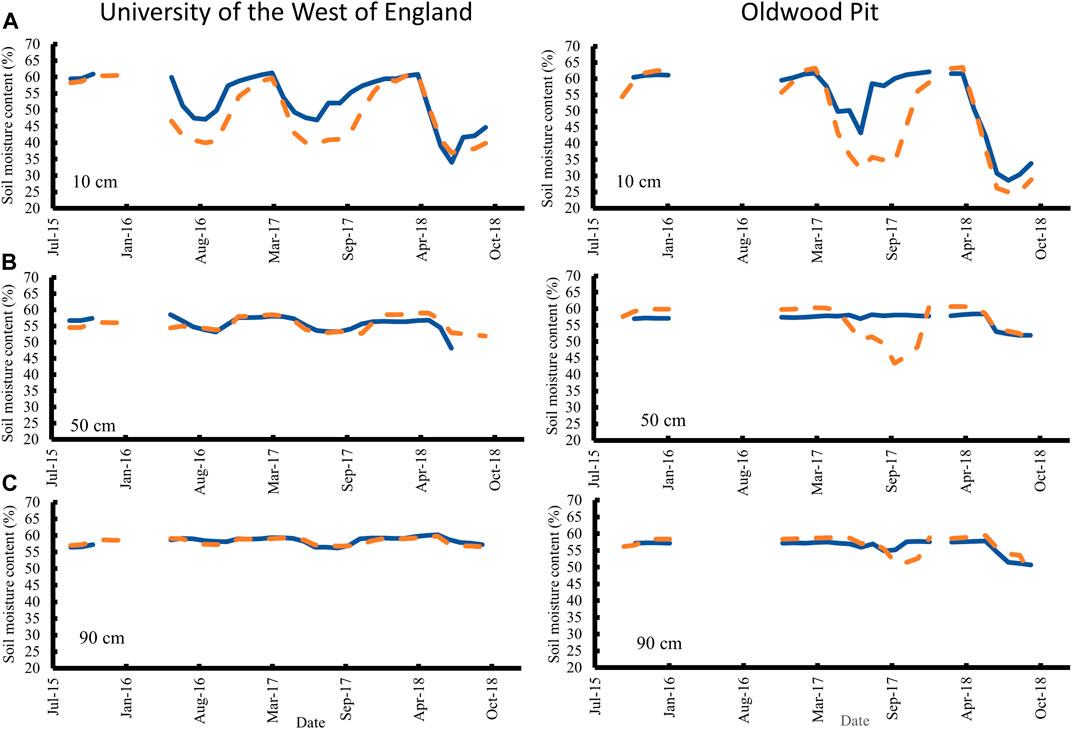
FIGURE 5. Monthly average soil moisture content (%) at (A) 10 cm, (B) 50 cm, and (C) 90 cm for Control and RR plots at UWE and OWP.

Seasonal patterns of changes in soil moisture tension and soil moisture content were similar at both sites. Soil moisture content (%) decreased and soil moisture tension (kPa) increased during the peak growing season (April to September). During the autumn and winter months (October–March), when incident rainfall exceeded the amount of water taken up by the grassland plants, soil moisture content increased and soil moisture tension decreased (Figures 4, 5).
Soil moisture characteristic curves (soil moisture tension vs soil moisture content) (Supplementary Figure S1) indicate that at -59 kPa the UWE soil contains ∼44% moisture, and the OWP soil ∼50% moisture. At −491 kPa, the UWE soil contained ∼36% moisture and the OWP soil ∼34% moisture (Supplementary Figure S1). Thus, the amount of soil water available to plants between −59 and −491 kPa is ∼8% at UWE and ∼16% at OWP.
3.1.3 Air Temperature
Over the course of the experiment air temperatures at UWE ranged from −6.4°C to 32°C, and at OWP from −7.9°C to 31.7°C. Average air temperatures were 11.5°C at UWE and 10.9°C at OWP (Supplementary Table S3). Average maximum air temperature was 15.5°C at UWE and 15.1°C at OWP. Average minimum air temperature was 7.5°C at UWE and 6.0°C at OWP (Supplementary Table S3).
Air temperatures were similar inside (measured below the roof) and outside the rainfall shelters and differences are within the accuracy of the readings [±0.1°C (Gill Instruments, Lymington, United Kingdom)] (Supplementary Table S3). Figure 6A shows monthly average temperatures inside and outside one rainfall shelter at OWP; the two plots are almost coincident. At both sites, the average maximum temperature inside the shelters was slightly higher, and the average minimum temperature was slightly lower, than outside (Supplementary Table S3).
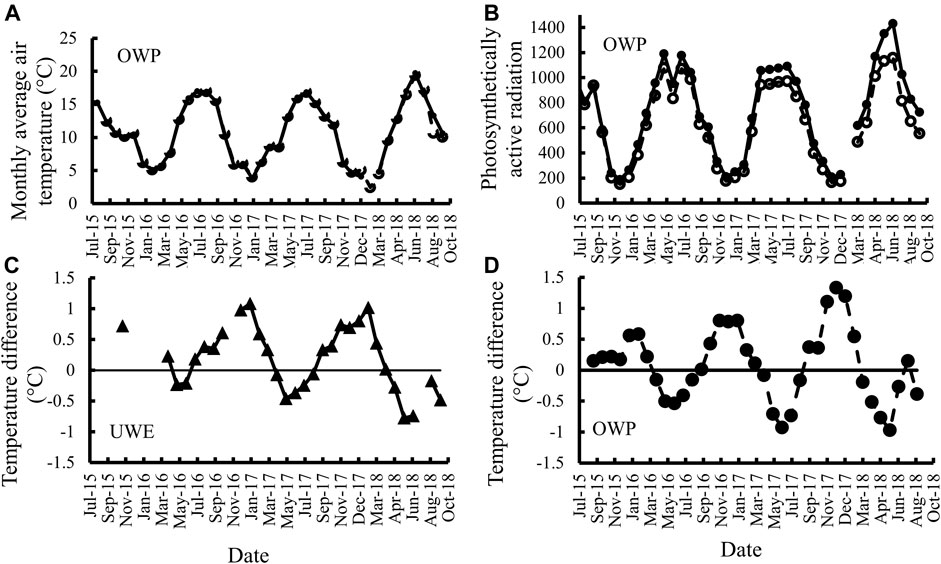
FIGURE 6. (A) Monthly average air temperature (°C), recorded by weather station, at Oldwood Pit inside and outside the rainfall shelters; (B) Monthly average of midday photosynthetically active radiation (PAR) in µmol of photons m−2 s−1 at Oldwood Pit (OWP), measured and under the roof and outside the rainfall shelters; (C,D) Difference in monthly average soil temp (°C), from Degagon MPS6 sensor, at 10 cm between Reduced Rainfall and Control plots at (C) UWE and (D) OWP. Average temperatures were calculated from daily maximum and daily minimum temperature.

3.1.4 Soil Temperature
At both sites, soil temperature at 10 cm was 0.6–1.6°C higher in reduced rainfall (RR) plots than in Control plots, during the cooler months (December to March), and 0.3–0.7°C lower during the warmer months (June–September) (Figure 6C,D). This agrees with field observations that frost always cleared more quickly from the RR plots.
3.1.5 Photosynthetically Active Radiation
The sensors recorded incident PAR, from July 2015 until the roofs were put on in October 2015 and as can be seen in the example set of data from OWP (Figure 6B) recorded similar values. After roof installation the PAR was lower (77–95%, average 85%) under the roofs than outside (Figure 6B). PAR was reduced by the roof material (PEGT), and short-term condensation and frost on the roof elements.
3.2 Biomass
3.2.1 Total Amount of Dry Matter
At both UWE and OWP there was considerable plot-to-plot variation in the mass of above ground dry matter (biomass) produced. Total biomass, across both sites, ranged from 392–1,134 g m−2 for Control plots, and 328–1,144 g m−2 for RR plots. These values are equivalent to 3.9–7.8 t ha−1 at UWE and 8.7–11.3 t ha−1 at OWP. The coefficient of variation, for weight of biomass samples collected in 2016, 2017, and 2018, averaged across both sites was 29%.
3.2.2 Biomass at University of the West of England
At UWE, overall there was no statistically significant difference between the amount of biomass produced in Control or RR plots (p = 0.12) (Figure 7). Year had a large effect on amount of biomass recorded (p < 0.0001), and explained 92% of the variation. There was no statistically significant interaction between treatment and year (p = 0.22).
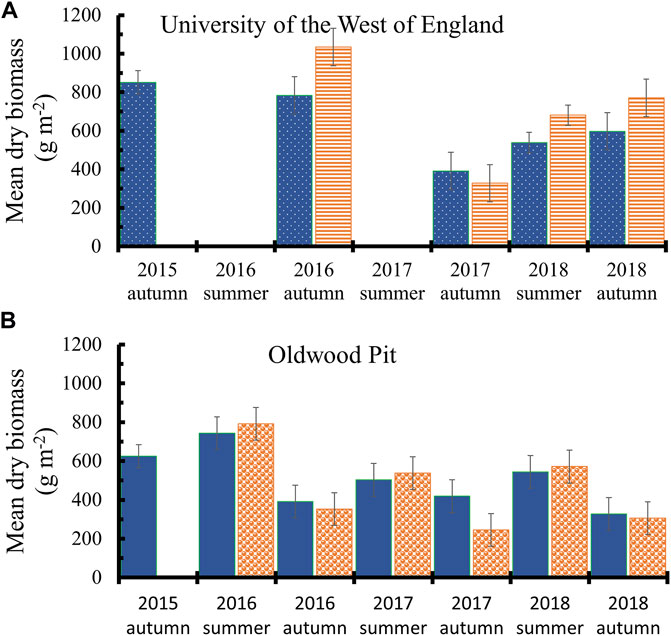
FIGURE 7. Dry mass of above ground plant material (biomass) (g m−2) harvested at (A) UWE and (B) OWP. Values are mean ± SE, n = 6, 12 in 2015. Note: at UWE plots were cut in autumn and at OWP plots were cut in early July and early October. There were no shelters in 2015 at the time of biomass sampling so all were essentially Control plots.

2017 was the only year in which less biomass was produced in the RR plots (327.6 g m−2) than in the Control plots (391.6 g m−2) (Figure 7 and Supplementary Table S4). In 2016 and 2018, the RR plots produced slightly more biomass than the Control plots, but these differences were not statistically significant (Figure 7 and Supplementary Table S4).
In 2017, less biomass was produced, in both Control and RR plots, compared with 2016 (p < 0.0001) or 2018 (p = 0.001). In 2018, less biomass was produced than in 2016 (p = 0.022) (Figure 7 and Supplementary Table S4).
In late June 2018, slightly more biomass was collected from the RR plots than from the Control plots (Figure 7), but the difference was not statistically significant (p = 0.086).
3.2.3 Biomass at Oldwood Pits
3.2.3.1 Annual Biomass Production at Oldwood Pits
At OWP, overall the reduced rainfall (RR) treatment had no statistically significant effect on the total annual biomass (summer and autumn samples combined) produced by the plots (p = 0.478) (Supplementary Table S5). There were small differences between years in the annual total amount of biomass produced (p = 0.065), and year accounted for 94% of the variation in annual total biomass. More total biomass was produced in 2016 in both Control and RR plots, than in 2017 or 2018 (2016 vs. 2017 p = 0.021, 2016 vs. 2018 p = 0.032) (Figure 7 and Supplementary Table S5). There was no statistically significant interaction between year and treatment (p = 0.78).
At OWP, there was a strong seasonal effect (p = 0.000); more biomass was collected each year in July (615 ± 48.6 g m−2, mean ± SE) than in October (340.2 ± 14.6 g m−2), (Figure 7). Therefore we have separately analysed the data for summer and autumn biomass.
3.2.3.2 Summer Harvested Total Biomass at OWP
Overall, at OWP in summer, RR plots produced more biomass (633.4 g m−2) than Control plots (596.6 g m−2), and this was statistically significant (p = 0.029) (Figure 7 and Supplementary Table S5). Year had a stronger impact on biomass production than treatment (p = 0.002). In summer 2016, more biomass was collected from both RR and Control plots than in 2017 (p = 0.046) or 2018 (p = 0.088) (Figure 7 and Supplementary Table S5).
3.2.3.3 Autumn Harvested Total Biomass at Oldwood Pits
At OWP. the weight of biomass harvested in the autumn (following late summer cutting to simulate hay removal) was less in RR plots (300.6 g m−2) that in Control plots (379.6 g m−2) (p = 0.000) (Figure 7). More biomass was produced in autumn 2016 than in 2017 or 2018 (Figure 7). The amount of biomass harvested in the autumn showed a strong interaction between treatment and year (p = 0.028).
3.3 Effect of Reduced Rainfall on Biomass of Different Functional Species Types at University of the West of England and Oldwood Pits
Results are presented for all dead material, live broadleaved plants, live bryophytes and live graminoid plants. Plants with woody stems and pteridophytes were in too few plots for statistical analysis.
3.3.1 University of the West of England
At UWE, overall there was no statistically significant effect of reduced rainfall (RR) on the proportion of biomass from any of the functional groups: all dead material (p = 0.38), and broadleaved plants (p = 0.69), bryophytes (p = 0.33), or graminoid plants (p = 0.08) (Supplementary Figure S2). Year had a statistically significant effect on the proportion of bryophyte (p = 0.026). There was no interaction between treatment and year (p values ranged from 0.12 to 0.78).
In samples from RR plots, taking all years together, live graminoid plants made up a slightly smaller proportion of the total biomass (14.3%; 103.28 ± 30.16 g m−2) than in samples from Control plots (21.5%; 123.73 ± 25.82 g m−2) (p = 0.018).
Year had a highly significant effect on the proportion of biomass from broadleaved (p = 0.007), bryophyte (p=<0.001) and graminoid plants (p = 0.021) (Supplementary Table S6). Broadleaved plants were a smaller proportion of total biomass in 2017 (4.6%) and 2018 (2.3%) compared to 2016 (12.4%), while graminoid plants made up a higher proportion of total biomass in 2018 (23.9%) than in 2016 (15.9%) or 2017 (14.2%).
3.3.2 Oldwood Pits
At OWP, RR had no statistically significant effect on the proportion of total annual biomass from any of the functional groups: dead material (p = 0.41), broadleaved plants (p = 0.17), bryophytes (p = 0.11) or graminoid plants (p = 0.43). However, there was a significant difference between years in the proportion of graminoid plants (p = 0.01) and dead material (p = 0.029) (Supplementary Figure S2). There was no interaction between treatment and year for biomass of any of the different function groups (p = 0.7–0.9).
At OWP, across all years, in samples from RR plots bryophytes made up a greater proportion of the total annual biomass (1.7%) than in samples from Control plots (0.5%) (Table 2). In samples collected from RR plots at OWP in the autumn, bryophytes and dead plant material made up a greater proportion and live graminoid plants a smaller proportion of the total biomass than in samples from Control plots (Table 2).
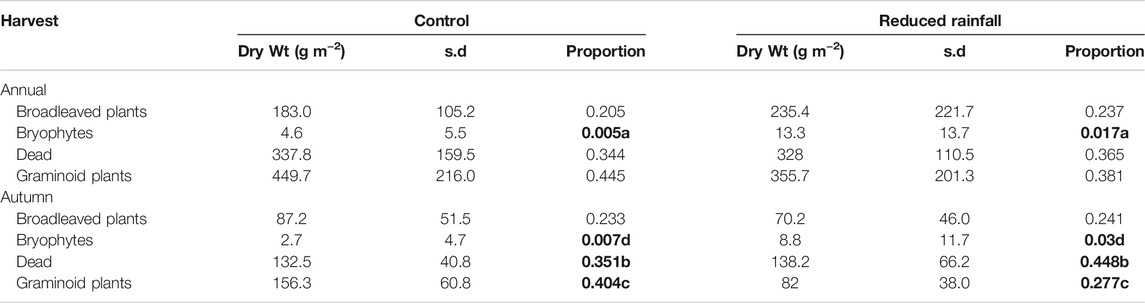
TABLE 2. OWP the effect of Reduced Rainfall on the proportion of total dry biomass at OWP from each of dead material and live broadleaved plants, bryophtyes, and graminoid plants. Values in bold with the same letter are statistically significantly different from each other, based on pair-wise comparisons. At p = 0.05:a, b, d; at p = 0.001:c.
At OWP, year had a strong influence on the proportion of total biomass from each functional group (Supplementary Table S7, Supplementary Figure S2). Live graminoid plants were a smaller proportion of the annual total biomass (summer and autumn together) in 2017 (41.3%) and 2018 (30.5%) than in 2016 (52%) (Supplementary Table S7). Dead material was a larger proportion of total annual biomass in 2018 (42%) than in 2016 (28%) (Supplementary Table S7, Supplementary Figure S2). In samples collected in the summer, dead plant material was a larger proportion of the total biomass in 2017 (39.1%) and 2018 (39.6%) than in 2016 (21.7%) (Supplementary Table S7). Live graminoid plants were a smaller proportion, of the total biomass, of samples collected in summer 2017 (39.5%) and 2018 (32.2%) than in 2016 (61.7%) (Supplementary Table S7). In the autumn samples, live graminoid plants were a greater proportion of the total biomass in 2017 (41.5%) than in 2016 (33.1%) or 2018 (27.5%) (Supplementary Table S7).
3.4 Biomass and Rainfall
At both sites, the largest amount of biomass was produced in 2016 (Figure 7 and Supplementary Tables S4, S5). Annual rainfall in 2015/16, at both sites, was 120% (990 mm) of the 1961–2017 catchment average in Control plots and 60% (484 mm) in RR (Table 1). In 2015/2016, RR plots at both sites received less rainfall than Control plots did in either 2016/2017 or 2017/2018 (Figure 3).
There were differences between the sites, and between years in the impact of variations in rainfall amount a on biomass production. In 2017 and 2018 annual rainfall at both sites, in Control plots, was about 92% of the long-term average and in RR plots 46%. At UWE in 2017, when compared to 2016, biomass production from Control plots was 50%, and from RR plots 32%. At OWP in 2017, total biomass was 81% of the 2016 value in Control plots and 68% in RR plots. In contrast, in 2018 at both sites, biomass production, from Control and RR plots, was 75–77% of that recorded in 2016.
At both sites, for Control and RR plots, the total annual amount of biomass increased with increasing total annual rainfall (Figure 8). At UWE, total biomass from Control and from RR plots was strongly correlated with rainfall over each of the five selected periods (Table 3). In contrast, at OWP, total biomass from Control plots was not significantly correlated with rainfall, whilst that from RR plots was weakly correlated with annual, January to March and April to June rainfall, but not with December to April or March to May rainfall (Table 3). At OWP, autumn harvested biomass from Control plots was not significantly correlated with summer rainfall (Pearson correlation 0.33, p = 0.18) and that from RR plots was weakly and negatively correlated with rainfall (Pearson correlation −0.54, p = 0.02).
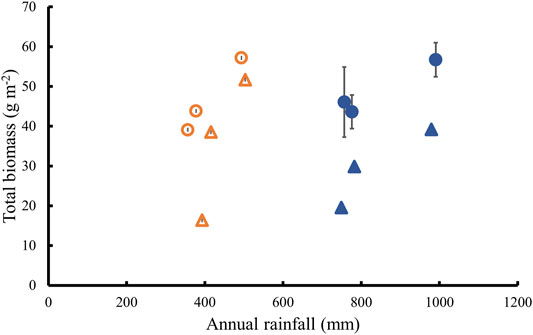
FIGURE 8. Relationship between total annual biomass production and annual precipitation at UWE and OWP for Control and RR plots. Values shown are mean ± SE; in most cases the error bar is smaller than the symbol.
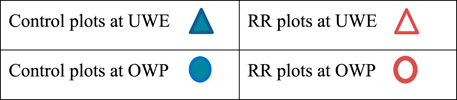
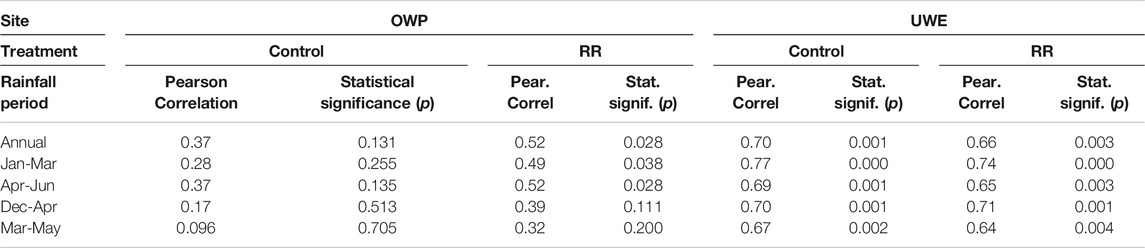
TABLE 3. Correlations between total annual biomass (g m−2) and rainfall (mm) at UWE and OWP for Control and Reduced Rainfall (RR) plots. n = 18.
Water productivity (calculated as the amount of biomass for each mm of rain) was greater in the RR plots, at both sites, than in the Control plots (Table 4), and greater at OWP than at UWE. Water productivity, with one exception, was similar across all 3 years of the experiment. Water productivity at UWE in 2017 stands out for RR plots, because it was low (Table 4). If the rainfall reduction treatment had increased plant water use efficiency, we might have expected the water productivity of the RR plots to increase.
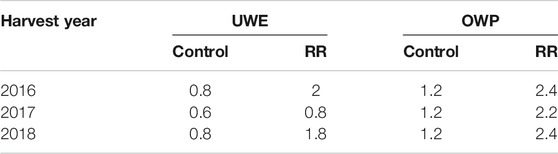
TABLE 4. Annual water productivity at UWE and OWP (g m−2 mm).
4 Discussion
4.1 Environmental Data
4.1.1 Rainfall
Year-to-year and season-to-season rainfall variation is a normal part of the United Kingdom climate (Kendon et al., 2019) and the variability in rainfall patterns is predicted to become greater over the next twenty to 30 years (Met Office, 2018a). Compared with the annual rainfall for all of England (Kendon et al., 2017, 2018; 2019), the Frome catchment was wetter in 2016, drier in 2017 and similar in 2018 and this is likely a reflection of the catchment location in the western part of the United Kingdom. Total rainfall recorded from Control plots at both sites was similar although with some month-to-month differences between the two sites (Figure 3). Rainfall in November and December was greater at UWE than at OWP, which is probably due to a combination of direction of prevailing winds and local orographic effects.
The reduced rainfall (RR) treatment was successful in reducing rainfall within the plots by about 50% (Figure 3). Monthly rainfall in the RR plots was within the lower quartile of values for each month recorded in the last one hundred years for the Frome catchment (National River Flow Archive, 2021), but never fell below the one hundred year minimum monthly rainfall.
4.1.2 Soil Moisture
At both sites, soil moisture at 10 cm was more strongly affected by the RR treatment compared to that at 50 cm or 90 cm (Figure 5). Other rainfall manipulation studies (Vogel et al., 2013; Picon—Cochard et al., 2014) have also found that rainfall reduction affects soil moisture less in the deeper soil than in the surface layers. In pastures in the United Kingdom and elsewhere, most roots (65–90%) occur in the top 10–15 cm of soil (Macklon et al., 1994; Dawson et al., 2000; Brown et al., 2010), and thus this part of the soil is likely to be depleted of water more quickly during dry periods. In RR and Control plots, at both sites, soil moisture returned to field capacity during the autumn and winter (October–March) period. The return of the soil water content to field capacity in the winter was considered to be one of the most important factors enabling perennial rye grass crops to maintain productivity under dry summer conditions (Grove and Monaghan, 2018).
4.1.3 Air and Soil Temperature and Photosynthetically Active Radiation
The roofs had little effect on average air temperatures (Supplementary Table S3). We positioned the temperature sensors to record representative conditions under the roof, but there may have been some shading from the frame and, on cool days or at night, the metal of the frame may have acted as a heat sink (Supplementary Table S3). Small increases in average soil temperature under rainfall shelters in winter, and decreases in summer, such as we recorded, have been reported by other workers. In a grassland drought experiment, using frames with roofs to intercept rainfall, soil temperatures at 7 cm were found to be slightly decreased on warm days but increased on cool days (Vogel et al., 2013). Photosynthetically active radiation (PAR) was lower during the middle of the day under the shelter roofs, as has been found in other studies using rainfall shelters (Vogel et al., 2013). The above ground plant biomass production was similar in RR and Control plots, and sometimes slightly higher in the RR plots (Figure 7), suggesting that the reduction in PAR was not sufficient to affect productivity.
4.2 Total Biomass
4.2.1 Biomass
Total biomass production in our experiment was similar to other rainfall manipulation experiments that recorded grassland productivity: 200–300 g m−2 (Cole et al., 2019) for an unproductive upland calcareous grassland in Yorkshire, United Kingdom; and 800 g m−2 from a lowland grassland pasture in Switzerland (Finger et al., 2013). The average yield of grass in United Kingdom is 7.3 t ha−1 Dry Matter (Berry et al., 2016). 8.7 t ha−1 was taken as the 2010 benchmark value in a modelling study of likely changes in grassland productivity in United Kingdom, associated with climate change (Qi et al., 2018). Thus, the dry mass of above ground plant material in our experiment is comparable with that collected from other rainfall manipulation experiments and with that harvested on United Kingdom farms. Overall, the amount of biomass collected from UWE was slightly less than that collected from OWP (Supplementary Tables S4, S5). This difference is due to inherent differences in productivity between the two sites, reflecting soil conditions, plant species present and pasture management.
The high plot-to-plot variability in biomass production reflects the species distribution and diversity of the vegetation, and the relatively small areas sampled. The vegetation at both sites was typical for United Kingdom semi-natural grasslands (Sternberg et al., 1999), with 78 species of flowering plants at UWE and 63 at OWP. In grasslands, high plant diversity can increase the resistance of plant productivity to climate extremes, particularly drought (Tilman and Downing, 1994; Sanderson et al., 2007; Klaus et al., 2016); both of our experimental sites were species rich. High coefficients of variation for biomass productivity have been found in other grassland studies, in which small samples were used to estimate productivity, such as 19.2% for an unproductive grassland in Yorkshire, United Kingdom (Grime et al., 2008), and 22% for a lowland limestone grassland in Oxfordshire, United Kingdom (Grime et al., 2000).
4.2.2 Treatment effects on Annual Biomass
At both UWE and OWP, the reduced rainfall (RR) treatment had only a small effect on total annual biomass production when compared to the strong year-to-year variation (Supplementary Tables S4, S5, Figure 7). Other studies have found similar results, for example, in a mesotrophic grassland in Berkshire, United Kingdom, 30% reduction in rainfall (between March and August) had no significant effect on biomass production until the third year of the experiment (Fry et al., 2014; Lee et al., 2014). In Canadian bunchgrass grasslands, excluding rain during the main growing season was associated with a slight increase in biomass production (Carlyle et al., 2014). In a rainfall manipulation experiment on calcareous grassland in Yorkshire, United Kingdom, Cole et al. (2019) found that a 100-years summer drought had no significant effect on biomass production.
4.2.3 Treatment effects on Biomass Production in Spring and Early Summer
RR plots, at OWP, produced slightly more biomass than Control plots. A review of anticipated changes to grassland associated with climate change (Hopkins and del Prado, 2007) suggested that on sites in North and Northwest Europe, where water is not a limiting resource, increased winter temperatures would be likely to increase herbage growth. Computer modelling of grass yields in Ireland indicated that early season growth of grass, especially in the West of the country, was likely to increase with climate change (Holden and Brereton, 2002). Soil temperatures in the RR plots were slightly higher during the winter (Figure 6), but as rainfall, even in the RR plots, was sufficient to return the soil to field capacity over the winter period, there was no water limitation that might have reduced early season growth.
4.2.4 Treatment effects on Late Summer (Autumn Harvested) Biomass Production at Oldwood Pits
At OWP, after the late summer cutting that simulated hay removal, there was lower biomass from the reduced rainfall (RR) plots in all years (Figure 7) suggesting that reduced rainfall was inhibiting regrowth of the sward. In a phenology study at OWP, during 2015/2016, in late June, Lolium perenne (L.) plants in RR plots were taller by about 10 cm, than L. perenne plants in Control plots, suggesting greater growth in the early growing season. However, after the plots were cut in early July, L. perenne plants in RR plots grew more slowly, and in early September were 10 cm shorter than plants in Control plots (Cairney, 2016).
4.2.5 Rainfall and Biomass Production
At both UWE and OWP, for Control and RR plots, the amount of biomass tended to increase with increasing rainfall (Figure 8). We observed no further increase in biomass once rainfall exceeded around 550 mm per year. Grass crops in United Kingdom are reported to use around 600–900 mm water per year (Grove and Monaghan, 2018). Intensively managed pastures, such as rye grass leys that have only one or two high yielding hybrid varieties of rye grass, produce more than 20 t ha−1 (Jones and Humphreys, 1999). These rye grass pastures are fertilized, continually grazed or harvested several times each year, and need up to 900 mm water per year to sustain production of grass (Grove and Monaghan, 2018). Our results (Figure 8) suggest that the water requirement of the non-intensively managed permanent pastures that we studied, in the Bristol Frome catchment, may be 550–600 mm water per year.
In a meta-analysis of long-term ecological studies in the United States of America, above ground net primary production was found to be strongly correlated with annual precipitation (Knapp and Smith, 2001). Although in our experiment the total biomass in Control plots increased with increasing rainfall, it was never higher than in the RR plots, even in the wettest year. Other authors (Wilcox et al., 2017; Matos et al., 2020) considered that the relationship between rainfall and productivity is complex, with productivity saturating at high rainfall, and this appears to be shown by our results.
In grasslands, there is a positive feedback between grasses and soil water content (Matos et al., 2020). A continuous grass layer reduces evaporation and run-off of water, therefore soil water content increases; this leads to better vegetation growth. Above the threshold, when water supply is not a limiting factor for plant growth, further rainfall will move through the soil, replenish ground water reserves, and into drainage channels and rivers. Thus, grasslands play an important role in the water cycle. In the United Kingdom, if the area of permanent pasture as a proportion of agricultural land falls by more than 5%, farmers may be required to reinstate permanent grass (Rural Payments Agency, 2020). Computer modelling of the likely effects of future changes in land use combined with climate change have indicated that reducing the area under grass in the Frome catchment could reduce ground water recharge (Afzal and Ragab, 2019).
The annual pattern of monthly rainfall was very different for each of the three study years (Figure 3). Rainfall during the cooler months when evaporation and evapotranspiration is low is important for recharging groundwater reserves (Afzal and Ragab, 2019). In United Kingdom pastures, 65–90% of grassroots are in the surface 10–15 cm of the soil (Macklon et al., 1994), and growth is influenced by incident rainfall as well as the amount of stored soil moisture. At UWE total biomass from Control and from RR plots was strongly correlated with rainfall over each of the periods selected (Table 3), suggesting that both soil water reserves and incident rainfall influence biomass production at UWE. In contrast, at OWP even in RR plots, biomass production was not strongly correlated with rainfall, suggesting that the vegetation at OWP makes more use of stored soil water than incident rainfall (Table 3).
If the rainfall reduction shelters had altered the way that the plants utilized water, we might have expected the water productivity to increase over time but this did not happen. For RR plots at UWE, 2017 stands out because the water productivity was so low (Table 4). At UWE in 2017, biomass production in Control and RR plots was less than in 2018 (Figure 7) but the total annual rainfall was similar in both years (Figure 3). Thus the amount of annual rainfall cannot explain the differences in productivity among years. At OWP, we asked if biomass production between July and September, after cutting the vegetation in late June/early July, was correlated with rainfall in July, August and September. However, at OWP, the smallest amount of regrowth was recorded from the RR plots in the 2016/2017 July to September season when the rainfall total was the highest (Figures 3, 7). This suggests that the amount of incident rainfall was not the only factor limiting productivity.
Although, studies of grasslands in United States found productivity to be strongly correlated with annual precipitation (Knapp and Smith, 2001), other meta-analyses investigating the effects of drought or reduced rainfall on grassland productivity that included studies from a wider geographical area (Beier at al., 2012; Ward et al., 2016) have found considerable heterogeneity in the responses of grasslands to reduced rainfall. Many studies in these reviews are from semi-arid environments (Knapp and Smith, 2001; Beier at al., 2012; Wilcox et al., 2017), with relatively few studies in regions where annual rainfall is unlikely to limit productivity (Matos et al., 2020). Other studies of United Kingdom grasslands have shown that reducing summer rainfall has little effect on biomass production over periods of a few years (Grime et al., 2000; Fry et al., 2014). On an unproductive grassland in Northern England, even after 13 years of reduced summer rainfall, effects on the vegetation were smaller than those associated with year-to-year fluctuations in climate (Grime et al., 2008). If temperatures continue to rise as predicted (Met Office 2018a), the associated rise in evapotranspiration is likely to increase the amount of water used by plants. If plant demand for water exceeds the amount available (water stored within the soil combined with incident rainfall during the growing season) then there are likely to be some changes in plant species composition of grasslands and eventually in productivity. However, it is difficult to know over what time-scale this might happen. Modelling of the likely impacts of climate change up to 2050s suggested that the productivity of permanent pastures in Great Britain will rise (Qi et al., 2018). In a longer (100 years) modelling study of climate change impacts, including reduced summer rainfall, on grass yield in Ireland, Holden and Brereton (2002) foresaw no catastrophic impacts, but noted that yield might increase in the north and decline in the south and east of Ireland. Many managed grassland systems have high adaptive potential; in North and North West Europe, future climate change may lead to increased herbage growth (ADAS, 1997; Hopkins and del Prado, 2007).
4.3 Treatment effects on Contribution of Different Functional Groups to Total Biomass
The reduced rainfall treatment had few significant effects on the proportions of biomass from different functional groups at either site (Supplementary Figure S2, Table 2). At UWE, live graminoid species were a smaller proportion of biomass, in samples from RR plots compared to Control plots (Supplementary Figure S2). This difference may reflect earlier senescence of grasses in the RR treatment during the summer. Summer drought reduced the proportion of perennial grasses in a recently established pasture in Oxford, (Grime et al., 2000). At OWP, based on annual biomass, there was no change in the proportion of live graminoid species or broadleaved plants (Supplementary Figure S2). A similar result was found in a well-established grassland in Yorkshire where reduced rainfall had no effect on the proportion of perennial grasses or perennial forbes (Grime et al., 2000; Grime et al., 2008). At OWP, we recorded a small increase in the proportion of bryophytes in RR plots (Table 2), but this effect was similar in size to the variation among years (Supplementary Table S7).
Year-to-year variation in the proportion of biomass contributed by different functional groups was equal to, or greater, than the effects associated with reduced rainfall, as has been noted in other grassland studies (Grime et al., 2000; Grime et al., 2008).
4.4 Soil Moisture and Biomass
In 2015/2016 at both sites, and in Control and RR plots, soil water was freely available to plants until June 2016, but in 2016/2017, soil water was only freely available until April 2017, and in 2017/2018 only until May 2018 (Figure 4). In both 2016/2017 and 2017/2018, the plants would likely have experienced some level of water stress during the spring growing season. At UWE, a comparison of the monthly soil moisture content (Figure 5) and the soil moisture characteristic curve for the Worcester series soil (Supplementary Figure S1) suggested that in 2016/2017 between April and September, only a small proportion of soil water was available to the plants and this limited growth. The soil moisture characteristic curve is steep so that plants would experience sudden water stress. The soil moisture characteristic curve of Dale series soil at OWP, indicated that the Dale series soil has more plant available water (between −59 kPa and −491 kPa) than the Worcester series soil. The Dale soil moisture characteristic curve has a less steep slope than the Worcester series soil, so that plant water stress would have developed more slowly.
Soil moisture stress reduces plant growth through effects on turgor and on photosynthetic activity (Van Peer et al., 2004). A review of the effects of drought on the growth of forage grasses in Poland (Staniak and Kocon, 2015) found that spring droughts often reduced the early regrowth of meadow swards, while summer drought reduced the second regrowth of meadows. We recorded a similar result at OWP, with the smallest amount of regrowth in 2017, when soil moisture tension increased (and soil water availability decreased), earlier in the year compared to 2016 or 2018.
If rainfall cannot move through the soil profile, water may accumulate causing the soil to become water logged. This can lead to decreases in soil pH, oxygen depletion, and changes in nutrient availability that negatively affect plant growth and can lead to decreases in plant species diversity (Michalcová et al., 2011). The soil at OWP is gleyed (Findlay, 1976) indicating that the soil is prone to waterlogging. We recorded greater decreases in soil moisture % at 50 cm in the RR plots at OWP than in the Control plots (Figure 5), and it maybe that the small increase in biomass production that we observed in the RR plots is a response to a reduction in the extent of waterlogging.
4.5 Vegetation and Management
Differences in vegetation and management between the two field sites may partly explain why the early season dry conditions of 2016/2017 affected biomass production at OWP less than at UWE. The pasture at OWP is at least 80 years old and carefully managed through sheep grazing and a regular hay cut. At UWE, although the pasture is 30–40 years old, it had not received regular management, and the change from animal grazing to an annual hay cut occurred just 4 years before this study. It is likely that the vegetation was still adapting to the new management regime. At OWP, the sward was tightly knit with many perennial nitrogen fixing species, such as, Trifolium repens, T. pratense, and Lotus corniculatus. These species are able to take up water from about 30% deeper in the soil than rye grass, enabling them to withstand dry conditions (Grieu et al., 2001). At UWE, the sward was dominated by vigorous but tussock forming grasses, such as Dactylis glomerata and Arrhenatherum elatius, and many of the nitrogen fixing plants present are shallow rooted annual species, such as Vicia hirsuta (L.) and V. tetrasperma (L.). Other studies have shown that well-established pastures are less affected by water shortages, than younger less established pastures (Grieu et al., 2001; Fridley et al., 2011), and newly planted pastures are likely to be more sensitive to lack of summer rainfall. In a one-year-old pasture (in Ireland) 10 weeks of rainfall exclusion, starting in July, dramatically reduced biomass (Picon–Cochard et al., 2014). Intensive land use has been shown to increase negative effects on grassland associated with rainfall reduction (Stampfli et al., 2018). The UWE and OWP sites are both extensively managed, and this is likely to have contributed to their resilience to rainfall reduction.
4.6 How Well did the Experiment Achieve Its Aim?
The aim of the experiment was to understand how predicted changes in the climate, especially a decrease in summer rainfall, may affect the productivity of permanent pastures in the South West of England. Although we reduced rainfall by about 50% relative to incident rainfall, during the experiment, this was only for 3 years and was, therefore, not the same as reducing rainfall to 50% of the long-term average. In our experiment, the reduced rainfall values were within the range of rainfall values recorded over the last one hundred years. Several authors have suggested that well-established grassland communities are already adapted to environmental stress (Grime et al., 2008; Matos et al., 2020); because, for rainfall, long-term trends are smaller than inter-annual variations.
In the Bristol Frome catchment and the rest of the United Kingdom, future summer rainfall is predicted to decrease, but winter rainfall is predicted to increase (Afzal and Ragab, 2019; Met Office, 2018a); our experiment reduced rainfall throughout the year. During the winter months, pasture water use is small. Reducing rainfall by 50% did not impact biomass production or change the relative amount of species functional groups because, during the winter period, even 50% of the available rainfall was more than that needed to replenish soil water reserves. At both OWP and UWE, the soil had returned to field capacity in March of each year, the start of the main growing season (Figures 4, 5). A return of the soil to field capacity during the winter is considered crucial for crop growth in the following spring (Grove and Monaghan, 2018).
A longer experimental period is needed to separate long-term trends from inter-annual variation but, of the eleven long-term experiments on grassland in the United Kingdom in 2014, only two sites (Buxton Climate Change Impacts Laboratory and Peaknaze) were investigating the impacts of climate change, and both are on agriculturally unproductive upland grasslands (Ecological Continuity Trust, 2015). In our study, we excluded rainfall throughout the year but United Kingdom climate change predictions (Met Office, 2018a) indicate that winter rainfall is likely to increase and further work is needed to try understand how, or if, this will counteract the reduction in summer rainfall. Increased winter rainfall may increase the duration of winter waterlogging, and intense storms during the summer may cause episodes of summer waterlogging. Further studies are needed to understand the interactions between waterlogging and drought.
5 Conclusion
At the two sites we studied, OWP and UWE, 50% reduction in incident rainfall did not reduce annual above ground dry matter (biomass) production or alter the biomass proportions from different plant functional types. Regrowth of vegetation after a summer hay cut was reduced, but there was not a simple relationship between rainfall amount and regrowth. At both sites, annual biomass slightly increased under reduced rainfall indicating that over the 3 year term of the experiment, these pastures are resilient to water stress. Other studies of well-established and species rich grasslands have also indicated pasture resilience and suggested that reduced rainfall during the summer may lead to increased productivity (Grime et al., 2000; Hopkins and del Prado, 2007; Grime et al., 2008; Fridley et al., 2011; Van Looy et al., 2016). Our results suggest that very dry conditions early in the year, such as in 2017, are more likely to reduce productivity, than are dry conditions in late June or early July after grasses have flowered. However, as has been noted in other studies (Knapp and Smith, 2001), separating inter-annual variation in productivity from trends in productivity related to long-term rainfall patterns was difficult.
Our sites were extensively managed; more intensively managed pastures, where two to four grass cuts may be taken each year, might be more adversely affected by reduced summer rainfall. OWP and UWE are relatively species-rich pastures; the productivity and resilience of species-poor pastures might be more sensitive to reduced rainfall. Encouraging species diversity in pastures, even at the cost of overall reduced productivity, is often considered an insurance against environmental stress (Sanderson et al., 2007).
Looking to the future, our results indicate that well-established, species-rich pastures are likely to be able to tolerate drier summers, at least over 3 years. However, because increased variability in weather conditions is predicted (Met Office, 2018a) farmers may need more flexibility in the way that they manage pastures. Agri-environmental schemes may need to consider this.
Data Availability Statement
The datasets used in this study are available on application to RHJ5QHV3ZS5hYy51aw==.
Author Contributions
LM planned the DRY project; JT designed the experiment; JT, SA, and AG planned the sampling and site management regimes; SA collected and analysed the data and prepared the first draft manuscript; SA and JT revised the manuscript with input from AG and LM.
Funding
This work was funded through the RCUK Drought and Water Scarcity program: Grant number NE/LO1033X/1 awarded to LM and Grant number NE/L010291/1 awarded to UK CEH.
Conflict of Interest
The authors declare that the research was conducted in the absence of any commercial or financial relationships that could be construed as a potential conflict of interest.
Publisher’s Note
All claims expressed in this article are solely those of the authors and do not necessarily represent those of their affiliated organizations, or those of the publisher, the editors and the reviewers. Any product that may be evaluated in this article, or claim that may be made by its manufacturer, is not guaranteed or endorsed by the publisher.
Acknowledgments
We would like to thank Mrs. J Humphries and University of the West of England estate who allowed us to set up the experiment on their ground, and provided information about previous management of the fields.We would also like to thank all our colleagues from the DRY project team, University of the West of England, United Kingdom Centre for Hydrology & Ecology and the volunteers who helped with different stages of the project. Thank you to Hollie Cooper for assisting with monitoring the data upload to databases, to Dr N. Quinn for advice on handling the meteorological and soil moisture data and to Dr D. Toher for advice on analyzing to biomass data. We also thank Mechanical and Electrical Fixings Ltd., Loadhead, Scotland for much assistance with the design and delivery of the metal frames for the shelters, and Anglia plastics, Biggleswade, United Kingdom for advice on the PEGT shelter roofing material and forming the V shaped roof gutters. Some data used to prepare Figures 3, 4 and Supplementary Figure S1 have been presented elsewhere (Ayling et al., 2020).
Supplementary Material
The Supplementary Material for this article can be found online at: https://www.frontiersin.org/articles/10.3389/fenvs.2021.686668/full#supplementary-material
References
ADAS (1997). Defra Research Project CC0315 Integrated Models of Grassland and Livestock Systems to Assess the Impact of Climate changeADAS, BBSRC. Silsoe: Silsoe Research Institute.
Afzal, M., and Ragab, R. (2019). Drought Risk under Climate and Land Use Changes: Implication to Water Resource Availability at Catchment Scale. Water 11, 1790. doi:10.3390/w11091790
Alonoso, I., Weston, K., Gregg, R., and Morecroft, M. (2012). Carbon Storage by Habitat - Review of the Evidence of the Impacts of Management Decisions and Condition on Carbon Stores and Sources. Natural England Research Reports. Number NERR043. Available at: http://publications.naturalengland.org.uk/file/1413472.
Ayling, S. M., George, B. H., and Rogers, J. B. (2021). Mycorrhizal Colonisation in Roots ofHolcus lanatus(Yorkshire Fog) in a Permanent Pasture under Conditions of Reduced Precipitation. Botany 99, 199–208. doi:10.1139/cjb-2020-0162
Beier, C., Beierkuhnlein, C., Wohlgemuth, T., Penuelas, J., Emmett, B., Körner, C., et al. (2012). Precipitation Manipulation Experiments - Challenges and Recommendations for the Future. Ecol. Lett. 15, 899–911. doi:10.1111/j.1461-0248.2012.01793.x
Berglund, K. (2020). Soil Water. Available at: https://www.vaderstad.com/uk/know-how/basic-agronomy/let-nature-do-the-work/soil-water/. [Accessed 13 May 2020].
Berry, P., Willett, A., and Newell-Price, P. (2016). New Tools for Optimising Grass Production. Farming Monthly July 2016. 27. Available at: https://issuu.com/farmingmonthly/docs/july_2016_farming_monthly (Accessed February 22, 2021).
Blake, J. R., and Ragab, R. (2014). Drought Risk and You (DRY): Case Study Catchments – Physical Characteristics and Functioning. Wallingford: NERC/Centre for Ecology & Hydrology. 70pp. (CEH Project no. C05074) (Unpublished)Available at: http://nora.nerc.ac.uk/id/eprint/508990/(Accessed February 22, 2021).
Brown, R. N., Percivalle, C., Narkiewicz, S., and DeCuollo, S. (2010). Relative Rooting Depths of Native Grasses and Amenity Grasses with Potential for Use on Roadsides in New England. horts 45, 393–400. doi:10.21273/hortsci.45.3.393
Bryan, K., Ward, S., Roberts, L., White, M. P., Landeg, O., Taylor, T., et al. (2020). The Health and Well-Being Effects of Drought: Assessing Multi-Stakeholder Perspectives through Narratives from the UK. Climatic Change 163, 2073–2095. doi:10.1007/s10584-020-02916-x
Bunce, R. G. H., Barr, C. J., Gillespie, M. K., Howard, D. C., Scott, W. A., Smart, S. M., et al. (1999). Vegetation of the British Countryside - the Countryside Vegetation System, 1. London: ECOFACTDETR, 224pp.
Cairney, B. L. (2016). Will Drought Conditions Affect Phenological Timings of Grassland Species in Semi-improved Grasslands in the South West of England. Bristol, UKUK: MSc. Dissertation.University of the West of England.
Carlyle, C. N., Fraser, L. H., and Turkington, R. (2014). Response of Grassland Biomass Production to Simulated Climate Change and Clipping along an Elevation Gradient. Oecologia 174, 1065–1073. doi:10.1007/s00442-013-2833-2
Cole, A. J., Griffiths, R. I., Ward, S. E., Whitaker, J., Ostle, N. J., and Bardgett, R. D. (2019). Grassland Biodiversity Restoration Increases Resistance of Carbon Fluxes to Drought. J. Appl. Ecol. 56, 1806–1816. doi:10.1111/1365-2664.13402
Cranfield University (2021). The Soils Guide. UK: Cranfield University. Available at: https://www.landis.org.uk (Accessed 02 22, 2021).
Dawson, L. A., Grayston, S. J., and Paterson, E. (2000). “Effects of Grazing on the Roots and Rhizosphere of Grasses,” in Grassland Ecophysiology and Grazing Ecology. Editors G. Lemaire, J. Hodgson, A. de Moraes, C. Nabinger, and F. P.C. de Carvalho (New York: CAB International), 61–84. doi:10.1079/9780851994529.0061
Department for Environment Food & Rural Affairs. (2021). Defra Statistics: Agricultural Facts England Regional Profiles March 2021 Available at: https://assets.publishing.service.gov.uk/government/uploads/system/uploads/attachment_data/file/972103/regionalstatistics_overview_23mar21.pdf [accessed 20 September 2021].
Ecological Continuity Trust (2015). The State of the UK’s Long-Term Experiments. Abingdon: Natural England Commissioned Reports. Number 203.
Edwards, B., Gray, M., and Hunter, B. (2018). The Social and Economic Impacts of Drought. Aust. J. Soc. Issues 54, 22–31. doi:10.1002/ajs4.52
Elliott, J., Deryng, D., Müller, C., Frieler, K., Konzmann, M., Gerten, D., et al. (2014). Constraints and Potentials of Future Irrigation Water Availability on Agricultural Production under Climate Change. Proc. Natl. Acad. Sci. USA 111, 3239–3244. doi:10.1073/pnas.1222474110
Emmerling, C., Rassier, K. M., and Schneider, R. (2015). A Simple and Effective Method for Linking Field Investigations of Earthworms and Water Infiltration Rate into Soil at Pedon-Scale. J. Plant Nutr. Soil Sci. 178, 841–847. doi:10.1002/jpln.201500256
Environment Agency (2017) Drought Response Our Framework for England. Available at: https://assets.publishing.service.gov.uk/government/uploads/system/uploads/attachment_data/file/625006/LIT_10104.pdf. [Accessed 4 September 2020].
FAO (2005) Grasslands of the World. Available at: http://www.fao.org/3/y8344e/y8344e05.htm
Findlay, D. C., Colborne, G. J. N., Cope, D. W., Harrod, T. R., Hogan, D. V., and Staines, S. J. (1984). Soil Survey of England and Wales Bulletin No. 14. Soils and Their Use in South West England. Harpenden: Lawes Agricultural Trust.
Findlay, D. C. (1976). Soils of the Southern Cotswolds. Memoirs of the Soil Survey of Great Britain, England and Wales. Harpenden: Rothamsted Experimental Station.
Finger, R., Gilgen, A. K., Prechsl, U. E., and Buchmann, N. (2013). An Economic Assessment of Drought Effects on Three Grassland Systems in Switzerland. Reg. Environ. Change 13, 365–374. doi:10.1007/s10113-012-0346-x
Fridley, J. D., Grime, J. P., Askew, A. P., Moser, B., and Stevens, C. J. (2011). Soil Heterogeneity Buffers Community Response to Climate Change in Species-Rich Grassland. Glob. Change Biol. 17, 2002–2011. doi:10.1111/j.1365-2486.2010.02347.x
Fry, E., Manning, P., and Power, S. (2014). Ecosystem Functions Are Resistant to Extreme Changes to Rainfall Regimes in a Mesotrophic Grassland. Plant and Soil 381, 351–365. doi:10.1007/s11104-014-10.1007/s11104-014-2137-2
Grieu, P., Lucero, D. W., Ardiani, R., and Ehleringer, J. R. (2001). The Mean Depth of Soil Water Uptake by Two Temperate Grassland Species over Time Subjected to Mild Soil Water Deficit and Competitive Association. Plant and Soil 230, 197–209. doi:10.1023/A:1010363532118
Grime, J. P., Brown, V. K., Thompson, K., Masters, G. J., Hillier, S. H., Clarke, I. P., et al. (2000). The Response of Two Contrasting Limestone Grasslands to Simulated Climate Change. Science 289, 762–765. New York, NScience. doi:10.1126/science.289.5480.762
Grime, J. P., Fridley, J. D., Askew, A. P., Thompson, K., Hodgson, J. G., and Bennett, C. R. (2008). Long-term Resistance to Simulated Climate Change in an Infertile Grassland. Proc. Natl. Acad. Sci. 105, 10028–10032. doi:10.1073/pnas.0711567105
Grove, I., and Monaghan, J. (2018). NERC DRY Project Report and Results from HAU Agricultural Mesocosms. Unpublished report. 114pp. Available at:.
Holden, A. J., and Brereton, A. J. (2002). An Assessment of the Potential Impact of Climate Change on Grass Yield in Ireland over the Next 100 Years. Irish J. Agric. Food Res. 41, 213–226. https://www.jstor.org/stable/25562465.
Holtan, H. N., and Kirkpatrick, M. H. (1950). Rainfall, Infiltration, and Hydraulics of Flow in Runoff Computation. Trans. AGU 31, 771–779. doi:10.1029/TR031i005p00771
Hopkins, A., and del Prado, A. (2007). Implications of Climate Change for Grassland in Europe: Impacts, Adaptations and Mitigation Options: a Review. Grass Forage Sci. 62, 118–126. doi:10.1111/j.1365-2494.2007.00575.x
Johansen, L., Westin, A., Wehn, S., Iuga, A., Ivascu, C. M., Kallioniemi, E., et al. (2019). Traditional Semi-natural Grassland Management with Heterogeneous Mowing Times Enhances Flower Resources for Pollinators in Agricultural Landscapes. Glob. Ecol. Conservation 18, e00619. doi:10.1016/j.gecco.2019.e00619
Jones, L., and Humphreys, M. (1999). Harnessing Hybrids for home Produced Feed. IGER Innovations 1999. 30–33. Available at: https://www.aber.ac.uk/en/media/departmental/ibers/pdf/innovations/99/99ch5.pdf. [Accessed 22 February 2021].
Kendon, M., Marsh, T., and Parry, S. (2013). The 2010-2012 Drought in England and Wales. Weather 68, 88–95. doi:10.1002/wea.2101
Kendon, M., McCarthy, M., Jevrejeva, S., Matthews, A., and Legg, T. (2018). State of the UK Climate 2017. Int. J. Climatol 38 (S2), 1–35. doi:10.1002/joc.5798
Kendon, M., McCarthy, M., Jevrejeva, S., Matthews, A., and Legg, T. (2018)., 38. UK, 1–35. doi:10.1002/joc.5798State of the UK Climate 2017Int. J. Climatol
Kendon, M., McCarthy, M., Jevrejeva, S., Matthews, A., and Legg, T. (2019). State of the UK Climate 2018. Int. J. Climatol 39, 1–55. doi:10.1002/joc.6213
Klaus, V. H., Hölzel, N., Prati, D., Schmitt, B., Schöning, I., Schrumpf, M., et al. (2016). Plant Diversity Moderates Drought Stress in Grasslands: Implications from a Large Real-World Study on 13C Natural Abundances. Sci. total Environ. 566-567, 215–222. doi:10.1016/j.scitotenv.2016.05.008
Knapp, A. K., and Smith, M. D. (2001). Variation Among Biomes in Temporal Dynamics of Aboveground Primary Production. Science 291, 481–484. doi:10.1126/science.291.5503.481
Lee, M. A., Manning, P., Walker, C. S., and Power, S. A. (2014). Plant and Arthropod Community Sensitivity to Rainfall Manipulation but Not Nitrogen Enrichment in a Successional Grassland Ecosystem. Oecologia 176, 1173–1185. doi:10.1007/s00442-014-3077-5
Leimer, S., Berner, D., Birkhofer, K., Boeddinghaus, R., Fischer, M., Kandeler, E., et al. (2021). Land-use Intensity and Biodiversity Effects on Infiltration Capacity and Hydraulic Conductivity of Grassland Soils in Southern Germany. Ecohydrology 14, E2301. doi:10.1002/eco.2301
Liguori, A., McEwen, L., Blake, J., and Wilson, M. (2021). Towards 'Creative Participatory Science': Exploring Future Scenarios through Specialist Drought Science and Community Storytelling. Front. Environ. Sci. 8, 589856. doi:10.3389/fenvs.2020.589856
Macklon, A. E. S., Mackie-Dawson, L. A., Sim, A., Shand, C. A., and Lilly, A. (1994). Soil P Resources, Plant Growth and Rooting Characteristics in Nutrient Poor upland Grasslands. Plant Soil 163, 257–266. https://www.jstor.org/stable/42939760. doi:10.1007/bf00007975
Marsh, T., Cole, G., and Wilby, R. (2007). Major Droughts in England and Wales, 1800-2006. Weather 62, 180087–200693. doi:10.1002/wea.67
Matos, I. S., Flores, B. M., Hirota, M., and Rosado, B. H. P. (2020). Critical Transitions in Rainfall Manipulation Experiments on Grasslands. Ecol. Evol. 10, 2695–2704. doi:10.1002/ece3.6072
McEwen, L., Bryan, K., Black, A., Blake, J., and Afzal, M. (2021). Science-Narrative Explorations of "Drought Thresholds" in the Maritime Eden Catchment, Scotland: Implications for Local Drought Risk Management. Front. Environ. Sci. 9, 589980. doi:10.3389/fenvs.2021.589980
Met Office. (2013). England and Wales Drought 2010 to 2012. Available at: https://www.metoffice.gov.uk/binaries/content/assets/metofficegovuk/pdf/weather/learn-about/uk-past-events/interesting/2012/england-and-wales-drought-2010-to-2012---met-office.pdf. [Accessed 10 November 2020].
Met Office. (2018a). UK Climate Projections (UKCP). Available at: https://www.metoffice.gov.uk/research/approach/collaboration/ukcp/index. [Accessed 6 June 2019].
Met Office. (2018b). Chance of Summer Heatwaves Now Thirty Times More Likely. Available at: https://beta.metoffice.gov.uk/about-us/press-office/news/weather-and-climate/2018/2018-uk-summer-heatwave. [Accessed 2 November 2020].
Met Office. (2021a). UK Climate Averages. Filton, South Gloucestershire. Available at: https://www.metoffice.gov.uk/research/climate/maps-and-data/uk-climate-averages/gcnjj7h5w [accessed 20 September 2021].
Met Office. (2021b). Weather Conditions. Available at: https://www.metoffice.gov.uk/weather/learn-about/weather/how-weather-works/high-and-low-pressure/weather-conditions. [Accessed 22 February 2021].
Michalcová, D., Gilbert, J. C., Lawson, C. S., Gowing, D. J. G., and Marrs, R. H. (2011). The Combined Effect of Waterlogging, Extractable P and Soil pH on α-diversity: a Case Study on Mesotrophic Grasslands in the UK. Plant Ecol. 212, 879–888. doi:10.1007/s11258-010-9871-1
Moxley, J., Anthony, S., Begum, K., Bhogal, A., Buckingham, S., Christie, P., et al. (2014). Capturing Cropland and Grassland Management Impacts on Soil Carbon in the UK LULUCF Inventory Contract Report Prepared for the Department for Environment, Food and Rural Affairs. Defra Project Code: SP1113 CEH Project Code, NEC04909. Available at: http://randd.defra.gov.uk/Document.aspx?Document=12186_SP1113Finalreport.pdf (Accessed February 22, 2021).
Moxley, J., and Malcolm, H. (2014). Reporting the Effect of Grassland Management on Carbon Storage in Soils and Biomass. Available at: https://www.sruc.ac.uk/download/downloads/id/3002/. [Accessed 22 February 2021].
National Aeronautics and Space Administration. (2020). Climate Change. Available at: https://climate.nasa.gov/effects/#:∼:text=Increased%20heat%2C%20drought%20and%20insect,coastal%20areas%20are%20additional%20concerns. [Accessed 3 September 2020].
National River Flow Archive. (2021). National River Flow Archive. Available at: https://nrfa.ceh.ac.uk/. [Accessed 22 February 2021].
Natural England (2001).The upland Management Handbook (SC26), Chapter 7 Meadows and Enclosed pastures. Available at: http://publications.naturalengland.org.uk/file/86044. [Accessed 22 February 2021].
Natural England (2012). Review of the Evidence of the Impacts of Management Decisions and Condition on Carbon Stores and Sources. Natural England Research Reports. Number NERR043. Available at: http://publications.naturalengland.org.uk/publication/1412347 (Accessed February 22, 2021).
Office of National Statistics (ONS) (2014). Farm Business Income by Type of Farm in England, 2013/14. Available at: https://assets.publishing.service.gov.uk/government/uploads/system/uploads/attachment_data/file/420919/fbs-businessincome-statsnotice-11dec14.pdf
Office of National Statistics (ONS) (2017). Farming Statistics: Final Land Use, Livestock Populations and Agricultural Workforce at 1 June 2017 – England. Available at: https://assets.publishing.service.gov.uk/government/uploads/system/uploads/attachment_data/file/654742/structure-jun2017final-eng-26oct17.pdf
Office of National Statistics (ONS) (2018). Agriculture in the United Kingdom 2017 Available at: https://assets.publishing.service.gov.uk/government/uploads/system/uploads/attachment_data/file/741062/AUK-2017-18sep18.pdf
Office of National Statistics (ONS) (2020). Agriculture in the United Kingdom 2019. Available at: https://assets.publishing.service.gov.uk/government/uploads/system/uploads/attachment_data/file/950618/AUK-2019-07jan21.pdf [Accessed 14 March 2021].
Picon–Cochard, C., Finn, J., Suter, M., Nagy, Z., Diop, A., Fisher, F., et al. (2014). Report on Grassland Ecosystem Manipulation Experiments. Available at: https://hal.archives-ouvertes,fr/hal-01611420. [Accessed 22 February 2021].
Qi, A., Holland, R. A., Taylor, G., and Richter, G. M. (2018). Grassland Futures in Great Britain - Productivity Assessment and Scenarios for Land Use Change Opportunities. Sci. Total Environ. 634, 1108–1118. doi:10.1016/j.scitotenv.2018.03.395
Rivington, M., and Koo, J. (2010). Report on the Meta-Analysis of Crop Modelling for Climate Change and Food Security Survey. CGIAR Program on Climate Change. Copenhagen, Denmark: Agriculture and Food Security CCAFS, 73.
Rodda, J. C., and Marsh, T. J. (2011). The 1975-76 Drought - a Contemporary and Retrospective Review. Available at: http://nora.nerc.ac.uk/id/eprint/15011/1/CEH_1975-76_Drought_Report_Rodda_and_Marsh.pdf. [Accessed 22 February 2021].
Rural Payments Agency. (2020). Basic Payment Scheme Rules for 2020. Available at: https://assets.publishing.service.gov.uk/government/uploads/system/uploads/attachment_data/file/900670/BPS_2020_scheme_rules_v3.0.pdf. [Accessed 20 November 2020].
Sanderson, M. A., Goslee, S. C., Soder, K. J., Skinner, R. H., Tracy, B. F., and Deak, A. (2007). Plant Species Diversity, Ecosystem Function, and Pasture Management-A Perspective. Can. J. Plant Sci. 87, 479–487. doi:10.4141/P06-135
Stace, C. (2014). New Flora of the British Isles. Third Edition. Cambridge: Cambridge University Press.
Stampfli, A., Bloor, J. M. G., Fischer, M., and Zeiter, M. (2018). High Land-Use Intensity Exacerbates Shifts in Grassland Vegetation Composition after Severe Experimental Drought. Glob. Change Biol. 24, 2021–2034. doi:10.1111/gcb.14046
Staniak, M., and Kocoń, A. (2015). Forage Grasses under Drought Stress in Conditions of Poland. Acta Physiol. Plant 37, 116. doi:10.1007/s11738-015-1864-1
Stanke, C., Kerac, M., Prudhomme, C., Medlock, J., and Murray, V. (2013). Health Effects of Drought: a Systematic Review of the Evidence. Plos Curr. 1. Jun 5. doi:10.1371/currents.dis.7a2cee9e980f91ad7697b570bcc4b004
Sternberg, M., Brown, V. K., MastersClarke, G. J. I. P., and Clarke, I. P. (1999). Plant Community Dynamics in a Calcareous Grassland under Climate Change Manipulations. Plant Ecol. 143, 29–37. doi:10.1023/A:1009812024996
Tilman, D., and Downing, J. A. (1994). Biodiversity and Stability in Grasslands. Nature 367, 363–365. doi:10.1038/367363a0
Van Looy, K., Lejeune, M., and Verbeke, W. (2016). Indicators and Mechanisms of Stability and Resilience to Climatic and Landscape Changes in a Remnant Calcareous Grassland. Ecol. Indicators 70, 498–506. doi:10.1016/j.ecolind.2016.06.036
Van Peer, L., Nijs, I., Reheul, D., and De Cauwer, B. (2004). Species Richness and Susceptibility to Heat and Drought Extremes in Synthesized Grassland Ecosystems: Compositional vs Physiological Effects. Funct. Ecol. 18, 769–778. doi:10.1111/j.0269-8463.2004.00901.x
Vogel, A., Fester, T., Eisenhauer, N., Scherer-Lorenzen, M., Schmid, B., Weisser, W. W., et al. (2013). Separating Drought Effects from Roof Artifacts on Ecosystem Processes in a Grassland Drought Experiment. PLoS ONE 8, e70997. doi:10.1371/journal.pone.0070997
Ward, S. E., Smart, S. M., Quirk, H., Tallowin, J. R. B., Mortimer, S. R., Shiel, R. S., et al. (2016). Legacy Effects of Grassland Management on Soil Carbon to Depth. Glob. Change Biol. 22, 2929–2938. doi:10.1111/gcb.13246
Wilcox, K. R., Shi, Z., Gherardi, L. A., Lemoine, N. P., Koerner, S. E., Hoover, D. L., et al. (2017). Asymmetric Responses of Primary Productivity to Precipitation Extremes: A Synthesis of Grassland Precipitation Manipulation Experiments. Glob. Change Biol. 23, 4376–4385. doi:10.1111/gcb.13706
Keywords: grassland, climate change, productivity, resilience, reduced rainfall
Citation: Ayling SM, Thompson J, Gray A and McEwen LJ (2021) Impact of Reduced Rainfall on Above Ground Dry Matter Production of Semi-natural Grassland in South Gloucestershire, UK: A Rainfall Manipulation Study. Front. Environ. Sci. 9:686668. doi: 10.3389/fenvs.2021.686668
Received: 27 March 2021; Accepted: 22 October 2021;
Published: 12 November 2021.
Edited by:
Ian Holman, Cranfield University, United KingdomReviewed by:
Yu Liu, Northwest A and F University, ChinaDaniel Evans, Cranfield University, United Kingdom
Kristina Young, Utah State University, United States
Copyright © 2021 Ayling, Thompson, Gray and McEwen. This is an open-access article distributed under the terms of the Creative Commons Attribution License (CC BY). The use, distribution or reproduction in other forums is permitted, provided the original author(s) and the copyright owner(s) are credited and that the original publication in this journal is cited, in accordance with accepted academic practice. No use, distribution or reproduction is permitted which does not comply with these terms.
*Correspondence: S. M. Ayling, c2FyYWguYXlsaW5nQHV3ZS5hYy51aw==