 Mark D. McDonald
 Katie L. Lewis2
 Thomas W. Boutton
 Terry J. Gentry
- 1Department of Soil and Crop Sciences, Texas A&M University, College Station, TX, United States
- 2Texas A&M AgriLife Research-Lubbock, Lubbock, TX, United States
- 3Texas A&M AgriLife Research-Vernon, Vernon, TX, United States
- 4Department of Ecology and Conservation Biology, Texas A&M University, College Station, TX, United States
- 5BASF Corporation, Lubbock, TX, United States
Agricultural soils account for less than 10% of the total greenhouse gas (GHG) emissions in the United States but about 75% of nitrous oxide (N2O) emissions. Soil conservation practices, such as no-tillage, have the potential to mitigate GHG emissions. We examined the short-term consequences of no-tillage with a winter wheat cover crop (NTW) and no-tillage winter fallow (NT) on N2O emissions, N2O reducing bacterial populations, and overall soil bacterial abundance during the summer growing season in the southern Great Plains, United States. Conservation practices were coupled with nitrogen (N) fertilizer application timing (100% pre-plant, 100% mid-season, 40% pre-plant 60% mid-season, 100% pre-plant with N stabilizer). In addition, N2O emissions were measured to determine any functional effects of altering N fertilizer timing and changing bacterial populations. The combination of N treatment and conservation practice affected nosZ clade II abundance in the second year of the study. Diversity of nosZ clade II was evaluated to determine effects on non-typical N2O reducers which were highly abundant in this study. No nosZ clade II diversity effects were determined, although some clustering of conservation system and N treatments was observed in the second year. Nitrogen treatment affected N2O-N emissions during the summer of both years, likely related to overall increased microbial activity and N fertilizer application. Negative fluxes (consumption) of N2O-N were observed in every treatment and tillage combination and were most pronounced in the control (0 kg N ha−1). Negative fluxes are likely due to a combination of low inorganic-N concentrations at various points during the year and a robust clade II population driving N2O consumption. Altering conservation system and the timing of N fertilizer application affects the microbial community and will likely continue to select for unique communities as the system matures. This will also likely further impact N2O emissions from the system and may increase the rate and frequency of N2O consumption.
1 Introduction
Nitrous oxide (N2O) is a long-lived atmospheric trace gas that has increased its concentration by 20% since preindustrial time (Butterbach-Bahl et al., 2013), has a global warming potential (GWP) approximately 300 times that of CO2 (IPCC, 2007), and plays an important role in stratospheric ozone depletion (Griffis et al., 2017). Soil is the major global source of nitrous oxide (N2O), accounting for about 78% of N2O emissions in the United States in 2018 (EPA, 2020) where the predominant pathways for production are denitrification and nitrification (Bremner, 1997; Barnard et al., 2005; Mørkved et al., 2007; Reay et al., 2012). Denitrification most often occurs in anaerobic environments (Knowles, 1982; Linn and Doran, 1984) while nitrification is an aerobic process. How N2O is produced is thus often dictated by soil moisture content (Linn and Doran, 1984; Fentabil et al., 2016), with soil texture and organic matter (OM) content impacting soil water holding capacity, and consequently N2O production (Firestone and Davidson, 1989; Bremner, 1997). Increased soil moisture and O2 content affect nitrification and denitrification processes differently. With denitrification, the genes and enzymes responsible are typically O2 sensitive and thus increased soil moisture and reduced O2 would enhance this process and N2O production (Betlach and Tiedje, 1981; Lloyd, 1993). For nitrification where reduced O2 conditions are present, the oxidation of NH3 to NO can be the terminus of the nitrification process, resulting in a potential buildup of NO for soil microbes (Caranto and Lancaster, 2017). This NO may then be reduced to N2O by those microbes, or through release to the environment and subsequent use by denitrifiers. With the oxygen sensitive nature of the enzymes responsible for N2O reduction, production of N2O from NO produced through the first step of nitrification in a mostly aerobic soil usually results in N2O as the final product (Lloyd, 1993).
However, soil carbon (C) content is a strong control over N2O production, compared to soil water, in semi-arid lands which cover approximately 35% of the terrestrial surface (McLain and Martens, 2006; Barton et al., 2008). In semi-arid lands, additional C inputs are derived from conservation practices such as cover cropping and no-tillage, which are most often implemented to mitigate eolian erosion, and increase soil health factors. These practices have been shown to substantially decrease eolian losses (Zobeck and Van Pelt, 2011), but still only about 38% of cropped area used conservation tillage and 6% used cover crops in Texas in 2012 (NASS, 2012). Studies aimed at understanding the impact these changes have on crop productivity and carbon dioxide emissions in semi-arid areas have been conducted (Keeling et al., 1989; Lewis et al., 2018; McDonald et al., 2019; McDonald et al., 2020). In more temperate climates, conservation tillage practices have been reported to not affect N2O emissions, while in dry climates conservation practices have been reported to generally decrease N2O emissions (Kessel et al., 2013). However, the effect of these conservation systems on N2O reduction and reduction potential is less understood. Conservation practices can increase soil respiration, potentially leading to anaerobic microsites and influencing the production and consumption of N2O and other greenhouse gases (Malhi et al., 2006; McLain and Martens, 2006; Barton et al., 2008; Halvorson et al., 2008; Smith et al., 2008). While anaerobic conditions are likely to increase with cover cropping and no-tillage, increased soil respiration, as brought about by the introduction of inorganic fertilizer and increased carbon inputs will also increase the growth and activity of denitrifiers in an otherwise “aerobic” agricultural soil (Wu et al., 2017). The increased potential for denitrification to occur under no-tillage is further supported by a meta-analysis regarding no-tillage effects on the abundance and activity of denitrifying communities (Wang and Zou, 2020). However, it is also under these conditions that the potential for N2O mitigation can be derived through increasing the abundance and activity of clade II N2O reducing bacteria in anaerobic microsites.
The bacteria capable of N2O reduction employ the nitrous oxide reductase (N2OR) enzyme produced from two clades of the nosZ gene, clade I and clade II, both of which have been shown to mediate N2O consumption, especially clade II (Jones et al., 2014). Clade II bacteria tend to be more abundant, diverse, and less likely to be associated with other denitrification genes (Jones et al., 2013; Jones et al., 2014; Higgins et al., 2016). These bacteria are hypothesized to use the reduction of N2O to nitrous gas (N2) as a bet-hedging strategy to survive brief periods of anoxic conditions such as those present in agricultural soil under irrigation, or where anaerobic microsites are expected (Lycus et al., 2018). In addition to environmental selection via fluctuations in soil O2, low soil inorganic-N concentrations have been shown to increase N2O consumption in soil (Ryden, 1981; Minami, 1997; Butterbach-Bahl et al., 1998; Rosenkranz et al., 2006; Kroeze et al., 2007). With N fertilizer application, an increase in soil N2O emissions is to be expected due to overall increased N cycling as well as through competition for electrons between N2OR and NO3− reducing enzymes (Barnard et al., 2005; Mania et al., 2014; Shelton et al., 2017). Thus, best management practices for mitigating N2O emissions should include evaluation of N fertilizer application practices in addition to soil conservation strategies. Selecting for a system that can increase the potential for anaerobic microsites where N2O reduction can occur while also reducing the amount of labile N for microbial use is challenging and imperative for economic and environmental sustainability in existing and developing semi-arid agricultural soil. Previous reviews have discussed the importance of N2O consumption in soils, related to global greenhouse gas accounting, where a large potential for N2O consumption and understanding of the practices that enhance this capability could have significant impacts on reducing the effect of agricultural N2O emissions (Chapuis-Lardy et al., 2007; Hallin et al., 2018).
This research aimed to quantify the effects of implementing conservation practices coupled with N fertilizer management (timing of fertilizer application) on the abundance of N2O reducing genes, the diversity of the clade II population, and N2O emissions over a 2-year period in continuous cotton production on the Southern High Plains of Texas (SHP, MLRA 77C). By examining these systems shortly after implementation, we can evaluate the immediate effects of these conservation practices on N2O flux, while also providing valuable information for other factors that are considered with suggested changes in agronomic production. This study involved 15 unique treatment combinations of conservation practices and timing of fertilizer application for evaluation of N2O reducing potential, soil N resources, and in-situ N2O production, and consumption. In addition, the diversity of clade II N2O reducers was evaluated in a subset of treatment combinations that are most commonly implemented in the study area to determine if implemented conservation practices and N fertilizer management selected for unique N2O reducing communities. It was hypothesized that N2O consumption would be greatest where N fertilizer application was split or removed in a no-tillage system with a winter wheat cover crop and would be driven by an increased N2O reducing bacteria population. It was also hypothesized that commonly used treatment combinations would result in unique clade II communities due to their differential impacts on soil C and N inputs.
2 Materials and Methods
2.1 Study Area and Cropping System
This study was conducted at the Texas A&M AgriLife Research and Extension Center in Lubbock, Texas (33.687°, 101.827°). The 30-years (1991–2020) temperature and rainfall averages for this area were 16.1°C and 481 mm, respectively (Noaa, 2021). The soil was an Acuff loam described as fine-loamy, mixed, superactive, thermic Aridic Paleustolls (U.S. Department of Agriculture, 2016). The study design was as a split plot with conservation practice as the main plot and N fertilizer application as the split plot arranged in randomized complete blocks. Main plot conservation treatments included the following: no-till with a winter wheat cover crop (NTW), no-till winter fallow (NT), and conventional tillage winter fallow (CT). Split plot N fertilizer application timings were 1) no-added N (control); 2) 100% of N applied in a pre-plant application (PP); 3) 100% of N applied mid-season (MS) at the first reproductive growth of the cotton crop; 4) 40% of N applied PP and 60% MS applied (SPLIT); and 5) 100% of N applied PP with a N stabilizer product (STB). The stabilizer product used was Limus® Nitrogen Management (N-butyl-thiophosphoric triamide and N-Propyl-thiophosphoric triamide, BASF Corporation, United States) a dual action urease inhibitor. Tillage main plots were randomly assigned to four rows (1-m row spacing) within each of the three blocks (replicates), and the N treatments were randomly arranged within each main plot, with each of the 5 N treatments were replicated within each tillage system. There were 45 plots measuring 15 m in length. Prior to seeding the cover crop in fall 2015, this area was under conventional tillage, winter fallow management for at least the last 60 years.
Nitrogen fertilizer was applied via knife injection using a coulter fertilizer applicator at a total rate of 168 kg N ha−1 placed 10–15 cm from the cotton row, as urea ammonium nitrate (UAN-32, 32-0-0). Preplant N treatments were applied on May 10, 2016 and May 11, 2017, and MS applications on July 13, 2016 and July 20, 2017. Wheat (TAM 304) was planted on January 25, 2016, and November 22, 2016 at a seeding rate of 67 kg ha−1 (19 cm row spacing). The planting on January 25, 2016 was a re-plant after a failed stand due to low soil moisture and precipitation at planting in November 2015. Glyphosate [N-phosphonomethyl glycine] at 2.2 kg active ingredient (a.i). ha−1 in 2016 and at 3.5 kg a.i. ha−1 in 2017 was used to chemically terminate the wheat cover crop on April 13, 2016 and April 20, 2017. Cotton (Delta-Pine 1,321) was planted on May 26, 2016 and June 6, 2017 at a rate of 123,553 seeds ha−1 and harvested on November 14, 2016 and November 15, 2017. Furrow irrigation (152 mm) occurred on July 1, 2016, July 27, 2016, August 13, 2016, June 6, 2017, and July 30, 2017. The full field management procedure was reported previously (McDonald et al., 2020). Climate data for the area was collected from the National Oceanic and Atmospheric Administration weather station 2 km south of the research site at the Lubbock International Airport, TX, United States (Figure 1).
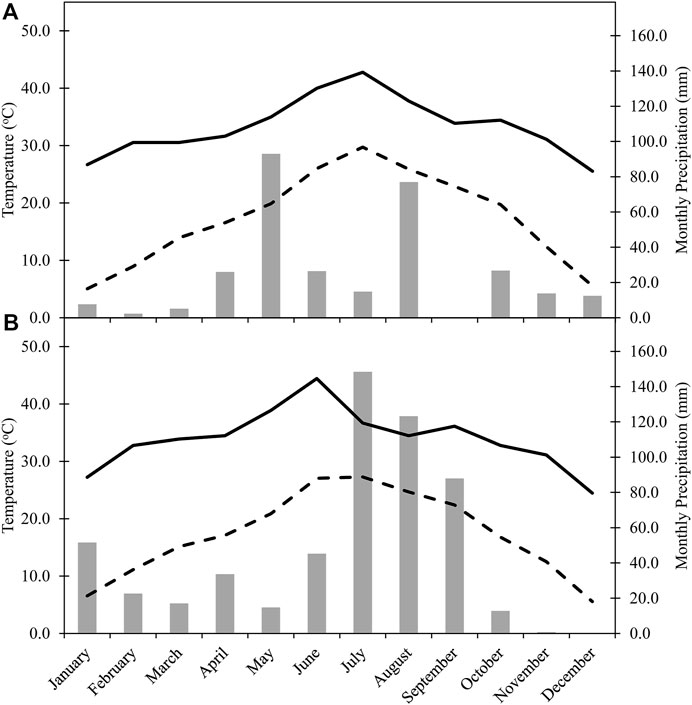
FIGURE 1. Monthly maximum temperature (°C), monthly mean temperature (°C), and monthly cumulative precipitation in (A) 2016 and (B) 2017. Data was collected from the National Oceanic and Atmospheric Administration weather station 2 km south of the research site at the Lubbock International Airport, TX, United States (GHCND:USW00023042).
2.2 Soil Analysis
Soil samples were collected prior to N fertilizer application on April 8, 2016, and prior to the in-season mid-season application of N fertilizer in each year (July 1, 2016 and July 19, 2017) using a 5.1 cm diameter Giddings probe (Giddings Machine Company, Windsor, CO). Pre-season soil analysis was reported previously (Supplementary Table S1; McDonald et al., 2019). In-season soil samples were collected to a depth of 60 cm and subdivided into three increments: 0–15, 15–30, and 30–60 cm. A representative soil sample for each plot was collected by compositing two cores from each plot. Data from the 15–30 cm and 30–60 cm depth are not presented here. Sub-samples (50 ml) of the in-season soil samples (0–15 cm depth) were stored at −80°C until DNA extraction for microbial analysis. The remainder of the in-season samples were mechanically ground to pass a 2-mm mesh screen after drying at 60°C for 7 days. Soil samples were then stored at room temperature until nutrient analysis.
The samples collected in-season were analyzed for ammonium (NH4+-N) and NO3−-N by extracting with 2 M KCl using a 1:5 soil to extractant ratio (5 g soil and 25 ml 2 M KCl). Extracted samples were then analyzed for NH4+-N by the Berthelot reaction involving salicylate and NO3− by cadmium reduction prior to analysis using flow injection spectrometry [FIAlab 2600, FIAlab Instruments Inc., Bellevue, WA; Keeney and Nelson (1982)].
2.3 N2O Flux Measurements
Full details of the gas sampling procedure are outlined in McDonald et al. (2019). Gas samples were collected monthly as well as 1, 3, and 7 days post-fertilizer application (weather permitting) in both years (13 samplings from April 2016-March 2017; 12 samplings from April 2017-December 2017). A Gasmet DX-4040 portable FTIR (Fourier Transform Infrared) multi-gas analyzer (Gasmet Technologies, Helsinki, Finland) integrated with a 20 cm diameter Li-Cor survey gas chamber (Li-8100-103, Li-Cor Biosciences, Lincoln, NE United States) was used for in-situ gas flux analysis. A PVC collar (19.5 cm diameter, 11 cm height) was placed between the 2nd and 3rd row of each plot at least 10 h prior to sampling at a depth of at least 3 cm below the soil surface. During sampling, the Li-Cor chamber was deployed on each collar for 8 min, with a 20 s sampling time to yield 24 samples per plot. Linear regression of N2O concentration over the deployed time was conducted and fluxes with an r2 of >0.7 were considered significant. Slope of the trendline was then calculated and used to determine the soil gas flux with the ideal gas law (McDonald et al., 2019). The minimal detectable concentration of N2O for the Gasmet DX4040 is 7 ppb (J. Cornish, Gasmet Technologies, personal communication, November 8, 2016). The data was sorted into seasons according to the major cotton growing periods of the year where Spring was April through May, Summer was June through September, and Fall/Winter was October through March. These seasonal determinations coincide with pre-plant field operations for the spring, the major growing season in the summer, and the harvest and post-harvest season for the Fall/Winter on the SHP, respectively. Cumulative fluxes were determined from cover crop termination (April 13, 2016, April 20, 2017) through cotton harvest (November 14, 2016 and November 15, 2017). Calculation of cumulative emissions was determined by averaging the two most recent daily flux rates and extrapolating over the time between the two flux rate measurements. Fluxes of N2O for this study are considered baseline rates, due to complications in gas measurement following major rainfall and furrow irrigation events related to field access and equipment capabilities. However, these moisture events are infrequent on the SHP (29 days with >10 mm across 2016 and 2017, Menne et al., 2012a; Menne et al., 2012b) and thus “dry” measurements would represent the most common soil flux rate. Cumulative emission calculations estimated the total baseline N2O flux during the crop growing season to determine potential treatment differences in this semi-arid agricultural system and likely underestimate total N2O flux across the year due to the inability to measure post-wetting emission events. Winter fluxes of N2O were measured between the first and second year of the study and were determined to be low, or negative and thus likely do not significantly contribute to total N2O emissions from the treatments evaluated here.
2.4 Microbial Analyses
In addition to in-season soil chemical measurements, microbial analyses were performed for the 0–15 cm depth and included: qPCR of the 16S, nosZ clade I, and nosZ clade II genes; sequencing of the nosZ clade II genes. DNA from soil samples was extracted using DNeasy PowerSoil DNA isolation kits (Qiagen, Germantown, MD, United States) according to manufacturer protocol with a 5 min incubation at 2–8°C following solution C2 addition. A NanoDrop spectrometer (ND-1000, NanoDrop Technologies, LLC, DE, United States) was used to assess DNA purity after extraction. Quantitative polymerase chain reaction (qPCR) was conducted on extracted DNA to determine overall bacterial abundance as well as the abundance of both clades of the nosZ gene. Extracted DNA was quality checked for qPCR inhibitors in a process similar to Hartman et al. (2005) where a spiked sample with a threshold cycle (Ct) value within three standard deviations of the quality control Ct mean was determined to not contain inhibitors. Quality control was conducted by spiking a qPCR assay with extracted DNA from the collected soil samples. The assay chosen quantified the abundance of Vibrio alginolyticus with gyrB as the gene target (Zhou et al., 2007), and no added DNA from collected soil samples inhibited the reaction. Quality control qPCR was conducted on a Bio-Rad CFX96 Touch Real-Time PCR Detection System (Bio-Rad Laboratories, Inc., Hercules, CA, United States). Non quality control qPCR was conducted using an Eppendorf Mastercycler epgradient realplex2 (Eppendorf North America, Hauppauge, NY, United States) with the programs outlined in Table 1. Each program begins with a denaturing step at 95°C with the 16S and nosZ clade I running for 15 min and the nosZ clade II running for 5 min. Both the 16S and clade II programs run for 40 cycles while the clade I program is a touchdown program from 67 to 62°C where it then runs for 40 cycles at 62°C.
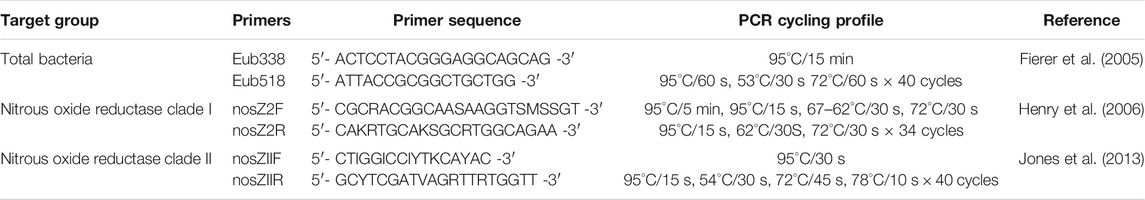
TABLE 1. Quantitative polymerase chain reaction (qPCR) primers and cycling profiles for total bacterial abundance and nitrous oxide reductase clade I and II.
Sequences of nosZ Clade II were amplified with the primers listed in Table 1 and determined with a Pac-Bio Sequel (MR DNA, Shallowater, TX) due to the length of the nosZ clade II gene (∼700 bp). Sequence depth was about 5,000 sequences per sample. Sequences were trimmed with cutadapt (Martin, 2011), and denoised and dereplicated using DADA2 in R (Callahan et al., 2016; Callahan et al., 2019). Sequences were then uploaded to qiime2 (Bolyen et al., 2019) and low abundance sequences were removed prior to analysis (minimum five sequence occurrence and present in at least two samples). Downstream analysis was conducted in qiime2 including taxonomic classification using a Naïve Bayes classifier trained on about 5,000 nosZ sequences from both the National Center for Biotechnology Information (NCBI) database and the FunGene repository (Fish et al., 2013). Reference sequence taxonomy was downloaded from NCBI via the Entrez Direct module (Kans, 2020) and annotated to emulate the 16S Greengenes taxonomy file. Bray-Curtis dissimilarity PCoA plots were constructed in R with ggplot2 (Wickham, 2016). The eight most abundant amplicon sequence variants (ASVs) were chosen for further analysis where each ASV individually represented at least 2% of the total number of sequences (27,408 total sequences) and together amounted to approximately 40% of the total sequence count. These eight abundant ASVs were chosen for Basic Local Alignment Search Tool (BLAST).
2.5 Statistical Analyses
Data was analyzed using Proc GLIMMIX at a significance level of α = 0.1 for soil N concentrations, N2O emissions, and microbial analysis using SAS version 9.4 (SAS Institute Inc., Cary, NC). Statistical analysis of N2O flux rate determined a year interaction effect with N treatment (p = 0.015), so data was analyzed within year. In addition, an interaction of season (fall/winter, spring, and summer) and N treatment was determined for N2O flux rate in 2016 (p = 0.003), so data was analyzed within season for both years of the study. Analysis of cumulative emissions was conducted for emissions occurring between cover crop termination (April 13, 2016, April 20, 2017) through cotton harvest (November 14, 2016 and November 15, 2017) for each year of the study due to a significant year interaction with N treatment (p = 0.025). Soil inorganic N analysis was conducted for the 0–15 cm depth, and a year interaction with N treatment was determined (p < 0.001) so NO3−-N and NH4+-N were analyzed within year. For all analysis of variances, main-plot treatments (NTW, NT, CT) as well as split-plot treatments (control, PP, MS, SPLIT, STB) were treated as fixed effects and replication and replication by conservation system was treated as a random effect. Fisher’s protected LSD was used to separate means of significant effects at α = 0.1, unless otherwise stated. Correlation analysis was conducted using Pearson’s correlation, proc CORR, and regression analysis, proc RSREG and proc REG (SAS, 2013) for determination of any correlation or relationship between soil chemical (N concentrations), biological (microbial abundance and diversity), cover crop biomass, and N2O-N flux rates and cumulative emissions. Bray-Curtis dissimilarity was determined in qiime2 (Bolyen et al., 2019); principal coordinates analysis plots were conducted in R with ggplot2 (Wickham, 2016); PERMANOVA and PERMDISP were conducted in R with the vegan package (Oksanen et al., 2019). Average sequence abundance within treatment for the eight most abundant features was calculated across both years due to no significant interactions of sequence percentage within year (p < 0.05).
2.6 Accession Numbers
Demultiplexed, dereplicated, and denoised sequences were uploaded to the Sequence Read Archive (SRA) database under the accession number: PRJNA612879.
3 Results
3.1 Climatic Conditions
The climatic conditions collected in 2016 were more typical for the SHP, with average temperatures of 29°C and 25°C in July and August, respectively, and cooling off to an average temperature of 12°C in November. Monthly precipitations of about 93 and 77 mm occurred in May and August, respectively. Monthly precipitation in 2017 did not reach greater than 35 mm until June, although monthly precipitation was about 148 mm in July and 123 mm in August. Average temperature in May 2017 was about 21°C, but with a maximum temperature of about 39°C, which was greater than the maximum temperature in August 2016. The hot start to the 2017 growing season continued into June where the average temperature was about 27°C, with a maximum temperature of about 44°C. July 2017 had a similar average temperature as June 2017, although the maximum temperature reached was only about 38°C (Figure 1).
3.2 Soil Mineral N Content
Conservation system did not affect NO3−-N or NH4+-N concentrations in 2016 at the 0–15 cm depth (Supplementary Table S2). Conservation system affected NO3−-N concentrations in 2017 (p = 0.089), with the NTW system having lower concentrations than the CT systems at 0–15 cm. Nitrogen treatment affected NO3−-N concentrations in 2016 (p = 0.002) and 2017 (p = 0.002) with concentrations for the PP, SPLIT, and STB treatments being greater than the MS treatment and the control in 2016. In 2017, the PP treatment had greater concentrations of NO3−-N than the MS and SPLIT treatments and the control, with the STB treatment also having greater NO3−-N than the MS treatment and the control. The interaction of conservation system and N treatment also affected NO3−-N concentrations in 2017 (p = 0.021; Table 2). Main plot and split-plot differences were not determined for in-season NH4+-N levels in either year (Supplementary Table S2). Many of the samples contained NH4+-N concentration lower than the detectable limit, which may have led to the lack of differences present within either year (analysis included a zero standard and thus zero values for NH4+ were treated as zero in statistical analysis). However, there was an interaction effect on NH4+-N concentrations in 2017 (p = 0.078; Table 2). Total inorganic N (Ninorg) was calculated as the sum of NO3−-N and NH4+-N. No differences in Ninorg were determined for main plot, or the interaction in 2016 (Supplementary Table S2). In both 2016 and 2017, both N treatment significantly affected Ninorg (p = 0.005, p = 0.003, respectively), with the PP and STB treatments having greater Ninorg concentrations than the MS treatment and the control in both years. The interaction of conservation system and N treatment affected Ninorg concentrations in 2017 (p = 0.013; Table 2).
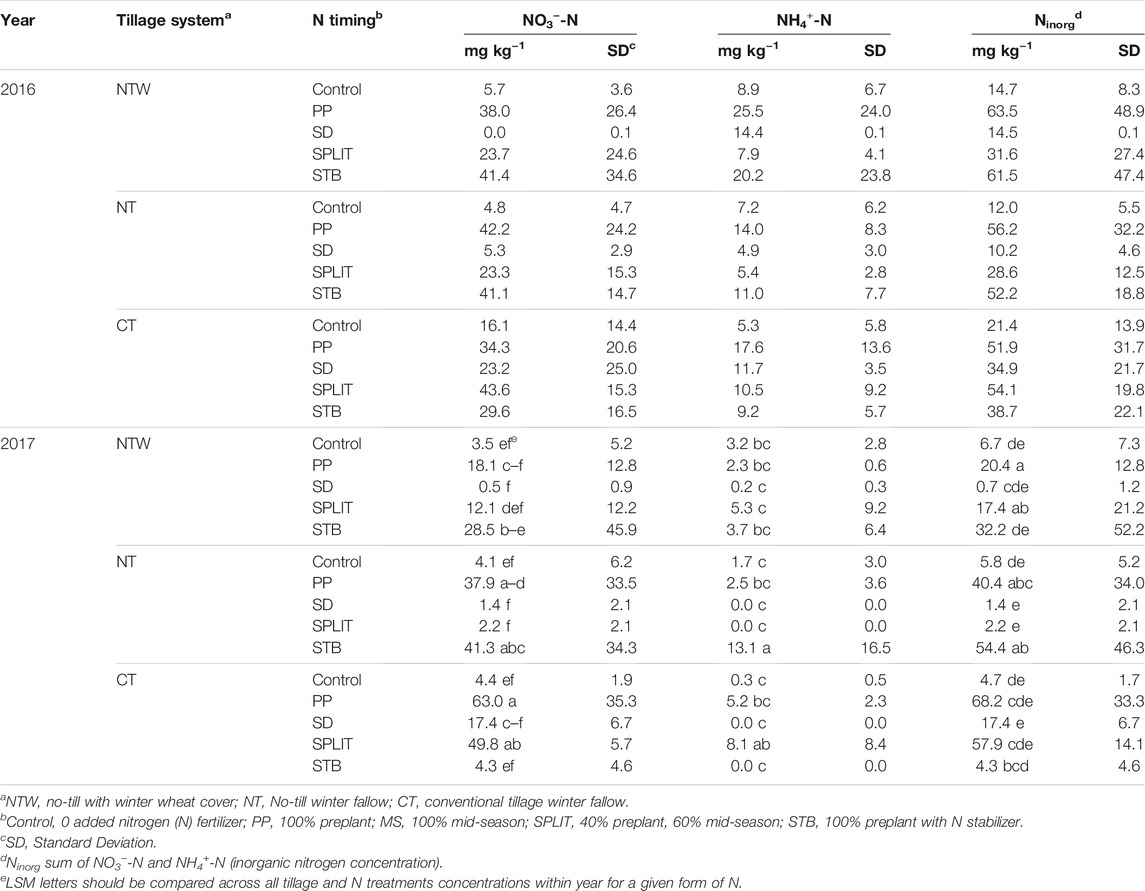
TABLE 2. Nitrate-N (NO3−-N) and ammonium-N (NH4+-N) concentrations (0–15 cm depth) prior to mid-season (MS) N fertilizer application.
3.3 Microbial Abundance
Abundance of 16S genes in the 0–15 cm depth of soil was not affected by year interactions with conservation system, N treatment, or the interaction of conservation system and N treatment, and thus years were combined for further analysis. Conservation system (p = 0.932), N treatment (p = 0.608), and interaction effects (p = 0.917) were not significant when years were averaged. The abundance of 16S gene copies was also analyzed by year due to significant year effects determined for other measured parameters. There was no difference in 16S gene abundance due to conservation system, N treatment, or their interaction in 2016 (Supplementary Table S3). In 2017, there were also no conservation system or interaction effects (Supplementary Table S3), although N treatment did affect 16S abundance (p = 0.004). The control treatment (5.43*108) was determined to have a greater 16S abundance than the SPLIT (4.21*108) and PP treatments (3.98*108) in 2017, as well as the MS treatment (5.12*108) having a greater abundance than the PP treatment. Clade I abundance was not affected by N treatment, conservation system, or the interaction of N treatment and conservation system (Supplementary Table S3). Clade II was affected by the interaction of conservation system and N treatment in 2017 (p = 0.081; Table 3), but not conservation system or N treatment (Supplementary Table S3).
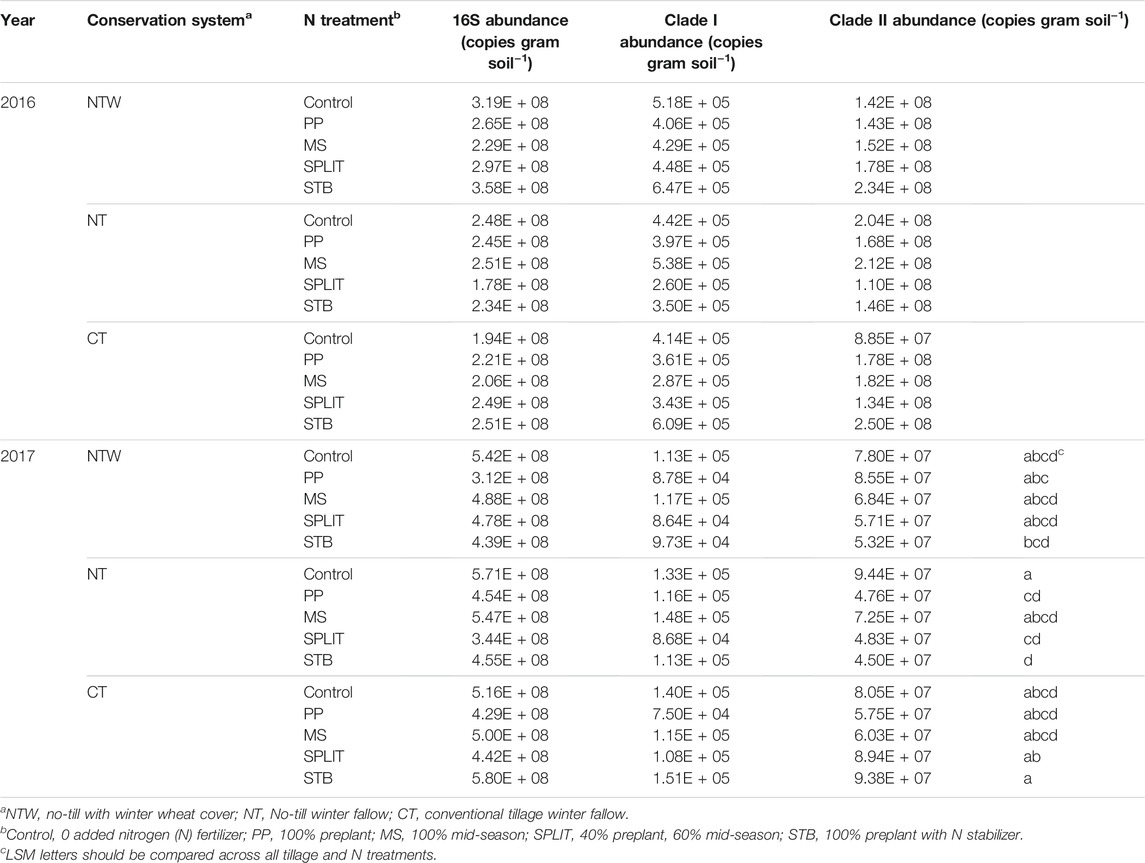
TABLE 3. Total bacteria, nosZ clade I, and nosZ clade II abundance in 2016 and 2017.
With no main plot or split plot effects determined within each year, except for the interaction effect on clade II abundance in 2017, N2O reducing population abundance was summarized across treatments. Clade I abundance in 2016 and 2017 was about 3.950 × 10⁵ and 1.12 × 10⁵ gene copies g soil−1, respectively. Clade II abundance in 2016 was about 1.68 × 10⁸ and 6.88 × 10⁷ gene copies g soil −1 in 2017 (Figure 2). The relative abundance of clade I was about 0.16% 16S abundance in 2016 and about 0.02% 16S abundance in 2017. The relative abundance of clade II was about 67% of the 16 S abundance in 2016 and 14% of 16S abundance in 2017. No correlations were detected between microbial abundance and soil N concentrations (α = 0.05; Supplementary Table S4).
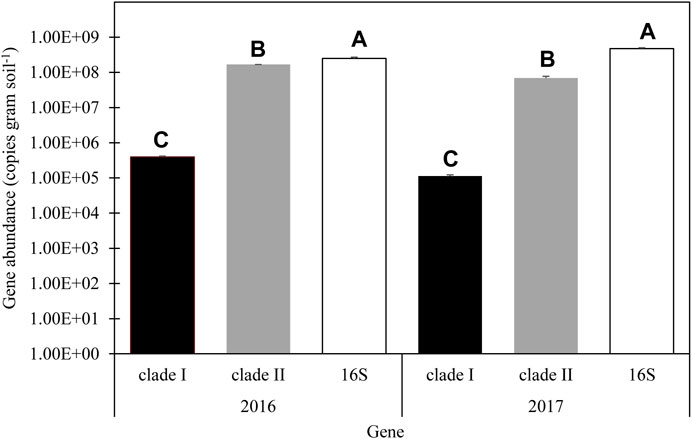
FIGURE 2. Average abundance of nosZ clade I clade II and 16S in 2016 and 2017. Error bars represent standard error. LSM letters are different within year at p < 0.05.
3.4 Microbial Diversity
Due to the much larger abundance of clade II compared to clade I organisms present, sequence analysis of nosZ clade II was conducted on a subset of the in-season samples for 2016 and 2017. The subset included the PP treatment and the control from the CT and NTW systems, which were selected for the greatest potential differences and most common agronomic practices. All three replicates of each combination were sequenced for a total of 24 samples. It was determined that alpha diversity was not affected by conservation system or N treatment (data not shown).
No differences in distance within groups were determined to be significant, so PERMANOVA was conducted to evaluate Bray-Curtis dissimilarity. It was determined that no factors (Year, Tillage, Treatment) or their interactions affected dissimilarity of the microbial communities (α = 0.05; Table 4). Furthermore, dissimilarity was analyzed with principal coordinates analysis and no distinct clustering occurred with treatment and tillage combinations over the 2 years (Figure 3), clustering occurs with similar values of dissimilarity, meaning a treatment with similar dissimilarity (across replication) compared to the rest of the treatments would be more tightly clustered. The principal coordinates axes combined to explain 35% of the variability within the data (PC1: 22%, PC2: 13%; Figure 3).
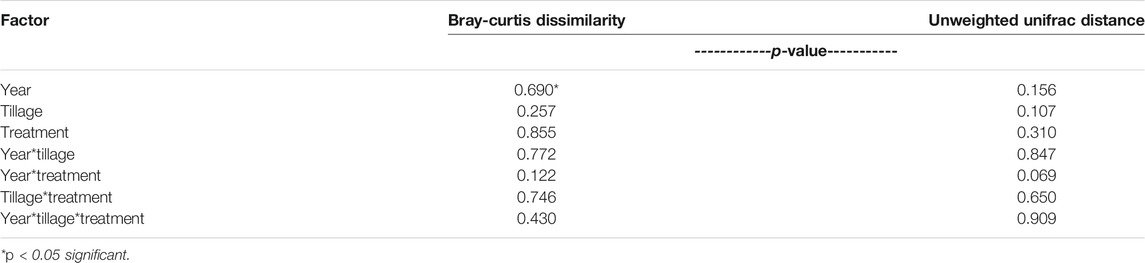
TABLE 4. PERMANOVA results for Bray-Curtis dissimilarity and unweighted unifrac distance.
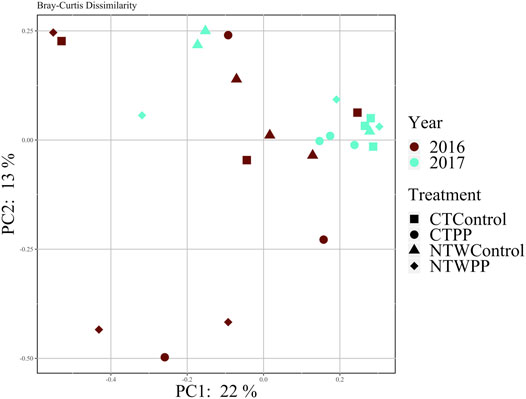
FIGURE 3. Bray-Curtis dissimilarity of microbial communities in 2016 and 2017. CT, conventional tillage; NTW, no-tillage with winter wheat cover crop; PP, pre-plant N application; Control, no-added N fertilizer.
Classification of ASVs with the NCBI and FunGene databases resulted in few sequences having deeper classification than domain. In general, there is less taxonomic information for functional genes such as nosZ clade II, leading to many of the samples being classified as “environmental samples,” pointing to similar sequences within the databases that have yet to be classified. The most closely related taxonomically defined matches (≥75% match over >90% of the feature length, or closest match <75%) are reported for each of the eight most abundant ASVs (Supplementary Table S5) to provide some insight into the microbial identity (Table 5). No year, treatment, tillage, or interaction effects were determined for the treatment abundance of any ASV (α = 0.05).
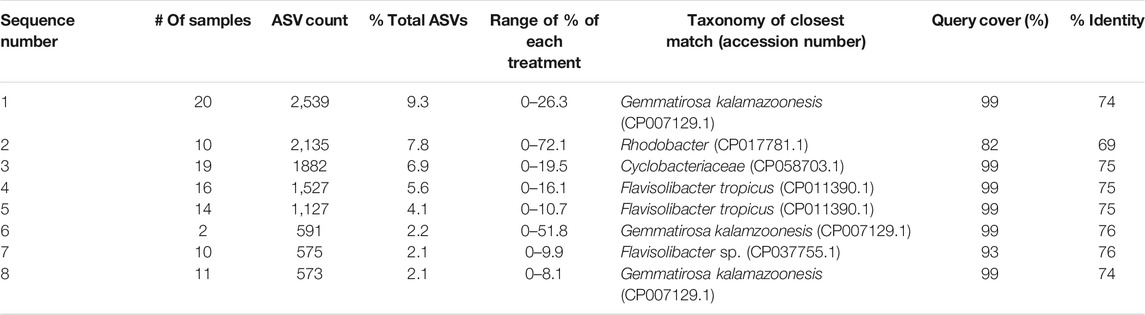
TABLE 5. Abundance of dominant amplicon sequence variants (ASV) and closest taxonomic match.
3.5 Nitrous Oxide Flux Rates
Nitrous oxide emissions were analyzed within season for each year of the study. No differences were found between conservation systems, N treatments, or their interactions for the Spring, and Fall seasons in both years of the study (Supplementary Table S6). However, N2O-N flux was affected by N treatment in the Summer of 2016 (p = 0.013) and 2017 (p = 0.076) with all the N treatments having a greater flux than the control in Summer 2016 (Figure 4A) and all N treatments except the PP treatment having a greater flux than the control in Summer 2017 (Figure 4B). Negative fluxes and no N2O flux were determined in the MS treatment and the control, respectively, in the spring of 2016 (Figure 4A). Nitrous oxide consumption was also recorded in the Fall/Winter of both years for all treatments with the exception of the PP treatment in 2017 (Figures 4A,B). No correlation between 16S, clade I, or clade II abundance, and summer N2O flux rate was determined (α = 0.05).
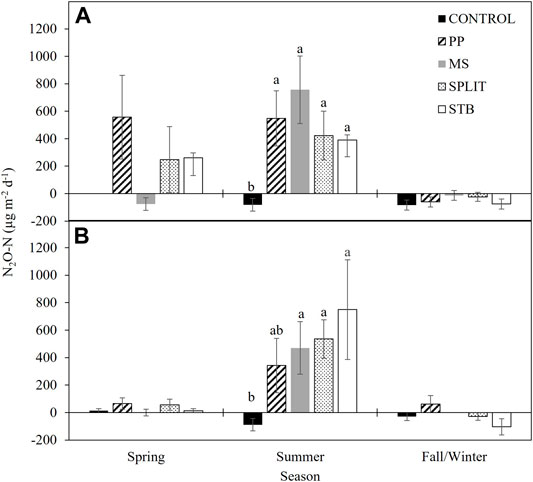
FIGURE 4. Nitrous oxide emissions in (A) 2016 and (B) 2017 averaged by season. PP, pre-plant nitrogen (N) fertilizer application; MS, mid-season N fertilizer application (applied at pinhead square); SPLIT, 40% PP 60% MS N fertilizer application; STB, 100% PP application with N stabilizer product. Spring, April—May; Summer, June—September; Fall/Winter, October—March. Seasonal treatment means with the same letter are not different at α = 0.1. Error bars are standard error.
3.6 Cumulative Emissions
Nitrogen treatment impacted average growing season cumulative emissions in 2016 with the N treatments producing a greater average cumulative flux than the control (p = 0.027; Figure 5). The control had net negative cumulative emissions of N2O-N in both years of the study (Figure 5). Although not statistically different, cumulative emissions were lower for the STB treatment in 2016. No conservation system or conservation system and N treatment interaction effects were determined in either year of the study (Supplementary Table S7). In 2017, N treatment did not affect cumulative N2O-N emissions. Emissions during the second year of the study were greatly increased in the STB treatment compared to the first year while the rest of the N treatments were slightly reduced.
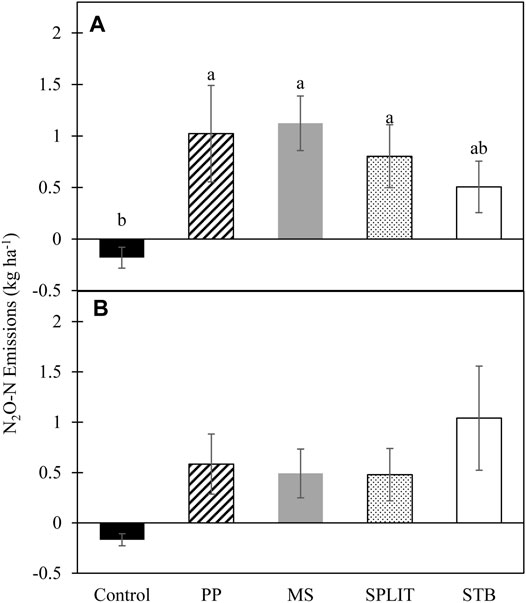
FIGURE 5. Average cumulative N2O-N emissions from cover crop termination to cotton harvest in (A) 2016 and (B) 2017. LSM letters are different at p < 0.05, error bars represent standard error. PP, pre-plant nitrogen (N) fertilizer application; MS, mid-season N fertilizer application (applied at pinhead square); SPLIT, 40% PP 60% MS N fertilizer application; STB, 100% PP application with N stabilizer product.
4 Discussion
Results of this study indicate that altering the timing of N fertilizer application will affect the microbial community, which may alter N2O emissions. In the second year of N treatment implementation, bacterial abundance was reduced for the PP treatment compared to treatments with no N applied prior to sampling, the control and MS treatment. In addition, the SPLIT treatment had reduced bacterial abundance compared to the control. Both of these observations indicate potentially deleterious effects of high rates of N fertilizer application on overall bacterial abundance on the SHP, although other research suggests the deleterious effect of N fertilizer application may be less pronounced in agricultural systems where application is more common (Geisseler and Scow, 2014).
The reduction in the overall bacteria population due to N treatment did not translate to the N2O reducing community, but the interaction of N treatment and conservation system did affect clade II abundance in the second year of the study (Table 3). In addition, it was clear that clade II greatly outnumbered clade I, indicating that N2O reduction potential lies mostly within the more diverse, abundant, and efficient form of N2O reductase (Sanford et al., 2012). Previous research supports greater clade II abundance in soil (Sanford et al., 2012; Jones et al., 2013; Domeignoz-Horta et al., 2015), with clade II being associated with a lifestyle strategy involving the survival of anoxic conditions in a more energetically favorable way (Lycus et al., 2018). In agricultural soil, oxygen concentrations may change rapidly due to precipitation or irrigation events, as well as pore space O2 concentrations changing due to soil respiration so a more efficient survival mechanism such as clade II activation is helpful. Although there are no clear patterns across the entire study related to conservation system and N treatment, the most apparent differences in clade II abundance were within the NT system in 2017 where nutrient stratification and low soil C would both be expected. Where N fertilizer was applied before the season (PP, SPLIT, STB) clade II abundance was reduced and where N was not applied for at least one full year, clade II abundance was increased (MS, control). Previous research indicates that N2O consumption can be enhanced during periods of low soil inorganic N (Butterbach-Bahl et al., 1998; Rosenkranz et al., 2006; Kroeze et al., 2007) and thus would be expected for the control and MS treatment. Nitrous oxide consumption would thus likely be driven by clade II microbes in N limited environments. Nitrate can act as a proximal control over N2O consumption where high concentrations can negatively affect the production of the N2OR enzyme through competition for electrons (Highton et al., 2020). This was observed in the PP and STB treatments in 2017, where increased soil NO3−-N due to pre-season application acted as a distal control, reducing the N2O consuming population at the time of sampling (Table 2). A similar but less distinct pattern was present for the CT system, while in the NTW system there was no apparent pattern (Table 2). The lack of a pattern in the NTW system could be due to several biological and physical phenomena including overall reduced soil inorganic N prior to the start of the season due to wheat cover crop use of residual soil N (Lyons et al., 2017). This would likely enhance the N2O reducing population over the winter and may conceal any effects on clade II abundance in-season and will likely increase as the system matures and selects for a specific microbial community. The NTW system also encourages water infiltration, soil aeration, and soil C resources, all of which would have differential effects on anaerobic microbial processes further complicating any patterns within that system. Wang et al. (2021) determined greater clade II abundance with long term conservation tillage practices likely leading to greater moderation of N2O emission within those systems, supporting previous determinations of conservation practice effects on N2O emissions in systems in place for ≥10 years (Kessel et al., 2013). The increased population of clade II organisms with conservation tillage was not determined in this study, nor were N2O reductions for conservation practices determined. However, this study comprised the first 2 years of conservation practice implementation for the research site and it is likely that as these systems mature similar patterns will emerge. Abundance of nosZ clade I genes was correlated with the amount of aboveground wheat cover crop biomass (data not shown) produced in the NTW system during this study (p = 0.005; McDonald et al., 2019), where clade I abundance linearly increased with increasing wheat biomass (p = 0.0025, r2 = 0.56). However, there was no relationship between nosZ clade II abundance and wheat biomass (p = 0.100). The correlation between clade I abundance and wheat biomass was expected, as greater wheat residue would increase conditions favorable for denitrification, selecting for more typical, complete, denitrifiers such as those associated with nosZ clade I.
To further elucidate any patterns in potential N2O consumption, sequence analysis was conducted for a subset of the conservation system and N treatments within both years of the study. The subset included the PP treatment and the control from the CT and NTW systems, which were selected for the greatest potential differences and most common agronomic practices. Although no year, N treatment, conservation system, or interaction effects were determined for Bray-Curtis dissimilarity (Supplementary Table S5), there is clearly some clustering of treatment and tillage combinations in the second year of the study (Figure 3), indicating potential development of unique N2O reducing communities as also indicated with the significant conservation system and N treatment interaction for clade II abundance in the second year. In a previous study, homologs of nosZ were found in 12% of sequenced bacterial genomes (Graf et al., 2014), and while no significant classifications could be made from nosZ sequences alone in our study, the individual query of the most abundant features allowed for some taxonomic evaluations to be made from fully sequenced soil microbial genomes. These classifications included Gemmatimonadetes which are the most abundant N2O reducers in soil (Jones et al., 2013) and a common soil bacteria. The association of such common soil bacteria with N2O reduction speaks to the ubiquitous and environmentally relevant nature of N2O reduction in soil, and further supports potential for the soil to act as an N2O consumer even in semi-arid agricultural systems.
With the potential for N2O consumption being observed in this study, N2O emissions were measured throughout 2016 and 2017 (Figures 4A,B). Negative fluxes of N2O were determined during the fall/winter of both years of the study and are likely due to low levels of NO3−-N present in the soil (Ryden, 1981; Minami, 1997; Butterbach-Bahl et al., 1998; Rosenkranz et al., 2006; Kroeze et al., 2007) and an abundant clade II population. In the spring of 2016 (Figure 4A) N2O consumption was also determined for the MS treatment which had not yet received N fertilizer during the study period. Treatments with N fertilizer application increased N2O emissions in Spring 2016. Increased emissions of N2O are often associated with greater levels of NO3−-N (Minami, 1997; Butterbach-Bahl et al., 1998; Kroeze et al., 2007; Mania et al., 2014; Mania et al.,2016) which can negatively impact the formation of the N2O reducing enzymes (Highton et al., 2020). Similar assumptions can be made regarding the negative and zero fluxes of N2O-N in the fall/winter of 2016 and 2017 (Figures 4A,B), where low levels of NO3−-N would be present due to plant and microbial use of available soil N throughout the growing season. There is a significant increase in N2O-N emissions during the summer season (Figures 4A,B) which can be attributed to several factors including: increased temperature and moisture, increased plant and microbial activity, and the application of N fertilizer (Ryden, 1981; Dobbie et al., 1999; Barnard et al., 2005; McSwiney and Robertson, 2005; Shelton et al., 2017). However, where N was not applied in the control, net consumption of N2O-N was determined, further supporting the association of N2O consumption in low inorganic N environments and providing evidence of an active N2O reducing community where clade II organisms play a significant role. After 1 year of treatment implementation, N2O-N flux rates were reduced during the spring (Figure 4B), which may be attributed to reduced NO3−-N concentrations, and thus increased N2OR activity. Monthly measurements were used for evaluation of treatment differences across the cotton growing season. Recent studies have reported the potential for under or over estimation of total N2O emissions with less frequent measurements (Su et al., 2021), however our reported seasonal average emissions compare favorably with N2O fluxes measured under similar climatic conditions (Ryden, 1981; Shelton et al., 2017; Domeignoz-Horta et al., 2018), although they were lower compared to emissions from wetter climates (Chantigny et al., 2010; Domeignoz-Horta et al., 2018). When the rate of N2O consumption was compared, it was similar to previously reported rates in varied study areas indicating a functionally ubiquitous N2O consuming population in soil regardless of environment.
Cumulative emissions were calculated based upon monthly measurements of N2O emissions and were positive for all treatments with N fertilizer application (Figure 5). However, the control resulted in net negative emissions over the 2-year study. The negative emissions recorded are likely the result of inorganic N loss (plant uptake, microbial use, leaching, etc.) from the system without significant replacement (Butterbach-Bahl et al., 1998; Rosenkranz et al., 2006; Kroeze et al., 2007) combined with selection for a N2O consuming population by both the soil chemical and physical characteristics. The calculation of cumulative emissions was conducted to estimate treatment effects on yearly N2O emissions to determine potential best practices based on the data available. The total number of treatments evaluated for N2O fluxes included 15 unique combinations of conservation systems and N treatments which required various field operations throughout the growing season to maintain production-level field conditions and thus installation of long-term chambers and stationary gas analysis was not feasible for a study of this size and scale. However, cumulative emissions produced from this study were comparable to those from other studies in semi-arid and sub-humid regions (Dong et al., 2018) although total emissions were potentially underestimated due to the inability to measure emissions following precipitation or irrigation events.
Although no definitive relationships can be observed between recorded N2O emissions and the abundance of N2O reducing genes, it is clear that the treatments implemented here affect the pattern of N2O emissions through alterations to the soil biological and chemical composition even within the first few years of implementation. It will thus be important to continue this research as the system matures to observe these expected changes and better elucidate how conservation system and N timing affect N2O emissions in semi-arid agricultural systems. Understanding the mechanisms behind these changes in emissions, specifically the consumption of N2O, will aid in the choosing of best management practices for reducing N2O emissions in expanding semi-arid areas and potentially provide practices suited for net N2O consumption.
5 Conclusion
Changes in N fertilizer management can alter the microbial community and change the rate at which N2O gas is produced or consumed within semi-arid agricultural soils. The microbial community measured in this study contained an abundant nosZ clade II N2O reducing population that is likely the driver for N2O consumption. The mechanisms behind the population shift are still being determined, but after 2 years of treatment implementation distinct communities appear to be forming which may further alter N2O consumption and production. Based on the results from this study, it is likely that a N treatment and conservation practice best suited for mitigating N2O will emerge as the system matures.
Data Availability Statement
The datasets presented in this study can be found in online repositories. The names of the repository/repositories and accession number(s) can be found below: NCBI [accession: PRJNA612879].
Author Contributions
MM: data acquisition, data interpretation, and writing of the article. KL: conception and design, data interpretation, and writing of the article. PD, TB, and JR: writing of the article. TG: data interpretation and writing of the article. All authors contributed to the article and approved the submitted version.
Funding
Funding for this research was provided through the Texas A&M AgriLife Research Air Quality Initiative.
Conflict of Interest
Author JR was employed by the company BASF Corporation.
The remaining authors declare that the research was conducted in the absence of any commercial or financial relationships that could be construed as a potential conflict of interest.
Publisher’s Note
All claims expressed in this article are solely those of the authors and do not necessarily represent those of their affiliated organizations, or those of the publisher, the editors and the reviewers. Any product that may be evaluated in this article, or claim that may be made by its manufacturer, is not guaranteed or endorsed by the publisher.
Supplementary Material
The Supplementary Material for this article can be found online at: https://www.frontiersin.org/articles/10.3389/fenvs.2021.702806/full#supplementary-material
References
Barnard, R., Leadley, P. W., and Hungate, B. A. (2005). Global Change, Nitrification, and Denitrification: A Review. Glob. Biogeochem. Cycles 19 (1). doi:10.1029/2004gb002282
Barton, L., Kiese, R., Gatter, D., Butterbach-Bahl, K., Buck, R., Hinz, C., et al. (2008). Nitrous Oxide Emissions from a Cropped Soil in a Semi-arid Climate. Glob. Change Biol. 14, 177–192. doi:10.1111/j.1365-2486.2007.01474.x
Bremner, J. M. (1997). Sources of Nitrous Oxide in Soils. Nutrient Cycling in Agroecosystems 49, 7–16. doi:10.1023/a:1009798022569
Betlach, M. R., and Tiedje, J. M. (1981). Kinetic Explanation for Accumulation of Nitrite, Nitric Oxide, and Nitrous Oxide during Bacterial Denitrification. Appl. Environ. Microbiol. 42, 1074–1084. doi:10.1128/aem.42.6.1074-1084.1981
Bolyen, E., Rideout, J. R., Dillon, M. R., Bokulich, N. A., Abnet, C. C., Al-Ghalith, G. A., et al. (2019). Reproducible, Interactive, Scalable and Extensible Microbiome Data Science Using QIIME 2. Nat. Biotechnol. 37, 852–857. doi:10.1038/s41587-019-0209-9
Butterbach-Bahl, K., Baggs, E. M., Dannenmann, M., Kiese, R., and Zechmeister-Boltenstern, S. (2013). Nitrous Oxide Emissions from Soils: How Well Do We Understand the Processes and Their Controls?. Phil. Trans. R. Soc. B 368, 20130122. doi:10.1098/rstb.2013.0122
Butterbach-Bahl, K., Gasche, R., Huber, C., Kreutzer, K., and Papen, H. (1998). Impact of N-Input by Wet Deposition on N-Trace Gas Fluxes and CH4-Oxidation in spruce forest Ecosystems of the Temperate Zone in Europe. Atmos. Environ. 32, 559–564. doi:10.1016/s1352-2310(97)00234-3
Callahan, B. J., Mcmurdie, P. J., Rosen, M. J., Han, A. W., Johnson, A. J. A., and Holmes, S. P. (2016). DADA2: High-Resolution Sample Inference from Illumina Amplicon Data. Nat. Methods 13, 581–583. doi:10.1038/nmeth.3869
Callahan, B. J., Wong, J., Heiner, C., Oh, S., Theriot, C. M., Gulati, A. S., et al. (2019). High-throughput Amplicon Sequencing of the Full-Length 16S rRNA Gene with Single-Nucleotide Resolution. Nucleic Acids Res. 47, e103. doi:10.1093/nar/gkz569
Caranto, J. D., and Lancaster, K. M. (2017). Nitric Oxide Is an Obligate Bacterial Nitrification Intermediate Produced by Hydroxylamine Oxidoreductase. Proc. Natl. Acad. Sci. USA 114, 8217–8222. doi:10.1073/pnas.1704504114
Chantigny, M. H., Rochette, P., Angers, D. A., Bittman, S., Buckley, K., Massé, D., et al. (2010). Soil Nitrous Oxide Emissions Following Band-Incorporation of Fertilizer Nitrogen and Swine Manure. J. Environ. Qual. 39, 1545–1553. doi:10.2134/jeq2009.0482
Chapuis-Lardy, L., Wrage, N., Metay, A., Chotte, J.-L., and Bernoux, M. (2007). Soils, a Sink for N2O? A Review. Glob. Change Biol 13, 1–17. doi:10.1111/j.1365-2486.2006.01280.x
Dobbie, K. E., Mctaggart, I. P., and Smith, K. A. (1999). Nitrous Oxide Emissions from Intensive Agricultural Systems: Variations between Crops and Seasons, Key Driving Variables, and Mean Emission Factors. J. Geophys. Res. 104, 26891–26899. doi:10.1029/1999jd900378
Domeignoz-Horta, L. A., Philippot, L., Peyrard, C., Bru, D., Breuil, M.-C., Bizouard, F., et al. (2018). Peaks of In Situ N2 O Emissions Are Influenced by N2 O-Producing and Reducing Microbial Communities across Arable Soils. Glob. Change Biol. 24, 360–370. doi:10.1111/gcb.13853
Domeignoz-Horta, L. A., Spor, A., Bru, D., Breuil, M.-C., Bizouard, F., Léonard, J., et al. (2015). The Diversity of the N2O Reducers Matters for the N2O:N2 Denitrification End-Product Ratio across an Annual and a Perennial Cropping System. Front. Microbiol. 6, 971. doi:10.3389/fmicb.2015.00971
Dong, D., Kou, Y., Yang, W., Chen, G., and Xu, H. (2018). Effects of Urease and Nitrification Inhibitors on Nitrous Oxide Emissions and Nitrifying/denitrifying Microbial Communities in a Rainfed maize Soil: A 6-year Field Observation. Soil Tillage Res. 180, 82–90. doi:10.1016/j.still.2018.02.010
EPA (2020). Inventory of US Greenhouse Gas Emissions and Sinks: 1990–2018. US Environmental Protection Agency.
Fentabil, M. M., Nichol, C. F., Jones, M. D., Neilsen, G. H., Neilsen, D., and Hannam, K. D. (2016). Effect of Drip Irrigation Frequency, Nitrogen Rate and Mulching on Nitrous Oxide Emissions in a Semi-arid Climate: An Assessment across Two Years in an Apple Orchard. Agric. Ecosyst. Environ. 235, 242–252. doi:10.1016/j.agee.2016.09.033
Fierer, N., Jackson, J. A., Vilgalys, R., and Jackson, R. B. (2005). Assessment of Soil Microbial Community Structure by Use of Taxon-specific Quantitative PCR Assays. Appl. Environ. Microbiol. 71, 4117–4120. doi:10.1128/aem.71.7.4117-4120.2005
Firestone, M. K., and Davidson, E. A. (1989). “Microbiological Basis of NO and N2O Production and Consumption in Soil,” in Exchange of Trace Gases between Terrestrial Ecosystems and the Atmosphere. Editors M.O. AndreaeD.S. Schimel (Chichester, U.K.: John Wiley & Sons), 7–21.
Fish, J. A., Chai, B., Wang, Q., Sun, Y., Brown, C. T., Tiedje, J. M., et al. (2013). FunGene: the Functional Gene Pipeline and Repository. Front. Microbiol. 4, 291. doi:10.3389/fmicb.2013.00291
Geisseler, D., and Scow, K. M. (2014). Long-term Effects of mineral Fertilizers on Soil Microorganisms - A Review. Soil Biol. Biochem. 75, 54–63. doi:10.1016/j.soilbio.2014.03.023
Graf, D. R. H., Jones, C. M., and Hallin, S. (2014). Intergenomic Comparisons Highlight Modularity of the Denitrification Pathway and Underpin the Importance of Community Structure for N2O Emissions. PLOS ONE 9, e114118. doi:10.1371/journal.pone.0114118
Griffis, T. J., Chen, Z., Baker, J. M., Wood, J. D., Millet, D. B., Lee, X., et al. (2017). Nitrous Oxide Emissions Are Enhanced in a Warmer and Wetter World. Proc. Natl. Acad. Sci. USA 114, 12081–12085. doi:10.1073/pnas.1704552114
Hallin, S., Philippot, L., Löffler, F. E., Sanford, R. A., and Jones, C. M. (2018). Genomics and Ecology of Novel N2O-Reducing Microorganisms. Trends Microbiol. 26, 43–55. doi:10.1016/j.tim.2017.07.003
Halvorson, A. D., Del Grosso, S. J., and Reule, C. A. (2008). Nitrogen, Tillage, and Crop Rotation Effects on Nitrous Oxide Emissions from Irrigated Cropping Systems. J. Environ. Qual. 37, 1337–1344. doi:10.2134/jeq2007.0268
Hartman, L. J., Coyne, S. R., and Norwood, D. A. (2005). Development of a Novel Internal Positive Control for Taqman Based Assays. Mol. Cell Probes 19, 51–59. doi:10.1016/j.mcp.2004.07.006
Henry, S., Baudoin, E., López-Gutiérrez, J. C., Martin-Laurent, F., Brauman, A., and Philippot, L. (2004). Quantification of Denitrifying Bacteria in Soils by nirK Gene Targeted Real-Time PCR. J. Microbiol. Methods 59, 327–335. doi:10.1016/j.mimet.2004.07.002
Higgins, S. A., Welsh, A., Orellana, L. H., Konstantinidis, K. T., Chee-Sanford, J. C., Sanford, R. A., et al. (2016). Detection and Diversity of Fungal Nitric Oxide Reductase Genes ( P450nor ) in Agricultural Soils. Appl. Environ. Microbiol. 82, 2919–2928. doi:10.1128/aem.00243-16
Highton, M. P., Bakken, L. R., Dörsch, P., Wakelin, S., De Klein, C. A. M., Molstad, L., et al. (2020). Soil N2O Emission Potential Falls along a Denitrification Phenotype Gradient Linked to Differences in Microbiome, Rainfall and Carbon Availability. Soil Biol. Biochem. 150, 108004. doi:10.1016/j.soilbio.2020.108004
IPCC (2007). in Climate Change 2007: The Physical Science Basis. Contribution of Working Group I to the Fourth Assessment Report of the Intergovernmental Panel on Climate Change. Editors S. Solomon, D. Qin, M. Manning, Z. Chen, M. Marquis, K. B. Averytet al. (United Kingdom and New York, NY, USA: Cambridge University Press).
Jones, C. M., Graf, D. R., Bru, D., Philippot, L., and Hallin, S. (2013). The Unaccounted yet Abundant Nitrous Oxide-Reducing Microbial Community: a Potential Nitrous Oxide Sink. Isme J. 7, 417–426. doi:10.1038/ismej.2012.125
Jones, C. M., Spor, A., Brennan, F. P., Breuil, M.-C., Bru, D., Lemanceau, P., et al. (2014). Recently Identified Microbial Guild Mediates Soil N2O Sink Capacity. Nature Climate Change 4, 801–805.
Kans, J. (2020). Entrez Direct: E-Utilities on the UNIX Command Line [Online], (Bethesda, MD: National Center for Biotechnology Information (US)). Available at: https://www.ncbi.nlm.nih.gov/books/NBK179288/ (Accessed 2020).
Keeling, W., Segarra, E., and Abernathy, J. R. (1989). Evaluation of Conservation Tillage Cropping Systems for Cotton on the Texas Southern High Plains. J. Prod. Agric. 2, 269–273. doi:10.2134/jpa1989.0269
Keeney, D. R., and Nelson, D. W. (1982). Nitrogen-Inorganic Forms. Methods Soil Analysis. Part. 2. Chem. Microbiol. properties, 643–698. doi:10.2134/agronmonogr9.2.2ed.c33
Kroeze, C., Bouwman, L., and Slomp, C. P. (2007). “Sinks for Nitrous Oxide at the Earth’s Surface,” in Greenhouse Gas Sinks. Editors D. S. Reay, C. N. Hewitt, K. A. Smith, and J. Grace (, 227–242.
Lewis, K. L., Burke, J. A., Keeling, W. S., Mccallister, D. M., Delaune, P. B., and Keeling, J. W. (2018). Soil Benefits and Yield Limitations of Cover Crop Use in Texas High Plains Cotton. Agron. J. 110, 1616–1623. doi:10.2134/agronj2018.02.0092
Linn, D. M., and Doran, J. W. (1984). Effect of Water-Filled Pore Space on Carbon Dioxide and Nitrous Oxide Production in Tilled and Nontilled Soils. Soil Sci. Soc. America J. 48, 1267–1272. doi:10.2136/sssaj1984.03615995004800060013x
Lloyd, D. (1993). Aerobic Denitrification in Soils and Sediments: From Fallacies to Factx. Trends Ecol. Evol. 8, 352–356. doi:10.1016/0169-5347(93)90218-e
Lycus, P., Soriano-Laguna, M. J., Kjos, M., Richardson, D. J., Gates, A. J., Milligan, D. A., et al. (2018). A Bet-Hedging Strategy for Denitrifying Bacteria Curtails Their Release of N2O. Proc. Natl. Acad. Sci. USA 115, 11820–11825. doi:10.1073/pnas.1805000115
Lyons, S. E., Ketterings, Q. M., Godwin, G., Cherney, J. H., Czymmek, K. J., and Kilcer, T. (2017). Early Fall Planting Increases Growth and Nitrogen Uptake of winter Cereals. Agron. J. 109, 795–801. doi:10.2134/agronj2016.10.0620
Malhi, S. S., Lemke, R., Wang, Z. H., and Chhabra, B. S. (2006). Tillage, Nitrogen and Crop Residue Effects on Crop Yield, Nutrient Uptake, Soil Quality, and Greenhouse Gas Emissions. Soil Tillage Res. 90, 171–183. doi:10.1016/j.still.2005.09.001
Mania, D., Heylen, K., Van Spanning, R. J. M., and Frostegård, A., (2016). Regulation of Nitrogen Metabolism in the Nitrate-Ammonifying Soil bacteriumBacillus Viretiand Evidence for its Ability to Grow Using N2O as Electron Acceptor. Environ. Microbiol. 18, 2937–2950. doi:10.1111/1462-2920.13124
Mania, D., Heylen, K., Van Spanning, R. J. M., and Frostegård, A., (2014). The Nitrate-Ammonifying andnosZ-Carrying bacteriumBacillus Viretiis a Potent Source and Sink for Nitric and Nitrous Oxide under High Nitrate Conditions. Environ. Microbiol. 16, 3196–3210. doi:10.1111/1462-2920.12478
Martin, M. (2011). Cutadapt Removes Adapter Sequences from High-Throughput Sequencing Reads. EMBnet j. 17 (1), 10. doi:10.14806/ej.17.1.200
McDonald, M. D., Lewis, K. L., and Ritchie, G. L. (2020). Short Term Cotton Lint Yield Improvement with Cover Crop and No-Tillage Implementation. Agronomy 10, 994. doi:10.3390/agronomy10070994
McDonald, M. D., Lewis, K. L., Lewis, L. K., Ritchie, G. L., DeLaune, P. B., Casey, K. D., et al. (2019). Carbon Dioxide Mitigation Potential of Conservation Agriculture in a Semi-arid Agricultural Region. AIMS Agric. Food 4, 206–222. doi:10.3934/agrfood.2019.1.206
McLain, J. E. T., and Martens, D. A. (2006). N2O Production by Heterotrophic N Transformations in a Semiarid Soil. Appl. Soil Ecol. 32, 253–263. doi:10.1016/j.apsoil.2005.06.005
Mcswiney, C. P., and Robertson, G. P. (2005). Nonlinear Response of N2O Flux to Incremental Fertilizer Addition in a Continuous maize (Zea mays L.) Cropping System. Glob. Change Biol 11, 1712–1719. doi:10.1111/j.1365-2486.2005.01040.x
Menne, M. J., Durre, I., Korzeniewski, B., Mcneal, S., Thomas, K., Yin, X., et al. (2012a). "Global Historical Climatology Network - Daily (GHCN-Daily), Version 3". NOAA National Climatic Data Center).
Menne, M. J., Durre, I., Vose, R. S., Gleason, B. E., and Houston, T. G. (2012b). An Overview of the Global Historical Climatology Network-Daily Database. J. Atmos. Oceanic Techn. 29, 897–910. doi:10.1175/jtech-d-11-00103.1
Minami, K. (1997). Atmospheric Methane and Nitrous Oxide: Sources, Sinks and Strategies for Reducing Agricultural Emissions. Nutrient Cycling in Agroecosystems 49, 203–211. doi:10.1023/a:1009730618454
Mørkved, P. T., Dörsch, P., and Bakken, L. R. (2007). The N2O Product Ratio of Nitrification and its Dependence on Long-Term Changes in Soil pH. Soil Biol. Biochem. 39, 2048–2057.
Nass (2012). Quick Stats - Texas Land Use Practices [Online]. USDA: National Agricultural Statistics Service. Available https://quickstats.nass.usda.gov/results/2D65C1DB-B947-370D-8DD9-82AA17CAC756 (Accessed May 17, 2018).
Noaa (2021). NOAA National Centers For Environmental Information, Climate At a Glance [Online]. Washington, D.C., USA: National Oceanic and Atmospheric Administration. Available https://www.ncdc.noaa.gov/cag/(Accessed, 2021).
Oksanen, J., Blanchet, F. G., Friendly, M., Kindt, R., Legendre, P., Mcglinn, D., et al. (2019). "Vegan: Community Ecology Package. R Package Version 2.5-4".
Reay, D. S., Davidson, E. A., Smith, K. A., Smith, P., Melillo, J. M., Dentener, F., et al. (2012). Global Agriculture and Nitrous Oxide Emissions. Nat. Clim Change 2, 410–416. doi:10.1038/nclimate1458
Rosenkranz, P., Brüggemann, N., Papen, H., Xu, Z., Seufert, G., and Butterbach-Bahl, K. (2006). N2O, NO and CH4 Exchange, and Microbial N Turnover over a Mediterranean pine forest Soil. Biogeosciences 3, 121–133. doi:10.5194/bg-3-121-2006
Ryden, J. C. (1981). N2O Exchange between a Grassland Soil and the Atmosphere. Nature 292, 235–237. doi:10.1038/292235a0
Sanford, R. A., Wagner, D. D., Wu, Q., Chee-Sanford, J. C., Thomas, S. H., Cruz-García, C., et al. (2012). Unexpected Nondenitrifier Nitrous Oxide Reductase Gene Diversity and Abundance in Soils. Proc. Natl. Acad. Sci. 109, 19709–19714. doi:10.1073/pnas.1211238109
Sas, I. I. (2013). Base SAS® 9.4 Procedures Guide: Statistical Procedures, Second Edition. Cary, NC, USA: SAS Institute Inc.
Shelton, R. E., Jacobsen, K. L., and Mcculley, R. L. (2017). Cover Crops and Fertilization Alter Nitrogen Loss in Organic and Conventional Conservation Agriculture Systems. Front. Plant Sci. 8, 2260. doi:10.3389/fpls.2017.02260
Su, C., Kang, R., Huang, W., and Fang, Y. (2021). Temporal Patterns of N2O Fluxes from a Rainfed maize Field in Northeast China. Front. Environ. Sci. 9.
U.S. Department of Agriculture, N.R.C.S (2016). Acuff Soil Series [Online]. Washington: DC. Available https://soilseries.sc.egov.usda.gov/OSD_Docs/A/ACUFF.html (Accessed 17 May, 2018).
van Kessel, C., Venterea, R., Six, J., Adviento-Borbe, M. A., Linquist, B., and van Groenigen, K. J. (2013). Climate, Duration, and N Placement Determine N2O Emissions in Reduced Tillage Systems: a Meta-Analysis. Glob. Change Biol. 19, 33–44. doi:10.1111/j.1365-2486.2012.02779.x
Wang, J., and Zou, J. (2020). No-till Increases Soil Denitrification via its Positive Effects on the Activity and Abundance of the Denitrifying Community. Soil Biol. Biochem. 142, 107706. doi:10.1016/j.soilbio.2020.107706
Wang, W., Hou, Y., Pan, W., Vinay, N., Mo, F., Liao, Y., et al. (2021). Continuous Application of Conservation Tillage Affects In Situ N2O Emissions and Nitrogen Cycling Gene Abundances Following Nitrogen Fertilization. Soil Biol. Biochem. 157, 108239. doi:10.1016/j.soilbio.2021.108239
Zhou, S., Hou, Z., Li, N., and Qin, Q. (2007). Development of a SYBR Green I Real-Time PCR for Quantitative Detection of Vibrio Alginolyticus in Seawater and Seafood. J. Appl. Microbiol. 103, 1897–1906. doi:10.1111/j.1365-2672.2007.03420.x
Keywords: nitrous oxide, nosZ, N2O consumption, semi-arid soil, nosZ clade II, N2O emissions
Citation: McDonald MD, Lewis KL, DeLaune PB, Boutton TW, Reed JD and Gentry TJ (2021) Nitrous Oxide Consumption Potential in a Semi-Arid Agricultural System: Effects of Conservation Soil Management and Nitrogen Timing on nosZ Mediated N2O Consumption. Front. Environ. Sci. 9:702806. doi: 10.3389/fenvs.2021.702806
Received: 29 April 2021; Accepted: 18 October 2021;
Published: 11 November 2021.
Edited by:
Lu-Jun Li, Northeast Institute of Geography and Agroecology (CAS), ChinaReviewed by:
Sonia García-Marco, Universidad Politécnica de Madrid, SpainSangeeta Lenka, Indian Institute of Soil Science (ICAR), India
Jinyang Wang, Nanjing Agricultural University, China
Copyright © 2021 McDonald, Lewis, DeLaune, Boutton, Reed and Gentry. This is an open-access article distributed under the terms of the Creative Commons Attribution License (CC BY). The use, distribution or reproduction in other forums is permitted, provided the original author(s) and the copyright owner(s) are credited and that the original publication in this journal is cited, in accordance with accepted academic practice. No use, distribution or reproduction is permitted which does not comply with these terms.
*Correspondence: Mark D. McDonald, bW1jZG9uYWxkQHRhbXUuZWR1