 Luciana Chavez Rodriguez
 Brian Ingalls
 Jana Meierdierks
 Kankana Kundu4
 Holger Pagel
- 1Biogeophysics, Institute of Soil Science and Land Evaluation, University of Hohenheim, Stuttgart, Germany
- 2Department of Applied Mathematics, University of Waterloo, Waterloo, ON, Canada
- 3Center for Applied Geoscience, University of Tübingen, Tübingen, Germany
- 4Center for Microbial Ecology and Technology, Ghent University, Ghent, Belgium
Pesticide persistence in soils is a widespread environmental concern in agro-ecosystems. One particularly persistent pesticide is atrazine, which continues to be found in soils and groundwater in the EU despite having been banned since 2004. A range of physical and biological barriers, such as sorption and mass-transfer into bacterial cells, might limit atrazine degradation in soils. These effects have been observed in experiments and models working with simplified systems. We build on that work by developing a biogeochemical model of the degradation process. We extended existing engineered system models by including refined representations of mass-transfer processes across the cell membrane as well as thermodynamic growth constraints. We estimated model parameters by calibration with data on atrazine degradation, metabolite (hydroxyatrazine) formation, biomass, and isotope fractionation from a set of controlled retentostat/chemostat experiments. We then produced site-specific model predictions for arable topsoil and compared them with field observations of residual atrazine concentrations. We found that the model overestimated long-term atrazine biodegradation in soils, indicating that this process is likely not limited by bioavailability or energetic constraints of microbial growth. However, sorption-limited bioavailability, could explain the long-term fate and persistence of the main degradation metabolite hydroxyatrazine. Future studies should seek alternative controls that drive the observed atrazine persistence in soil. This work helps to bridge the gap between engineered and natural systems, allowing us to use laboratory setups to gain insight into real environmental systems.
1 Introduction
The worldwide intensification of agriculture is closely linked to increased use of pesticides (Roser, 2019). Persistent pesticides are defined as those that remain in soils “in significant concentrations until the next growing season” (Craven and Hoy, 2005). Field monitoring campaigns have demonstrated the presence of residual pesticides across Europe (Silva et al., 2019).
Atrazine (AT) is a herbicide in common use worldwide. Application of AT was banned in the EU in 2004 (Bethsass and Colangelo, 2006; Jablonowski and Schäffer, 2011) because of its potential toxic effects on non-target organisms (Graymore et al., 2001; Nwani et al., 2010; Zheng et al., 2017; Singh et al., 2018; de Albuquerque et al., 2020), and on human health (Jablonowski and Schäffer, 2011; Sánchez et al., 2020). Despite the ban, AT persists in soils and groundwater (Jablonowski and Schäffer, 2011; Vonberg et al., 2014): AT and its degradation metabolites (hydroxyatrazine, deethylatrazine, deisopropylatrazine) are still found in Europe at low concentrations (about 1–40 μg kg−1) in soils (Jablonowski et al., 2009), and (<0.1 μg L−1) in groundwater (Vonberg et al., 2014). These concentrations might still be relevant for human and ecosystem health (Shipitalo and Owens, 2003; Jablonowski and Schäffer, 2011; Vonberg et al., 2014). This persistence is surprising, given that studies have confirmed 1) the frequent presence of bacterial strains able to completely degrade atrazine (under controlled conditions) (Udikoviç-Koliç et al., 2012; Fernandes et al., 2014; Ehrl et al., 2018b; Kundu et al., 2019); and 2) alternative photolytic degradation of atrazine in soil (Kiss et al., 2007; Kiss and Virág, 2009; López-Muñoz et al., 2011). The persistence of atrazine and other pesticides in natural environments demands a better understanding of degradation processes to improve long-term monitoring and pollution mitigation strategies (Chow et al., 2020).
Pesticide degradation in natural environments may be impeded by a range of physical and biological constraints. For instance, sorption of pesticides onto soil particles limits microbial access to pesticides, retarding degradation (Novak et al., 1995; Guo et al., 2000; Siek and Paszko, 2019). Moreover, spatial heterogeneity and separation of microorganisms and pesticides in soil reduces biodegradation rates (Dechesne et al., 2010; Pinheiro et al., 2018). Diffusion-limited transport across the cell membrane has been identified as a potential limiting step of pesticide degradation under low concentrations, based on observations made in engineered (chemostat and retentostat) systems (McKelvie et al., 2007; Thullner et al., 2008; Braeckevelt et al., 2012; Ehrl et al., 2018b; Kundu et al., 2019, 2020). Likewise, under specific conditions, the energy produced from catabolism of some pesticides may be insufficient to support cellular energy needs, leading to pesticide persistence despite microbial accessibility (LaRowe and Van Cappellen, 2011). To date, the effect of these barriers has only been explored in the lab under controlled conditions (Ehrl et al., 2018b,a, 2019; Kundu et al., 2019) or in simulation studies based on simplified systems (Guo et al., 2000; Gharasoo et al., 2019; Marozava et al., 2019; Kundu et al., 2020).
In this work, we apply biogeochemical modeling to investigate potential factors of long-term pesticide persistence in soils. We extended existing chemostat/retentostat models (Gharasoo et al., 2019) by the 1) introduction of thermodynamic growth constraints (Desmond-Le Quéméner and Bouchez, 2014; Ugalde-Salas et al., 2020) [the alternative model formulation uses a simple Monod kinetics growth (Gharasoo et al., 2019)], 2) a refined formulation of mass-transfer processes across cell membranes, and 3) calibration against isotope fractionation data. These engineered systems make it possible to study the biodegradation of pesticides at growth-limiting substrate concentrations (Kundu et al., 2020), which is not possible in situ for soils. Chemostats are continuous flow systems that allow for control of steady-state microbial growth rates by adjusting substrate input and bacterial washout rates (Kuenen, 2019). Retentostats are similar devices, but retain the bacterial biomass, allowing for analysis of microbial substrate turnover at extremely low substrate concentrations (Kundu et al., 2020). We then extended the model by including equilibrium sorption and leaching in soils, and ran site-specific predictions of pesticide degradation in soil over 30 years. We compare our model predictions with residual atrazine concentration of topsoils at two study sites (arable soil) in Germany at which no atrazine has been applied for over 30 years. Albeit the long-term predictions show considerable discrepancies with the field data, our analysis provides insight into the relative contributions of model features toward long-term atrazine persistence in soils.
2 Materials and Methods
2.1 Model Description
Our model (Figure 1) describes a single bacterial population (CB) that uses atrazine (AT) as its sole carbon (C) and energy source. The core model (green background), describes behavior in engineered systems (chemostat/retentostat); it incorporates intracellular and extracellular compartments, each of which contain concentrations of both AT and hydroxyatrazine (HY). Hydroxyatrazine is produced by dechlorination of the side chain of AT. This is the first metabolic step of AT degradation. We extended the model to soil (blue background) by incorporating equilibrium sorption and leaching for each component in the extracellular compartment.
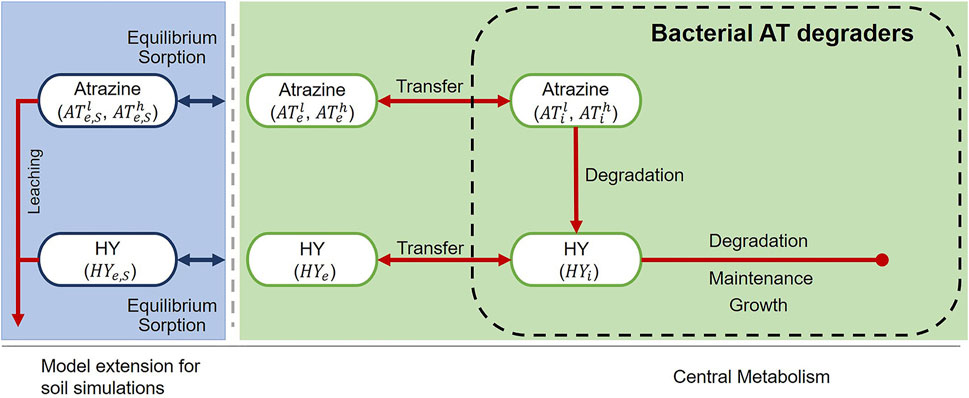
FIGURE 1. Model structure for engineered (chemostat/retentostat) systems (green) and extension for soil (blue). The model explicitly accounts for light “l” and heavy “h” isotopologues (
2.2 Process Formulations
2.2.1 Atrazine and Hydroxyatrazine Degradation
The model describes pools of atrazine (AT) [µg L−1] and hydroxyatrazine (HY) in the intracellular and extracellular compartments: ATi/HYi and ATe/HYe, respectively. To take advantage of available data on isotope fractionation of AT, we split the AT pools into light (ATl) and heavy (ATh) isotopologues (
We modeled degradation of both isotopologues of AT with Michaelis-Menten kinetics, allowing for competition for binding sites. For the light isotopologue:
where kAT [d−1] is the maximum degradation rate of AT and
The slightly slower degradation of the heavy isotopologue is captured by scaling the maximal degradation rate by β⪅1 as follows:
We considered two separate formulations of HY degradation. Model variant M employs standard Monod kinetics:
where kHY [d−1] is the maximum degradation rate and
Because metabolism of pesticide at low concentrations might not be energetically favorable for bacterial growth (LaRowe and Van Cappellen, 2011), we considered a second model variant in which degradation of HY is described by transition state theory (Desmond-Le Quéméner and Bouchez, 2014; Ugalde-Salas et al., 2020), using HY as the carbon and energy source.
where again kHY [d−1] is the maximum degradation rate, but now
These two variants [Monod (M), Thermodynamic (T)] show similar behavior at high HY concentrations (such as in chemostat/retentostat systems), but differ considerably at low HY concentrations (such as in soil).
2.2.2 Mass-Transfer
We account for diffusive transport of AT and HY across the cell membrane [c.f Gharasoo et al. (2019); Ehrl et al. (2019)] by writing:
where l indicates the light isotopologue, and h the heavy isotopologue, and re [L d−1 μg−1] is the mass-transfer rate coefficient assumed to be the same for both compounds.
2.2.3 Maintenance
We incorporate metabolic maintenance requirements following the Pirt model (Pirt, 1982; Gharasoo et al., 2019):
where m [d−1] is the maintenance coefficient, CB [µg L−1] is the bacterial biomass, and Y [-] is the yield coefficient.
2.2.4 Input and Washout of AT, HY, Biomass
For engineered systems (chemostat/rententostat), we include a constant input of AT as:
where rD [d−1] is the dilution rate. Additionally, we define washout terms for biomass, and AT and HY:
where α [-] is 1 for a chemostat (from which biomass is washed out) and 0 for a retentostat system (where biomass is retained).
The core model is described by the following system of ordinary differential equations (ODE):
where fcell [µg cell−1] is a conversion factor from cells to carbon, and Vu [L] is the volume of a single bacterium, set to 1 ⋅ 10–15 (Kundu et al., 2019) (full details in the Supplementary Section 2). The last terms in Eqs. (16), (17) and (20) account for changes in inner cell concentrations as the total bacterial volume changes due to growth and decay.
2.2.5 Extension for Soil
As shown in Figure 1, we extend the core model by including equilibrium sorption and transport. We partition the extracellular concentrations of both AT isotopologues, as well as HY, into solution phase and sorbed phase concentrations:
where CT [µg L−1] is the total extracellular concentration of AT, and HY, CL [µg L−1] is the solution phase concentration (
We relate CL and CS by the Freundlich isotherm:
implemented in the model via the retardation factor:
where KF (KAT and KHY for AT and HY respectively) [
Additionally, Arthrobacter aurescens TC1 and other AT degraders utilize other organic substances as C and energy source. We, therefore, assume that a minimum AT degrader biomass is maintained in soil (Klier et al., 2008):
where M [µg L−1] is the minimum bacterial biomass in soil.
Transport is restricted to convective flow:
where vv [d−1] is the water flow per soil volume in the plough layer.
We did not include abiotic degradation of AT (Kiss et al., 2007; Kiss and Virág, 2009; López-Muñoz et al., 2011), which has been observed to have a relatively small contribution compared to biotic degradation (Braeckevelt et al., 2012).
The full model for soil is described by the following system of ODEs.
2.3 Model Calibration
2.3.1 Engineered Systems: Experimental Details
We calibrated two model variants (M: employing Monod-kinetics for HY degradation; T: employing thermodynamic HY biodegradation constraints) against published data from chemostat and retentostat experiments (with two replicates per experiment). Atrazine was provided as the sole C and energy source for the bacterial strain Arthrobacter aurescens TC1 (Ehrl et al., 2018b; Kundu et al., 2019). Both engineered systems were fed with an AT solution (30 mg L−1), with dilution rates, for the chemostat, of 0.023, 0.032, 0.048, 0.056, 0.068 d−1, and, for the retentostat, of 0.02 d−1. For each system at each dilution rate, concentrations of AT [µg L−1], HY [µg L−1], and living biomass [cell L−1] were reported at steady-state (details in the Supplementary Section 3). Additionally, the isotope fractionation coefficient (ɛ) was measured at the outlet of the first dilution rate of the chemostat (−5.4‰, only at the lowest dilution rate), and retentostat (−0.45‰).
2.3.2 Calibration Strategy
Our initial intent was to estimate a single set of model parameters for both engineered systems. This was not possible, however, most likely due to differences in bacterial physiology (Ercan et al., 2015; Kundu et al., 2020). In our next attempt, we introduced a switch function (Stolpovsky et al., 2011; Mellage et al., 2015), allowing for environmental-specific transition between the two conditions (chemostat and retentostat) (Supplementary Sections 10.1 and 10.2). This model, despite its high complexity and many degrees of freedom, was still unable to simulate both engineered systems together (Supplementary Section 10.3). Therefore, we exhaustively investigated (using fits for both systems and sensitivity analysis) subsets of parameters that could be kept fixed at the chemostat fit while still capturing bacterial behavior in the retentostat in a two-step calibration process, as follows.
STEP 1- pre-calibration step: We started by using the five steady-states (one with each dilution rate) measured in the chemostat, and the isotope fractionation of the lowest dilution rate (16 data points). We considered the parameter ranges shown in Table 1. The nominal values were taken from literature (Table 1). Ranges were selected as to capture parameter variation.We used the global optimization algorithm Simulated Annealing (simannealbnd) of MATLAB to minimize the weighted sum of squared errors (SSE):
where
Isotope fractionation was determined as:
where δinlet is the isotope ratio of the heavy and the light isotopologues of AT at the inlet, given as −29‰ (Ehrl et al., 2018b, 2019), and δoutlet was determined as
where R is the reference
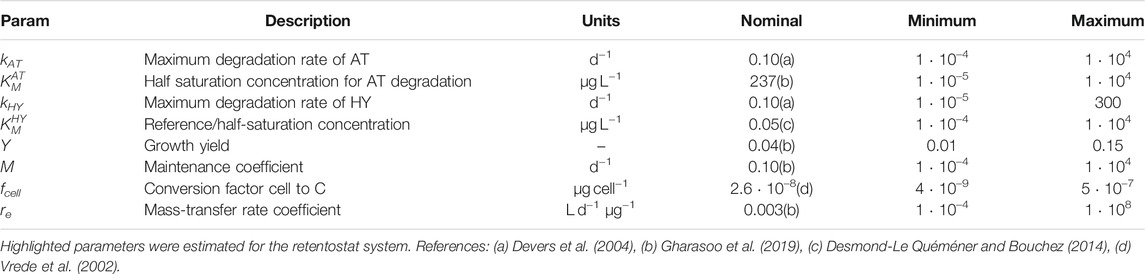
TABLE 1. Model parameters.
STEP 2- Full calibration: For both systems, a full calibration step, including parameter and output uncertainty were determined with the Markov Chain Monte Carlo (MCMC) algorithm of the DREAM MATLAB toolbox (Vrugt, 2016). We fitted the 8 chemostat system parameters and the 4 differing retentostat system parameters simultaneously (marked in yellow in Table 1) in one optimization run. We chose a flat and uninformative prior distribution for the MCMC. The starting values of the MCMC chains were drawn from a normal distribution of the parameters in log-space (mean value equal to the best fit of the Simulated Annealing (step 1), an arbitrary variance of 1, and zero covariance between the parameters). Minimum and maximum parameter values were taken from Table 1, and the option “reflect” was selected as a method for handling parameter boundaries. The
2.4 Soil Measurements
2.4.1 Soil Sampling
Topsoil was sampled from the plough layer (0–30 cm) of two agricultural fields (Poltringen and Tailfingen) in the vicinity of Tübingen, Germany. The soils were classified as Vertic Cambisol on gypsum keuper (Poltringen), and eroded Luvisol (siltic) on loess (Tailfingen). To obtain representative samples, 20 individual samples were drilled by hand down to 30 cm depth and combined in the field to one composite sample. In the lab, samples were thoroughly mixed (using a sample-splitter; Retsch GmbH, Germany), freeze-dried, and ground before further processing (exhaustive extraction and sorption test).
2.4.2 Exhaustive Soil Extraction
Pesticides (atrazine and hydroxyatrazine) were extracted from soil with an accelerated Solvent Extractor (ASE 300 Dionex, Thermo Scientific) at 80°C and 150 bar, using acetone as the main solvent (parameters in Table 2). To ensure a homogeneous flow through the extraction cells, soil samples were mixed with 80% (mass) clean quartz sand before extraction. To control for potential losses of pesticide during the processing (enrichment and clean-up) of the extracts, 10 ng of Isoproturon-D6 were added to each extract. Subsequently, the extracts were reduced with a rotational evaporator until acetone was evaporated completely. The residual aqueous sample was filtered through 0.25 µm PTFE syringe filters (Agilent, Waldbronn Germany) and 10% (Vol.) of MeOH was added before the measurement at the liquid chromatography–mass spectrometry (HPLC-MS/MS). The target compounds were separated with an Agilent 1290 Infinity HPLC (Agilent, Waldbronn, Germany) using a reversed phase column (Agilent Poroshell 12 EC-C18, 2.7 µm, 2.1 × 100 mm). The quantification of the target compounds was done based on an external calibration using 10 standards with concentrations between 0.02 and 10 μg L−1. As control for a potential shift during the measurement, every 15 samples, one external standard was monitored, with a concentration of 2.5 μg L−1 (Measurements are shown in Supplementary Section 4, Supplementary Table 2.)
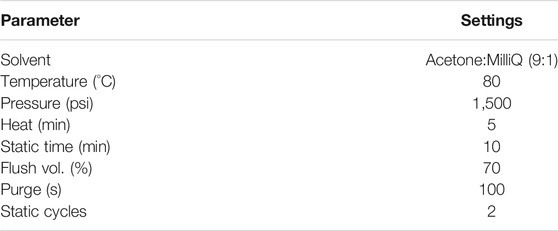
TABLE 2. Details of accelerated solvent extraction method.
2.4.3 Sorption Test
Six initial concentrations of atrazine (0.06, 0.4, 4, 36, 420 and 2060 μg L−1) were prepared from a stock solution of atrazine in MilliQ water (using a pure, analytical standard from Sigma Aldrich). The solutions were spiked with CaCl2 (0.5 g L−1) and NaN3 (0.25 g L−1) to provide a stable ionic strength and minimize bacterial activity. The sorption test was conducted in triplicates in 50 ml glass vials (with Teflon-lined caps), containing 15 g of soil and 30 ml of spiking solution. The vials were kept on a horizontal shaker (150 rpm) for 10 days in the dark and at 20°C. To separate soil solids from water, the vials were kept standing for 3 days until all fine particles were settled. A small test with filtering the aqueous phase had confirmed this approach as valid. Subsequently, the aqueous phase was transferred into clean vials using glass pipettes.
After separating soil solids from water, 20 ng of atrazine-D6 was added as an internal standard to the aqueous phase. Processing of the aqueous samples varied for the different concentrations: Samples with lowest concentrations were enriched via solid phase extraction (Waters OASIS HLB). Samples with expected concentrations between 0.2 and 10 μg L−1 were filtered through 0.25 μm PTFE syringe filters and 2% (Vol.) of acetonitrile was added. For concentrations above 10 μg L−1, the samples were filtered and then diluted with MilliQ:acetronitrile (98:2) before LC-MS/MS measurements. As quality control, blanks with ultra-pure water, leaching blanks with ultrapure-water and soil, and controls with spiking solution without soil were analyzed in triplicates confirming no relevant loss of atrazine or contamination (Supplementary Section 4, Supplementary Table 3).
We determined the Freundlich sorption parameters (KAT and nAT) for atrazine at both sites by regressing the sorbed concentration on the solution concentration [Eqs. (23), (24)]. We used the Nonlinear regression function (nlinfit) of Matlab (Supplementary Section 4, Supplementary Figure 2 and Supplementary Table 4). The sorption coefficient of hydroxyatrazine (KHY) was calculated by dividing the normalized sorption coefficient of atrazine
2.5 Soil Predictions
We ran simulations in soils using both sets of calibrated parameters (chemostat and retentostat) for four different model configurations: 1) with Monod-kinetics and without leaching (Variant M-NL), 2) with thermodynamic growth constraint and without leaching (Variant T-NL), 3) with Monod-kinetics and leaching (Variant M-L), 4) with thermodynamic growth constraint and leaching (Variant T-L). We collected data from two sites (Poltringen and Tailfingen) as previously described. Estimated sorption parameters and mean daily water fluxes were similar (considering their uncertainty) in both locations (Supplementary Section 4, Supplementary Table 4, and Supplementary Section 5, Supplementary Figure 3). We therefore used the average values for simulating AT and HY fate. We derived the mean water flow in the plough layer (vv) by dividing the mean daily water flux (0.56 mm d−1) by the ploughing depth (300 mm). We fixed the minimum bacterial biomass in soil M according to Klier et al. (2008). The values of the soil parameters are shown in Table 3:
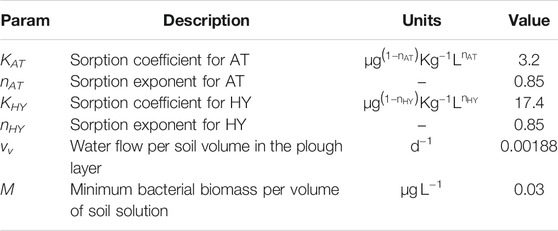
TABLE 3. Soil parameters.
To compare with the field monitoring data from the sites Poltringen and Tailfingen, we ran simulations with all four variants of the soil model, assuming an initial application of 1000 μg kg−1 (Vryzas et.al., 2007; Krutz et.al., 2010) and predicting residual concentrations after 30 years.
2.6 Global Sensitivity Analysis
We determined the Morris and Sobol indices (Morris, 1991; Campolongo et al., 2007; Saltelli et al., 2008; Pianosi et al., 2015) for the two core model variants (M and T), using the SAFE toolbox of MATLAB (Pianosi et al., 2015; Sigmund et al., 2020). We calculated the mean of the elementary effects (μ*) and the standard deviation of the elementary effects (σ) for the Morris Method, as well as main and total effects for Sobol indices with a total of 15,000 sample inputs in both cases.
We sampled parameters from a uniform distribution taken from the posterior distribution of the fitted parameters against the chemostat and retentostat data combined (Table 4 from the Section 3). We used a Latin hypercube sampling strategy (Marschmann et al., 2019). Additionally for the Morris Method, we calculated the l2 norm (
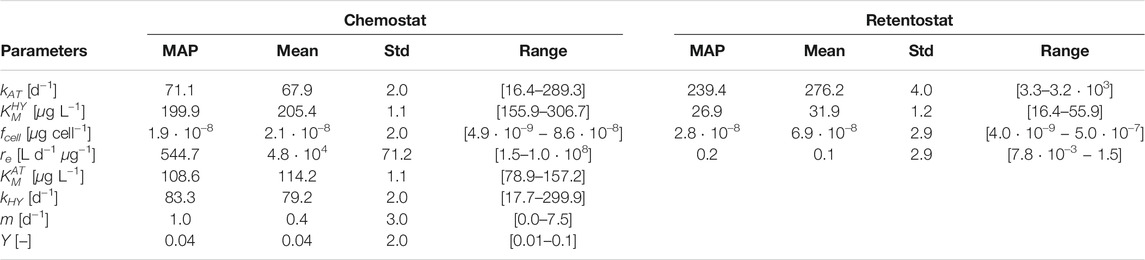
TABLE 4. Calibrated parameter values of the model variant T based on an MCMC ensemble for Chemostat and Retentostat fits.
We selected the following outputs: steady state biomass, AT, and HY (extracellular and intracellular), and isotope fractionation ɛ [Eq. (40)]. We ran the model for 200 days to guarantee steady-state in the simulations.
2.7 Local Sensitivity Analysis
We performed a local parametric sensitivity analysis (Ingalls, 2008; Zi, 2011) for the four soil model variants as described above, based on the best fit against the chemostat and retentostat observations. The target outputs were the residual concentration of AT and HY after 30 years. We addressed all kinetics (Table 1) and soil parameters (Table 3), as well as the initial AT application.
3 Results
3.1 Calibration to Chemostat and Retentostat Data
The two core model variants behave equally in engineered environments, and so we present the results only for Variant T (Results corresponding to Variant M are presented in the Supplementary Section 6, Supplementary Figures 4,5 and Supplementary Table 5). Following a two-step approach, we calibrated the 8 chemostat system parameters and the 4 differing retentostat system parameters simultaneously.
3.1.1 Concentrations
Our simulations were in good agreement with observed data for the chemostat (Figures 2A–C). After the partial re-calibration, we found acceptable agreement for the retentostat system, but with a slightly higher model output uncertainty for the biomass (this was not unexpected, given the relative lack of data for calibration).
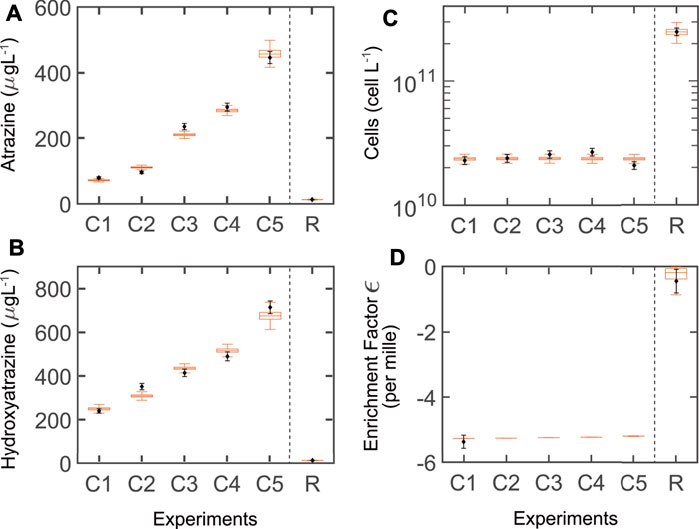
FIGURE 2. Simulations (boxplots) of model variant T (thermodynamic growth constraints) and measured data (blank diamonds + estimated standard deviation). (A–C) Steady-state concentrations for the chemostat (five dilution rates: C1–C5: 0.023, 0.032, 0.048, 0.056, 0.068 h−1, respectively) and the retentostat (dilution rate: R: 0.020 h−1). The middle line in the boxplot is the median of the ensemble outputs from the MCMC simulation ensemble (see M&M); boxes represent 25 and 75% percentiles; whiskers corresponds to ± 1.5 × IQR (interquartile range). (D) Enrichment factors (ɛ) were reported only for the lowest dilution rate of the chemostat (C1) and the retentostat (R), but simulated for C2-C5.
3.1.2 Fractionation
Simulations showed agreement with the observed isotope fractionation for both systems, with slightly higher uncertainty for the retentostat (Figure 2D). Isotope fractionation of AT occurs when enzymatic transformation is the rate-limiting step. In this case, the enzymatic fractionation coefficient of AT (ɛ) lies close to −5.4‰ (chemostat). At low AT concentrations, the mass transfer across the cell membrane becomes rate-limiting, and no isotope fractionation is observed (ɛ of just −0.45‰; retentostat) (Ehrl et al., 2018b; Gharasoo et al., 2019; Kundu et al., 2019).
3.1.3 Parameter Estimates and Uncertainty
Kinetic parameters related to AT and HY degradation (chemostat: kAT,
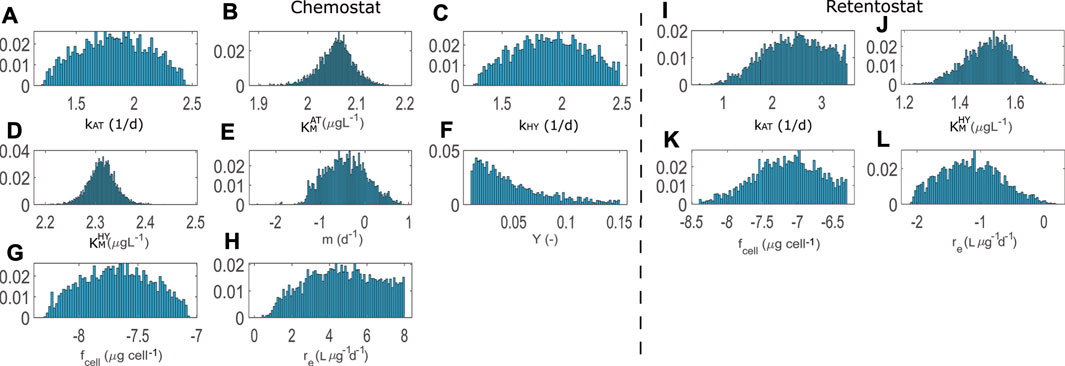
FIGURE 3. Posterior distributions for calibrations with chemostat (8 parameters) and retentostat (4 parameters) data. All parameters are expressed in log scale with the exception of the growth yield Y.
3.1.4 Comparison of Parameter Estimates Between the Chemostat and Retentostat
Comparing the mean and MAP calibrated parameter values in Table 4, we see that the per-cell AT degradation rate (kAT) is estimated to be higher for cells living in the low nutrient retentostat system. Conjectured physiological adaptations (Kundu et al., 2020) in the retentostat environment may be responsible for the difference in the estimated value of fcell compared to the chemostat, reflecting changes in cell volume. However, this estimate is highly uncertain and highly correlated to other parameters’ values. Physiological adaptations might also be responsible for a reduced value of parameter
Maximum a-posteriori (MAP), mean, standard deviation (Std) and range of the MCMC ensemble for both engineered systems. Calibrated parameters of model variant M are shown in the Supplementary Section 5, Supplementary Table 5.
3.2 Predictions of Atrazine and Hydroxyatrazine Fate in Soils and Comparison Against Field Data
We simulated the fate of AT and HY in soil for 30 years, assuming a single initial AT input of 1,000 μg kg−1 (Vryzas et al., 2007; Krutz et al., 2010). For this, we used the full posterior parameter estimates from the chemostat and retentostat systems for four model variants (Figure 4). All model variants predicted very low residual AT concentrations, considerably underestimating the observed concentrations of 0.3 and 0.6 μg kg−1 in the top soil of both field sites (Poltringen and Taiflingen respectively) (Figures 4A,B).
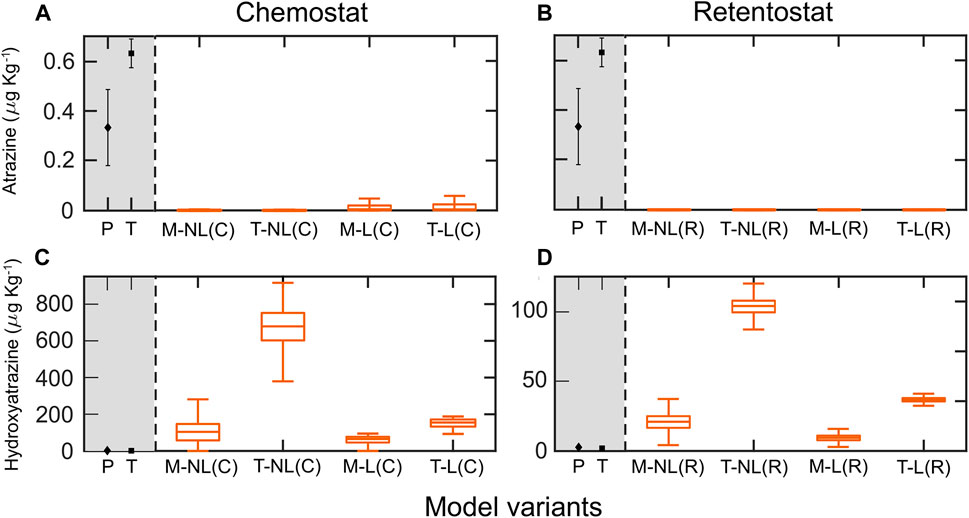
FIGURE 4. Simulated residual concentrations of atrazine AT (A,B) and hydroxyatrozine HY (C,D) in topsoils (0–30 cm), and observations (grey background) in topsoils of two field sites Poltringen (P) and Taifingen (T) after 30 years (C) represent simulations using chemostat fitted parameters, and (R) simulations using retentostat fitted parameters. The middle line of boxplots is the median of the ensemble outputs from the MCMC simulation ensemble (see M&M); boxes represent 25 and 75% percentiles; whiskers corresponds to ± 1.5 × IQR (interquartile range). The mean and standard deviation of the simulated residual concentrations per model variant are presented in Supplementary Table 10.
In contrast, predictions of residual HY mainly overestimated the observed HY concentration at both study sites (around 2 μg kg−1 in both sites) (Figures 4C,D). Predictions using retentostat-fitted parameters in combination with thermodynamically constrained growth and leaching (Figure 4D) predicted long-term persistence of HY, with mean values around 36 μg kg−1. However, model variants with Monod kinetics (M-NL(R) and M-L(R)) performed better and predicted residual HY concentrations much closer to the measurements (9 and 20 μg kg−1, Figure 4D).
As expected, simulations of this simple model over 30 years are highly uncertain. Based on our local sensitivity analysis (Supplementary Section 9, Supplementary Tables 8,9), the sorption exponent of both chemicals (nAT and nHY) showed the highest impact on the residual concentrations of AT and HY after 30 years, revealing a strong dependency on sorption characteristics of the soils. Surprisingly, the initial application of AT only impacted the residual concentration of AT in model variants incorporating thermodynamic growth constraints. Water flow (vv) and minimum bacterial biomass (M) had low impact on the residual concentrations, despite their role to improve model predictions (our best model predictions include leaching; recall that parameter M accounts for alternative carbon sources for soil bacterial biomass). As to be expected, the kinetic parameters, in contrast to the sorption parameters, had a negligible impact on the target outputs.
4 Discussion
4.1 Bacterial Adaption to Low Nutrient Availability Affects Model Parameterization
Due to the apparent similarities between the chemostat and retentostat systems, our initial intent was to achieve a joint fit for both systems. In particular, by including a flexible formulation of the mass-transfer rate, as well as a thermodynamically constrained growth rate instead of a Monod formulation, we aimed to represent systems with or without mass-transfer limitations across the cell membrane by one model. However, we found that goal unattainable. Recent publications (Ercan et al., 2015; Kundu et al., 2020) show evidence of a phenotypic differentiation of a single population into separate growing and non-growing (i.e. energy used only for maintenance) bacterial subpopulations (Kundu et al., 2020). Thus, we focused on the key parameters that have to be re-calibrated between the two systems using two model variants that exhibit equivalent behavior over the range of inputs in the engineered systems (Table 4).
After fitting model parameters to the chemostat data, we systematically tested which parameters had to be re-calibrated to capture the retentostat behavior. We were guided by sensitivity analyses, as well as our understanding of the role of the parameters in our model. We fixed the maximum degradation rate of HY (kHY), the growth yield (Y), the half-saturation concentration for AT degradation (
The parameters kAT (maximum degradation rate of AT), and
We found that re-calibration of the parameter fcell is an efficient way to capture specific bacterial differentiation for low nutrient systems (Kundu et al., 2019). The parameter fcell is a scaling factor used to convert cells to C (Vrede et al., 2002) and might suggest morphological changes (shape and volume) observed in Arthrobacter aurescens to cope with stressful starvation conditions (Mongodin et al., 2006; Lever et al., 2015). Due to the high uncertainty in parameter estimation, more experiments are needed to identify the underlying mechanism.
Changes in the value of re (mass-transfer rate coefficient) between chemostat and retentostat system could reflect morphological/physiological changes in the cell membrane (Table 4). The relatively lower value of re in the retentostat suggests a strong mass-transfer limitation across the cell membrane in that case.
4.2 Pesticide Persistence in Soil
The main objective of our work was to accurately represent Atrazine (AT) degradation in soils, and especially to capture the long-term persistence of AT and its main metabolite Hydroxyatrazine (HY).
Despite the related uncertainty for long-term predictions, persistence of HY even after 30 years was consistently predicted by model variant M-L calibrated with retentostat data (Figure 4D). In general, retentostat concentrations are closer to the soil environment, so that more accurate predictions are to be expected (biomass retention, low nutrient levels). Additionally, incorporation of leaching gave a better representation of the pesticide losses over time. Simulation with a simple model incorporating only leaching over the 30 years leads to a residual concentration of AT of about 2 μg kg–1. This value is close to the measured residual concentrations indicating that only low AT degradation might have occurred at the field sites (Figure 4). Standard Monod model variants predicted HY concentrations after 30 years better than thermodynamic models. Therefore, energetic constraints of microbial growth likely do not limit HY degradation in soils. In contrast, all model configurations predicted a nearly complete consumption of AT after 30 years, a behavior not observed in field surveys (Jablonowski and Schäffer, 2011; Vonberg et al., 2014), including the field measurements of this study (Figure 4A).
A range of biological and physical processes in soil have been hypothesized as potential mechanisms of pesticide persistence in natural systems. These include physicochemical control mechanisms limiting bioavailability, such as chemisorption onto humic substances (Mudhoo and Garg, 2011), physical stabilization in soil micro aggregates (Hochman et al., 2021), or the spatial encounter of substrates and degraders (Shi et al., 2021). Including these additional mechanisms by applying better sorption and stabilization model formulations (van Genuchten and Wagenet, 1989; Streck et al., 1995; Altfelder and Streck, 2006; Villaverde et al., 2009; Kästner et al., 2014; Yu et al., 2020) and spatially resolved modeling approaches (Babey et al., 2017; König et al., 2020; Pagel et al., 2020; Pot et al., 2021) might further improve predicting the persistence of AT and other pesticides in soil. Our study investigated to what extent mass-transfer limitations and bioenergetic constraints can explain the longterm fate of atrazine and its major metabolite hydroxyatrazine in soils. We found evidence against the hypothesis that passive diffusion across the cell membrane of bacterial degraders limits atrazine degradation in the long term. Atrazine is not degraded to HY for the energy gain by microorganisms and our results suggest that sorption-limited bioavailabilty and not energetic growth constraints control the persistence of hydroxyatrazine. Hence, standard Monod kinetics for bacterial growth can predict the long-term fate of organic chemicals if soil microorganisms directly utilize them as an energy source. Further research should prioritize the analysis of energetic costs of biogeochemical transformations without a direct microbial energy gain (atrazine dechlorination).
Data Availability Statement
The datasets presented in this study can be found in online repositories. The names of the repository/repositories and accession number(s) can be found in the article/Supplementary Material.
Model codes available under DOI: 10.5281/zenodo.4718766.
Author Contributions
LR, HP, TS, and BI contributed the conception of the manuscript and the design of the study. LR developed the model, performed the simulations, and analyzed the data. KK provided the chemostat/retentostat data. JM performed soil and seepage water measurements (sampling, processing, and analysis). LR wrote the first draft of the manuscript. All authors contributed to the manuscript revision, read and approved the submitted version.
Funding
This study was financially supported by the German Research Foundation (DFG) within the Research Training Group “Integrated Hydrosystem Modelling” (RTG 1829) and the Collaborative Research Center 1253 CAMPOS (DFG Grant Agreement SFB 1253/1 2017) as well as by the Ellrichshausen Foundation and the Canadian Natural Sciences and Engineering Research Council (NSERC).
Conflict of Interest
The authors declare that the research was conducted in the absence of any commercial or financial relationships that could be construed as a potential conflict of interest.
Publisher’s Note
All claims expressed in this article are solely those of the authors and do not necessarily represent those of their affiliated organizations, or those of the publisher, the editors and the reviewers. Any product that may be evaluated in this article, or claim that may be made by its manufacturer, is not guaranteed or endorsed by the publisher.
Acknowledgments
The authors acknowledge support by the state of Baden-Württemberg through bwHPC. We thank Mehdi Gharasoo (Ecohydrology Research Group, University of Waterloo, Canada), Martin Elsner (Technische Universität Mn̈chen, Germany), Prof. -Ing. Wolfgang Nowak (Institute for Modelling Hydraulic and Environmental Systems, University of Stuttgart, Germany), and Tobias Weber (Biogeophysics, Institute of Soil Science and Land Evaluation, University of Hohenheim, Stuttgart, Germany) for the critical discussions.
Supplementary Material
The Supplementary Material for this article can be found online at: https://www.frontiersin.org/articles/10.3389/fenvs.2021.706457/full#supplementary-material
References
Altfelder, S., and Streck, T. (2006). Capability and Limitations of First-Order and Diffusion Approaches to Describe Long-Term Sorption of Chlortoluron in Soil. J. Contaminant Hydrol. 86, 279–298. doi:10.1016/j.jconhyd.2006.04.002
Babey, T., Vieublé-Gonod, L., Rapaport, A., Pinheiro, M., Garnier, P., and de Dreuzy, J.-R. (2017). Spatiotemporal Simulations of 2,4-D Pesticide Degradation by Microorganisms in 3D Soil-Core Experiments. Ecol. Model. 344, 48–61. doi:10.1016/j.ecolmodel.2016.11.006
Bethsass, J., and Colangelo, A. (2006). European Union Bans Atrazine, while the United States Negotiates Continued Use. Int. J. Occup. Environ. Health 12, 260–267. doi:10.1179/oeh.2006.12.3.260
Braeckevelt, M., Fischer, A., and Kästner, M. (2012). Field Applicability of Compound-specific Isotope Analysis (CSIA) for Characterization and Quantification of In Situ Contaminant Degradation in Aquifers. Appl. Microbiol. Biotechnol. 94, 1401–1421. doi:10.1007/s00253-012-4077-1
Brand, W. A., Assonov, S. S., and Coplen, T. B. (2010). Correction for the 17O Interference in δ(13C) Measurements when Analyzing CO2 with Stable Isotope Mass Spectrometry (IUPAC Technical Report). Pure Appl. Chem. 82, 1719–1733. doi:10.1351/PAC-REP-09-01-05
Campolongo, F., Cariboni, J., and Saltelli, A. (2007). An Effective Screening Design for Sensitivity Analysis of Large Models. Environ. Model. Softw. 22, 1509–1518. doi:10.1016/j.envsoft.2006.10.004
Carmo, A. M., Hundal, L. S., and Thompson, M. L. (2000). Sorption of Hydrophobic Organic Compounds by Soil Materials: Application of Unit Equivalent Freundlich Coefficients. Environ. Sci. Technol. 34, 4363–4369. doi:10.1021/es000968v
Chow, R., Scheidegger, R., Doppler, T., Dietzel, A., Fenicia, F., and Stamm, C. (2020). A Review of Long-Term Pesticide Monitoring Studies to Assess Surface Water Quality Trends. Water Res. X 9, 100064. doi:10.1016/j.wroa.2020.100064
Craven, A., and Hoy, S. (2005). Pesticide Persistence and Bound Residues in Soil-Regulatory Significance. Environ. Pollut. 133, 5–9. doi:10.1016/j.envpol.2004.04.010
de Albuquerque, F. P., de Oliveira, J. L., Moschini-Carlos, V., and Fraceto, L. F. (2020). An Overview of the Potential Impacts of Atrazine in Aquatic Environments: Perspectives for Tailored Solutions Based on Nanotechnology. Sci. Total Environ. 700, 134868. doi:10.1016/j.scitotenv.2019.134868
Dechesne, A., Owsianiak, M., Bazire, A., Grundmann, G. L., Binning, P. J., and Smets, B. F. (2010). Biodegradation in a Partially Saturated Sand Matrix: Compounding Effects of Water Content, Bacterial Spatial Distribution, and Motility. Environ. Sci. Technol. 44, 2386–2392. doi:10.1021/es902760y
Desmond-Le Quéméner, E., and Bouchez, T. (2014). A Thermodynamic Theory of Microbial Growth. Isme J. 8, 1747–1751. doi:10.1038/ismej.2014.7
Devers, M., Soulas, G., and Martin-Laurent, F. (2004). Real-time Reverse Transcription PCR Analysis of Expression of Atrazine Catabolism Genes in Two Bacterial Strains Isolated from Soil. J. Microbiol. Methods 56, 3–15. doi:10.1016/j.mimet.2003.08.015
Ehrl, B. N., Gharasoo, M., and Elsner, M. (2018a). Isotope Fractionation Pinpoints Membrane Permeability as a Barrier to Atrazine Biodegradation in Gram-Negative Polaromonas Sp. Nea-C. Environ. Sci. Technol. 52, 4137–4144. doi:10.1021/acs.est.7b06599
Ehrl, B. N., Mogusu, E. O., Kim, K., Hofstetter, H., Pedersen, J. A., and Elsner, M. (2018b). High Permeation Rates in Liposome Systems Explain Rapid Glyphosate Biodegradation Associated with Strong Isotope Fractionation. Environ. Sci. Technol. 52, 7259–7268. doi:10.1021/acs.est.8b01004
Ehrl, B. N., Kundu, K., Gharasoo, M., Marozava, S., and Elsner, M. (2019). Rate-Limiting Mass Transfer in Micropollutant Degradation Revealed by Isotope Fractionation in Chemostat. Environ. Sci. Technol. 53, 1197–1205. doi:10.1021/acs.est.8b05175
Ercan, O., Bisschops, M. M. M., Overkamp, W., Jørgensen, T. R., Ram, A. F., Smid, E. J., et al. (2015). Physiological and Transcriptional Responses of Different Industrial Microbes at Near-Zero Specific Growth Rates. Appl. Environ. Microbiol. 81, 5662–5670. doi:10.1128/AEM.00944-15
Fernandes, A. F. T., da Silva, M. B. P., Martins, V. V., Miranda, C. E. S., and Stehling, E. G. (2014). Isolation and Characterization of a Pseudomonas aeruginosa from a virgin Brazilian Amazon Region with Potential to Degrade Atrazine. Environ. Sci. Pollut. Res. 21, 13974–13978. doi:10.1007/s11356-014-3316-7
Gelman, A., and Rubin, D. B. (1992). Inference from Iterative Simulation Using Multiple Sequences. Statist. Sci. 7, 457–472. doi:10.1214/ss/1177011136
Gharasoo, M., Ehrl, B. N., Cirpka, O. A., and Elsner, M. (2019). Modeling of Contaminant Biodegradation and Compound-specific Isotope Fractionation in Chemostats at Low Dilution Rates. Environ. Sci. Technol. 53, 1186–1196. doi:10.1021/acs.est.8b02498
Graymore, M., Stagnitti, F., and Allinson, G. (2001). Impacts of Atrazine in Aquatic Ecosystems. Environ. Int. 26, 483–495. doi:10.1016/s0160-4120(01)00031-9
Guo, L., Jury, W. A., Wagenet, R. J., and Flury, M. (2000). Dependence of Pesticide Degradation on Sorption: Nonequilibrium Model and Application to Soil Reactors. J. Contaminant Hydrol. 43, 45–62. doi:10.1016/S0169-7722(99)00097-2
Hochman, D., Dor, M., and Mishael, Y. (2021). Diverse Effects of Wetting and Drying Cycles on Soil Aggregation: Implications on Pesticide Leaching. Chemosphere 263, 127910. doi:10.1016/j.chemosphere.2020.127910
Ingalls, B. (2008). Sensitivity Analysis: from Model Parameters to System Behaviour. Essays Biochem. 45, 177–194. doi:10.1042/bse0450177
Jablonowski, N. D., Schäffer, A., and Burauel, P. (2011). Still Present after All These Years: Persistence Plus Potential Toxicity Raise Questions about the Use of Atrazine. Environ. Sci. Pollut. Res. 18, 328–331. doi:10.1007/s11356-010-0431-y
Jablonowski, N. D., Köppchen, S., Hofmann, D., Schäffer, A., and Burauel, P. (2009). Persistence of 14C-Labeled Atrazine and its Residues in a Field Lysimeter Soil after 22years. Environ. Pollut. 157, 2126–2131. doi:10.1016/j.envpol.2009.02.004
Kästner, M., Nowak, K. M., Miltner, A., Trapp, S., and Schäffer, A. (2014). Classification and Modelling of Nonextractable Residue (NER) Formation of Xenobiotics in Soil - A Synthesis. Crit. Rev. Environ. Sci. Technol. 44, 2107–2171. doi:10.1080/10643389.2013.828270
Kiss, A., and Virág, D. (2009). Interpretation and Modelling of Environmental Behaviour of Diverse Pesticides by Revealing Photodecomposition Mechanisms. Microchem. J. 92, 119–122. doi:10.1016/j.microc.2008.12.002
Kiss, A., Rapi, S., and Csutorás, C. (2007). GC/MS Studies on Revealing Products and Reaction Mechanism of Photodegradation of Pesticides. Microchemical J. 85, 13–20. doi:10.1016/j.microc.2006.06.017
Kleineidam, S., Schüth, C., and Grathwohl, P. (2002). Solubility-Normalized Combined Adsorption-Partitioning Sorption Isotherms for Organic Pollutants. Environ. Sci. Technol. 36, 4689–4697. doi:10.1021/es010293b
Klier, C., Grundmann, S., Gayler, S., and Priesack, E. (2008). Modelling the Environmental Fate of the Herbicide Glyphosate in Soil Lysimeters. Water Air Soil Pollut. Focus 8, 187–207. doi:10.1007/s11267-007-9171-5
König, S., Vogel, H.-J., Harms, H., and Worrich, A. (2020). Physical, Chemical and Biological Effects on Soil Bacterial Dynamics in Microscale Models. Front. Ecol. Evol. 8, 53. doi:10.3389/fevo.2020.00053
Krutz, L. J., Shaner, D. L., and Zablotowicz, R. M. (2010). Enhanced Degradation and Soil Depth Effects on the Fate of Atrazine and Major Metabolites in Colorado and Mississippi Soils. J. Environ. Qual. 39, 1369–1377. doi:10.2134/jeq2009.0197
Kuenen, J. G. (2019). “Continuous Cultures (Chemostats),” in Encyclopedia of Microbiology. Editor T. M. B. T. E. o. M. F. E. Schmidt. 4 edn (Oxford: Academic Press), 743–761. doi:10.1016/B978-0-12-801238-3.02490-9
Kundu, K., Marozava, S., Ehrl, B., Merl-Pham, J., Griebler, C., and Elsner, M. (2019). Defining Lower Limits of Biodegradation: Atrazine Degradation Regulated by Mass Transfer and Maintenance Demand in Arthrobacter Aurescens TC1. Isme J. 13, 2236–2251. doi:10.1038/s41396-019-0430-z
Kundu, K., Weber, N., Griebler, C., and Elsner, M. (2020). Phenotypic Heterogeneity as Key Factor for Growth and Survival under Oligotrophic Conditions. Environ. Microbiol. 22, 3339–3356. doi:10.1111/1462-2920.15106
LaRowe, D. E., and Van Cappellen, P. (2011). Degradation of Natural Organic Matter: A Thermodynamic Analysis. Geochim. Cosmochim. Acta 75, 2030–2042. doi:10.1016/j.gca.2011.01.020
Lever, M. A., Rogers, K. L., Lloyd, K. G., Overmann, J., Schink, B., Thauer, R. K., et al. (2015). Life under Extreme Energy Limitation: a Synthesis of Laboratory- and Field-Based Investigations. FEMS Microbiol. Rev. 39, 688–728. doi:10.1093/femsre/fuv020
Link, K. G., Stobb, M. T., Di Paola, J., Neeves, K. B., Fogelson, A. L., Sindi, S. S., et al. (2018). A Local and Global Sensitivity Analysis of a Mathematical Model of Coagulation and Platelet Deposition under Flow. PLoS ONE 13, e0200917–38. doi:10.1371/journal.pone.0200917
López-Muñoz, M. J., Aguado, J., and Revilla, A. (2011). Photocatalytic Removal of S-Triazines: Evaluation of Operational Parameters. Catal. Today 161, 153–162. doi:10.1016/j.cattod.2010.10.076
Marozava, S., Meyer, A. H., Pérez-de-Mora, A., Gharasoo, M., Zhuo, L., Wang, H., et al. (2019). Mass Transfer Limitation during Slow Anaerobic Biodegradation of 2-Methylnaphthalene. Environ. Sci. Technol. 53, 9481–9490. doi:10.1021/acs.est.9b01152
Marschmann, G. L., Pagel, H., Kügler, P., and Streck, T. (2019). Equifinality, Sloppiness, and Emergent Structures of Mechanistic Soil Biogeochemical Models. Environ. Model. Softw. 122, 104518. doi:10.1016/j.envsoft.2019.104518
McKelvie, J. R., Mackay, D. M., de Sieyes, N. R., Lacrampe-Couloume, G., and Sherwood Lollar, B. (2007). Quantifying MTBE Biodegradation in the Vandenberg Air Force Base Ethanol Release Study Using Stable Carbon Isotopes. J. Contaminant Hydrol. 94, 157–165. doi:10.1016/j.jconhyd.2007.05.008
Mellage, A., Eckert, D., Grösbacher, M., Inan, A. Z., Cirpka, O. A., and Griebler, C. (2015). Dynamics of Suspended and Attached Aerobic Toluene Degraders in Small-Scale Flow-Through Sediment Systems under Growth and Starvation Conditions. Environ. Sci. Technol. 49, 7161–7169. doi:10.1021/es5058538
Mongodin, E. F., Shapir, N., Daugherty, S. C., DeBoy, R. T., Emerson, J. B., Shvartzbeyn, A., et al. (2006). Secrets of Soil Survival Revealed by the Genome Sequence of Arthrobacter Aurescens TC1. Plos Genet. 2, e214. doi:10.1371/journal.pgen.0020214
Morris, M. D. (1991). Factorial Sampling Plans for Preliminary Computational Experiments. Technometrics 33, 161–174. doi:10.1080/00401706.1991.10484804
Mudhoo, A., and Garg, V. K. (2011). Sorption, Transport and Transformation of Atrazine in Soils, Minerals and Composts: A Review. Pedosphere 21, 11–25. doi:10.1016/S1002-0160(10)60074-4
Novak, J. M., Jayachandran, K., Moorman, T. B., and Weber, J. B. (1995). Sorption and Binding of Organic Compounds in Soils and Their Relation to Bioavailability. In Bioremediation. Editors H. Skipper, and R. Turco, 13–31. doi:10.2136/sssaspecpub43.c2
Nwani, C. D., Lakra, W. S., Nagpure, N. S., Kumar, R., Kushwaha, B., and Srivastava, S. K. (2010). Toxicity of the Herbicide Atrazine: Effects on Lipid Peroxidation and Activities of Antioxidant Enzymes in the Freshwater Fish Channa Punctatus (Bloch). Ijerph 7, 3298–3312. doi:10.3390/ijerph7083298
Pagel, H., Kriesche, B., Uksa, M., Poll, C., Kandeler, E., Schmidt, V., et al. (2020). Spatial Control of Carbon Dynamics in Soil by Microbial Decomposer Communities. Front. Environ. Sci. 8, 2. doi:10.3389/fenvs.2020.00002
Pianosi, F., Sarrazin, F., and Wagener, T. (2015). A Matlab Toolbox for Global Sensitivity Analysis. Environ. Model. Softw. 70, 80–85. doi:10.1016/j.envsoft.2015.04.009
Pinheiro, M., Pagel, H., Poll, C., Ditterich, F., Garnier, P., Streck, T., et al. (2018). Water Flow Drives Small Scale Biogeography of Pesticides and Bacterial Pesticide Degraders - A Microcosm Study Using 2,4-D as a Model Compound. Soil Biol. Biochem. 127, 137–147. doi:10.1016/j.soilbio.2018.09.024
Pirt, S. J. (1982). Maintenance Energy: a General Model for Energy-Limited and Energy-Sufficient Growth. Arch. Microbiol. 133, 300–302. doi:10.1007/bf00521294
Pot, V., Portell, X., Otten, W., Garnier, P., Monga, O., and Baveye, P. C. (2021). Accounting for Soil Architecture and Microbial Dynamics in Microscale Models: Current Practices in Soil Science and the Path Ahead. Eur. J. Soil Sci.. doi:10.1111/ejss.13142
Roser, M. (2019). Pesticides. Our World in Data Https://ourworldindata.org/pesticides (Accessed September 20, 2020)
Sánchez, O. F., Lin, L., Bryan, C. J., Xie, J., Freeman, J. L., and Yuan, C. (2020). Profiling Epigenetic Changes in Human Cell Line Induced by Atrazine Exposure. Environ. Pollut. 258, 113712. doi:10.1016/j.envpol.2019.113712
Saltelli, A., Ratto, M., Andres, T., Campolongo, F., Cariboni, J., Gatelli, D., et al. (2008). Global Sensitivity Analysis: The Primer(West Sussex: Wiley).
Shi, A., Chakrawal, A., Manzoni, S., Fischer, B. M. C., Nunan, N., and Herrmann, A. M. (2021). Substrate Spatial Heterogeneity Reduces Soil Microbial Activity. Soil Biol. Biochem. 152, 108068. doi:10.1016/j.soilbio.2020.108068
Shipitalo, M. J., and Owens, L. B. (2003). Atrazine, Deethylatrazine, and Deisopropylatrazine in Surface Runoff from Conservation Tilled Watersheds. Environ. Sci. Technol. 37, 944–950. doi:10.1021/es020870b
Siek, M., and Paszko, T. (2019). Factors Affecting Coupled Degradation and Time-dependent Sorption Processes of Tebuconazole in mineral Soil Profiles. Sci. Total Environ. 690, 1035–1047. doi:10.1016/j.scitotenv.2019.06.409
Sigmund, G., Gharasoo, M., Hüffer, T., and Hofmann, T. (2020). Deep Learning Neural Network Approach for Predicting the Sorption of Ionizable and Polar Organic Pollutants to a Wide Range of Carbonaceous Materials. Environ. Sci. Technol. 54, 4583–4591. doi:10.1021/acs.est.9b06287
Silva, V., Mol, H. G. J., Zomer, P., Tienstra, M., Ritsema, C. J., and Geissen, V. (2019). Pesticide Residues in European Agricultural Soils - A Hidden Reality Unfolded. Sci. Total Environ. 653, 1532–1545. doi:10.1016/j.scitotenv.2018.10.441
Singh, S., Kumar, V., Chauhan, A., Datta, S., Wani, A. B., Singh, N., et al. (2018). Toxicity, Degradation and Analysis of the Herbicide Atrazine. Environ. Chem. Lett. 16, 211–237. doi:10.1007/s10311-017-0665-8
Stolpovsky, K., Martinez-Lavanchy, P., Heipieper, H. J., Van Cappellen, P., and Thullner, M. (2011). Incorporating Dormancy in Dynamic Microbial Community Models. Ecol. Model. 222, 3092–3102. doi:10.1016/j.ecolmodel.2011.07.006
Streck, T., Poletika, N., Jury, W. A., and Farmer, W. J. (1995). Description of Simazine Transport with Rate-Limited, Two-Stage, Linear and Nonlinear Sorption. Water Resour. Res. 31, 811–822. doi:10.1029/94WR02822
Thullner, M., Kampara, M., Richnow, H. H., Harms, H., and Wick, L. Y. (2008). Impact of Bioavailability Restrictions on Microbially Induced Stable Isotope Fractionation. 1. Theoretical Calculation. Environ. Sci. Technol. 42, 6544–6551. doi:10.1021/es702782c
Udiković-Kolić, N., Scott, C., and Martin-Laurent, F. (2012). Evolution of Atrazine-Degrading Capabilities in the Environment. Appl. Microbiol. Biotechnol. 96, 1175–1189. doi:10.1007/s00253-012-4495-0
Ugalde-Salas, P., Desmond-Le Quéméner, E., Harmand, J., Rapaport, A., and Bouchez, T. (2020). Insights from Microbial Transition State Theory on Monod's Affinity Constant. Sci. Rep. 10, 5323. doi:10.1038/s41598-020-62213-6
van Genuchten, M. T., and Wagenet, R. J. (1989). Two-Site/Two-Region Models for Pesticide Transport and Degradation: Theoretical Development and Analytical Solutions. Soil Sci. Soc. America J. 53, 1303–1310. doi:10.2136/sssaj1989.03615995005300050001x
Villaverde, J., van Beinum, W., Beulke, S., and Brown, C. D. (2009). The Kinetics of Sorption by Retarded Diffusion into Soil Aggregate Pores. Environ. Sci. Technol. 43, 8227–8232. doi:10.1021/es9015052
Vonberg, D., Vanderborght, J., Cremer, N., Pütz, T., Herbst, M., and Vereecken, H. (2014). 20 Years of Long-Term Atrazine Monitoring in a Shallow Aquifer in Western Germany. Water Res. 50, 294–306. doi:10.1016/j.watres.2013.10.032
Vrede, K., Heldal, M., Norland, S., and Bratbak, G. (2002). Elemental Composition (C, N, P) and Cell Volume of Exponentially Growing and Nutrient-Limited Bacterioplankton. Appl. Environ. Microbiol. 68, 2965–2971. doi:10.1128/aem.68.6.2965-2971.2002
Vrugt, J. A. (2016). Markov Chain Monte Carlo Simulation Using the DREAM Software Package: Theory, Concepts, and MATLAB Implementation. Environ. Model. Softw. 75, 273–316. doi:10.1016/j.envsoft.2015.08.013
Vryzas, Z., Papadopoulou-Mourkidou, E., Soulios, G., and Prodromou, K. (2007). Kinetics and Adsorption of Metolachlor and Atrazine and the Conversion Products (Deethylatrazine, Deisopropylatrazine, Hydroxyatrazine) in the Soil Profile of a River basin. Eur. J. Soil Sci. 58, 1186–1199. doi:10.1111/j.1365-2389.2007.00913.x
Yu, H., Liu, Y., Shu, X., Fang, H., Sun, X., Pan, Y., et al. (2020). Equilibrium, Kinetic and Thermodynamic Studies on the Adsorption of Atrazine in Soils of the Water Fluctuation Zone in the Three-Gorges Reservoir. Environ. Sci. Eur. 32, 27. doi:10.1186/s12302-020-00303-y
Zheng, L., Zhang, Y., Yan, Z., Zhang, J., Li, L., Zhu, Y., et al. (2017). Derivation of Predicted No-Effect Concentration and Ecological Risk for Atrazine Better Based on Reproductive Fitness. Ecotoxicol. Environ. Saf. 142, 464–470. doi:10.1016/j.ecoenv.2017.04.006
Keywords: pesticide persistence, modeling, atrazine degradation, thermodynamic constraints on biogeochemical processes, mass-transfer limitations
Citation: Chavez Rodriguez L, Ingalls B, Meierdierks J, Kundu K, Streck T and Pagel H (2021) Modeling Bioavailability Limitations of Atrazine Degradation in Soils. Front. Environ. Sci. 9:706457. doi: 10.3389/fenvs.2021.706457
Received: 07 May 2021; Accepted: 12 August 2021;
Published: 08 September 2021.
Edited by:
Monika Mortimer, China Jiliang University, ChinaReviewed by:
Lei Ren, Guangdong Ocean University, ChinaSara König, Helmholtz Centre for Environmental Research (UFZ), Germany
Copyright © 2021 Chavez Rodriguez, Ingalls, Meierdierks, Kundu, Streck and Pagel. This is an open-access article distributed under the terms of the Creative Commons Attribution License (CC BY). The use, distribution or reproduction in other forums is permitted, provided the original author(s) and the copyright owner(s) are credited and that the original publication in this journal is cited, in accordance with accepted academic practice. No use, distribution or reproduction is permitted which does not comply with these terms.
*Correspondence: Luciana Chavez Rodriguez, TC5DaGF2ZXpSb2RyaWd1ZXpAdW5pLWhvaGVuaGVpbS5kZQ==; Holger Pagel, aG9sZ2VycEB1bmktaG9oZW5oZWltLmRl