 Min Zhang1,2†
 Fang-rong Ren
- 1Business School, Hohai University, Nanjing, China
- 2Student Affairs Centre, Nanjing University of Posts and Telecommunications, Nanjing, China
- 3College of Economics and Management, Nanjing Forestry University, Nanjing, China
- 4School of Economics and Management, Harbin Institute of Technology at Weihai, Weihai, China
The rise of energy consumption has also increased emissions of the “three wastes” (wastewater, waste gas, and industrial solid waste), and environmental emergencies caused by pollutants, natural disasters, and production safety accidents have aroused social concerns. As few scholars have combined treatment efficiency of the three wastes with environmental emergencies to explore their relationships, this research thus uses a two-stage undesirable Data Envelopment Analysis (DEA) method to explore the situations of 4 regions and 30 provinces in China from 2013 to 2017 based on such interactive perspectives. The study finds that the overall regional environmental efficiency in China is generally low, and in terms of regional differences, the eastern and northeastern regions are better than the central and western regions. The efficiency values of the three wastes in China have also fluctuated greatly from 0.7 down to 0.2 in recent years. The efficiency of environmental emergencies in China is greatly impacted by the efficiency of environmental governance inputs. Based on the results, the study proposes that the eastern provinces can be an example for promoting balanced regional development and offers policy recommendations such as taking precautions against environmental emergencies.
Introduction
China is a large country in terms of energy production and consumption and has abundant energy resources, but exhibits low energy ownership per capita and low energy efficiency. With the continuous development of its domestic economy and society, China’s demand for energy continues to expand. The country’s large amount of energy consumption has greatly increased carbon emissions as well as waste gas, wastewater, and industrial solid waste (hereinafter referred to as “three wastes”) and other industrial pollutants. According to statistics, China’s wastewater discharge rose from 55.685 billion tons in 2007 to 69.966 billion tons in 2017, or 25.65% in 10 years.1 The amount of industrial SO2 smoke (powder) dust emissions has fluctuated, with annual production of industrial solid waste hitting 300 million tons and exhaust gas emissions rising from 38.86 trillion cubic meters in 2007 to 68.51 trillion cubic meters in 2015.2 The three wastes contain a variety of toxic and harmful substances that are discharged into the atmosphere, water, soil, and other environments without meeting the required standards, thus disrupting the ecological balance and causing adverse environmental events such as atmospheric pollution, water pollution, and soil pollution.
China’s urbanization and industrialization in recent years have achieved remarkable results, but have brought tremendous pressure on natural resources and serious environmental pollution at the same time (Chen and Jia, 2017; Zhou et al., 2019). Research has found that there are generally low environmental efficiency and large differences between regions and cities in China (Yang et al., 2015; Zhang et al., 2016; Peng et al., 2018; Yan et al., 2018; Zhou et al., 2019). To be more specific, one study has revealed that the environmental efficiency levels in most provinces are below 50% of the ideal or target level (Chang et al., 2013).
The three wastes produced by industries during the production stage lead to frequent severe environmental emergencies that endanger public health and the balance of the ecological environment (Kanellopoulos et al., 2021; Wójcik and Kostowski, 2020; Liu and Lin, 2019). In 2017, there were 302 environmental emergencies in China, among which one was pollution from the Hanzhong City Zinc Industry Copper Mine in Ningqiang County, Shaanxi Province, which contaminated Jialing River of Sichuan Province.3 The concentration of radon in the quality of drinking water source exceeded the standard by 4.6 times, which meant an inability to supply water in Guangyuan City of Sichuan for 3 days; it took 7 days until the emergency response was cancelled.4 The direct cause of the accident was the illegal processing of soot raw materials in multi-hearth furnaces by Han Zinc and Copper Mine and the illegal discharge of production wastewater. At the same time, the increasing trend of CO2 emissions in the process of China’s rapid industrialization has further exacerbated the risk and frequency of environmental emergencies caused by natural and social factors such as climate change, ecological degradation and environmental pollution. Therefore, this paper takes CO2 emission as the correlation point to evaluate the handling efficiency of industrial pollution and environmental emergencies in China, which is a necessity research from a unique perspective.
Environmental efficiency plays a significant role in social sustainability, economic development, and environmental protection. In order to evaluate environmental efficiency and guide sustainability development, various methodologies have been proposed to measure environmental efficiency performance. For instance, some researchers utilize stochastic Frontier analysis to estimate environmental efficiency (Reinhard et al., 2002; Zhou et al., 2015; Bibi et al., 2021); some researchers use the meta Dynamic Directional Distance Functions (DDF) model to calculate environmental efficiency in China (Long et al., 2018; Li et al., 2021a; Li et al., 2021b); still other researchers adopt the Slacks-Based Measure (SBM) model to measure environmental efficiency (Zhou et al., 2013a; Zhou et al., 2013b; Kang et al., 2017). However, most researchers generally adopt the DEA model to measure environmental efficiency. Previous research has examined eco-efficiency in terms of energy efficiency and CO2 emissions based on the DEA-Malmquist model (Martinez, 2013). Following that, some researchers evaluate environmental efficiency based on the relational two-stage DEA model (Shi, 2016), while other adopt the SBM-DEA model to analyze an airline’s environmental efficiency (Chen et al., 2020a). A few researchers use a three-stage DEA-Malmquiat model to measure the energy efficiency of the construction industry (Liang et al., 2021). Based on the above, this paper employs a two-stage dynamic DEA model to evaluate the efficiencies of energy consumption, CO2 emissions, the industrial three wastes, and environmental governance.
As to the indicators being used in the DEA model, some researchers have utilized labor and capital as inputs while taking GDP as the output (Christina and George, 2019). Other researchers have selected GDP, FDI, human capital, environmental governance investment, and so forth as inputs and industrial environmental efficiency as output (Chen et al., 2020b). Our research thus takes labor, fixed assets, energy consumption, and environmental pollution investment as inputs with GDP being the desirable output, and CO2, the three wastes, and environmental emergencies as undesirable outputs to examine environmental performance.
Economic development and investment in science and technology both have positive effects on environmental performance (Kortelainen, 2008; Green et al., 2016; Zhang, 2020). Environmental regulation (ER) is also regarded as an important driver of environmental improvement (Lin and Chen, 2020). Research further shows that the spatial dependence of an authority’s environmental management behavior is the greatest source of regional differences in urban environmental governance efficiency (Peng et al., 2021). Nevertheless, environmental regulation by a government does not always lead to positive results. Research has shown that environmental regulation can indirectly contribute to environmental degradation (Zhang et al., 2019). Based on the studies above, this paper innovatively takes CO2 and environmental pollution investment as inputs and environmental emergencies as the undesirable output in the environmental stage to evaluate environmental governance efficiency.
A circular economy is a sustainable development strategy aiming to improve the efficiency of materials and energy use (Su et al., 2013) and has the potential to break through the linear economy of unsustainable production and consumption (Kristensen and Mosgaard, 2020). Nevertheless, the circular economy is an evolving concept that still requires development to consolidate its definition, boundaries, principles, and associated practices (Merli et al., 2018). When considering the relationship between the circular economy and environmental performance, few studies have compared circularity indicators with environmental performance (Harris et al., 2021), while some have revealed that the present definitions of a circular economy show few explicit linkages of its concept to sustainable development (Kirchherr et al., 2017). The relationship between the circular economy and eco-innovation has been highlighted by some researchers (Prieto-Sandoval et al., 2018). Based on the literature above, this paper considers the relationship between the circular economy and environmental performance in order to better explore appropriate environmental governance measures and suggestions.
The related literature still needs further improvement in the following aspects. First, previous studies seldom consider the relationships among energy consumption, CO2 emissions, industrial waste, and environmental emergencies. Second, most studies evaluating the efficiency of these indicators mainly employ static analysis, making it impossible to understand the continuous development and the spatial distribution of environmental efficiency. Third, few studies adopt an appropriate variable to link together the production phase with the environmental governance phase. Fourth, although many industries produce the three wastes during the production stage and side effects from environmental regulation can be found in the environmental governance stage, few studies consider undesirable outputs during the two stages. Fifth, past studies seldom consider the linkage between the circular economy and environmental performance.
This study offers four main contributions. First, it adopts the modified undesirable dynamic network model and selects fixed assets as a carry-over variable to avoid the disadvantages and problems of static analysis. Second, this paper uses CO2 as one of the undesirable outputs in the production stage and one of the inputs in the environmental stage to link the first stage of production with the second stage of environmental governance. Third, in addition to discussing economic growth, energy consumption, and CO2 emission efficiency, this paper also adds undesired output efficiency assessments including three industrial wastes and environmental emergencies, which are combined with government environmental pollution treatment inputs, so as to better explore and sort out the internal relationship of all these factors. Fourth, this paper looks to combine the circular economy with environmental performance to find better solutions to environmental pollution.
The remainder of this paper is organized as follows. Section 2 presents the research method. Section 3 gives the empirical results and a discussion. Section 4 concludes.
Method and Model
Slacks-Based Measure Dynamic Data Envelopment Analysis
Economics commonly uses the term efficiency to describe the characteristics of the consumption of various resources. Efficiency mainly covers the relationship between input factors and output. Farrell (1957) employed the concept of the boundary production function to measure the level of production efficiency of decision-making units (DMUs), by connecting the most efficient production points into production boundaries, whereby the gap between any real production point and a production boundary indicates the degree of inefficiency of that production point. After being proposed by Farrell (1957), it was frequently utilized in various types of efficiency evaluation models. Charnes et al. (1978) published the DEA model based on Farrell’s boundary concept, while Banker et al. (1984) extended the hypothesis on returns to scale and proposed the BCC model that can measure Technical Efficiency (TE) and Scale Efficiency (SE). Since the CCR model and the BCC model measure radial efficiency, these two assume that the input or output can have an equal ratio adjustment (increasing or decreasing), but this assumption does not apply in some cases (Tone and Tsutsui, 2010). proposed the Slacks-Based Measure (SBM), using the difference variable as the measurement basis, while at the same time considering the difference between the input and output terms (slack). SBM efficiency is presented in a non-radial estimation method and has a single value (scalar) between 0 and 1. Tone and Tsutsui (2013) further proposed the weighted slack-based measures Dynamic Network DEA model and used the linkage among DMUs as the basis for the analysis of the Network DEA model, calling this a Sub-DMU. Carry-over activities are used as links and can be divided into 4 types: 1) desirable (good), 2) undesirable (bad), 3) discretionary, and 4) non-discretionary.
The Modified Undesirable Dynamic Network Model
This study utilizes panel data collected from 30 provinces in China, which are then divided into four regions according to different social and economic development levels. This paper takes labor and energy consumption as the input indicators and GDP, wastewater, waste gas, and solid waste as the output indicators to analyze energy efficiency and economic efficiency in the first stage of each province. Carbon dioxide is a link indicator, environmental pollution investment is an input indicator, and sudden environmental accidents are an output indicator in the second stage. The carry-over variable of fixed assets helps evaluate the efficiency of government environmental input in each province. Since this study considers undesirable output and regional differences in the dynamic network SBM model, it modifies (Tone and Tsutsui, 2010) dynamic network model to be an undesirable dynamic network model.
Suppose there are
Inputs and Outputs
Links
Carry-Overs
This paper notes that
The Overall efficiency will be calculated by the following formula (1).
The Period efficiency and Division efficiency will be calculated by the following formula 2 and 3 respectively.
To sum up, The Division period efficiency will be calculated by the following formula (4).
Subject to:
Labor, Energy, Environmental Pollution Investment, GDP, Wastewater, Waste Gas, Industrial Solid Waste, Abrupt Environmental Accidents, and CO2
There are nine key features of this present study: labor efficiency, energy efficiency, environmental pollution investment efficiency, GDP efficiency, wastewater efficiency, waste gas efficiency, industrial solid waste efficiency, abrupt environmental accidents efficiency, and CO2 efficiency. In this study, “i” represents area and “t” represents time. The nine efficiency models (5)–(13) are defined in the following.
If the target labor, energy, and environmental pollution investment inputs equal the actual inputs, then the efficiencies equal 1, indicating overall efficiency. If the target inputs are less than the actual inputs, then the efficiencies are less than 1, indicating overall inefficiency.
If the actual GDP desirable outputs equal the target desirable outputs, then efficiencies equal 1, indicating overall efficiency. If the actual desirable outputs are less than the target desirable outputs, then efficiencies are less than 1, indicating overall inefficiency.
If the target wastewater, waste gas, industrial solid waste, abrupt environmental accidents, and CO2 undesirable outputs are equal to the actual undesirable outputs, then efficiencies equal 1, indicating overall efficiency. If the target undesirable outputs are less than the actual undesirable outputs, then efficiencies are less than 1, indicating overall inefficiency.
The total efficiency value or sub-efficiency value calculated in this paper is dimensionless and only represents the advantages and disadvantages of efficiency or its changing trend in the (0, 1] interval.
KMO and Bartlett Test
The KMO test is used to examine the partial correlation between variables, and the value is between 0 and 1. The closer the KMO value is to 1, the stronger is the correlation between variables, and the more suitable the original variables are for factor analysis. The closer the KMO value is to 0, the weaker is the correlation between variables, and the less suitable the original variables are for factor analysis.
The core idea of the Bartlett test is to find the chi-square statistics between different groups and then to judge whether the variance between groups is equal according to the chi-square statistics. When the correlation is strong, the value approaches 1, which illustrates that the data are suitable for factor analysis.
Table 1 describes the KMO and Bartlett test result. It can be seen that the KMO value is 0.828, which is higher than 0.8. The Sig value is 0, which shows that the data support principal component analysis.

TABLE 1. KMO and Bartlett test result.
Table 2 shows the KRUSKAL’s Algorithm Wallis test result. According to it, the Sig of most variables is higher than 0.9, and only the Sig of waste gas is 0. Therefore, it is proved that most indicators are significant.
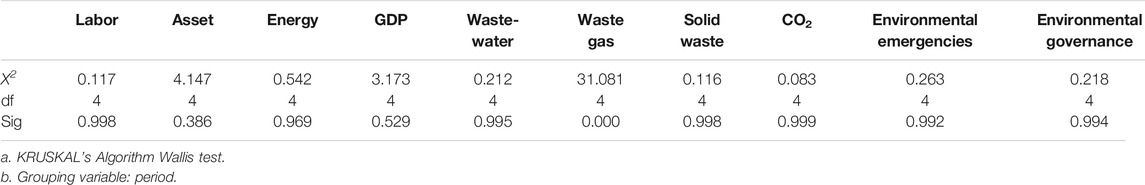
TABLE 2. KRUSKAL’s Algorithm Wallis test.
Empirical Study
Data Sources and Description
With reference to the regional division criteria published by the National Bureau of Statistics of China, this research collected data from 30 provincial-level administrative regions in the four major areas of eastern, central, western, and northeastern China in 2013–2017. The western Tibet autonomous region is excluded due to a serious lack of data. Table 3 shows the specific situation of each region.

TABLE 3. Provinces and cities of the four major regions.
Data were extracted from the Statistical Yearbook of China, the Demographics and Employment Statistical Yearbook of China, and the Environmental Yearbook of China from 2014–2018. Among them, the Stage 1 (production stage) and the Stage 2 (environment stage) have their own input and output variables respectively. As the connection between the Stage 1 and the Stage 2 environmental stage, CO2 comprehensively considers the cross stage and cross time energy consumption, environmental pollution and environmental emergencies. Therefore, the efficiency of single-stage and two-stage can be evaluated and measured respectively.
The Stage 1 mainly measures the economic development brought by energy consumption and the output efficiency of industrial three wastes. The Stage 2 mainly measures the change in the output efficiency of environmental emergencies after the investment of environmental pollution control funds. The total efficiency values of Stage 1 and Stage 2 will represent the assessment results of CO2, environmental emergencies, and industrial pollution in China from the perspective of the circular economy. The variables in the study are explained in Table 4 as follows.

TABLE 4. Input and output variables.
Stage 1: Production stage
Input variables:
Labor: This study uses the numbers of employees in each region at the end of each year. Unit: 10,000 persons.
Energy: Calculated from the total energy consumption in each province. Unit: 100 million tons.
Fixed assets: The total amount of work done by the whole society in building and purchasing fixed assets and related expenses. Unit: 100 million RMB.
Output variables:
Desirable output (GDP): It refers to the final result of production activities of all resident units in a region calculated by the market price in a year. Unit: 100 million RMB.
Undesirable output (Wastewater): The total discharge of wastewater refers to the total discharge of industrial wastewater and domestic sewage. Unit: 10,000 tons.
Undesirable output (Waste gas): According to the standard state (273K, 101325 Pa), this denotes the total amount of pollutant gases discharged into the air by various fuel combustion and production processes in each province. Unit: 100 million standard cubic meters.
Undesirable output (Industrial solid waste): The solid wastes discharged in the process of industrial production mainly include various waste residues, dust, and other waste types discharged into the environment. Unit: 10,000 tons.
Link variable of Production Stage and Environmental Stage:
CO2: Data on CO2 emissions for each city are estimated from the energy consumption breakdown by each fuel category. Unit: tons.
Stage 2: Environmental Stage.
Input variable:
Environmental pollution investment: The total amount of a region’s investment in environmental pollution controls each year. It consists of three parts: investment in urban environmental infrastructure construction, investment in industrial pollution control, and investment in environmental protection acceptance projects. Unit: 10,000 RMB.
Output variable:
Undesirable output (Abrupt environmental accidents): Accidents are due to factors such as pollutants discharging toxic and harmful substances into the atmosphere, water, soil, and other environmental medium that will suddenly cause environmental degradation and endanger public health and property safety. Abrupt environmental accidents need to take urgent measures, such as that from air pollution, water pollution, soil pollution, sudden environmental pollution incidents, etc. The data comes from the statistics of abrupt environmental accidents conducted by the Ministry of Ecology and Environment every year. And according to the economic loss, casualties and other serious degree caused by the accidents, divided into four grades: extraordinarily serious, serious, comparatively serious and ordinary. The data used in this paper is the total times of four kinds of accidents. Unit: Number of occurrences per year.
One of the advantages of the DEA method is that it is not affected by input-output units and does not affect the final efficiency evaluation result due to the difference of measurement units. In order to ensure the accuracy of relevant data, the input-output index in this paper retains the original units of measurement in the statistical yearbook without conversion. Figure 1 presents the framework of the two stages and input-output indicators.
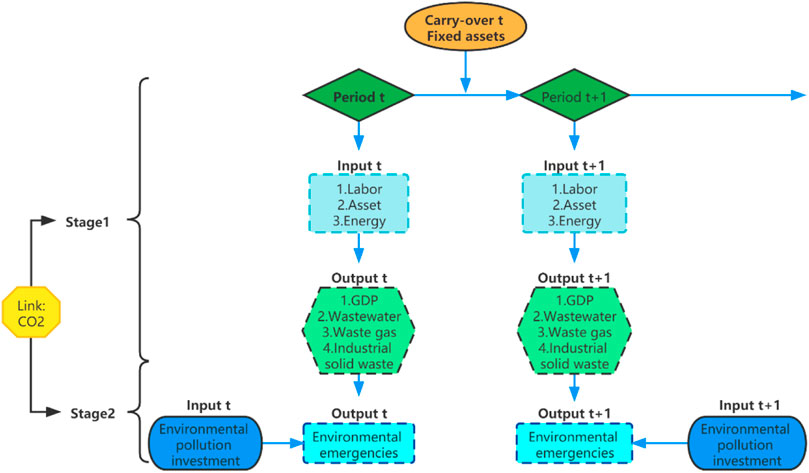
FIGURE 1. The framework of the two stages and input-output indicators.
Statistical Description
Figure 2A presents the statistical analysis of the energy input variable in the first stage. It can be seen that the maximum value of energy input in the provinces has increased year by year, and the minimum value, mean value, and standard deviation all show small increases. In recent years, the energy input of most provinces has been relatively stable, while that of some provinces has increased, and the gap between regions has widened.
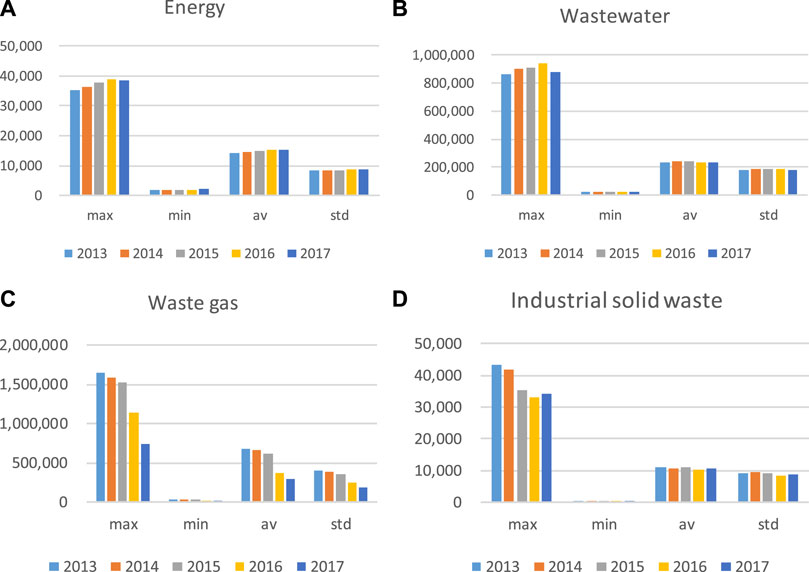
FIGURE 2. (A)Statistical analysis of energy (B) Statistical analysis of wastewater. (C) Statistical analysis of waste gas (D) Statistical analysis of industrial solid waste.
Figures 2B–D illustrate the statistical analysis of wastewater, waste gas, and industrial solid waste in the first stage. From the results listed above and according to the perspective of the comparison between the variables, the minimum values of the three wastes are small and exhibit a large gap between the maximum values. The change in wastewater discharge is relatively slow between 2013 and 2017, showing a slight increase in the maximum value and a small fluctuation in the minimum value, mean value, and standard deviation; the maximum value and the mean value of waste gas emissions show a large decreasing trend. The minimum value does not change significantly, and the gap between provinces has also narrowed year by year; the maximum value of industrial solid waste emissions continued to decline during 2013–2016 and increased in 2017. The minimum value continues to remain low, and its average value and standard fluctuations are also smaller.
Figures 3A,B present statistical analysis of the environmental variable of CO2 and the two-stage output variables. It can be seen that the maximum value of CO2 emissions (as the connection variable) gradually increases, the minimum and mean values remain stable, and the standard deviation value shows a small increase, indicating that the gap between provinces has increased. The maximum value of environmental emergencies showed a downward trend between 2013 and 2016, of which the largest decline occurred between 2013 and 2014, with the minimum value being 0. The mean and standard deviation also show a downward trend year by year, denoting that the prevention and control of environmental emergencies in China are effective.
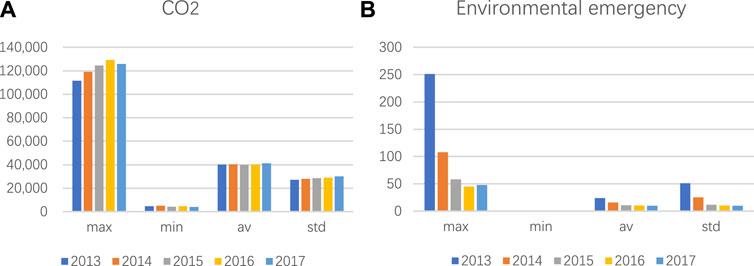
FIGURE 3. (A) Statistical analysis of CO2 (B) Statistical analysis of environmental emergency.
Total Efficiency Analysis
Table 5 shows the total efficiency score of the two stages of each province from 2013 to 2017. It is clearly seen that the first-stage efficiency values of Beijing, Jiangsu, Shanghai, Tianjin, and Inner Mongolia remained at 1 for five consecutive years. However, no province or city could maintain the optimal second-stage efficiency. Only Tianjin and Inner Mongolia achieved the optimal second-stage efficiency in 2016, but their efficiency declined in 2017. The specific ranking analysis runs as follows.
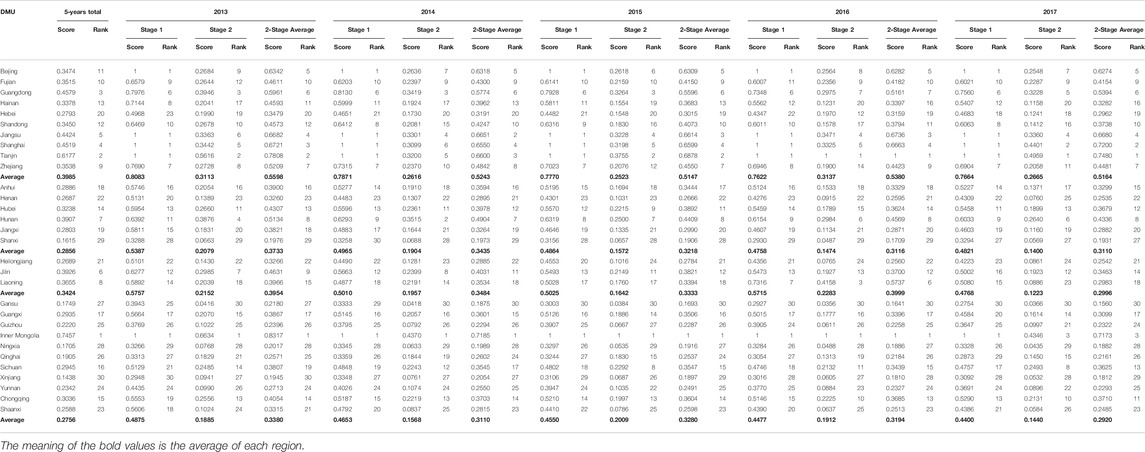
TABLE 5. Total efficiency score of the two stages.
Some provinces and cities, mainly in the eastern region, are very efficient at both stages. Representative provinces are Tianjin, Inner Mongolia, Beijing, Jiangsu, and Shanghai. The efficiency value of Tianjin and Inner Mongolia in the first stage reached the optimal level for five consecutive years, and their efficiency value of the second stage was around 0.7, ranking the top in China. This result explains that the efficiency of environmental governance in these areas has effectively improved during the past 5 years thanks to the increasing investment in environmental protection governance as well as the gradual enhancement of the public’s environmental protection awareness.
To be more specific, Inner Mongolia ranked first in efficiency in the second phase for four consecutive years. In 2017 its efficiency value dropped from 1 to 0.4346, falling to third place. Although Beijing, Jiangsu, and Shanghai ranked among the top 10 in efficiency scores for the second stage, they were still inadequate compared with that of the first stage. The above provinces and cities have given consideration to both production and environmental governance, effectively improved the handling efficiency of local environmental emergencies in the last years. However, environmental pollution cases still occurred in these areas during recent years. For example, many parts of Inner Mongolia suffered severe air pollution in January 2021,5 while heavy air pollution still exists in Beijing, Tianjin, and other places. China is now in a period of accelerated industrialization, and so appropriate environmental policies and measures need to be taken to further ease the environmental pressure caused by the country’s rapid economic development.
Some provinces, mainly in the central and western regions, scored low on efficiency in both stages. Example provinces are Shanxi and Gansu, among which the total efficiency value of Shanxi in 5 years is less than 0.2, ranking between 27 and 30. The efficiency values in the first and second stages are low, as and the efficiency score increased slightly or even showed a negative growth trend. The total efficiency of Gansu province in 5 years is 0.18. The efficiency score of the first stage decreased gradually, but the efficiency score of the second stage only remained around 0.04, and the efficiency rank of the second stage was in last place for five consecutive years. The low efficiency in Shanxi and Gansu in the first stage means that industrial waste and CO2 emissions have not been effectively reduced, which further affect the efficiency of the second stage of environmental governance and ultimately lead to a very low overall efficiency. In 2019, there were illegal cases of environmental pollution caused by Xiaoyi Zhen Ping Tao Cun Tu oil refinery, Shanxi Chengxin Seed, Lianzhong Fine Chemical Technology, and Fenyang Huarui Rubber in Shanxi,6 which offer evidence of the low environmental efficiency of Shanxi. As to Gansu Province, a statistical report released by its Department of Ecological Environment showed in the first half of 2019 that environmental protection departments at all levels in the province participated in the dispatch and disposal of five environmental pollution-prone emergencies, of which one was a general environmental emergency,7 which means that efficient measures need to be taken to further prevent the environmental pollution cases.
Some provinces have low efficiency in the first stage and high efficiency in the second stage. Hunan, Sichuan, Jilin, and Chongqing are such provinces. Among them, Jilin and Hunan ranked in the top 10 in efficiency in the second stage, ranked in the middle in efficiency in the first stage, and finally ranked sixth and seventh in total efficiency. That means the two provinces lead the country in pollution control, but are less productive than other provinces and cities. Therefore, these two provinces and cities should pay more attention to technology research and development and promote the development of their high-tech industry to enhance the social production efficiency in the first stage, reduce the emissions of industrial waste and emissions of pollutants produced by low-end manufacturing industries, and reduce pollution from the source, so as to promote significant improvement of efficiency in both two stages.
Figure 4 is a chart that shows the specific changes in stages 1–2 of each province. In China the production efficiency value in the first stage is generally higher than the environmental efficiency value in the second stage. The total efficiency is more affected by the efficiency of the second stage, and there is a big gap between the efficiency scores of the two stages in most provinces. Ever since the 18th National Congress of the Communist Party of China (CPC), the country has put forward a system of third-party treatment of energy conservation, emission reduction, and environmental pollution. All sectors of the country attach great importance to promoting the utility maximization of energy consumption, CO2, and industrial waste emissions. Therefore, the efficiency of the first stage is generally high. However, on the whole, China’s industry has not moved away from a development model featuring high investment, high consumption, high emissions, and high consumption of resources and energy. Ecological and environmental problems are prominent, and environmental emergencies occur from time to time. However, relevant data show that the growth rate of energy conservation and environmental protection expenditure was between 8 and 15% in 2013, 4.1% in 2014, and 0.8% in 2016.8 This indicates that since 2013, the annual growth rate of fiscal energy conservation and environmental protection has been on the decline, indicating that the tilt of fiscal expenditure in pollution prevention and control is far from sufficient, which leads to the low efficiency value of China in the second stage to a certain extent.
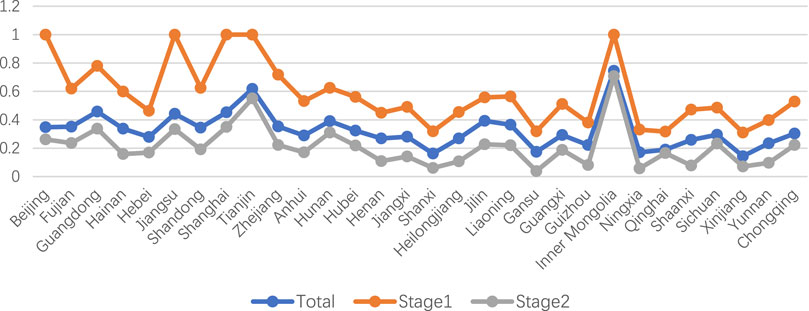
FIGURE 4. Total efficiency trend of stages 1–2.
Figure 5 is a chart of the total efficiency values of the provinces in the four regions. It can be clearly seen from the figure that the overall rankings of the provinces in the east and northeast are higher than those in the central and west. Except for Inner Mongolia, which ranks first, the overall efficiency rankings of other western provinces and cities are in the middle and lower levels of the country overall.
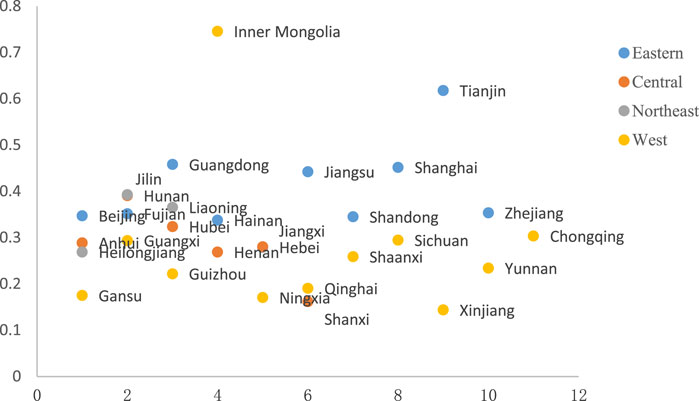
FIGURE 5. Total efficiencies of the four regions.
There is a large gap between the efficiency rankings of the provinces in the eastern region and the western region. Shanghai, Tianjin, Jiangsu, and Guangdong in the eastern region lead the country in efficiency, among which Tianjin ranks first at 0.62 while the efficiency values of Shandong, Hainan, and Hebei are relatively low at 0.34, 0.34, and 0.28, respectively. Aside from Inner Mongolia, Chongqing, Sichuan, and Guangxi being in the upper reaches of the country’s efficiency ranking scoring at 0.75, 0.3, 0.29, and 0.29, respectively, the efficiency scores of provinces in the west are all way behind, and the least efficient province, Xinjiang, which scores at 0.14, is also located in the western region.
In terms of total efficiency, the eastern region is higher than other regions, while the western region has the lowest efficiency. The overall efficiency of provinces and cities in the eastern region and the western region is unbalanced. The policy of reform and opening up has led to the development of the eastern coastal areas moving quickly ahead of the central and western inland areas. In addition, the geographical, human, and natural advantages of the eastern region have also promoted economic, cultural, and political exchanges with the outside world and promoted the development of science and technology. Therefore, the efficiency of the eastern region is higher than that of the western region. On the one hand, the imbalance of regional efficiency development is due to the social contradictions caused by the imbalance of economic development. On the other hand, the expenditures on energy conservation and environmental protection vary greatly and are not stable.
Sub-Index Efficiency
Figure 6 shows the comparison of the efficiencies of wastewater, exhaust gas, and solid waste in the four regions from 2013 to 2017. As is depicted in the charts, overall the efficiency of the three indicators is the highest in the eastern region and there is a big gap in the efficiency of exhaust gas and solid waste between the east and the other three regions.
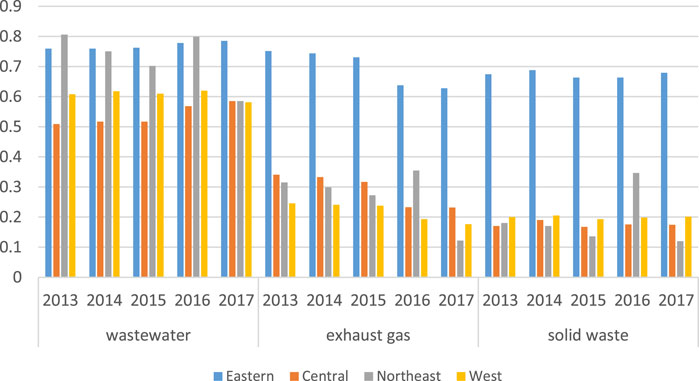
FIGURE 6. Comparison of the three indicators in the four regions from 2013 to 2017.
In terms of spatial and temporal differences, aside from the efficiency of wastewater being the highest in the northeastern region in 2013 and 2016, the eastern region has the highest scores of all three indicators over the years, and wastewater efficiency in the central region is generally low, reaching a trough at 0.5086 in 2013, but then increased to 0.5851 in 2017. As to the efficiency of exhaust gas, it is clearly seen that all the regions have a generally downward trend, among which the northeast has declined the most greatly from 0.3152 in 2013 to 0.1221 in 2017. As to the efficiency of solid waste, there is a large gap between the east and the other three regions. In 2017, the eastern region reached the highest at 0.6786, while the northeastern region hit the lowest at 0.1202. While the other three regions are slightly volatile, the northeastern region declined from 0.1804 in 2013 to 0.1202 in 2017. Therefore, a conclusion can be drawn that the eastern region has relatively higher efficiency scores of the three indicators while the other three regions are relatively high in the efficiency of wastewater and relatively low in that of exhaust gas and solid waste. To some extent, the result reveals the differences between the eastern and western regions in carrying out environmental protection responsibility and a lack of motivation and atmosphere for carrying out environmental protection measures in the western regions.
To be more specific, the eastern region overall performs better than the other regions, showing that its average three-waste efficiency score has a leading position over the years. The average scores of waste gas and industrial solid waste in the eastern region are much higher than in other regions, and there is little difference in the three wastes’ efficiency among the central, northeastern, and western regions. In terms of wastewater treatment efficiency, all the regions are at medium and high levels; in terms of the efficiency of waste gas treatment, the four regions all show a downward trend; in terms of solid waste treatment efficiency, the northeastern region has the largest annual change while the other three regions are slightly volatile.
Table 6 shows the efficiency value of the indicators in the four regions from 2013 to 2017. It can be clearly seen from the table that overall the efficiency scores of wastewater, waste gas, and industrial solid waste are higher than the efficiency scores of abrupt environmental accidents, which are lower than 0.1 in most provinces and cities. Beijing, Jiangsu, Shanghai, Tianjin, and Inner Mongolia remain at an optimal efficiency value of 1 in wastewater, waste gas, and industrial solid waste, while their efficiency value of abrupt environmental accidents is relatively low, with Beijing reaching 0 in 2016 and 2017 and Shanghai reaching 0 in 2017. There are also many provinces whose abrupt environmental accidents efficiency is 0 in 2017, including Fujian, Guangdong, Hainan, and Shanghai in the eastern region, Hubei, Hunan, and Jiangxi in the central region, Liaoning in the northeastern region, and Guangxi, Guizhou, Sichuan, Xinjiang, Yunnan, and Chongqing in the western region. Therefore, the authority should attach greater importance to the governance of environmental emergencies and reduce the environmental pollution to prevent abrupt environmental accidents.
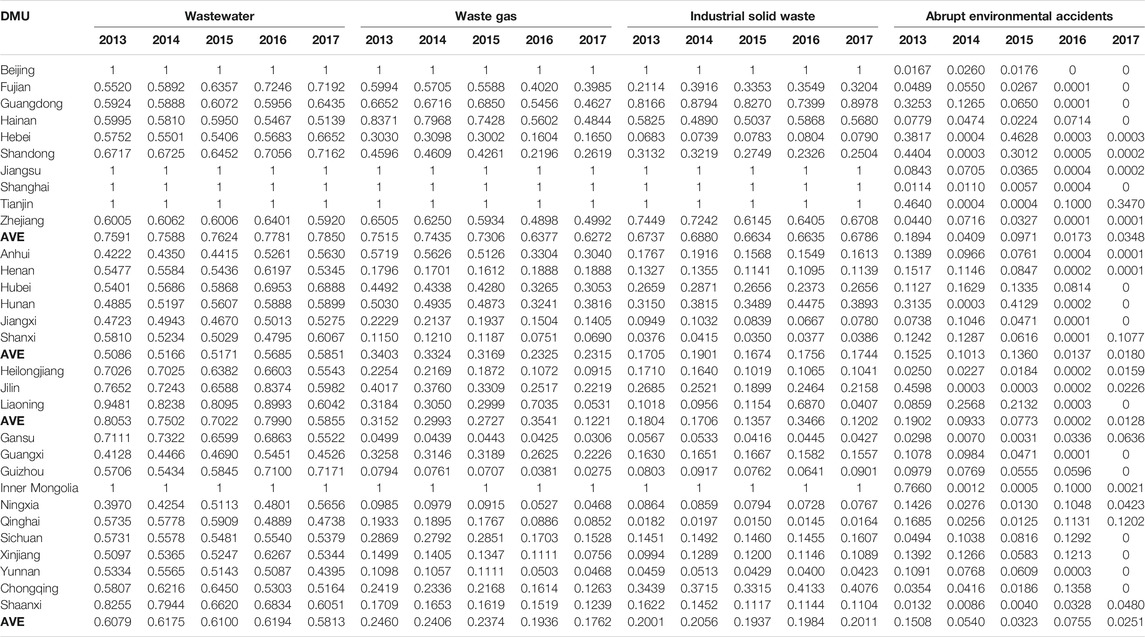
TABLE 6. The efficiency values of the indicators.
In terms of wastewater, the efficiency value is high overall, as can be seen by the average of all regions from 2013 to 2017 being greater than 0.5. The efficiency value of waste gas is lower than the efficiency value of wastewater overall, and there is a big difference between the eastern region and other regions in terms of the average value. The average values of the eastern region from 2013 to 2017 are all higher than 0.6, while the other regions are at a lower-level fluctuating from 0.1221, the lowest value, to 0.3541, the highest value. There is also a big difference between the eastern region and other regions as to the efficiency value of industrial solid waste, which is higher in the eastern region than in the other regions. The average value of the eastern region from 2013 to 2017 is all over 0.6, while the other regions keep fluctuating around 0.2.
Figure 7 shows the 5-year average efficiency of energy and CO2 in the four regions respectively. It is clearly seen that the efficiency of energy is higher than CO2 except for Qinghai and Sichuan, and there is little difference between the efficiencies of energy and CO2 in most provinces and cities except for Hebei, Zhejiang, and Qinghai, which reveals the positive relation between energy efficiency and carbon emission efficiency.
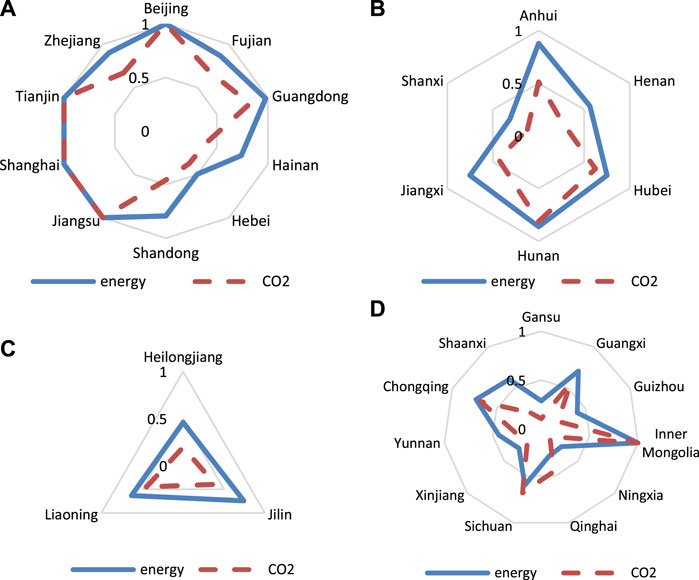
FIGURE 7. (A) Five-year average efficiency of energy and CO2 in the eastern region. (B) Five-year average efficiency of energy and CO2 in the central region. (C) Five-year average efficiency of energy and CO2 in the northeastern region. (D) Five-year average efficiency of energy and CO2 in the western region.
In the eastern region, the efficiency scores of energy and CO2 are overall higher than 0.6 except that Hebei has efficiency scores lower than 0.5 in both indicators. Hainan and Shandong have high efficiency scores of energy at 0.74 and 0.79, while their CO2 efficiency scores are lower at 0.39 and 0.46, respectively. The efficiency scores of energy and CO2 vary greatly in the western regions. While Inner Mongolia reaches 1 in both energy and CO2 efficiency, some provinces like Ningxia and Gansu have lower energy efficiency at 0.28 and lower CO2 efficiency at 0.11. Shaanxi has a big gap between efficiency scores of the two indicators. While its energy efficiency reaches 0.6, its CO2 efficiency is low at 0.19.
The efficiency of energy and CO2 is overall much higher in the eastern region than in other regions. This indicates that the eastern region performs well in the use of energy and the control of CO2 emissions. This is probably due to the widespread use of clean energy in the region and the higher level of industrial development and industrial production technologies in east China.
Figure 8 exhibits the 5-year efficiency scores of government environmental investment, CO2, and abrupt environmental emergency for the 30 provinces and cities. It can be clearly seen from this chart that the efficiency scores of abrupt environmental emergencies in the 30 provinces are at a low level, ranging from 0 to 0.2, and there is a big gap between the efficiencies of abrupt environmental emergency and CO2 in most provinces and cities. Beijing, Jiangsu, Shanghai, Tianjin, and Inner Mongolia have optimal efficiency scores of CO2 at 1, while their efficiency scores of abrupt environmental emergencies are below 0.1. Since the government environmental investment efficiencies in the 30 regions are lower than 0.5 except Tianjin at 0.63, and some of the provinces even hit a score lower than 0.1, the efficiency scores of abrupt environmental emergencies are at a low level with no province reaching 0.2.
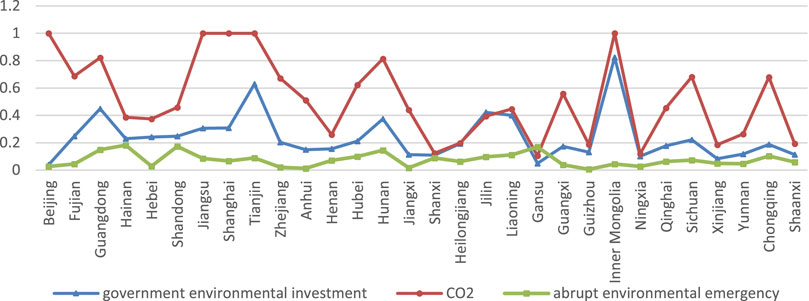
FIGURE 8. Five-year average efficiency of government environmental investment, CO2, and abrupt environmental emergency for the 30 provinces and cities.
The discussion above illustrates that China has attached great importance to the CO2 emission problem and has taken some effective measures to resolve it. However, the CO2 emission efficiency in some regions are still in a low level, which means that more efficient measures still need to be taken for the improvement of CO2 emission efficiency. It also can be seen that there is still much room for the improvement of the efficiency of abrupt environmental emergency.
Conclusions and Recommendations
Discussion
Comparing the results of this paper with those of previous studies like Chen et al. .(2017), Zhang et al., 2016), Kortelainen (2008), Zhang et al. (2019), and Dong et al. (2008), some similarities and differences can be found as follows.
First, this research finds in terms of total efficiency that the eastern region has higher efficiency than other regions, while the western region has the lowest efficiency, and the overall efficiency of provinces and cities in the eastern region and the western region remain unbalanced. This is consistent with the conclusion by Chen et al. (2017) and (Zhang et al., 2016) that the environmental efficiency of different regions in China varies greatly and has a spatial pattern of high efficiency in the east and low efficiency in the west.
Second, Dong et al. (2008) showed that China’s environmental governance efficiency is low. Only one-third of provinces and cities have high governance efficiency, which is a bit different from this research. Dong et al. (2008) also found that government environmental investment is an important factor for environmental governance performance, which is consistent with the conclusion of this research.
Third, overall environmental performance is affected by the change in technology investment and economic development as shown by Kortelainen (2008) and Zhang et al. (2019). However, our study does not specifically consider these factors above, although the impact of environmental governance input in the environmental governance stage is considered. It is shown that the efficiency of environmental emergencies is affected to a certain extent by the efficiency of environmental governance inputs. However, it is not so clear to what extent is the influence and which other specific inputs can be included.
Conclusion
From the above research, some conclusions can be drawn as follows.
First, in terms of total efficiency, the eastern region has the highest efficiency, while the western region has the lowest efficiency, which explains that the efficiency of environmental governance in the eastern areas has effectively improved during the past 5 years. However, environmental pollution cases still occurred in Inner Mongolia, Beijing, Tianjin, and some other regions during recent years. Appropriate environmental protection methods should be taken to further solve the environmental problems caused by the rapid industrialization of China.
Second, the efficiency in the first stage is much higher than that in the second stage, and most provinces score lower than 0.3 in the second stage, causing total efficiency to be generally low. Some provinces, mainly in the central and western regions where there are some illegal cases of pollution, scored low on efficiency in both stages, demonstrating the urgency of taking more efficient measures to protect the environment. Hunan, Jilin, and some other areas have low efficiency in the first stage, but high efficiency in the second stage, leading the country in pollution control, but they are less productive than other provinces and cities. Therefore, technology research and development should be stressed to improve social production efficiency in these regions.
Third, the efficiency of three wastes is much higher in the eastern region than that in the other regions. Moreover, there is little difference in the three wastes’ efficiency among the central, north, and west regions, which reflects the lack of responsibility and motivation for carrying out environmental protection measures in these three regions.
Fourth, the efficiency of energy is higher than CO2 in all provinces and cities except Qinghai and Sichuan, and there is little difference between the efficiency of energy and CO2 except for Hebei, Zhejiang, and Qinghai, which reveals the positive relation between energy efficiency and CO2 efficiency. Overall, the efficiency of energy and CO2 is higher in the east than that in other regions, indicating that the eastern region is more efficient in the utilization of energy and the control of carbon emissions.
Fifth, the efficiency scores of abrupt environmental emergency in the 30 provinces are at a low level, ranging from 0 to 0.2, probably because of the low efficiency of governmental investment for the environment. This indicates that there is still much room for improvement in the governance of abrupt environmental emergency.
Recommendations
The Following Recommendations Are Offered
First, the demonstration role of the eastern region should be brought into play. By following the eastern region’s better efficiency, the Chinese government can push its central and western regions to improve their energy use efficiency, the efficiencies of their three wastes’ treatments, the efficiency of environmental emergencies, and the efficiency of environmental input in order to improve overall environmental efficiency, reduce regional disparities, and promote balanced development domestically. To this end, efforts can be made at three major levels. At the enterprise level, the use of coal resources should be replaced with clean energy and renewable energy, and industrial standards should be set up to help discharge emissions after treatment. The central government should strengthen its overall supervision of the environment by introducing targeted policies and regulations to encourage enterprises and individuals to use clean and renewable energy. Individuals should practice environmental protection concepts, advocate green and low-carbon living, and implement waste classification according to local conditions so as to improve waste treatment efficiency.
Second, provinces and cities should increase the efficiencies of wastewater, waste gas, and solid waste treatment while placing greater emphasis on environmental emergencies. To improve the three wastes’ treatment efficiencies, relevant laws and regulations must be improved, and corresponding administrative management systems and technical specifications should be gradually initiated to control the discharge of the three pollutants through the collection of sewage charges. In response to environmental emergencies caused by pollution, the central government should increase investment in environmental governance to build a response network for such emergencies (such as an early warning system for toxic and harmful gases in chemical parks), improve risk inspection, and disclose government information and data sharing mechanisms in order to improve the efficiency of environmental emergencies, accurately grasp the spread of pollutants and changes in environmental quality, and provide a basis for scientific disposal.
Third, the central and local governments can inform the media and the public in a timely manner of the truth about accidents and the cleanup being done by the ecological environment department, take the initiative to guide public opinion, and offer solutions to maintain social stability. The authorities must also proactively investigate the causes of accidents, quickly investigate the sources of pollution, and take effective measures to reduce the degree of pollution and ecological damage in order to reduce economic and social losses caused by environmental emergencies. Finally, related agencies must strengthen their daily environmental management to achieve the goal of “protection first” as well as to continuously improve and encourage people to participate in the work of environmental governance supervision and reporting systems.
Data Availability Statement
The original contributions presented in the study are included in the article/Supplementary Materials, further inquiries can be directed to the corresponding author.
Author Contributions
Conceptualization, MZ; methodology, F-rR; software, ZT; validation, Y-yS and F-rR; formal analysis, H-sC; investigation, H-sC; resources, MZ; data curation, F-rR; writing—original draft preparation, H-sC and Y-yS; writing—review and editing, Y-yS and MZ; visualization, F-rR; supervision, ZT; project administration, MZ; funding acquisition, F-rR.
Conflict of Interest
The authors declare that the research was conducted in the absence of any commercial or financial relationships that could be construed as a potential conflict of interest.
Publisher’s Note
All claims expressed in this article are solely those of the authors and do not necessarily represent those of their affiliated organizations, or those of the publisher, the editors, and the reviewers. Any product that may be evaluated in this article, or claim that may be made by its manufacturer, is not guaranteed or endorsed by the publisher.
Supplementary Material
The Supplementary Material for this article can be found online at: https://www.frontiersin.org/articles/10.3389/fenvs.2021.709476/full#supplementary-material
Footnotes
1Data source: National Bureau of Statistics of China, http://data.stats.gov.cn/.
2Data source: National Bureau of Statistics of China, http://data.stats.gov.cn/.
3Data source: http://env.people.com.cn/n1/2018/0323/c1010-29884708.html.
4Data source: http://env.people.com.cn/n1/2018/0323/c1010-29884708.html.
5https://baijiahao.baidu.com/s?id=1688763600958313526&wfr=spider&for=pc.
6Data source: http://www.shanxi.gov.cn/yw/sxyw/201905/t20190514_640443.shtml.
7Data source: https://baijiahao.baidu.com/s?id=1639008471088397145&wfr=spider&for=pc.
8China Environmental Strategy and Policy Research Report, no. 289, 2018.
References
Bampatsou, C., and Halkos, G. (2019). Economic Growth, Efficiency and Environmental Elasticity for the G7 Countries. Energy Policy 130, 355–360. doi:10.1016/j.enpol.2019.04.017
Banker, R. D., Charnes, A., and Cooper, W. W. (1984). Some Models for Estimating Technical and Scale Inefficiencies in Data Envelopment Analysis. Manag. Sci. 30, 1078–1092. doi:10.1287/mnsc.30.9.1078
Bibi, Z., Khan, D., and Haq, I. u. (2021). Technical and Environmental Efficiency of Agriculture Sector in South Asia: a Stochastic Frontier Analysis Approach. Environ. Dev. Sustain. 23, 9260–9279. doi:10.1007/s10668-020-01023-2
Chang, Y.-T., Zhang, N., Danao, D., and Zhang, N. (2013). Environmental Efficiency Analysis of Transportation System in China: a Non-radial DEA Approach. Energy Policy 58, 277–283. doi:10.1016/j.enpol.2013.03.011
Charnes, A., Cooper, W. W., and Rhodes, E. (1978). Measuring the Efficiency of Decision Making Units. Eur. J. Oper. Res. 2, 429–444. doi:10.1016/0377-2217(78)90138-8
Chen, L., and Jia, G. (2017). Environmental Efficiency Analysis of China's Regional Industry: a Data Envelopment Analysis (DEA) Based Approach. J. Clean. Prod. 142, 846–853. doi:10.1016/j.jclepro.2016.01.045
Chen, Y., Li, L., Yu, J., Tsai, S.-B., and Wang, J. (2020a). An Empirical Study on Environmental Efficiency Measurements and Influencing Factors. Ecol. Chem. Eng. 27, 543–553. doi:10.2478/ECES-2020-0033
Chen, Y., Zhu, B., Sun, X., and Xu, G. (2020b). Industrial Environmental Efficiency and its Influencing Factors in China: Analysis Based on the Super-SBM Model and Spatial Panel Data. Environ. Sci. Pollut. Res. 27, 44267–44278. doi:10.1007/s11356-020-10235-y
Farrell, M. J. (1957). The Measurement of Productive Efficiency. J. R. Stat. Soc. Ser. A (General) 120, 253–281. doi:10.2307/2343100
Green, K. W., Zelbst, P. J., Sower, V. E., and Bellah, J. C. (2016). Impact of Radio Frequency Identification Technology on Environmental Sustainability. J. Comp. Inf. Syst. 57 (3), 269–277. doi:10.1080/08874417.2016.1184029
Harris, S., Martin, M., and Diener, D. (2021). Circularity for Circularity's Sake? Scoping Review of Assessment Methods for Environmental Performance in the Circular Economy. Sustainable Prod. Consumption 26, 172–186. doi:10.1016/J.SPC.2020.09.018
Kanellopoulos, P. G., Verouti, E., Chrysochou, E., Koukoulakis, K., and Bakeas, E. (2021). Primary and Secondary Organic Aerosol in an Urban/industrial Site: Sources, Health Implications and the Role of Plastic Enriched Waste Burning. J. Environ. Sci. 99, 222–238. doi:10.1016/J.JES.2020.06.012
Kang, C.-C., Khan, H. A., Feng, C.-M., and Wu, C.-C. (2017). Efficiency Evaluation of Bus Transit Firms with and without Consideration of Environmental Air-Pollution Emissions. Transportation Res. D: Transport Environ. 50 (1), 505–519. doi:10.1016/j.trd.2016.10.012
Kirchherr, J., Reike, D., and Hekkert, M. (2017). Conceptualizing the Circular Economy: An Analysis of 114 Definitions. Resour. Conservation Recycling 127, 221–232. doi:10.1016/j.resconrec.2017.09.005
Kortelainen, M. (2008). Dynamic Environmental Performance Analysis: A Malmquist index Approach. Ecol. Econ. 64 (4), 701–715. doi:10.1016/j.ecolecon.2007.08.001
Kristensen, H. S., and Mosgaard, M. A. (2020). A Review of Micro Level Indicators for a Circular Economy - Moving Away from the Three Dimensions of Sustainability? J. Clean. Prod. 243, 118531. doi:10.1016/j.jclepro.2019.118531
Li, X.-N., Feng, Y., Wu, P.-Y., and Chiu, Y.-H. (2021a). An Analysis of Environmental Efficiency and Environmental Pollution Treatment Efficiency in China's Industrial Sector. Sustainability 13, 2579. doi:10.3390/su13052579
Li, Y., Lin, T.-Y., Chiu, Y.-h., Cen, H., and Lin, Y.-N. (2021b). Efficiency Assessment of Coal Energy and Non-coal Energy under Bound Dynamic DDF DEA. Environ. Sci. Pollut. Res. 28, 20093–20110. doi:10.1007/s11356-020-12037-8
Liang, X., Lin, S., Bi, X., Lu, E., and Li, Z. (2021). Chinese Construction Industry Energy Efficiency Analysis with Undesirable Carbon Emissions and Construction Waste Outputs. Environ. Sci. Pollut. Res. 28, 15838–15852. doi:10.1007/s11356-020-11632-z
Lin, B., and Chen, X. (2020). Environmental Regulation and Energy-Environmental Performance-Empirical Evidence from China's Non-ferrous Metals Industry. J. Environ. Manage. 269, 110722. doi:10.1016/j.jenvman.2020.110722
Liu, K., and Lin, B. (2019). Research on Influencing Factors of Environmental Pollution in China: A Spatial Econometric Analysis. J. Clean. Prod. 206, 356–364. doi:10.1016/j.jclepro.2018.09.194
Long, X., Chen, B., and Park, B. (2018). Effect of 2008's Beijing Olympic Games on Environmental Efficiency of 268 China's Cities. J. Clean. Prod. 172, 1423–1432. doi:10.1016/j.jclepro.2017.10.209
Merli, R., Preziosi, M., and Acampora, A. (2018). How Do Scholars Approach the Circular Economy? A Systematic Literature Review. J. Clean. Prod. 178, 703–722. doi:10.1016/j.jclepro.2017.12.112
Pardo Martínez, C. I. (2013). An Analysis of Eco-Efficiency in Energy Use and CO2 Emissions in the Swedish Service Industries. Socio-Economic Plann. Sci. 47 (2), 120–130. doi:10.1016/j.seps.2012.11.004
Peng, B., Li, Y., Wei, G., and Elahi, E. (2018). Temporal and Spatial Differentiations in Environmental Governance. Ijerph 15 (10), 2242. doi:10.3390/ijerph15102242
Peng, G., Zhang, X., Liu, F., Ruan, L., and Tian, K. (2021). Spatial-temporal Evolution and Regional Difference Decomposition of Urban Environmental Governance Efficiency in China. Environ. Dev. Sustain. 23, 8974–8990. doi:10.1007/s10668-020-01007-2
Prieto-Sandoval, V., Jaca, C., and Ormazabal, M. (2018). Towards a Consensus on the Circular Economy. J. Clean. Prod. 179, 605–615. doi:10.1016/j.jclepro.2017.12.224
Reinhard, S., Lovell, C. A. K., and Thijssen, G. (2002). Analysis of Environmental Efficiency Variation. Am. J. Agric. Econ. 84, 1054–1065. doi:10.1111/1467-8276.00053
Shi, X. (2016). Environmental Efficiency Analysis Based on Relational Two-Stage DEA Model. Rairo-oper. Res. 50 (4–5), 965–977. doi:10.1051/ro/2015059
Su, B., Heshmati, A., Geng, Y., and Yu, X. (2013). A Review of the Circular Economy in China: Moving from Rhetoric to Implementation. J. Clean. Prod. 42, 215–227. doi:10.1016/j.jclepro.2012.11.020
Tone, K., and Tsutsui, M. (2014). Dynamic Dea with Network Structure: A Slacks-Based Measure Approach. Omega 42, 124–131. doi:10.1016/j.omega.2013.04.002
Tone, K., and Tsutsui, M. (2010). Dynamic DEA: A Slacks-Based Measure Approach☆. Omega 38 (3-4), 145–156. doi:10.1016/j.omega.2009.07.003
Wójcik, M., and Kostowski, W. (2020). Environmental Risk Assessment for Exploration and Extraction Processes of Unconventional Hydrocarbon Deposits of Shale Gas and Tight Gas: Pomeranian and Carpathian Region Case Study as Largest Onshore Oilfields. J. Earth Sci. 31 (1), 215–222. doi:10.1007/s12583-020-1263-4
Yan, Q., Wang, X., Baležentis, T., and Streimikiene, D. (2018). Energy-economy-environmental (3E) Performance of Chinese Regions Based on the Data Envelopment Analysis Model with Mixed Assumptions on Disposability. Energ. Environ. 29, 664–684. doi:10.1177/0958305X18757057
Yang, L., Ouyang, H., Fang, K., Ye, L., and Zhang, J. (2015). Evaluation of Regional Environmental Efficiencies in China Based on Super-efficiency-DEA. Ecol. Indicators 51, 13–19. doi:10.1016/j.ecolind.2014.08.040
Zhang, J., Zeng, W., and Shi, H. (2016). Regional Environmental Efficiency in China: Analysis Based on a Regional Slack-Based Measure with Environmental Undesirable Outputs. Ecol. Indicators 71, 218–228. doi:10.1016/j.ecolind.2016.04.040
Zhang, K., Xu, D., and Li, S. (2019). The Impact of Environmental Regulation on Environmental Pollution in China: An Empirical Study Based on the Synergistic Effect of Industrial Agglomeration. Environ. Sci. Pollut. Resgrowth Change 2651, 25775–25788. doi:10.1007/s11356-019-05854-z
Zhou, X., Chen, H., Wang, H., Lev, B., and Quan, L. (2019). Natural and Managerial Disposability Based DEA Model for China's Regional Environmental Efficiency Assessment. Energies 12 (18), 3436. doi:10.3390/en12183436
Zhou, Y.-h., Zhang, X.-h., Tian, X., Geng, X.-h., Zhang, P., and Yan, B.-j. (2015). Technical and Environmental Efficiency of Hog Production in China - A Stochastic Frontier Production Function Analysis. J. Integr. Agric. 14 (6), 1069–1080. doi:10.1016/S2095-3119(14)60990-4
Zhou, Y., Liang, D., and Xing, X. (2013a). Environmental Efficiency of Industrial Sectors in China: an Improved Weighted SBM Model. Math. Comp. Model. 58, 990–999. doi:10.1016/j.mcm.2012.09.021
Keywords: abrupt environmental accidents, waste water, waste gas, industrial solid waste, environmental efficiency
Citation: Zhang M, Ren F-r, Shi Y-y, Chen H-s and Tian Z (2022) CO2, Environmental Emergencies, and Industrial Pollution Assessment in China from the Perspective of the Circular Economy. Front. Environ. Sci. 9:709476. doi: 10.3389/fenvs.2021.709476
Received: 14 May 2021; Accepted: 15 December 2021;
Published: 13 January 2022.
Edited by:
Andrew Hursthouse, University of the West of Scotland, United KingdomReviewed by:
Guocheng Zhu, Hunan University of Science and Technology, ChinaFeng Yang, University of Science and Technology of China, China
Copyright © 2022 Zhang, Ren, Shi, Chen and Tian. This is an open-access article distributed under the terms of the Creative Commons Attribution License (CC BY). The use, distribution or reproduction in other forums is permitted, provided the original author(s) and the copyright owner(s) are credited and that the original publication in this journal is cited, in accordance with accepted academic practice. No use, distribution or reproduction is permitted which does not comply with these terms.
*Correspondence: Fang-rong Ren, MTgwMjEzMTIwMDA4QGhodS5lZHUuY24=
†These authors have contributed equally to this work and share first authorship