 Hang Xiao1,2
 Jialu You1,2*
- 1Shanghai University of Finance and Economics, Shanghai, China
- 2Finance and Economics Instituion, Shanghai, China
That human capital improves the efficiency of Green Total Factor Productivity has been established in research fields, but the heterogeneous effects of human capital on GTFP and its sustainable mechanisms are unclear. This study examines the effects of human capital accumulation, fiscal spending on education, and innovation on GTFP efficiency under spatial and temporal diversity. Employing panel data from 30 provinces from 2001 to 2018 in China, we analyzed the dynamic and static efficiency of GTFP in different regions by three-stage data envelopment analysis (DEA). The heterogeneous effects of human capital on GTFP were explored through Tobit regression. Results reveal that the average value of GTFP efficiency is an inverted U-shape and the presence of significant t geography differences. Human capital accumulation and fiscal spending on education have positive effects on GTFP efficiency; however, innovation negatively affects it. At the same time, marketization growth decreases the positive influence of human capital and education on GTFP efficiency. While, this effect was not observed regarding innovation, the implication of these results concerning the human capital heterogeneous effects of GTFP efficiency in a different geographic context. Establishing a fair and transparent system can reduce the endowments gap and effectively promote GTFP efficiency in developing countries.
Introduction
Around the world, large-scale urbanization has brought about a series of challenges for the human living environment (United Nations Department of Economic and Social Affairs, 2016), such as extensive pollution, energy crisis, and ecological imbalance (Patwa et al., 2021). Under this new governance framework, resources can be reconfigured to extract more value by reducing pollution emissions (Hobson, 2021). Ecological imbalance and high pollution emissions in developing countries have attracted international environmental concerns (Eskeland and Harrison, 2003; Golini et al., 2018). As the largest developing country, China’s total energy consumption reached 4.98 billion tons, showing year-on-year growth of 4.3% by 2020. Thus, China has been working on “high emissions, high pollution, and low efficiency” ( Sun et al., 2019). Green total factor productivity (GTFP) is an essential concept that requires the reduction of energy consumption and environmental pollution. Similarly, it is also an essential tool to measure the green economic performance of industries. Compared with traditional total factor productivity (TFP), which ignores the environmental pollution cost of GDP growth, GTFP considers energy consumption and environmental factors (Jin et al., 2020).
The majority of the literature focuses on measuring the index of GTFP. Huang et al. (2020) measured GTFP through the dynamic panel generalized method of moments (GMM) model. Chen and Zhou. (2017) added industrial “three wastes” into the output factors and then measured the environmental efficiency of 11 provinces in China’s Yangtze River Economic Belt. Ji et al. (2019) adopted the data envelopment analysis (DEA) method and determined that the efficiency of pollution treatment and waste disposal technology in Eastern China was the highest, while the technology levels in Western China were the lowest. Numerous studies focus on the micro or macro-economic policies evaluation, including the trade (Mary and Konings, 2007; Loecker, 2011; Sahoo et al.,2018; Jiang et al., 2021; Jiang, 2021) and industrial agglomeration policies (Martin et al., 2011). GTFP methods break down mathematical programming techniques (DEA) or econometric modeling (Stochastic Frontier Analysis, SFA). Beeson and Husted (1989) use DEA to investigate the differences in the U.S. sectoral efficiency. Some studies evaluate GTFP in China. For example, Song et al. (2018) investigate the impact of China’s “new normal” economic development policy on environmental technology advancement and industrial land-use efficiency. They argue that weak environmental regulations have no significant impact on environmental technology advancement, while new normal economic policies improve industrial land efficiency. Other research measures GTFP through enterprise microdata. Zhu etal. (2018) employ DEA to evaluate China’s mining and quarrying industry. They demonstrate that technical progress is the major driving factor of the production progress in this sector. Based on the above, we conclude that scholars are still interested in topics concerning GTFP, especially policy evaluation and industrial production driving factors. However, few studies combine human capital and policy evaluation to analyze China’s provincial GTFP.
Figure 1 illustrates the sustainability mechanism of human capital on GTFP efficiency. We argue that human capital has an impact on GTFP from two paths: first, the direct mechanism is through human capital accumulation, fiscal education spending, and innovation effects. Second, the indirect mechanism is through system shock (e.g., foreign capital entry and increased marketization level), which leads to competition effects that indirectly improve the human capital effects on GTFP.
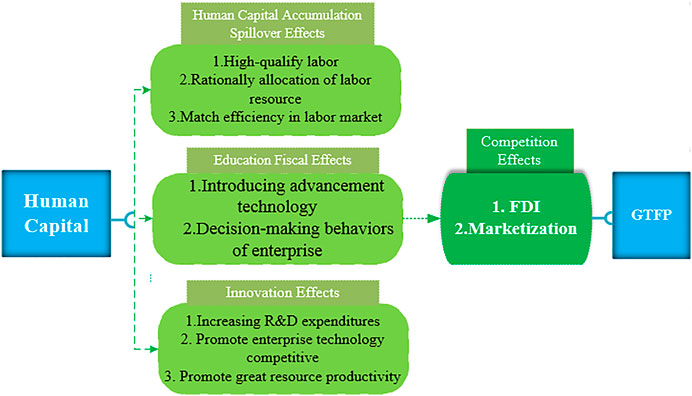
FIGURE 1. The sustainability mechanism of human capital on GTFP.
Human Capital Spillover Effects. In terms of economic growth, the manifestation of human capital spillover effects includes higher labor productivity, rational allocation of labor resources, and decreasing labor market mismatch. On the other hand, human and physical capital have substitution effects. It means the marginal return of human capital declines more slowly than material inputs. Ang et al. (2011) suggest that human capital could improve productivity by optimizing other factor structures. Furthermore, the current study expects that human capital directly influences GTFP by increasing labor productivity and other input factor productivity (James et al., 2011). However, the literature ignores the geographic variety, particularly in China—a country with unbalanced economic development. Some research indicates that the level of human capital effects on GTFP varies greatly under regional disparity (Vandenbussche et al., 2006). Theophile et al. (2009) emphasize that medium-quality human capital is more critical to TFP than high-quality human capital in a relatively economically underdeveloped city. The possible explanation is that the improving TFP is caused by imitating technologies of economically developed areas, rather than innovation.
Education Fiscal Spending Effects. China’s regional diversity affects the disparity of GTFP between provinces for a long time. The central government has increased fiscal education spending for technology and knowledge to reduce inter-regional variability. Some literature argues that R&D and education, such as the endogenous decision-making behavior of enterprises and residents, are likely associated with fiscal education spending effects. Human capital and technological advancement in backward areas may promote economic growth and narrow the regional economic gap (Viaene and Zilcha, 2002; Glomm and Ravikumar, 2003). However, some studies find that government education spending has a significant effect on economic growth in developed countries but has no significant impact in developing countries (Blankenau et al., 2007).
Innovation Effects. Innovation is one of the essential knowledge-intensive activities enterprises engage in through increasing R&D expenditure to obtain advanced technology. If technology coverage is fully maximized in the market, a technology monopoly can be realized, and this can help enterprises obtain surplus profits. This behavior promotes the improvement of regional innovation and achieving human capital accumulation (Collard-Wexler and Asker Locker, 2012). Simultaneously, enhancing the regional innovation level promotes enterprise technology competition to promote long-term social development. For example, new technology applications, artificial intelligence, and energy-saving technology have dramatically reduced energy consumption. Moreover, material innovation promotes great resource productivity, which formats the sustainability loops of “R&D-production-market-sales” (Cheng, 2021). Meanwhile, it also reduces the possible environmental pollutants during the organization’s activity. Under the technology spillover effects, resource optimization urges enterprises to eliminate outdated production capacity and improve resource utilization efficiency, contributing to the regional green economic development. However, the technology with high investment and risk increasing the threshold for the market. Because spillover effects may not affect the downstream and upstream chain, several weak technological enterprises may increase the resource investment to compensate for their technological disadvantages. It results in a decline in the region’s overall resource utilization efficiency, which is not conducive to circular economy development. Drawing on the above, the following hypothesis is proposed: Human capital, fiscal education spending, and innovation show heterogeneous influence over GTFP.
The rest of the paper is outlined below. Materials and Methods describes the econometric method, including data and variables. Results includes the empirical analysis; Discussion further discusses the mechanism of GTFP; and Conclusion sums up the conclusion.
Materials and Methods
Calculation of GTFP
We calculated these values to measure the principle-level evolution of the GTFP from 2001 to 2018 in China through three-stage DEA models. Compared with the two-stage DEA model, the entry input-output system is a black box, thus ignoring the specific production and operation processes; the three-stage DEA explores the intersystem and distinguishes between the different factor effects. The model steps are as follows: the first stage uses the DEA-BBC (Banker, Charnes, Cooper) model, introduced by Banker et al. (1984), to separate and estimate technical and scale efficiency in the DEA. The model equation is as follows:
In Eq. 1, the
According to the study of Aigner et al. (1974), we evaluated the efficiency through SFA (Stochastic Frontier analysis) model at the second stage. Fried et al. (2002) claim that the decision-making unit is affected by management inefficiencies, environmental effects, and statistical noise. The slack variable can reflect the initial low efficiency, constructing the SFA model to show regression of the first stage variables with environmental variables and the mixed error term. The SFA model is as follows:
In Eq. 2
In Eq. 3,
The third stage is the adjusted input-output variable DEA efficiency analysis. Using the adjusted input variables to calculate the efficiency value of each decision-making unit again, which has eliminated the influence of environmental factors and random factors, ensures the values are relatively accurate.
We analyzed the human capital factors of effects on GTFP efficiency through the Tobit regression. First, considering the total effect of human capital (Edu), fiscal education spending (Edu Fiscal), and regional innovation (patent) on GTFP, the regression model is as follows:
We further considered the interaction effect of human capital accumulation level, fiscal education spending, foreign direct investment (FDI), marketization degree on GTFP, the interaction effect of the level of regional innovation, and the level of intellectual property protection on GTFP. The interaction model is as follows:
In Eqs 4, 5.
The function with the interaction term of X and Z is to investigate hypothesis two. Besides, to reduce the endogenous problems caused by missing variables, we still control a series of variables that have been proven to have a significant impact on GTFP.
Variables
This paper investigates the effects of human capital on GTFP. The variables include two sectors: the three-stage DEA variables and the mediation effects model through Tobit regression.
Variables of the Three-Stage DEA
This section analyzes GTFP and its decomposition. Therefore, the explained variable is GTFP, measured by three-stage DEA in Analysis of the Dynamic GTFP. In this paper, the description of variables is in Table 1, and the input and output indicators are as follows.
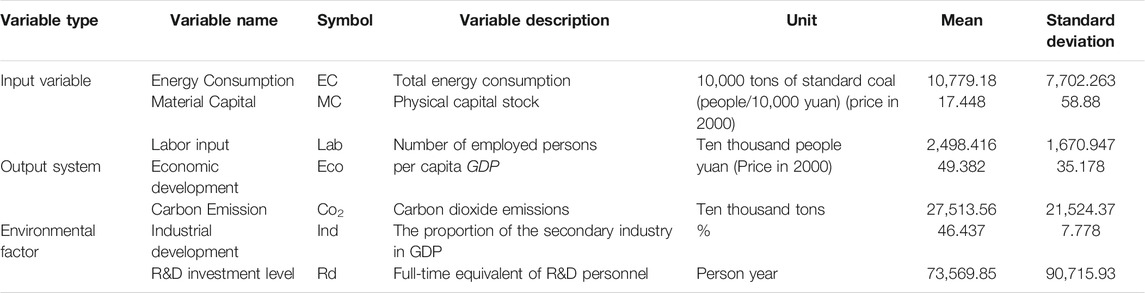
TABLE 1. Description of variables.
Input indicators: 1) the energy consumption inputs reflect the efficiency of green products, which is represented by the amount of energy consumption. 2) The material capital input highlights the level of capital input in terms of the progress of production, which is usually represented by the increasing investment in fixed assets. 3) The labor input reflects the number of employees, which is represented by the amount of employment at the enterprise.
Output indicators are as follows: 1) the desired output indicator is GDP, representing Per Capital GDP in each province; and 2) the carbon emission is an undesired output indicator that highlights green production. At the same time, at the second stage, we need to eliminate those facts that affect the efficiency of GTFP and cannot be changed in a short time, including two key factors for a full-time equivalent (FTE) of R&D and full-time equivalent (FTE) of R&D personnel.
The large gap between provinces in China, particularly the economic gaps, would affect the GTFP. We selected the secondary industry’s proportion of GDP and the full-time equivalent (FTE) of R&D as environmental factors.
Variables of Mediation Effects Model
This study adopts Tobit regression to analyze the interaction effects of heterogeneous human capital on GTFP efficiency. Traditional regression models may face bias issues between variables. This study uses the Tobit model for the empirical analysis to eliminate the errors caused by the range from 0 to 1 for GTFP variables, effectively solving explanatory variables’ bias. The variables used in this study are outlined in Table 2.
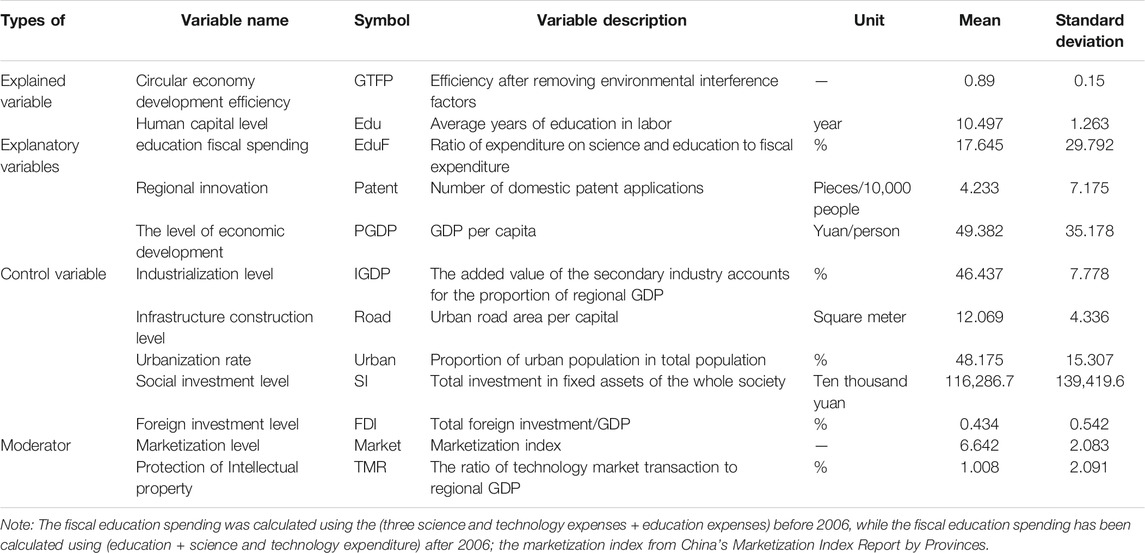
TABLE 2. The Descriptive variables of tobit Model.
Core explanation variables include the following. 1) Human capital is represented by the average education years in labor. 2) Fiscal education expenditure is defined as the ratio of expenditure on science and education to fiscal expenditure; it also emphasizes government attention. 3) Regional innovation is represented by the number of domestic patent applications.
Explained variable: This section analyzes the effects of human capital on GTFP efficiency. Thus, the explained variable is GTFP, and the evaluation value of efficiency is to eliminate the environmental interference factors.
Control variables are as follows. 1) Economic development level (per capita GDP): this directly reflects the economic level of each province. A higher level of economic development in the region means that technology agglomeration improves the GTFP. 2) Industrialization level (IGDP): from the perspective of the entire industry chain, the green technology level can help improve the GTFP. The industrialization level is defined by the percentage of industrial production to the regional GDP. 3) Infrastructure construction level (Road): this impacts green industrialization and improves the efficiency of an economy. The infrastructure construction level is represented by the urban road area per capita. 4) Urbanization level: an urbanization process brings about higher spillover effects on technology and human capital. We adopt a proportion of the urban population in the total population to represent the urbanization level. 5) Social investment in fixed assets: total fixed-asset investment is a prerequisite for the development of regional GTFP. The investment in different regions determines the willingness of enterprises to update green technologies. Social fixed assets investment is expressed as the total investment in fixed assets of the whole society.
Mediating variables are as follows: 1) foreign investment, foreign direct investment (FDI) through human capital, competition effects, and knowledge spillover effects to improve GTFP. We measure FDI through the index of annual foreign investment utilized in GDP. 2) The higher the marketization level, the stronger the willingness to introduce green advancement technology and new talent. Considering the availability of data, we measure the variable of marketization index from the Report on Marketization Index of China. 3) Intellectual Property Rights (IPR) Protection: the IPR protection level is the fundamental driving force for green technology innovation, conducive to stimulating enterprise enthusiasm for innovation and constructing an excellent innovation atmosphere. The measurement index is the ratio of technology transactions in the regional GDP. In addition, we expect these variables may influence the efficiency of GTFP.
Data Source
Considering available data, we excluded data from Tibet, Hong Kong, Macau, and Taiwan. The panel datasets were constructed by 30 provinces from 2001 to 2018. The primary data were calculated from the China Urban Statistical Yearbook and China’s Energy Statistical Yearbook. The energy consumption data from the statistical Yearbooks of provinces and the marketization index measured from the Report with China’s Marketization Index by Fang (2019) are worth mentioning. The index of Carbon dioxide emissions was collected from the eight types of energy consumption, including diesel consumption, coke consumption, coal consumption, kerosene consumption, gasoline consumption, fuel oil consumption, crude oil consumption, and natural gas consumption. Then evaluation the coefficient of energy conversion to the carbon. The inter-provincial material capital stock is calculated based on the relevant data and methods of Zhang Jun (2004), and the measuring equation is
Results
The following sections present the main analysis of GTFP efficiency and the influencing factors in the various provinces. Fully dynamic and static models are used to analyze the GTFP; the results are discussed below.
Analysis of the Dynamic GTFP
Materials, capital, labor, and energy consumption are taken as input variables; the province’s GDPs are taken as the expected output, and CO2 is taken as the undesired outputs. GTFP efficiency in 30 provinces is calculated using three-stage DEA. This is because we can distinguish between the different spatial and time trends. According to the division method of Chinese administrative regions, the provinces are divided into Northeastern, Eastern, Central, and Western China. The Northeastern provinces include Jilin, Liaoning, and Heilongjiang. The Eastern provinces include Hebei, Beijing, Tianjin, Shandong, Jiangsu, Shanghai, Zhejiang, Fujian, Guangdong, and Hainan. Central provinces include Henan, Hubei, Hunan, Anhui, Jiangxi, and Shanxi. The Western provinces include Chongqing, Sichuan, Guizhou, Yunnan, Guangxi, Shaanxi, Gansu, Qinghai, Ningxia, Xinjiang, and Inner Mongolia.
As shown in Table 3, the changing trend of GTFP at the province level is significant. The results indicate that the general GTFP in China was 0.847 in 2001 and 0.877 in 2018. This reveals a wave-like upward trend from 2001 to 2018. The average value of GTFP has seen a continuous and rapid increase from 2006 to 2008. In 2008, the average value of GTFP efficiency was more than 0.9, an increase of about 8%. The possible reason is the Chinese government has focused on promoting green, circular, and low-carbon development to advocate the concept of the “Green Olympics” around the world. The government has proposed the policy of “Beautiful China.” In 2013, GTFP reached its peak value of 0.937. However, it did not reach the production Frontier and began to decline after 2014. It shows that resource mismatch issues exist in the process of “Input-output” GTFP in China. In other words, the input resources have converted to output products inefficiently, and the scale of resource input has not yet reached the optimal production scale. As can be seen from Table 3, from 2001 to 2018, the values of GTFP remained steadily in the production Frontier only in Beijing, Shanghai, Tianjin, Zhejiang, Guangxi, Hainan, and Qinghai. It indicates that these provinces can effectively transform input factors into output factors and match “Input-output.” We also find that only two provinces, Jiangsu and Fujian, have been at the forefront of GTFP for a long time. However, other provinces (e.g., Chongqing, Hunan, Hubei, and Xinjiang) are at the non-Frontier, which shows that most provinces in China still have to improve GTFP efficiency.
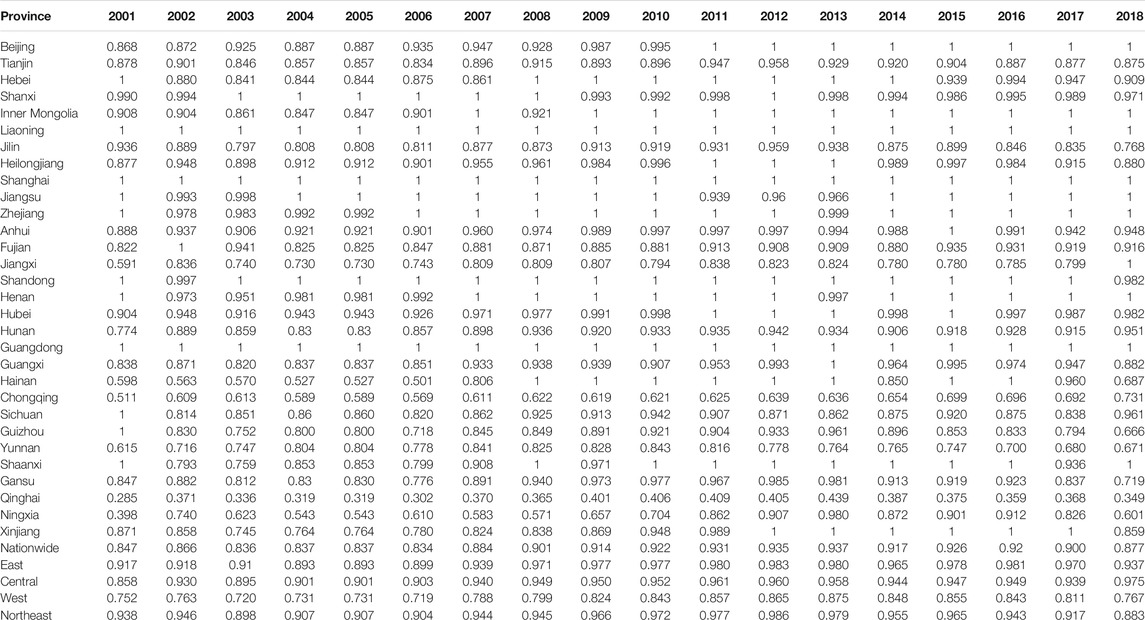
TABLE 3. Green total productivity of province from 2001 to 2018.
The advantage of three-stage DEA is the further decomposition of GTFP. To analyze the difference among provinces, we compose provinces into four regions. Figure 2 shows the changes in GTFP in four sections from 2001 to 2018. From 2008 to 2017, GTFP shows an upward trend. In addition, the changing trend of GTFP in the Eastern region is significantly significant. The agglomeration of high-tech enterprises, human capital, and government finances in the Eastern region has accelerated efforts to upgrade and optimize its industrial structure. Furthermore, the marketization of the Eastern region is lower than other regions. It means that the value of GTFP can be improved by promoting the enthusiasm of economic entities and the rational allocation of factor resources.

FIGURE 2. Gtfp variation diagram at four sections.
Table 4; Figure 3 show the GTFP values of 30 provinces in China. Furthermore, they analyze the growth model of GTFP. This paper is based on the average values of the province’s GTFP from 2001 to 2018 to divide provinces into four types: low effective growth, weak effective growth, adequate solid growth, and highly effective growth. As shown in Table 4, the GTFP values with influential growth provinces are more significant than 0.916. Regarding weak and low effective growth, the values with weak and low influential growth model provinces are lower than 0.810.
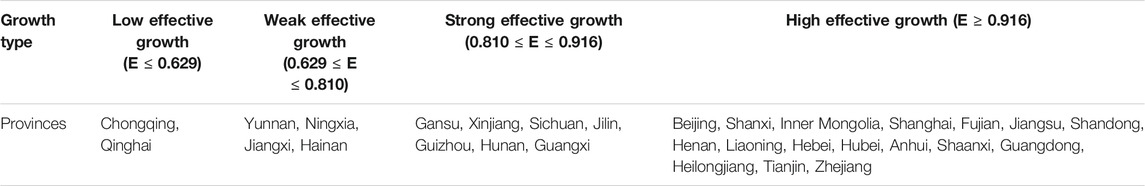
TABLE 4. The growth model of GTFP efficiency.
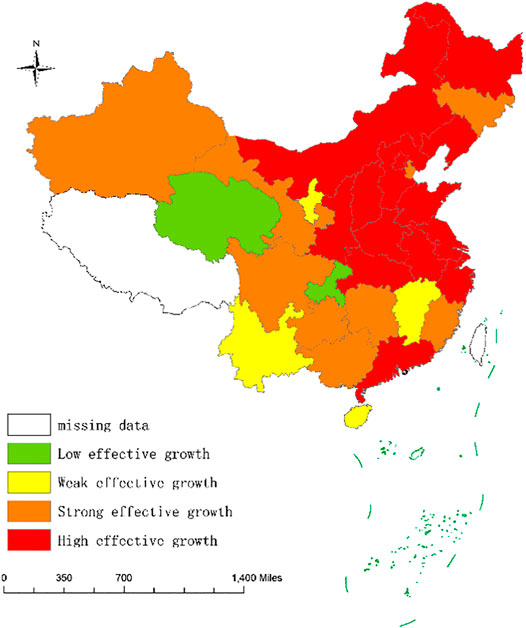
FIGURE 3. Spatial distribution diagram of GTFP.
From Figure 3, it also can be seen the spatial distribution difference of the growth model of GTFP from 2001 to 2018. Those provinces with high influential growth models are concentrated in eastern regions, such as Beijing, Shanghai, and Jiangsu. Occasionally, Sichuan and Hunan, being located in the central and western regions, and Guizhou, Gansu, Xinjiang, Guangxi, and Jilin, being located in the Northeast, have belonged to the solid and effective growth model. Weak and low practical growth models are for the majority concentrated in western regions except for Hainan. It suggests that improving the value of GTFP can enhance the utilization efficiency of resources in the western region and achieve the convergence of the difference with the highly effective growth area.
Analysis of GTFP and Its Static Decomposing
To analyze the efficiency of GTFP scientifically, this paper excludes environmental factors and random noise by a three-stage DEA model to obtain the GTFP static decomposing results, which include pure technology efficiency, scale technology efficiency, and return to scale. The initial DEA model results, without considering the impact of environmental factors and random noise, are shown in Table 5. From the Frontier’s technological index in 30 provinces, the average GTFP efficiency is 0.79, the average technical efficiency is 0.889, and the average scale efficiency is 0.891. Specifically, the provinces include Beijing, Guangdong, Jiangxi, Inner Mongolia, Shaanxi, and Shanghai, which have reached the forefront of production, and their scale efficiencies are 1. In terms of provinces in the eastern region, except for Beijing, Guangdong, and Shanghai, which reach the forefront of production, the values of other provinces are all lower than 0.9; Hebei’s, in particular, is lower than 0.78. Overall, the eastern region’s average efficiency is only 0.839, the average technical efficiency is 0.881, and the average scale efficiency is 0.857.
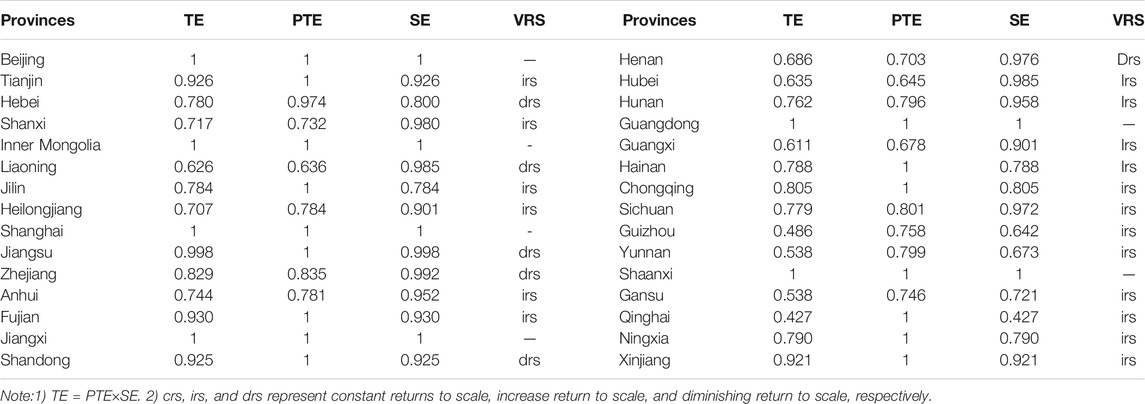
TABLE 5. GTFP and its breakdown over provinces in 2018.
From the GTFP efficiency results of provinces in the central region, only Jiangxi is at the production Frontier. Generally, the average efficiency of these provinces is 0.757, average technical efficiency is 0.776, and average scale efficiency is 0.975. From the western region results, two provinces, Inner Mongolia and Shaanxi have reached the production Frontier. The average efficiency value of provinces in the western region is 0.789, the average value of technical efficiency is 0.980, and the average value of scale efficiency is 0.876. Specifically, provinces in the northeast region are not at the forefront of production. For example, the Northeast region’s average efficiency value is 0.706, the average value of technical efficiency is 0.807, and the average scale efficiency is 0.89.
The first-stage efficiency results indicate that the efficiency of GTFP is ineffective, and the scale efficiency is generally lower than the pure technical efficiency. On the other hand, the issues of insufficient resource utilization in GTFP remain in China. The eastern and western regions have redundant input variables, and the efficiency of scale inhibits the improvement of the efficiency of GTFP. In contrast, the efficiency of scale in the central and northeastern regions is generally higher than the pure technical efficiency. The reason may be the different levels of government governance and technical restrictions. To exclude the effects factors of socio-economic, regional development, and random interference on the GTFP, this paper analyzes the GTFP by second SFA regression.
The Second Stage of SFA Regression
Based on the three input indicators in the first stage, the explained variables and the independent variables are the proportion of the secondary industry in GDP. The full-time equivalent of R&D personnel is used to establish an SFA regression model. Then, we analyze the GTFP through the Frontier4.1 software. Table 6 shows the SFA regression results, and it shows that the development of the secondary industry has a significant positive impact on the slack variables of energy consumption (3.37E + 01), material capital input (6.34E−02), and labor input (2.07E + 01).
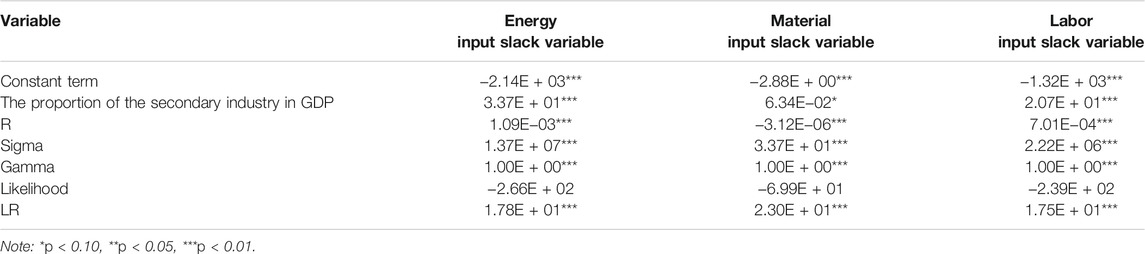
TABLE 6. SFA regression.
Note that the likelihood of slack variables of energy consumption, material capital input, and labor input of −2.66E + 02, −6.99E + 01, and −2.39E + 02 indicates the environmental factors and random interference factors significantly affect the efficiency of GTFP. The R&D investment positively affects the slack variable of energy input and labor input of 1.09E−03 and 7.01E−04. However, the R&D investment hurts the slack variable of material input of −3.12E−06.
Although the government has made great efforts to change the economic development model by regulating high pollution and supporting green enterprises, however, under the GDP assessment system, the waste phenomenon during the secondary industry’s development process still exists. Considering the diversity of geography in China, the transfer of polluting industries from developed areas to inland provinces is increasingly common, and this carries on industrial transfer without adequate supervision. Therefore, the regions with more cluster industries and greater innovation systems will emphasize R&D investments and innovation more. It indicated that sustainable economic systems have a development tendency that causes the decline of material consumption and waste in economic development and strengthens intensive development by relying on human capital and innovation capital.
The above means it can reduce and achieve significant development. The input of R&D investment has not yet improved the input structure of labor and energy in the economic development system. The possible explanation is that excessive concentration of R&D investment and personnel leads to the internal waste of talent in these regions. While R&D investment also depends on industrial agglomeration, energy consumption will be higher in regions where many industries are concentrated.
Adjustment Results of DEA Model
The adjusted results of GTFP efficiency in 30 provinces in 2018 are shown in Table 7. Overall, after the adjustment, the average efficiency increased by 25%, and the average pure technical efficiency increased by 23%. However, it is interesting to observe that the scale efficiency fell by 0.82%. Table 7 also shows the stripping away of environmental and random factors, where provinces in the central region increased by 28% in terms of the GTFP efficiency. The GTFP efficiency of eastern, northeast, and western provinces increases by 10, 5, and 3%, respectively.
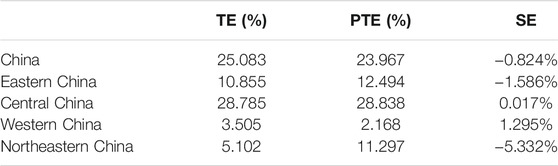
TABLE 7. The adjustment range of first and third stage.
It is well known that the environment is essential for GTFP in different regions, and the role of incentives for development efficiency is different. Nevertheless, the lower scale efficiency still causes the lower value of the adjusted GTFP. After the adjustment, each region’s pure technical efficiency has increased significantly than the adjustment scale efficiency. Hence, after excluding the external environment and random error, the GTFP efficiency is still low. The main reason is the constraints of the scale efficiency.
Figure 4 shows the pre-and post-contrast evaluation for the GTFP. After the adjustment, the scale efficiency of the eastern and northeastern regions has declined. It means that there is potential for improving the scale efficiency of GTFP by improving the external environment. After the adjustment, the advantage is obviously on the provinces’ scale efficiency in the central and western regions compared with other regions. Therefore, it is necessary to support the expansion of investment scale in those provinces, mainly focus on improving overall efficiency and technical efficiency. In terms of provinces in eastern and northeastern regions, it is necessary to avoid resource redundancy and waste caused by excessive investment.
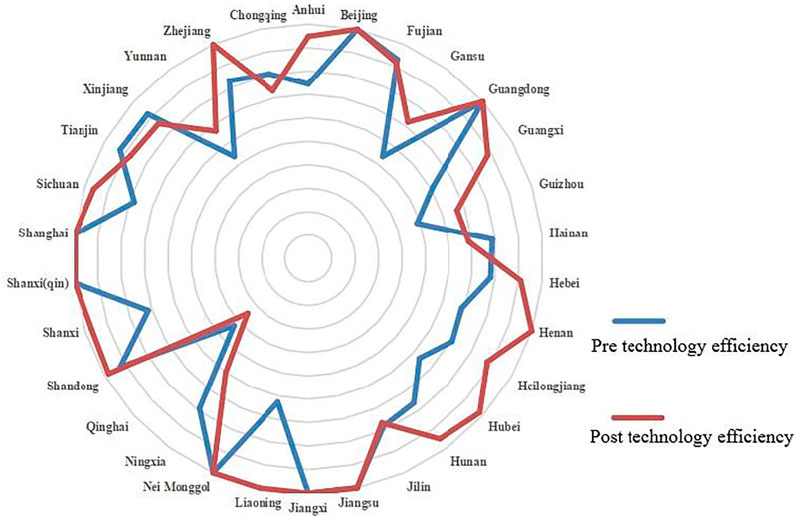
FIGURE 4. Pre–post technology efficiency -contrast evaluation for the GTFP efficiency.
Panel Unit Root Test and Cointegration Test
To avoid false regression and pseudo-regression problems, it is first necessary to perform a unit root test on panel data to ensure the validity of model estimation results. We do the root test methods through IPS (Im-Pesaran-Skin Test) and FISHER tests. If the null hypothesis that there is a unit root in these two tests is rejected, it means that the panel sequence is stationary. Table 8 shows the unit root test results of each variable. It can be concluded that the original level sequence is not stable in Table 8.

TABLE 8. Unit root testing.
Therefore, the cointegration testing can be further performed. The null hypothesis tested is that the variables do not have a cointegration relationship. Table 9 shows the cointegration test results of all models. It can be seen that in all models, each indicator rejects the null hypothesis of no cointegration relationship at a significance level of 1%. It can be considered that there is a long-term stable equilibrium relationship between the variables, and the result of further regression of the model is credible.
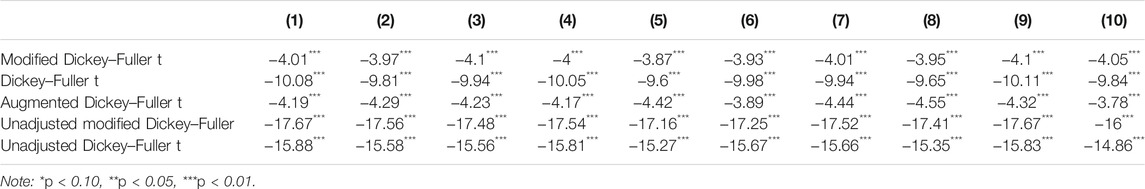
TABLE 9. Panel cointegration testing.
Analysis on the Effects of Human Capital on GTFP Efficiency
The value of GTFP is a restricted dependent variable. The paper further analyzes the mechanical effects of human capital on GTFP through the Tobit regression. Table 10 represents the results after control variables of investment rate, social investment, and industrial development. As seen in Table 10, models (1), (4), and (7) explore the effects of three human capital types, including human capital accumulation, fiscal education expenditure, and regional innovation, respectively, on GTFP efficiency. We find that the effects of human capital accumulation and education fiscal expenditure all positively affect the GTFP of 0.0231 and 0.484, respectively.
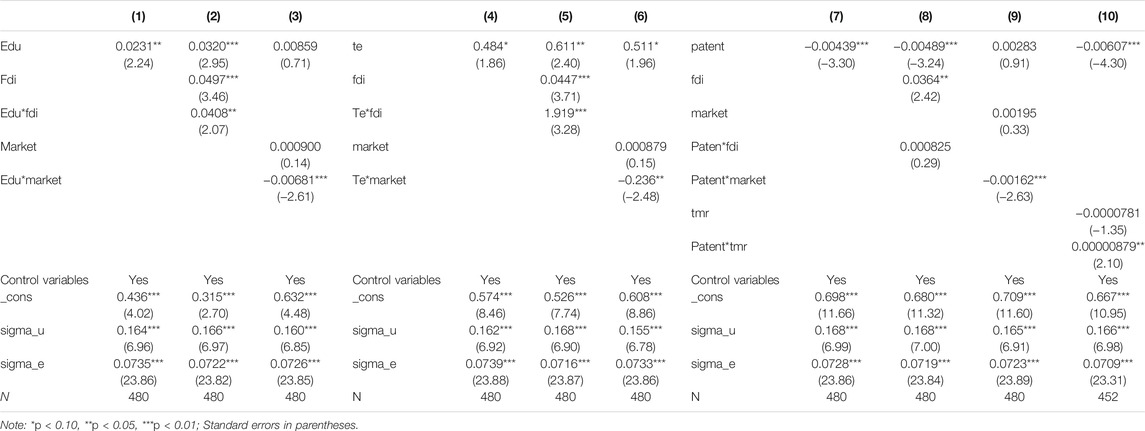
TABLE 10. Tobit regression.
On the other hand, financial science and education investment play an essential role in achieving the convergence of the regional economic development level gap. Considering that China’s underdeveloped regions depend on infrastructure investment, the expansion of financial investment in education will cause “crowding out” effects, reducing the waste of resources by squeezing out the infrastructure construction of low repeat levels. However, the effects of the negative coefficients of regional innovation are −0.0439.
Models (2), (5), and (8) have added the degree of openness, the human capital accumulation, and the fiscal education expenditure, respectively, to analyze the heterogeneous effects of openness on GTFP further. They are observing the results of models (2), (5), and (8), the cross-term coefficients between levels of openness with human capital accumulation, fiscal education expenditure, and innovation level of 0.0408, 1.919, and 0.000825, respectively.
Models (3), (6), and (9) have added the cross-term between marketization and human capital accumulation, fiscal education expenditure, and innovation. Analyze the heterogeneous effects of marketization on GTFP. The cross-term coefficients between marketization levels with human capital accumulation, fiscal education expenditure, and innovation level of −0.00618, −0.236, and −0.00162, respectively.
Model (10) explores the heterogeneous effects of intellectual property protection on GTFP. This paper adds the cross-term of innovation and intellectual property protection. The cross-term coefficients between intellectual property protection and innovation are 0.00000879 it means intellectual property protection improves the adverse effects of innovations on GTFP. Hence, the government should address the policy of intellectual property protection in developing cities.
Robustness Test
This study uses the variable substitution method and data substitution method to perform the robust test. First, the variable substitution method uses a Two-way fixed OLS model. It adjusts the variables of CO2 emissions per GDP and COD emissions per GDP to measure the effects of human capital on GTFP efficiency. It can be seen from Table 11 that human capital, financial technology, and fiscal education expenditure still have adverse effects on the energy consumption scale and pollution discharge (−14.45 and −55.78, respectively) and the positive effects of innovation on the energy consumption scale and pollution discharge (0.337). Secondly, the data substitution method removes extreme values; the robustness test shown in Table 10. From the robust results, we find that the coefficient of human capital, financial technology, and education expenditure on the GTFP is still significant, and the control variable’s result did not significantly change. Overall, two robust tests further verify that the selection of variables is reasonable, and the model is robust.
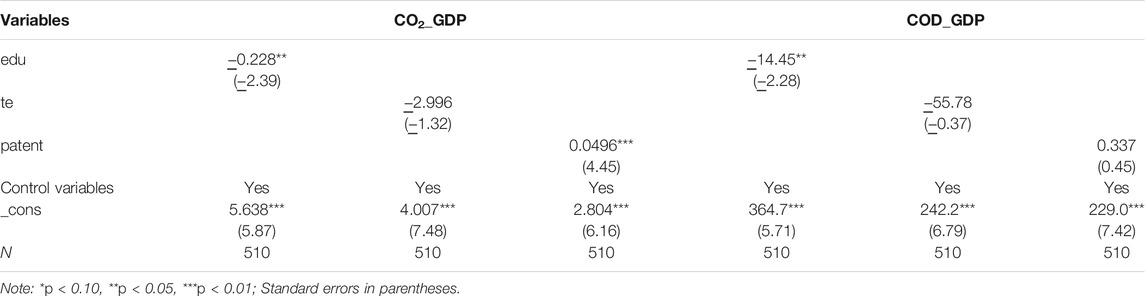
TABLE 11. Robustness test (two−way fixed OLS model).
Table 12 shows the trend efficiency results of Western region provinces. The GDFP shows a tendency to increase, while the Western area still has the lowest technology efficiency of the three regions (Eastern, Western, and Central areas) of China. It means that the level of advancement of its industrial structure and technological innovation capabilities are relatively weaker than other regions, which will inevitably affect its GTFP. In terms of Central regions, the changing trend of GTFP efficiency has the same as the national average, which shows an upward trend in volatility. The empirical results demonstrate that the values ranged from 0.858 in 2001 and peaked at 0.975 in 2018. With abundant natural resources, convenient traffic conditions, and water resources, Hubei and Jiangxi in the Central region have potential development in terms of GTFP. Implementing a “promote Central region raising strategy” improves governments’ enthusiasm for industrial transformation and upgrading, which has provided favorable conditions for developing a green economy. As seen from the trend for the Northeast region, the value of GTFP remains at a relatively high level. With the implementation of the Northeast revitalization strategy policy and the dilemma of surviving the economy, local governments experiencing a slump have sought to transform the economic development model by constructing the first chemical industry circular economy demonstration park.
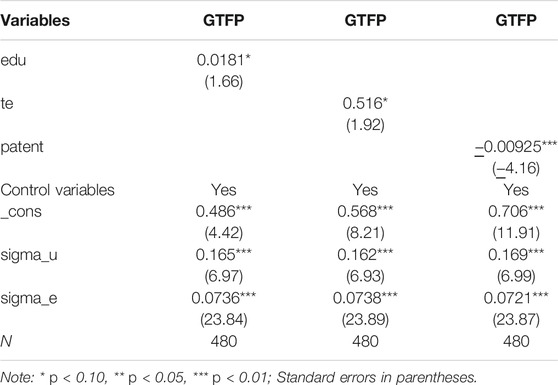
TABLE 12. Robustness test (removal of extreme values).
Discussion
This study analyzed the heterogeneous effects of human capital on GTFP efficiency in China. Therefore, we revised the input-output factors of GTFP and excluded external factors and stochastic noise through the three-stage DEA and Tobit regression model.
As expected, the effects of human capital accumulation and fiscal education expenditure all positively affect GTFP. Financial science and education investment play essential roles in achieving the convergence of the regional economic development level gap. From the micro perspective, the growth of human capital accumulation means that high-quality labor has a greater ability to allocate resources and absorb advanced technology, resulting in a mature “Labor reserve.” In other words, an increase in the high-quality population in “Labor cisterns” results in a greater probability that companies can hire high-quality workers at a lower cost and achieve growth of efficiency with less labor investment. From the macro perspective, the government’s investment in education is used as “Leverage,” which means it can also increase education investment in micro entities, such as enterprises and families, directly affecting labor quality. However, the financial investment in education will cause crowding out effects in developing regions; the possible explanation is that China’s regional development gap is significant. Underdeveloped regions lag behind developed regions in terms of innovation, lack of institutional environment, material capital accumulation, and insufficient infrastructure. It causes the erosion effect on innovation growth, leading to the inefficient allocation of resources, and distorting the effect of innovation on TFP.
In terms of marketization, growth will reduce the positive impact of human capital and fiscal education expenditure on GTFP. Since coastal areas have gotten rid of the influence of the planned economy, and enjoy more institutional dividends, it has caused geographic differences in the level of marketization between coastal and Western regions of China. Therefore, the marketization differences lead to the agglomeration effects on talents and capital elements in coastal areas. The loss of high-quality resources will remain in underdeveloped areas when the marketization does not reach the “threshold.” It will lead to low efficiency of GTFP and a severe waste of resources in underdeveloped areas. Besides the growth of openness, the degree will increase the positive impact of high-quality labor and education fiscal expenditure on GTFP.
On the contrary, it will weaken the influence of innovation on GTFP. FDI “overflow” effects caused by human capital accumulation is one of the main channels to improve the quality of the regional labor force. Specifically, multinational companies with a perfect talent training system will be willing to export considerable skilled labor to the local market, enhancing the level of regional human capital. Especially for underdeveloped regions, the representative’s medium-quality human capital can play a more critical role in the regional economy. They can achieve the model transformation to environment-friendly economic development by imitating advanced regions. Local enterprises can absorb advanced international technologies through cooperation with multinational enterprises from developed regions, followed by the cultivation of high quality, innovative talents, the imitating of advanced systems, and advanced concepts to realize the goals of technological catch-up. These all play an essential role in reducing the waste of resources.
This study has several attributes: First, we use three-stage DEA to estimate the GTFP by excluding external and stochastic noise. Second, compared with current literature, we accounted for the different spatial and temporal heterogeneity in China; we used province-level data from 2001 to 2018 to measure spatial and temporal heterogeneity in GTFP efficiency. Finally, we conducted an integrated analysis on the influences of human capital and policy evaluation on GTFP efficiency, which extends the current literature on GTFP. However, this study has some limitations. We interpreted our findings based on the GTFP efficiency of all industries in China and do not separate the efficiency among primary, secondary, and tertiary industries.
Conclusion
After excluding external factors and stochastic noise, this study examined the effects of human capital heterogeneity on GTFP and tests sustainable paths. Considering the spatial and temporal heterogeneity, panel data from 30 provinces from 2001 to 2018 in China were adopted. We then verified two hypotheses about the heterogeneous effects of human capital through three-stage DEA and Tobit regression. The three types of human capital variables include human capital accumulation (Edu), education fiscal (Edu Fiscal), and regional innovation (patent). The main findings were as follows:
1) The average value of GTFP efficiency can be viewed as an inverted U-shape and shows significant geographic differences across China. The average efficiency of GTFP in Eastern regions (0.916) is higher than in other areas. The average efficiency of GTFP in the Western region (0.810) is significantly lower than in other areas. In terms of the GTFP growth model, except the Western provinces, including Guangxi, Guizhou, Gansu, Xijiang, and Sichuan, other provinces belong to a low-efficiency growth model.
2) The static decomposing for GTFP efficiency in 2018 shows that the average overall efficiency of GTFP rose by 25% in China, and the average pure technical efficiency rose by 23%. However, the scale efficiency decreased by 0.82%. Therefore, future research must take the geographic diversity of GTFP efficiency into consideration.
3) Analyzing the heterogeneous human capital effects of GTFP efficiency, human capital accumulation, and fiscal education spending shows that they are found to positively affect the GTFP efficiency. On the contrary, lack of an environmental institution, the inadequacy of resource capital, and insufficient infrastructure would lead to the erosion effect for innovation, which negatively affects GTFP efficiency.
4) FDI has positive effects on GTFP efficiency. Specifically, FDI will increase the positive effects of human capital accumulation, fiscal education spending, and innovation on GTFP efficiency. However, under the diverse geography in China, the growth of marketization will weaken the positive impact of human capital and education on GTFP efficiency.
Data Availability Statement
The original contributions presented in the study are included in the article/Supplementary Materials, further inquiries can be directed to the corresponding authors.
Author Contributions
All authors listed have made a substantial, direct, and intellectual contribution to the work and approved it for publication.
Funding
The Fundamental Research Funds support this work for the Central Universities of Shanghai University of Finance and Economics.
Conflict of Interest
The authors declare that the research was conducted in the absence of any commercial or financial relationships that could be construed as a potential conflict of interest.
Publisher’s Note
All claims expressed in this article are solely those of the authors and do not necessarily represent those of their affiliated organizations, or those of the publisher, the editors and the reviewers. Any product that may be evaluated in this article, or claim that may be made by its manufacturer, is not guaranteed or endorsed by the publisher.
References
Aigner, D., Knox Lovell, C. A., and Schmidt, P. (1974). Formulation and Estimation of Stochastic Frontier Production Function Models. J. Econom. 6 (1), 21–37. doi:10.1016/0304-4076(77)90052-5
Ang, J. B., Madsen, J. B., and Rabiul Islam, M. (2011). The Effects of Human Capital Composition on Technological Convergence. J. Macroeconomics 33 (3), 465–476. doi:10.1016/j.jmacro.2011.03.001
Banker, R. D., Charnes, A., and Cooper, W. W. (1984). Some Models for Estimating Technical and Scale Inefficiencies in Data Envelopment Analysis. Manage. Sci. 30 (9), 1078–1092. doi:10.1287/mnsc.30.9.1078
Beeson, P. E., and Husted, S. (1989). Patterns and Determinants of Productive Efficiency State of Manufacturing. J. Reg. Sci. 29 (1), 15. doi:10.1111/j.1467-9787.1989.tb01219.x
Blankenau, W. F., Simpson, N. B., and Tomljanovich, M. (2007). Public Education Expenditures, Taxation, and Growth: Linking Data to Theory. Am. Econ. Rev. 97 (2), 393–397. doi:10.1257/aer.97.2.393
Chen, J., and Zhou, Q. (2017). City Size and Urban Labor Productivity in China: New Evidence from Spatial City-Level Panel Data Analysis. Econ. Syst. 41, 165–178. doi:10.1016/j.ecosys.2016.07.002
Cheng, J., Yi, J., Dai, S., and Xiong, Y. (2019). Can Low-Carbon City Construction Facilitate green Growth? Evidence from China's Pilot Low-Carbon City Initiative. J. Clean. Prod. 231, 1158–1170. doi:10.1016/j.jclepro.2019.05.327
Cheng, Z. (2021). Green Total Factor Productivity of Extractive Industries in China: An Explanation from Technology Heterogeneity. Res. Pol. 70, 101933. doi:10.1016/j.resourpol.2020.101933
Collard-Wexler, A., and Asker Locker, J. D. (2012). Productivity Volatility and the Misallocation of Resources in Developing Economies. NBER Working Papers.
Eskeland, G. S., and Harrison, A. E. (2003). Moving to Greener Pastures? Multinationals and the Pollution haven Hypothesis. J. Develop. Econ. 70 (1), 1–23. doi:10.1016/s0304-3878(02)00084-6
Fang, C. (2019). Defining and Measuring the Circular Economy: A Mathematical Approach. Ecol. Econ. 157, 369–372. doi:10.1016/j.ecolecon.2018.12.003
Fried, H. O., Lovell, C. A. K., Schmidt, S. S., and Yaisawarng, S. (2002). Accounting for Environmental Effects and Statistical Noise in Data Envelopment Analysis. J. Product. Anal. 17 (1-2), 157–174. doi:10.1023/a:1013548723393
Glomm, G., and Ravikumar, B. (2003). Public Education and Income Inequality. Eur. J. Polit. Econ. 19 (2), 289–300. doi:10.1016/s0176-2680(02)00178-7
Golini, R., De Marchi, V., Boffelli, A., and Kalchschmidt, M. (2018). Which Governance Structures Drive Economic, Environmental, and Social Upgrading? A Quantitative Analysis in the Assembly Industries. Int. J. Prod. Econ. 203, 13–23. doi:10.1016/j.ijpe.2018.05.021
Huang, Y., Zhu, H., and Zhang, Z. (2020). The Heterogeneous Effect of Driving Factors on Carbon Emission Intensity in the Chinese Transport Sector: Evidence from Dynamic Panel Quantile Regression. Sci. Total Environ. 727 (20), 138578. doi:10.1016/j.scitotenv.2020.138578
Hobson, K. (2021). The Limits of the Loops: Critical Environmental Politics and the Circular Economy. Environ. Polit. 30 (1-2), 161–179. doi:10.1080/09644016.2020.1816052
James, B. A., Madsen, J. B., and Rabiul Islam, M. D. (2011). The Effects of Human Capital Composition on Technological Convergence. J. Macroecon. 33 (3), 465–476. doi:10.1016/j.jmacro.2011.03.001
Ji, C., Zhang, Y., Cheng, Q., Li, Y., Jiang, T., and San Liang, X. (2019). Analyzing the Variation of the Precipitation of Coastal Areas of Eastern China and its Association with Sea Surface Temperature (SST) of Other Seas. Atmos. Res. 219, 114–122. doi:10.1016/j.atmosres.2018.12.027
Jiang, F. (2021). “Environmental Protection,” in China and International Trade Greening the WTO Ban on Chinese Export Duties (Routledge).
Jiang, Y., Wang, H., and Liu, Z. (2021). The Impact of the Free Trade Zone on green Total Factor Productivity- Evidence from Shanghai Pilot Free Trade Zone. Energy Policy 148, 112000. doi:10.1016/j.enpol.2020.112000
Jin, G., Shen, K., and Li, J. (2020). Inter Jurisdiction Political Competition and green Total Factor Productivity in China: An Inverted-U Relationship. China Econ. Rev. 61, 101224. doi:10.1016/j.chieco.2018.09.005
Loecker, J. D. (2011). Product Differentiation, Multiproduct Firms, and Estimating the Impact of Trade Liberalization on Productivity. Econometrica 79 (5), 1407–1451. doi:10.3982/ECTA7617
Martin, P., Mayer, T., and Mayneris, F. (2011). Spatial Concentration and Plant-Level Productivity in France. J. Urban Econ. 69 (2), 182–195. doi:10.1016/j.jue.2010.09.002
Mary, A., and Konings, J. (2007). Trade Liberalization, Intermediate Inputs, and Productivity: Evidence from I Indonesia. Am. Econ. Rev. 97 (5), 1611–1638. doi:10.1257/aer.97.5.1611
Patwa, N., Sivarajah, U., Seetharaman, A., Sarkar, S., Maiti, K., and Hingorani, K. (2021). Towards a Circular Economy: An Emerging Economies Context. J. Business Res. 122, 725–735. doi:10.1016/j.jbusres.2020.05.015
Sahoo, A. K., Chandra Sahu, N., and Sahoo, D. (2018). Impact of Policy Reforms on the Productivity Growth of Indian Coal Mining: A Decomposition Analysis. Resour. Pol. 59, 460–467. doi:10.1016/j.resourpol.2018.08.019
Song, M., Wang, S., and Wu, K. (2018). Environment-biased Technological Progress and Industrial Land-Use Efficiency in China’s New normal. Ann. Oper. Res. 268 (1-2), 425–440. doi:10.1007/s10479-016-2307-0
Sun, H., Edziah, B. K., Sun, C., and Kporsu, A. K. (2019). Institutional Quality, green Innovation and Energy Efficiency. Energy Policy 135, 111002–111120. doi:10.1016/j.enpol.2019.111002
Theophile, A., Bity, D., and Mbaye, D. (2009). Technology Frontier, Labor Productivity and Economic Growth: Evidence from OECD Countries. MERIT Working Papers, 059.
United Nations Department of Economic and Social Affairs. (2016). The Sustainable Development Goals Report. doi:10.18356/3405d09f-en
Vandenbussche, J., Aghion, P., and Meghir, C. (2006). Growth, Distance to Frontier and Composition of Human Capital. J. Econ. Growth 11 (2), 97–127. doi:10.1007/s10887-006-9002-y
Viaene, J.-M., and Zilcha, I. (2002). Capital Markets Integration, Growth and Income Distribution. Eur. Econ. Rev. 46 (2), 301–327. doi:10.1016/S0014-2921(01)00097-6
Keywords: green total factor productivity, heterogeneity human capital, innovation, FDI, environment policy
Citation: Xiao H and You J (2021) The Heterogeneous Impacts of Human Capital on Green Total Factor Productivity: Regional Diversity Perspective. Front. Environ. Sci. 9:713562. doi: 10.3389/fenvs.2021.713562
Received: 23 May 2021; Accepted: 06 September 2021;
Published: 29 September 2021.
Edited by:
Ilona M. Otto, Universität Graz, AustriaReviewed by:
Maxim Kotsemir, National Research University Higher School of Economics, RussiaUmit Bulut, Ahi Evran University, Turkey
Copyright © 2021 Xiao and You. This is an open-access article distributed under the terms of the Creative Commons Attribution License (CC BY). The use, distribution or reproduction in other forums is permitted, provided the original author(s) and the copyright owner(s) are credited and that the original publication in this journal is cited, in accordance with accepted academic practice. No use, distribution or reproduction is permitted which does not comply with these terms.
*Correspondence: Jialu You, bHVuYXlvdUAxNjMuc3VmZS5lZHUuY24=