 Benedikt Ehrenfels1,2*
 Maciej Bartosiewicz3,4
 Athanasio Stephano Mbonde5
 Kathrin B.L. Baumann1,2
 Christian Dinkel1Julian Junker6,7Tumaini M. Kamulali5
 Ismael A. Kimirei5,8Robert Niederdorfer1
 Daniel Odermatt1
 Francesco Pomati9Emmanuel A. Sweke5,10
 Bernhard Wehrli1,2
- 1Department Surface Waters – Research and Management, Eawag, Swiss Federal Institute of Aquatic Science and Technology, Kastanienbaum, Switzerland
- 2Institute of Biogeochemistry and Pollutant Dynamics, ETH Zurich, Zurich, Switzerland
- 3Department of Environmental Sciences, University of Basel, Basel, Switzerland
- 4Institute of Geophysics, Polish Academy of Sciences, Warsaw, Poland
- 5TAFIRI, Tanzania Fisheries Research Institute, Kigoma, Tanzania
- 6Department Fish Ecology and Evolution, Eawag, Swiss Federal Institute of Aquatic Science and Technology, Kastanienbaum, Switzerland
- 7Institute of Ecology and Evolution, University of Bern, Bern, Switzerland
- 8TAFIRI, Tanzania Fisheries Research Institute, Dar es Salaam, Tanzania
- 9Department Aquatic Ecology, Eawag, Swiss Federal Institute of Aquatic Science and Technology, Dübendorf, Switzerland
- 10DSFA, Deep Sea Fishing Authority, Zanzibar, Tanzania
In Lake Tanganyika, blooms of nitrogen-fixing (diazotrophic) cyanobacteria emerge, when the upper water column re-stratifies after a period of upwelling and convective mixing. During this seasonal transition, diazotrophic cyanobacteria exploit the abundant phosphate and fix nitrogen after other phytoplankton taxa have consumed the available nitrate. However, it remains less clear, which mechanisms favour diazotrophic cyanobacteria under more heavily stratified conditions with lower levels of excess phosphate and persistent nitrate-depletion. Here, we collected profiles of physicochemical parameters, nutrients and photo-pigments, as well as the medium- to large-sized phytoplankton community during two lake-wide cruises to elucidate to what extent the abundance of diazotrophic cyanobacteria in Lake Tanganyika may be controlled by the nitrate resupply through the thermocline into the euphotic zone. At stations where nitrate was depleted, but phosphate remained available near the surface, high densities of diazotrophic cyanobacteria were associated with a low nitrate supply to surface waters. Our data provide first support for two conceptual scenarios, where the relative position of the thermocline and the euphotic depth may create a functional niche for diazotrophic cyanobacteria: when the upward transport of nitrate into the euphotic zone is reduced by a subjacent thermocline, diazotrophic cyanobacteria, comprising Dolichospermum and Anabaenopsis, are key players in the medium-to large-sized phytoplankton community. By contrast, a thermocline located within the euphotic zone allows for a rapid vertical transport of nitrate for a thriving nitrate-assimilating phytoplankton community that evidently outcompetes diazotrophic cyanobacteria. This study highlights that, under nitrogen-depleted conditions, diazotrophic cyanobacteria can also grow in response to a reduced nutrient resupply to the productive surface waters.
Introduction
Cyanobacterial blooms are globally increasing in frequency and severity due to human-induced alterations of natural aquatic ecosystems. This rapid proliferation of blooms motivated numerous studies in the context of eutrophication and warming of lakes and coastal seas. The ongoing debate regarding the direct preconditions and factors triggering the formation of cyanobacterial blooms (Downing et al., 2001; Przytulska et al., 2017; Glibert et al., 2018; Bartosiewicz et al., 2019) is anchored in a broad consensus that eutrophication is a prerequisite for their formation in intensely human-influenced water bodies (Molot et al., 2014). Eutrophication studies have indeed greatly improved our mechanistic understanding of bloom formation in relatively small oligotrophic lakes experiencing warming and anthropogenic nutrient inputs over the last decades (Carey et al., 2008; Winter et al., 2011; Posch et al., 2012; Almanza et al., 2019). By contrast, much less is known about the mechanisms triggering surface cyanobacterial blooms in large, warm oligotrophic marine and freshwater systems (White et al., 2007), such as the Northern Pacific Subtropical Gyre (NPSG), Gulf of Aqaba, Lake Malawi or Lake Tanganyika.
The phytoplankton community in Lake Tanganyika, the largest lake in Africa by volume, is generally dominated by picocyanobacteria (Descy et al., 2005; Stenuite et al., 2009), but blooms of filamentous cyanobacteria (Dolichospermum and Anabaenopsis) occur seasonally (Descy et al., 2010). Similar to other large, stratified oligotrophic systems (Gordon et al., 1994; Post et al., 2002; Dore et al., 2008; Gondwe et al., 2008), these blooms emerge during periods of enhanced water column stratification in Lake Tanganyika, i.e. at the onset (Hecky and Kling, 1981; Narita et al., 1986; Langenberg et al., 2002; Cocquyt and Vyverman, 2005) and throughout the rainy season (Salonen et al., 1999; Vuorio et al., 2003; Descy et al., 2005).
Enhanced stratification is not only associated to higher surface water temperature, which benefits filamentous cyanobacteria (Stal, 2009), but also reduces the vertical transport of nutrients from intermediate layers into surface waters. During the heavily stratified periods, nitrate often drops below detection limit, whereas residual phosphate remains available in the euphotic zone of Lake Tanganyika (Edmond et al., 1993; Mziray et al., 2018). Below the euphotic zone, the concentrations of both nitrate and phosphate increase sharply, but the molar nitrogen to phosphorous (N:P) ratios of the dissolved inorganic nutrient stocks typically remain below the optimal ratio of ∼16:1 throughout the entire water column (Edmond et al., 1993). Given the large volume and limited horizontal exchange, external nutrient inputs do not play a significant role in sustaining biological production in Lake Tanganyika (Langenberg et al., 2003). Thus, the resupply of dissolved inorganic nitrogen (DIN) to the phytoplankton community largely depends on the upward transport from the deeper, nutrient-rich water masses.
Previous studies suggested that filamentous cyanobacteria profit from the relative DIN scarcity during periods of intense stratification in Lake Tanganyika (Descy et al., 2005; Horion et al., 2010), due to their capacity of fixing dinitrogen gas (diazotrophy). Throughout the dry season (May-September), upwelling and vertical mixing continuously resupply both nitrate and phosphate (Plisnier et al., 1999) stimulating non-diazotrophic phytoplankton that outcompetes filamentous cyanobacteria. When the upper water column re-stratifies in September-November, the phytoplankton draws down the available nutrients (Hecky and Kling, 1981), leading to excess phosphate but virtually no free nitrate. Such a nutritional imbalance can favor the growth of diazotrophic cyanobacteria (Kelly et al., 2021), which might be able to maintain high growth rates by accumulating P in their cells (Descy et al., 2005). This concept explains the nutrient dynamics and temporal phytoplankton succession during the rapid warming phase in the southern upwelling area. However, it is less clear which mechanisms contribute to the spatiotemporal variability in diazotrophic cyanobacteria abundance beyond this initial phase (Horion et al., 2010). In the present study, we explore why diazotrophic cyanobacteria do not persistently dominate under conditions, where the surface waters are nitrate-depleted and contain phosphate, which is typical of Lake Tanganyika (Edmond et al., 1993; Mziray et al., 2018).
We hypothesize that besides the measurable nutrient stocks, additional factors, such as the nutrient resupply from deeper waters, contribute to the proliferation of diazotrophic cyanobacteria. Brentrup et al. (2016) demonstrated that the relative location of the metalimnion to the euphotic zone thickness can induce shifts in the vertical location of the chlorophyll peak. Besides directly affecting the cell distribution, the layers exhibiting the strongest vertical density differences in the water column, i.e. the metalimnion or the thermocline, also control the vertical transport of nutrients. Assuming that DIN is depleted, whereas phosphate and micronutrients needed for N fixation are available throughout surface waters, another possible niche formation for diazotrophic cyanobacteria could be defined by two scenarios: 1) When the thermocline is located within the euphotic zone, the vertical transport of nitrate into the euphotic zone is rapid (Figure 1A). The chlorophyll peak is then located in the lower part of the euphotic zone, where DIN-assimilating phytoplankton thrive off the available light and nutrients (Vuorio et al., 2003; Descy et al., 2005, 2010). Diazotrophic cyanobacteria are not competitive under these conditions. 2) By contrast, a thermocline below the euphotic zone severely slows down the vertical transport of nitrate into the euphotic zone (Figure 1B). This creates a favorable environment for diazotrophic cyanobacteria near the surface, where they can cause shallow chlorophyll maxima (Descy et al., 2005; Horion et al., 2010).
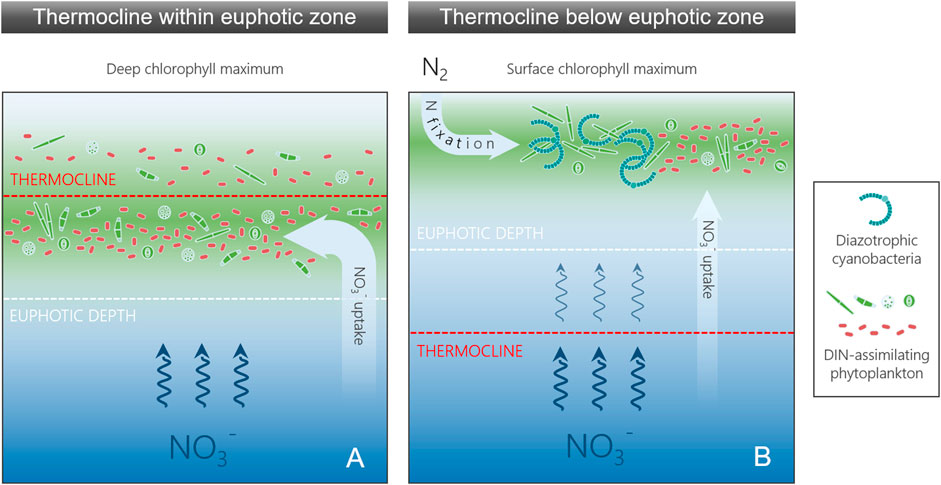
FIGURE 1. Two conceptual scenarios explaining the abundance of diazotrophic cyanobacteria and chlorophyll a (Chl) concentrations as response to the thermocline location and the euphotic depth in Lake Tanganyika when surface nitrate (NO3−) is depleted and phosphate available. (A) The thermocline is located within the euphotic zone, facilitating a rapid resupply of deep-water nitrate (NO3−). Dissolved inorganic nitrogen (DIN) assimilating phytoplankton outcompete diazotrophic cyanobacteria and form the subsurface Chl peak, because they are the key players under the high light and nutrient availability in the lower part of the euphotic zone. (B) The thermocline is located below the euphotic zone. The reduced supply of deep-water NO3− into the euphotic zone creates a favourable environment for diazotrophic cyanobacteria, because they can exploit atmospheric nitrogen (N2) as a N source. Diazotrophs are highly abundant near the water surface resulting in a surface Chl peak.
Here, we explore the applicability of these two conceptual scenarios to Lake Tanganyika. We collected a combination of physical, biogeochemical, pigment, and microscopic plankton data during two lake-wide sampling campaigns at the end of the dry season and at the end of the rainy season. The spatial and temporal dynamics of the surface blooms were further constrained with remote sensing images. Moreover, we investigated the metabolic capacities and nitrogen acquisition pathways of different phytoplankton taxa using state-of-the-art metagenomic tools.
Materials and Methods
Study Site
The hydrodynamics of Lake Tanganyika (Figure 2A) is controlled by seasonal and regional differences in meteorology. Verburg et al. (2011) distinguished four stages in the annual cycle: 1) The lake is stratified with a stagnant water column during the calm and warm rainy season from November to April. 2) At the beginning of May, cool, southerly trade winds push the surface waters northward, tilting the thermocline and leading to an upwelling in the south. 3) Stratification is further weakened by heat loss to the atmosphere during the dry season from May to September. The latitudinal gradient in heat exchange (Verburg et al., 2011) or the equilibrium flow of the surface water caused by decelerating winds (Delandmeter et al., 2018), reverse the circulation pattern during the late dry season from July to September. 4) Once the trade winds cease in October, the lake circulation slows down and the thermocline gradually re-establishes. This initiates oscillations through internal waves (Naithani et al., 2003) with a secondary upwelling in the north (Plisnier et al., 1999). Variability in the circulation and stratification patterns as well as the magnitude of riverine inflow moderate the abundance of plankton as well as the concentrations of particulate and dissolved organic matter in the upper water column. These effects control the light attenuation, and thus regulate the thickness of the euphotic zone (Plisnier et al., 1999), which can vary between 20 and 70 m (Langenberg et al., 2002) with yearly averages of about 30–40 m (Hecky et al., 1978; Cocquyt and Vyverman, 2005; Descy et al., 2005).
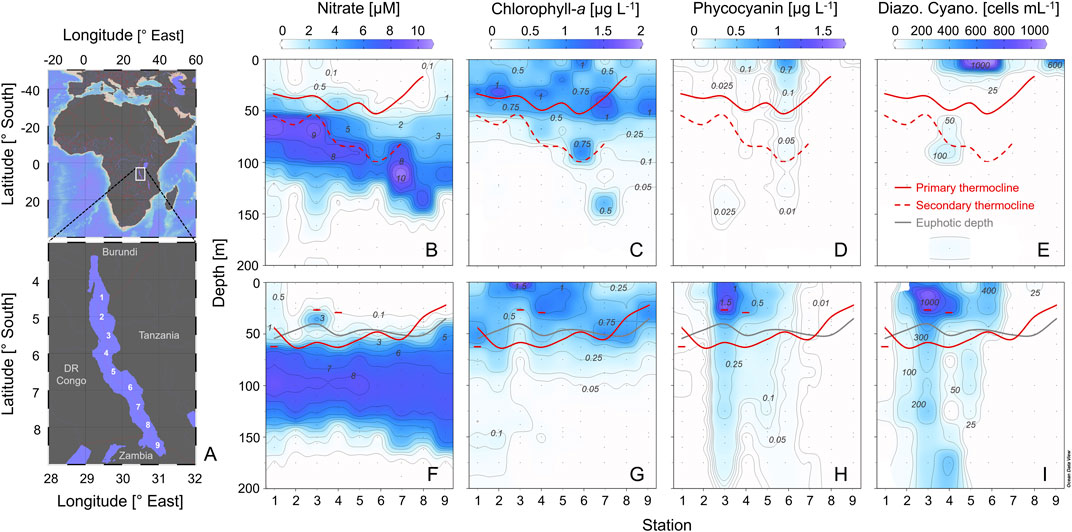
FIGURE 2. Map of Lake Tanganyika showing the 9 sampling stations in a north-south transect (A). Distribution of the nitrate (B, F), chlorophyll-a(C, G), and phycocyanin concentrations (D, H), as well as the cell abundance of filamentous diazotrophic cyanobacteria (E, I) in Lake Tanganyika. The colored lines depict the locations of the primary thermocline and the euphotic depth as well as shallow and deep secondary thermoclines. The upper panels correspond to the end of the cool dry season (September/October 2017) and the lower panels to the end of the more stratified, warm rainy season (April/May 2018). Dots indicate samples.
Sampling
The hydrodynamic variability in Lake Tanganyika and the complex logistics limit the opportunities for continuous and regular observations of the lake plankton and environmental parameters. In order to combine high spatial coverage with a seasonal perspective, we collected vertical profiles along a lake-wide transect (9 stations) during two cruises at the end of the dry season (28 September - 8 October 2017) and the end of the rainy season (27 April–7 May 2018) (Supplementary Table 1). This sampling approach has been adopted in some previous studies (e.g. Salonen et al., 1999; Stenuite et al., 2009). It allowed us to capture the pronounced north-south differences as well as to observe the Dolichospermum blooms typical for these periods (Hecky and Kling, 1981). During the two lake-wide expeditions, hereafter ‘Sep/Oct’ and ‘Apr/May’, the CTD profiling (Sea-Bird SBE 19plus) and discrete water sampling at 5–25 m depth intervals (Niskin bottles, 20–30 L) were carried out on-board of M/V Maman Benita.
Physical Parameters
The euphotic depth was defined as the depth where 1% of the surface photosynthetic active radiation arrives. Water column stability was calculated as buoyancy frequency (N2) from CTD downcasts using the software SBE Data Processing. Clear peaks in buoyancy frequency were interpreted as thermoclines. Only thermoclines limiting the DIN flux were relevant for our study, i.e. these separating DIN-depleted surface waters from underlying DIN-rich water masses (Supplementary Table 2, hereafter “primary thermoclines”). Other thermoclines will be referred to as “secondary thermoclines”. The surface mixed layer depth was defined as the shallowest depth, where the density gradient was ≥0.01 kg m−4 (Lukas and Lindstrom, 1991). To compare the overall thermal stability of the upper water column among the two sampling occasions, we calculated the Schmidt stability over 1 m2 in the upper 100 m for each station using the R package “rLakeAnalyzer” (Winslow et al., 2019). The Schmidt stability (Schmidt, 1928; Idso, 1973) denotes the energy required to homogenize the water column.
Nutrients
Nutrient subsamples were taken directly from the Niskin bottles and filtered sterile using 0.2 µm cellulose acetate membrane filters. The filtered samples (∼50 ml) were stored for maximum 4 h at 5°C before processing. Subsamples of 5 ml were pipetted into reaction tubes and reagents were added for each nutrient compound (soluble reactive phosphate SRP; ammonium NH4+; nitrate NO3− and nitrite NO2−) following standard methods (Grasshoff et al., 1999; Holmes et al., 1999; Schnetger and Lehners, 2014, respectively). Reagents and standards were prepared freshly each day. Ammonium was analysed with a Turner Trilogy fluorometer, while all other nutrients were measured with a NOVA 60 photometer. The detection limits of these methods were 0.22, 0.34, 0.20, and 0.03 µM on average for SRP, NH4+, NO3−, NO2−, respectively. Sample and standard reproducibility were generally better than 5%. Seston samples were collected by filtering 2–4 L lake water onto pre-combusted GF/F filters (Whatman, United Kingdom) and oven dried at 60°C for 48 h. For quantification of the seston N and P content, filter samples were digested in an autoclave using a potassium persulfate (K2S2O8) solution at land-based facilities. Concentrations of N and P were determined photometrically with the vanadium chloride (Schnetger and Lehners, 2014) and molybdenum blue method (Grasshoff et al., 1999), respectively.
Pigments
Photopigment concentrations were analyzed as proxies for biomass of total phytoplankton (chlorophyll-a) and of cyanobacteria (phycoerythrin and phycocyanin; Salonen et al., 1999). Samples for pigment analyses were filled in 20 or 30 L containers and stored in the dark for maximum 2 h at ambient temperatures. Chlorophyll-a (Chl) concentrations were determined according to the recommendations of Wasmund et al. (2006). Between 2 and 4 L were filtered onto 47 mm glass fibre filters (GF55, Hahnemühle) using a suction pump. The filters were immediately transferred to 15 ml plastic tubes and 5 ml ethanol (>90%) were added, followed by 10 min cold ultrasonification. The samples were stored at 5°C overnight and sterile-filtered using 0.2 µm cellulose acetate membrane filters the next morning. The extracts were measured with a Turner Trilogy fluorometer. We followed the same procedure for measuring the concentrations of phycoerythrin (PE) and phycocyanin (PC) with the distinction of using phosphate buffer (0.05 M, pH neutral) as solvent. Samples were handled and processed in the dark. We calculated the integrals from the water surface to 125 m depth to include only photosynthetically active organisms from the oxygenated epi- and metalimnion.
Phytoplankton Community Analyses
Phytoplankton samples were collected to validate and interpret results from the pigment analyses. Sampling focussed on the medium to large size fractions (>10 µm) of the phytoplankton community and particularly on the bloom forming, diazotrophic cyanobacterium Dolichospermum as well as other bloom-associated taxa. Briefly, phytoplankton samples (4–10 L) were concentrated to 20 ml on a 10 µm plankton net and then immediately fixed with alkaline Lugol solution. 2 ml subsamples were then analyzed by inverted microscopy (×400 magnification). Phytoplankton genera and species were determined according to Komárek and Anagnostidis (1999), Komárek and Anagnostidis (2007), and Streble and Krauter (1988) and detailed taxonomic data are given in Supplementary Table 3. Cyanobacteria were counted as colonies and are therefore numerically underrepresented relative to unicellular phytoplankton within the studied size fraction. To contrast our conservative approach with a cell-based metric, we have determined an average cell number per colony from at least 10 colonies. The average colony size was then used to calculate the final cell numbers. The biovolume of filamentous cyanobacteria (Dolichospermum and Anabaenopsis) was calculated according to Pomati et al. (2020). We calculated the integrals from the water surface to 125 m depth. The Shannon-Wiener diversity index (H) for each sampled depth was calculated from the cell abundance data as
where pi is the relative abundance of species i.
Zooplankton Abundances
We sampled the zooplankton community by vertical net hauls over the entire oxygenated water column (top 150 m) to test, if zooplankton abundance was negatively correlated to the poorly palatable diazotrophic cyanobacteria (Descy and Sarmento, 2008). To collect different size fractions of the zooplankton community, we used nets with three different mesh sizes. The 25 and 95 µm nets with 0.03 and 0.02 m2 mouth openings, respectively, were used for small individuals and a 250 µm net with a 0.28 m2 mouth opening for larger, fast swimming specimens. Zooplankton samples were preserved in ethanol. At land-based facilities, the total zooplankton density was determined via compound microscopy (Leica Wild M3B) under ×200 magnification.
DNA Sampling and Metagenomics
DNA sampling and preservation was done according Mayr et al. (2020) with slight modifications. Samples for metagenomic analyses were collected at station 2 (1 and 20 m depth; April 29th, 2018) and at station 7 (1 and 43 m depth; May 5th, 2018). Lake water was filtered through 0.2 μm cellulose acetate filters, fixed with RNAlater (Sigma Life Science) and stored at 4°C. Upon return to the laboratory, the filters were stored at −80°C. Filters were then thawed and washed with TE buffer (1x) prior to DNA extraction using the AllPrep DNA/RNA extraction kit from Qiagen (Callbeck et al., 2021). The metagenomes were sequenced using the Illumina NextSeq platform to generate 150 bp paired end reads (averaging ∼350 bp in length; Novogene Hong Kong).
The quality of each metagenome was tested using FastQC (Andrews, 2010). Prinseq (Schmieder and Edwards, 2011) was used to trim the metagenomics reads (minimum quality mean: 20; maximum allowed score for low complexity reads: 30). High-quality trimmed reads from each sample were co-assembled into scaffolds using Megahit (Li et al., 2015) with the options--min_contig 1000 and the kmer-length 21,37,47,71,87,95. MetaWRAP (Uritskiy et al., 2018) binning and refinement modules were applied to the co-assembly. Completeness and contamination rates of the final metagenome assembled genomes (MAGs) were assessed using CheckM (Parks et al., 2015). We only used bins that passed a threshold for completion of 50% and contamination rates less than 10% following the established standards (Bowers et al., 2017). MAGs were taxonomically classified using the gtdbtk classify pipeline (Chaumeil et al., 2020). Only MAGs carrying N fixation genes or those assigned to the Phylum of Cyanobacteria were used for further analysis. MAG abundances were assessed using coverM v0.2.0 (https://github.com/wwood/CoverM). Here, raw reads were mapped against the putative genomes and abundance is expressed as the coverage of raw reads on the MAGs. Open reading frame detection and subsequent gene annotation of MAG contigs was performed with prokka (Seemann, 2014). The DNA concentration for the sequencing, the total number of sequences and filtered sequences for each metagenome are summarized in Supplementary Table 4. Statistics from the recovered MAGs, along with completeness, contamination and genome size are summarized in Supplementary Table 5.
Remote Sensing
For qualitatively assessing the horizontal extent and temporal development of surface cyanobacterial blooms, we obtained 300 m resolution water quality maps from Sentinel-3 OLCI data provided by the Copernicus Global Land Service (CGLS, https://land.copernicus.eu/global/, Stelzer et al., 2018). We retrieved the Trophic State Index (TSI) in September-November 2017 and April-May 2018 for Lake Tanganyika. The TSI is formulated in discrete increments corresponding to specific chlorophyll-a concentration ranges (Carlson, 1977), where TSI 0–30 ≈ 0–0.94 mg Chl-a m−3 (oligotrophic), TSI 40–50 ≈ 0.94–6.4 mg Chl-a m−3 (mesotrophic), TSI 60–70 ≈ 6.4–56 mg Chl-a m−3 (eutrophic), and TSI 80–100 ≈ 56–1,183 mg Chl-a m−3 (hypertrophic state).
Breakpoint Analysis
We performed a breakpoint analysis using the R package “segmented” (Muggeo, 2008) to identify the location of a potential threshold values in the relationship between the depth-integrated abundance of diazotrophic cyanobacteria and the depth of the thermocline. For breakpoint estimation, the method uses a simple linearization technique and required exclusion of a single apparent outlier (station 9 in Sep/Oct). We additionally examined whether the relative position of the thermocline to the euphotic depth had an effect on diazotrophic cyanobacteria abundance in Apr/May, whereas we had no irradiance data for such an analysis in Sep/Oct.
Results
Biogeochemical Characterization
Our sampling in Sep/Oct was accompanied by southerly trade winds. By contrast, the weather was calm and rainy in April, whereas the onset of cool trade winds initiated the upward tilting of the thermocline in the southern basin towards the end of the sampling in May (Figure 2; Supplementary Figure 1). Accordingly, Lake Tanganyika was more strongly stratified during Apr/May, as indicated by the higher overall thermal stability of the upper 100 m, ranging from 5.8–8.3 kJ m−2 in Apr/May as compared to 4.2–6.0 kJ m−2 in Sep/Oct. This is further supported by the steeper thermoclines (Figure 2; Supplementary Figure 1; Supplementary Table 2) and N2 values reaching up to 5.0·10–4 s−2 compared to a maximum of 2.7·10–4 s−2 in Sep/Oct. Within each of the two campaigns, the N2 of the primary thermocline was in the same order of magnitude between the stations, varying by a factor of two at most. Beside the primary thermocline, deeper, secondary thermoclines had formed just above the nitrate peak in Sep/Oct (Figure 2; Supplementary Table 2). In Apr/May, this deep hydrodynamic feature was observed only for station 1. At stations 3 and 4, a weak and shallow secondary thermocline was recorded around 30 m depth (Figure 2; Supplementary Figure 1; Supplementary Table 2). The depth of the surface mixed layer ranged from near surface down to 54 m, with no clear latitudinal or seasonal pattern (Supplementary Table 2).
Nitrate was the main form of DIN accessible to phytoplankton (Figure 2), while ammonium and nitrite remained undetectable in the upper 120–150 m. The euphotic zone, characterized in Apr/May, varied between 35.8–54.8 m with an average of 47.3 m. Nitrate was persistently low throughout the upper 50 m of the water column and ranged from 0–4.8 µM (Figures 2B,F). Phosphate varied in a similar concentration range (0–2.2 µM), but was usually detectable (Figure 3; Supplementary Figures 2A,B). In the top 50 m, 50 and 63% of nitrate samples remained below limit of detection in Sep/Oct and Apr/May, respectively, compared to 15 and 22% of phosphate samples. The dissolved inorganic nutrients were N-deficient (98% of all observations with N:P < 16:1) throughout the entire water column (Supplementary Figures 2C,D). The seston N:P ratios in the upper 50 m varied around the Redfield ratio of 16:1. More than 99% of all seston N:P observations ranged between 10:1 and 22:1. Across both campaigns, only four seston samples showed an N:P > 22:1 (Supplementary Figure 3).
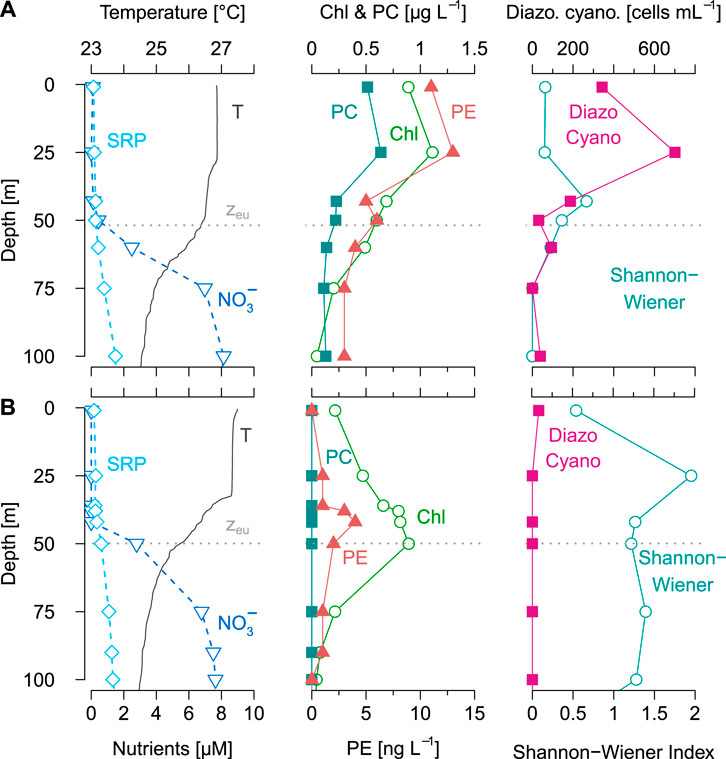
FIGURE 3. Vertical profiles of physicochemical, pigment and phytoplankton data from two exemplary stations at the end of the rainy season (April/May 2018). Station 4 (A) represents a thermocline below the euphotic zone, whereas station 8 (B) exemplifies a thermocline within the euphotic zone. The left panels shows temperature (T), euphotic depth (zeu), nitrate (NO3−), phosphate (SRP), the middle panels depict chlorophyll-a (Chl), phycocyanin (PC), and phycoerythrin, whereas the right panels represent the abundances of diazotrophic cyanobacteria and the Shannon-Wiener diversity index of the phytoplankton community (>10 µm).
The density gradient within the primary thermocline as well as its depth regulated the upward flux of metalimnetic nitrate (with maximum concentrations at 65–135 m) into the overlaying euphotic zone (0–56 m; Figure 2B,F). The primary thermocline was associated with the nutricline (strong vertical gradients in nutrient concentrations), separating nitrate-depleted surface waters from underlying nitrate-rich water masses. Hence, the vertical transport of nitrate into the productive layer was efficient only if the primary thermocline was located within the euphotic zone. In Apr/May, this condition was fulfilled at stations 1, 8, and 9. At stations 2-5, the primary thermocline was located well below the euphotic zone and at stations 6 and 7 near its lower boundary (Figure 2). We did not collect irradiance data in Sep/Oct, but the deepest positions of the primary thermocline (below 40 m) were found in the centre of the lake at stations 4-6.
Pigment Distribution and Remotely Sensed Trophic State Index
The Chl maximum was usually located between 30 and 50 m, i.e. at the bottom of the euphotic zone (Figures 2C,G, 3B). Exceptions from this general pattern occurred in Apr/May when the primary thermocline was positioned below the euphotic zone (stations 2–6) (Figures 2, 3A) and to a lesser extent in Sep/Oct when the primary thermocline was below 40 m (stations 4–6). In these cases, the main or secondary Chl peak was located at or near the water surface and the PE and PC concentrations were highest in surface waters (Figures 2D,H; Supplementary Figure 4). At other stations, the PE and PC concentrations were generally low (<0.1 μg PC L−1 and <0.001 μg PE L−1, respectively). The concentrations of PE and PC were significantly correlated with the abundance of filamentous diazotrophic cyanobacteria throughout the entire study (p < 0.001; Pearson correlation coefficients: 0.52–0.88).
In congruence with the location of the surface Chl peaks observed in our vertical profiles, the remotely sensed trophic state index (TSI) revealed elevated surface Chl concentrations in the northern and central basins during our sampling campaigns, i.e. at stations 4-6 in Sep/Oct and stations 1-5 in Apr/May (Figure 4). Apart from these patterns in offshore waters, high TSI signals in coastal areas were associated with riverine inputs, such as the Malagarasi inflow.
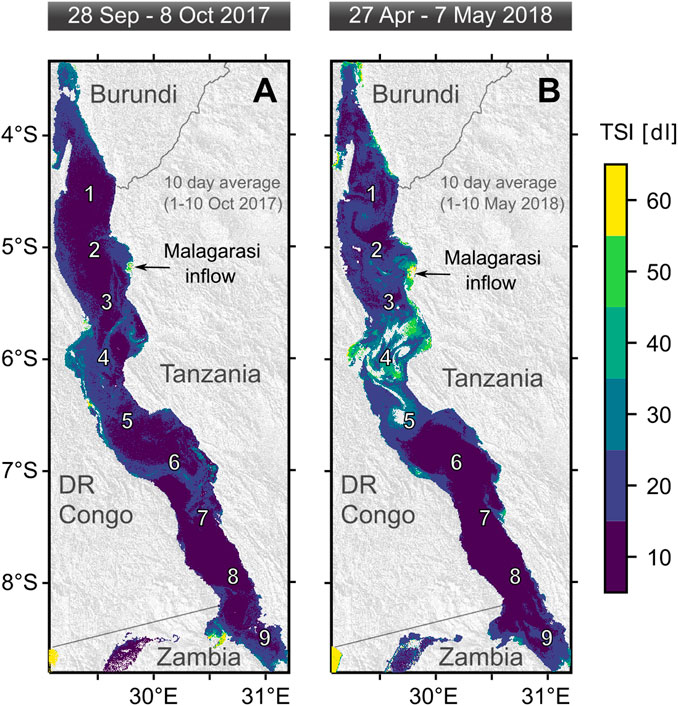
FIGURE 4. Trophic State Index (TSI) products based on Sentinel satellite data illustrating elevated surface chlorophyll-a concentrations corresponding to filamentous cyanobacteria in the northern and central part of Lake Tanganyika during the expeditions (A) in September/October 2017 and (B) April/May 2018.
Microscopic Phytoplankton Community
Filtering our samples through a 10 µm mesh allowed us to quickly accumulate sufficient material for a quantitative analysis of diazotrophic cyanobacteria. Of these Dolichospermum sp. was always the dominant taxon (we found only a few colonies of Anabaenopsis tanganyikae in the south). Dolichospermum was most abundant in the north and centre of the lake, where the primary thermocline was located below the euphotic zone (Apr/May only) or deeper than ∼40 m (Figures 2E,I). This observation is supported by our breakpoint analysis (Figure 5) showing a threshold depth in the relationship between the relative abundance of filamentous diazotrophic cyanobacteria and primary thermocline at 36.7 m (except station 9 in Sep/Oct and station 7 in Apr/May). By contrast, the abundances of diazotrophic cyanobacteria did not show a clear trend with respect to the depth of the surface mixed layer (Figure 6). We observed the highest abundances of Dolichospermum and total large-celled phytoplankton (1.2·109 colonies m−2 and 3.3·109 ind. m−2, respectively) at station 3 during Apr/May (Figure 2; Supplementary Figures 5, 6). We did not detect a significant relationship between zooplankton (Supplementary Figure 7) and diazotrophic cyanobacteria (p > 0.1, Spearman rank correlation tests).
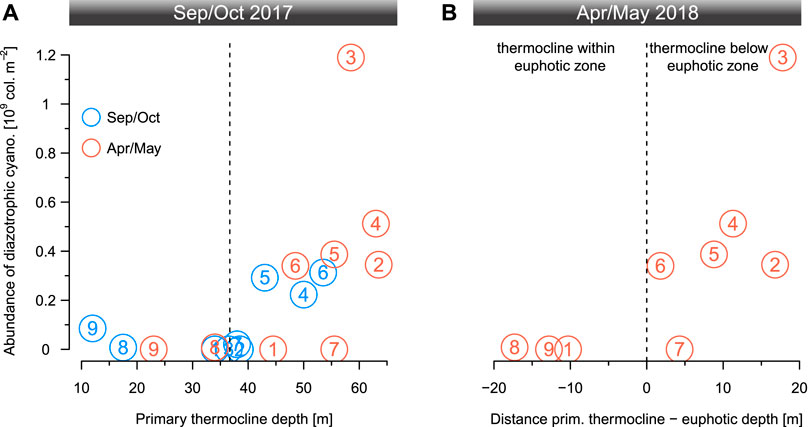
FIGURE 5. The depth-integrated abundance of diazotrophic cyanobacteria colonies for the 9 sampling stations plotted (A) as a function of primary thermocline depth for the end of the dry season (September/October 2017) and the end of the rainy season (April/May 2018) and (B) against the distance between euphotic depth and primary thermocline location for the warm season (irradiance data for Sep/Oct missing). In Sep/Oct, the diazotrophic cyanobacteria abundances were high if the thermocline was located below 40 m. A breakpoint analysis identified 36.7 m as breakpoint location in the relationship between these two variables. In Apr/May, the abundances of diazotrophic cyanobacteria were high if the thermocline was located below the euphotic zone.
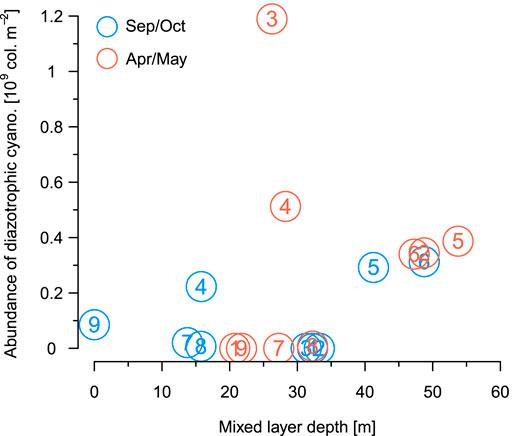
FIGURE 6. The depth-integrated abundance of diazotrophic cyanobacteria colonies for the 9 sampling stations plotted as a function of surface mixed layer depth for the end of the dry season (blue: September/October 2017) and the end of the rainy season (red: April/May 2018).
In congruence with the abundance data, the average biovolume of diazotrophic cyanobacteria in the top 25 m varied between 0 and 130 mm3 m−3 (station 3 Apr/May; Figure 7). The average Dolichospermum colony consisted of 36 and 44 vegetative cells and up to 4 heterocysts in Sep/Oct and Apr/May, respectively (Figure 8). Often, we found single Nitzschia (diatoms) cells or entire clusters entangled in Dolichospermum colonies (Figure 8). Less frequently, other taxa such as Oocystis (chlorophytes) and other chlorophytes were apparently associated to Dolichospermum colonies.
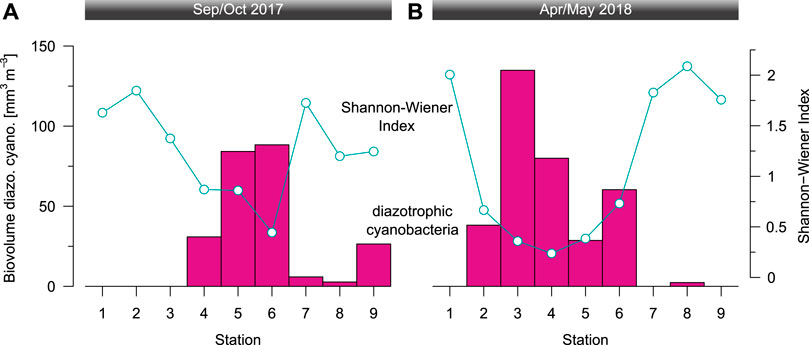
FIGURE 7. The average biovolume of filamentous, diazotrophic cyanobacteria in the top 25 m and Shannon-Wiener diversity index of the depth-integrated phytoplankton community (>10 µm) during (A) the end of the dry season (September/October 2017) and (B) the end of the rainy season (April/May 2018).
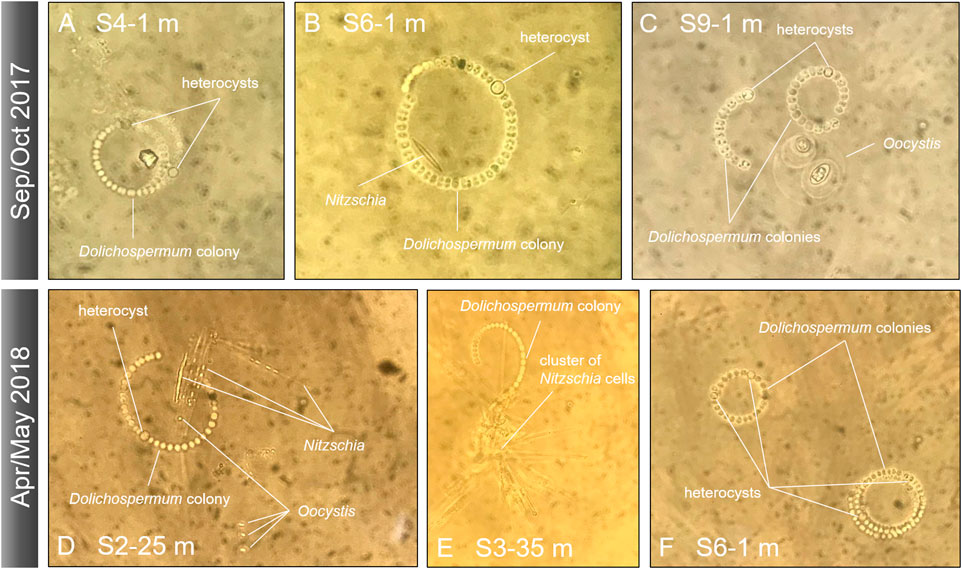
FIGURE 8. Microscopic images of Dolichospermum colonies with heterocysts and potential associations with other taxa at various sites during September/October 2017 (top) and April/May 2018 (bottom). Panels (A, F) show Dolichospermum colonies in the absence of other taxa. Panels (B,C) depict Nitzschia and Oocystis cells in close vicinity of Dolichospermum colonies, whereas (D,E) reveal clusters of Nitzschia apparently being entangled in Dolichospermum colonies.
The Shannon-Wiener diversity index of the studied phytoplankton community fraction (>10 µm) was highest in the top 50 m (Figure 3), where it ranged from 0.1–1.9 in Sep/Oct and 0.1–2.0 in Apr/May, respectively. The depth-integrated values ranged from 0.4–1.8 in Sep/Oct and 0.2–2.1 in Apr/May, respectively (Figure 7). During both campaigns, the minimum Shannon-Wiener diversity index coincided with the “bloom” of diazotrophic cyanobacteria. Overall, the sampled medium- to large-sized fraction of the phytoplankton community was dominated by chlorophytes, diatoms, and cyanobacteria with respectively lower contributions from dinophytes and euglenophytes (Supplementary Figures 5, 6). Notably, cyanobacterial colonies were counted as one individual for the conservative analysis in Supplementary Figure 5. Thus, colony-forming cyanobacteria (i.e., Microcystis and filamentous diazotrophic cyanobacteria) are underrepresented compared to unicellular taxa. Their contribution to total phytoplankton abundance is much higher when based on the average cyanobacterial colony size (i.e., cell number) in the studied phytoplankton size fraction (Supplementary Figure 6).
Metagenomics
Using MAGs, we have analysed phytoplankton taxa carrying N fixation genes and all identified cyanobacteria. In our samples, the only photoautotrophic MAG with a complete N fixation operon, consisting of nifHDK, corresponded to the genus of Dolichospermum (95%; Figure 9). Dolichospermum also exhibited the capacity to assimilate a full spectrum of dissolved inorganic nitrogen species (nrgA, narB, and nrtABCD) and had numerous transporter genes involved in C, N, P, Fe, and micronutrient exchange, e.g. nrgA and efeU. In contrast to Dolichospermum, MAGs corresponding to the picocyanobacteria Cyanobium (96%) and Vulcanococcus (99%) contained no nitrogenase genes, thus precluding N fixation by these cyanobacterial taxa (Figure 9). While Cyanobium appeared to be specialized on nitrate uptake (6 copies of the nitrate import permease nrtABCD), Vulcanococcus showed the metabolic potential for both, nitrate and ammonium assimilation (nrgA, narB, and nrtABCD).
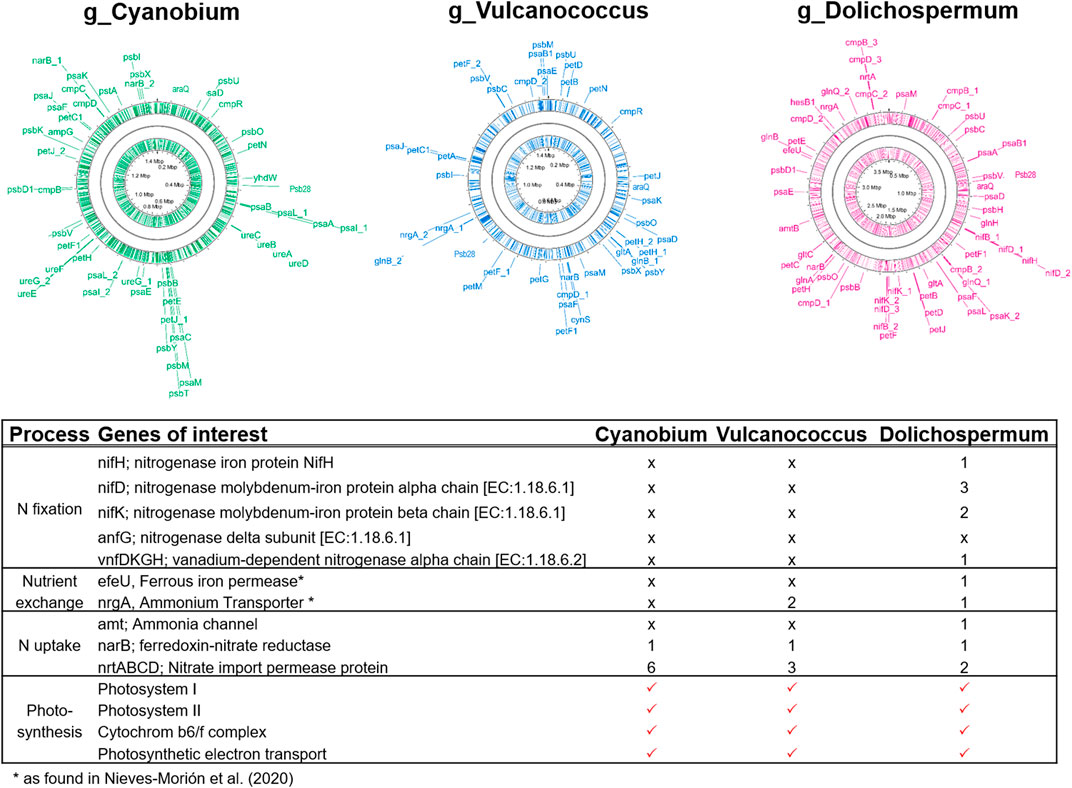
FIGURE 9. Genes involved in nitrogen fixation (nifHDK, anfG, and vnfDKGH), dissolved inorganic nitrogen uptake (amt, narB, and nrtABCD), and photosynthesis from the metagenome assembled genomes identified as the picocyanobacteria Cyanobium and Vulcanococcus as well as the filamentous cyanobacterium Dolichospermum. nrgA and efeU are responsible for nitrogen and iron exchange in Dolichospermum-diatom symbioses, respectively (Nieves-Morión et al., 2020).
Discussion
The Role of the Thermocline for Diazotrophic Cyanobacteria
Our data imply that high densities of diazotrophic cyanobacteria (esp. Dolichospermum) were associated to a reduced DIN resupply to the surface waters in Lake Tanganyika (Figure 2). This hypothesis is further supported by a breakpoint analysis indicating that the location of the primary thermocline (Figure 5A) and its position relative to the euphotic depth (Figure 5B), can be an important driver of diazotrophic cyanobacteria abundances by controlling the upward DIN transport into the euphotic zone. The modelled threshold depth of 37 m corresponds well to previous estimates of the mean euphotic zone thickness in Lake Tanganyika, ranging mostly between 30 and 40 m (Cocquyt and Vyverman, 2005; Descy et al., 2005).
Stations 2-5 during April/May provide a striking example where high abundances of diazotrophic cyanobacteria occurred in association with a low nitrate availability (Figures 2, 3A). Here, the surface zone was nitrate-depleted, whereas phosphate was available in excess. In addition, the resupply of nitrate was slowed down by a deep primary thermocline situated well below the euphotic zone. This potentially created preconditions favoring diazotrophic cyanobacteria near the surface, where irradiance is high (Ward et al., 2013; Follett et al., 2018). The low Shannon-Wiener diversity index suggests that diazotrophic cyanobacteria were dominating in the studied size fraction (>10 µm) of the phytoplankton community under these conditions. Congruently, the accumulations of diazotrophic cyanobacteria were also detected as shallow Chl maxima (also see Brentrup et al., 2016, for vertical shifts of Chl peaks). We cannot completely preclude the activity of other diazotrophs in surface water of Lake Tanganyika, but our metagenomic analyses support that Dolichospermum was the only diazotrophic phytoplankton species during our survey (Figure 9). In addition, the high frequency of heterocysts observed in the collected Dolichospermum colonies indicate active N fixation (Figure 8). Nitrogen fixation may have contributed to a balanced nutrient supply of the surface phytoplankton community, as implied by the approximate Redfield stoichiometry of our seston samples (Supplementary Figure 3; Bootsma and Hecky, 1993; Hecky et al., 1991).
The distribution of diazotrophic cyanobacteria assessed by microscopy is affirmed by high PE and PC signals at stations 2–6 (Apr/May) and 4–6 (Sep/Oct), with both PE and PC significantly correlating with the abundance of diazotrophic cyanobacteria (Figure 2; Supplementary Figure 4). The PE and PC concentrations can also relate to picocyanobacteria, which often dominate in Lake Tanganyika (Descy et al., 2005; Descy et al., 2010; Stenuite et al., 2009). However, at stations with a low nitrate supply, diazotrophic cyanobacteria reached biovolumes between 20 and 130·105 mm3 m−3. These estimates are well in range or higher than the total biovolume of the pico-to nano-phytoplankton fraction estimated previously (De Wever et al., 2005). Moreover, picocyanobacteria apparently prefer high nutrient conditions in Lake Tanganyika (Descy et al., 2010). Correspondingly, our MAGs revealed that they rely solely on nitrate, ammonium, or organic compounds as N sources, with Cyanobium being particularly specialized in taking up nitrate (Figure 9). For bridging N-starvation periods, picocyanobacteria are known to degrade their phycobilisomes (composed of PE and PC) to generate bioavailable N (Lahmi et al., 2006; Di Cesare et al., 2018). Thus, we interpreted the near-surface peaks in PC and PE at stations 4–6 (Sep/Oct) as well as 2–6 (Apr/May) as coming from diazotrophic cyanobacteria with possibly lower contributions from picocyanobacteria.
In contrast to the observations from stations 2–5 (Apr/May) and 4–6 (Sep/Oct), station 8 (Apr/May) is an illustrative example where the relatively high nitrate supply possibly constrained diazotrophic cyanobacteria (Figure 3B). Although surface nitrate concentrations were persistently low, the shallow primary thermocline located well within the euphotic zone apparently facilitated a rapid nitrate resupply, which sustained a non-diazotrophic phytoplankton community. Our observations of the medium- to large-sized phytoplankton (>10 µm), revealed that diatoms (esp. Navicula, Cymbella, and Nitzschia) and chlorophytes, rather that filamentous cyanobacteria, dominated the studied community fraction. These non-diazotrophic phytoplankton taxa were associated to the Chl maximum at the bottom of the euphotic zone, where both light and nutrients were available. The concentrations of PE and PC were lower and likely stemmed from picocyanobacteria (Stenuite et al., 2009), which we would expect to be abundant under these conditions (Descy et al., 2005; Descy et al., 2010).
In Apr/May, the formation of a shallow, secondary thermocline may have played an additional role in stimulating the growth and accumulation of diazotrophic cyanobacteria. At the center of the Dolichospermum “bloom” at stations 3 and 4, we observed a weaker, secondary thermocline at ∼30 m (Figure 2; Supplementary Figure 1; Supplementary Table 2), which further slowed down the nitrate resupply to the surface mixed layer. We speculate that this surface thermocline may have formed through convective processes. The weather was sunny during our sampling in the south, whereas it was rainy and cloudy at the northern stations (1–5). In the tropics, only a few cloudy days or one single storm can generate sufficient cooling of the surface waters to create an additional surface mixed layer superimposed on the deeper mixed layer (Lewis, 1987). Following this line of argumentation, we interpret the small nitrate peak at station 3 at 35 m (Figure 2F) as regenerated DIN originating from the local degradation of the surface phytoplankton biomass within the shallow thermocline.
Alternatively, the shallow surface thermocline may have resulted from the lateral inflow of the Malagarasi river. However, neither pH nor conductivity or dissolved organic carbon values (Supplementary Figure 8) in this water mass indicate a riverine origin of this layer (Athuman and Nkotagu, 2013). Therefore, a convective mechanism offers a more plausible explanation. The limited influence of the river inflow is also supported by our analysis of the satellite images showing that the river plume induced elevated surface production only in close proximity of the delta spreading out northward, i.e. in opposite direction of the surface “bloom” in offshore waters, which spanned over the entire central basin and parts of the north basin (Figure 4). Overall, we note that a shallow surface mixing likely benefited filamentous cyanobacteria, but did not represent a unifying precondition for their growth during our sampling. This observation relates also to the lack of a significant relationship between the mixed layer depth and the abundance of these diazotrophs (Figure 6).
Other Potential Controls on Diazotrophic Cyanobacteria
The presence of the two outliers in the breakpoint analysis (Figure 5) deserves some further consideration. For example, at the southernmost station 9 in Sep/Oct we observed comparably low, but detectable abundances of diazotrophic cyanobacteria (8.5·107 colonies m−2) despite weak stratification (Supplementary Table 2) and high surface nitrate concentrations (Figure 2). For this specific observation, we attribute the stimulation of diazotrophic cyanobacteria to the exceptionally high excess phosphate (N:P < 4:1) from upwelling or dry season mixing (Plisnier et al., 1999; Verburg et al., 2011). This situation is analogous to observations from coastal ecosystems, where blooms of diazotrophic cyanobacteria are triggered by nutrient pulses with low N:P (Vahtera et al., 2007). The subsequent formation of the surface bloom of diazotrophic cyanobacteria at the southern end of the lake (Figure 10) was likely coupled to a gradual decrease in DIN availability, which favors phytoplankton capable of fixing nitrogen (Hecky and Kling, 1981; Descy et al., 2005). This argument stands well in line with our initial hypothesis and the observations outlined above, where diazotrophs have a competitive advantage when DIN is depleted and the resupply is slow (Horion et al., 2010). Some other contrasting patterns in diazotrophic cyanobacteria distribution, i.e. their absence at station 7 in Apr/May, could be attributed to a lagged response of the phytoplankton community to immediate changes in DIN resupply. For instance, when the thermocline deepens rapidly below the euphotic zone, then diazotrophic cyanobacteria will become abundant only after non-diazotrophs have consumed the replenished DIN in the euphotic zone below a degree that it may constrain their growth.
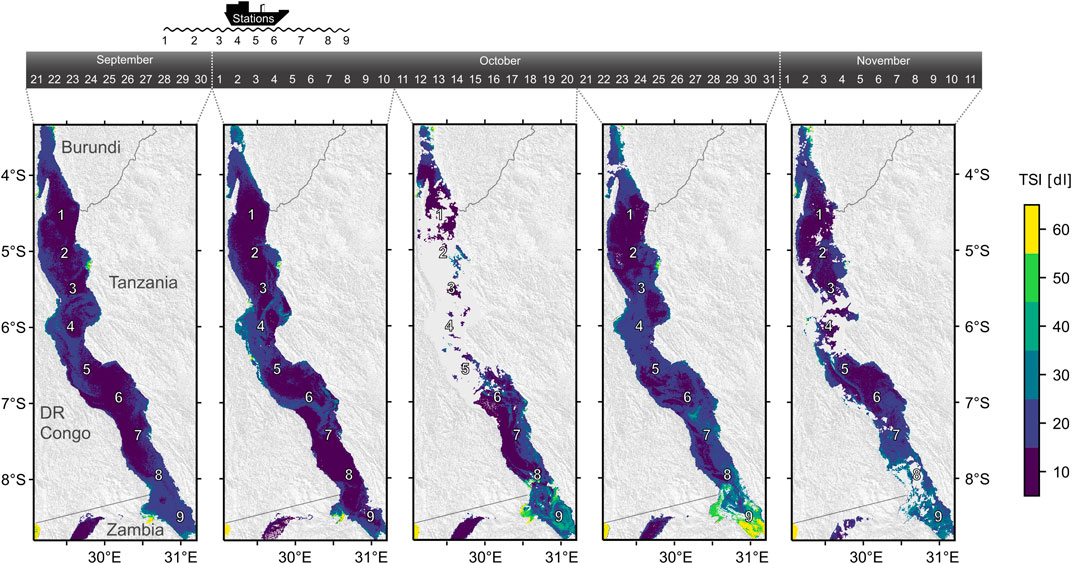
FIGURE 10. Trophic state index (TSI) based on Sentinel satellite data showing the evolution and decay of the surface bloom in the south of Lake Tanganyika during and after the sampling campaign in 2017. The maps are calculated as averages from 2-4 single images created within the indicated time intervals. The duration of the cruise is shown on top. Numbers indicate the sampling stations.
A critical analysis of the nitrate data and the diazotrophic cyanobacteria abundances reveals an apparent controversy: In cases where the primary thermocline was located within the euphotic zone, the surface zone above the thermocline was sometimes virtually nitrate-exhausted, but diazotrophic cyanobacteria remained scarce. From a physical perspective, such a shallow thermocline will retain sinking particles within the euphotic zone and thus enhance remineralization, providing freshly regenerated DIN for DIN-assimilating taxa. Moreover, diazotrophs might be Fe-limited when DIN-assimilating phytoplankton thrive. Despite high atmospheric Fe inputs in the savannah-like landscape, some authors claimed that due to the high pH of the surface water, bioavailability of Fe may be low for some phytoplankton taxa (North et al., 2008; De Wever et al., 2008). Enhanced activity of DIN-assimilating taxa will further exhaust Fe that would otherwise be available for the Fe-expensive N fixation (Maldonado and Price, 1996). An additional ecological driver for diazotroph abundance may operate by mutualistic interactions between diazotrophs and diatoms (Foster and O’Mullan, 2008; Foster and Zehr, 2019). The physical associations between those two taxa observed in our study (Figure 8) were already previously reported in Lake Tanganyika (Van Meel, 1954), and we additionally identified key transporter genes involved in macro- and micronutrient exchange within diazotroph-diatom symbioses (Figure 9; compare with Nieves-Morión et al., 2020). Single cell techniques revealed that diazotrophic cyanobacteria fix up to 420 times more N in the presence of their diatom partner (Foster et al., 2011), but elucidating the relevance of such interactions in Lake Tanganyika requires further experimental work.
Support for the Conceptual Scenarios
Overall, our study provides first observational support for the concept outlined in Figure 1: when the euphotic zone is nitrate-exhausted and phosphate (as well as other micronutrients) are available, the location of the thermocline relative to the euphotic zone controls the resupply of deep-water DIN to surface waters, and thus potentially creates preconditions for blooms of diazotrophic cyanobacteria. This concept provides an additional bottom-up mechanism for the proliferation of diazotrophic cyanobacteria beyond the seasonal succession at the beginning of the rainy season.
Alternative explanations include selective retention of diazotrophs in surface waters. For instance, horizontal transport or grazing resistance could result in the accumulation of filamentous cyanobacteria (Salonen et al., 1999; Descy et al., 2010), although we identified no significant correlation between the abundances of zooplankton and filamentous cyanobacteria. However, even if selective retention plays a role, diazotrophic cyanobacteria first need to find suitable conditions to grow before their biomass can be accumulated by physical or biological processes. Mechanisms stimulating the aggregation of cyanobacteria as well as thermocline oscillations (Naithani et al., 2003; Naithani and Deleersnijder, 2004), which would affect the theoretical scenarios outlined above, may together contribute to the spatiotemporal variability of diazotrophic cyanobacterial (Horion et al., 2010). To reduce effects of thermocline oscillations during our sampling, both field campaigns were scheduled when internal waves should have been relatively minor, i.e. when the thermocline just re-stabilizes (Sep/Oct) and when internal waves already lost energy over the course of the calm rainy season (Apr/May). The applicability of our concept is, by design, limited to the snapshot sampling and requires further field and experimental validation; but, recent modelling (Follett et al., 2018) and previous field studies (Post et al., 2002; Cocquyt and Vyverman, 2005; White et al., 2007; Dore et al., 2008) support the idea that, during periods of strong stratification, a reduced resupply of DIN to the surface waters can provide favorable conditions for diazotrophic cyanobacteria in oligotrophic lakes and marine ecosystems.
Overall, our field study illustrates that, under DIN-depleted conditions, the resupply of nitrate from deeper waters may be an important precondition for the proliferation of diazotrophic cyanobacteria in Lake Tanganyika. Better understanding relevant ecological factors requires in-depth investigation of the interactions between diazotrophic cyanobacteria and other phytoplankton. Moreover, our results imply that the fluorometric determination of extracted phycoerythrin and phycocyanin can provide a suitable proxy for filamentous cyanobacteria, when they occur in high densities. Given that stratification increases with ongoing climate change, it is critical to evaluate the contribution of the proposed mechanism to cyanobacterial proliferation in oligotrophic lacustrine ecosystems.
Data Availability Statement
The datasets presented in this study can be found in online repositories. The limnological data set is available at the ETH Zurich Research Collection: https://www.research-collection.ethz.ch/handle/20.500.11850/418479 (Ehrenfels et al., 2020). The metagenomes were deposited in the NCBI database (https://www.ncbi.nlm.nih.gov/) under the accession numbers SAMN16709918, SAMN16709958, SAMN16709959, and SAMN16709960.
Author Contributions
BE and BW designed the study. BE, AM, KB, CD, JJ, TK, IK, and ES organized and contributed to fieldwork. BE, AM, KB, CD, JJ, and TK performed field and laboratory measurements. BE, AM, DO, KB, and RN analyzed data. BE conceptualized ideas for the paper and wrote the manuscript with input from all co-authors. BE, MB, AM, FP, and BW interpreted the data and developed the manuscript.
Funding
This project was funded by the Swiss National Science Foundation (grant CR2312-166589) and research permits were granted by the Tanzania Commission for Science and Technology (COSTECH).
Conflict of Interest
The authors declare that the research was conducted in the absence of any commercial or financial relationships that could be construed as a potential conflict of interest.
Publisher’s Note
All claims expressed in this article are solely those of the authors and do not necessarily represent those of their affiliated organizations, or those of the publisher, the editors and the reviewers. Any product that may be evaluated in this article, or claim that may be made by its manufacturer, is not guaranteed or endorsed by the publisher.
Acknowledgments
This work would not have been possible without the efforts of our research collaborators from the Tanzania Fisheries Research Institute, particularly the Directors Rashid Tamatamah and Semvua Mzighani as well as Mary Kishe. Asante sana. We are grateful to Anthony Kalangali for support in the field and lab. We owe special thanks to Mupape Mukuli as well as the captain and crew of the M/V Maman Benita for their organizational efforts and technical support during the sampling campaigns. We also thank Andreas Brand for field assistance, the Aquatic Physics Group at Eawag for their help with interpreting the physical data, Patrick Kathriner, Marta Reyes, and Daniel Steiner for lab assistance, and Eliane Scharmin, Luzia Fuchs, and Patricia Achleitner for their administrative support. We further thank our co-collaborators Ole Seehausen, Catherine E. Wagner, and Tim Kalvelage for initiating this project. Thanks to Cameron M. Callbeck for help in the field and insightful discussions.
Supplementary Material
The Supplementary Material for this article can be found online at: https://www.frontiersin.org/articles/10.3389/fenvs.2021.716765/full#supplementary-material
Supplementary Figure 1 | Temperature profiles of all nine sampling stations during September/October 2017 (A) and April/May 2018 (B), including the approximate depths of the primary and secondary thermocline.
Supplementary Figure 2 | Contour plot showing the distribution of the phosphate (SRP) and the dissolved inorganic nitrogen (DIN) versus phosphate ratios in Lake Tanganyika during (A, C) the end of the dry season (September/October 2017) and (B, D) the end of the more stratified rainy season (April/May 2018). Dots indicate samples.
Supplementary Figure 3 | The molar N:P ratios of seston during the end of the dry season 2017 (Sep/Oct) and the end of the rainy season 2018 (Apr/May) in Lake Tanganyika. Data is shown for the upper 50 m, encompassing the euphotic zone and the chlorophyll maximum. The dotted red line represents the cut-off for P limitation defined by previous studies (Healey and Hendzel, 1979; Guildford and Hecky, 2000; Stenuite et al., 2007), with P limitation occurring at ratios >22.
Supplementary Figure 4 | Phycoerythrin concentrations during (A) the end of the dry season (Sep/Oct 2017) and (B) the end of the rainy season (Apr/May 2018) in Lake Tanganyika. Dots indicate samples.
Supplementary Figure 5 | The depth-integrated phytoplankton abundances (A,B) and community compositions (C,D) of the >10 µm size fraction during the end of the dry season (September/October 2017) and the end of the rainy season (April/May 2018). The depth of taxonomic hierarchy varies to highlight functionally relevant taxa. We divided diatoms into the genus Nitzschia and others. Cyanobacteria were partitioned by genus with the exception of Dolichospermum and Anabaenopsis. We pooled these heterocystous and filamentous genera due to their capability of fixing atmospheric nitrogen (diazotrophs). Note cyanobacterial colonies (Microcystis and diazotrophs) were treated as one individual and are thus, underrepresented compared to the unicellular taxa (see also Supplementary Figure 6).
Supplementary Figure 6 | The depth-integrated phytoplankton cell abundances (A, B) and community compositions (C, D) of the >10 µm size fraction during the end of the dry season (September/October 2017) and the end of the rainy season (April/May 2018). The depth of taxonomic hierarchy varies to highlight functionally relevant taxa. We divided diatoms into the genus Nitzschia and others. Cyanobacteria were partitioned by genus with the exception of Dolichospermum and Anabaenopsis. We pooled these heterocystous and filamentous genera due to their capability of fixing atmospheric nitrogen (diazotrophs). Note that the number of cells of colony forming cyanobacteria (Microcystis and diazotrophs) were calculated from an average number of cells per colony.
Supplementary Figure 7 | Total zooplankton abundances of different size fractions (25, 95, and 250 µm) for (A) the end of the dry season (September/October 2017) and (B) the end of the rainy season (April/May 2018). Note that the y-axis is logarithmic.
Supplementary Figure 8 | Vertical profiles of physical, biogeochemical and biological data from station 3 at the end of the rainy season (April/May 2018). The left panel shows temperature (T) and euphotic depth (zeu) as well as the nitrate (NO3−), phosphate (SRP), chlorophyll-a (Chl), and phycocyanin (PC) concentrations, whereas the right panel exhibits conductivity, pH, turbidity and the dissolved organic carbon (DOC) concentrations.
Supplementary Table 1 | Station dates and coordinates of the two expeditions at the end of the dry season (September/October 2017) and at the end of the rainy season (April/May 2018).
Supplementary Table 2 | Depth and strength, measured as buoyancy frequency (N2), of the thermocline, mixed layer depth, and euphotic depth (zeu) during the end of the dry season (September/October 2017) and the end of the rainy season (April/May 2018). At some stations, secondary thermoclines had formed. The primary thermoclines separated nitrate-depleted surface waters from underlying nitrate-rich waters (Figures 1, 5; Supplementary Figure 4).
Supplementary Table 3 | List of taxa identified by microscopic phytoplankton community analyses.
Supplementary Table 4 | Overview of the metagenome samples, including the sampling date and depth, as well as the number of raw and filtered sequences (after using prinseq), and the accession number in the NCBI database.
Supplementary Table 5 | MAG statistics (completeness, contamination, GC, N50 and size) and taxonomic annotation.
References
Almanza, V., Pedreros, P., Dail Laughinghouse, H., Félez, J., Parra, O., Azócar, M., et al. (2019). Association between Trophic State, Watershed Use, and Blooms of Cyanobacteria in South-central Chile. Limnologica 75, 30–41. doi:10.1016/j.limno.2018.11.004
Andrews, S. (2010). FastQC: a Quality Control Tool for High Throughput Sequence Data. Available at: http://www.bioinformatics.babraham.ac.uk/projects/fastqc (Accessed November 20, 2019).
Athuman, C. B., and Nkotagu, H. H. (2013). A Limnological Survey of Malagarasi River in Western Tanzania. Rwanda J. 1, 74–89. doi:10.4314/rj.v1i1.6E
Bartosiewicz, M., Przytulska, A., Deshpande, B. N., Antoniades, D., Cortes, A., MacIntyre, S., et al. (2019). Effects of Climate Change and Episodic Heat Events on Cyanobacteria in a Eutrophic Polymictic lake. Sci. Total Environ. 693, 133414. doi:10.1016/j.scitotenv.2019.07.220
Bootsma, H. A., and Hecky, R. E. (1993). Conservation of the African great lakes: A Limnological Perspective. Conservation Biol. 7, 644–656. doi:10.1046/j.1523-1739.1993.07030644.x
Bowers, R. M., Kyrpides, N. C., Kyrpides, N. C., Stepanauskas, R., Harmon-Smith, M., Doud, D., et al. (2017). Minimum Information about a Single Amplified Genome (MISAG) and a Metagenome-Assembled Genome (MIMAG) of Bacteria and Archaea. Nat. Biotechnol. 35, 725–731. doi:10.1038/nbt.3893
Brentrup, J. A., Williamson, C. E., Colom-Montero, W., Eckert, W., de Eyto, E., Grossart, H.-P., et al. (2016). The Potential of High-Frequency Profiling to Assess Vertical and Seasonal Patterns of Phytoplankton Dynamics in Lakes: an Extension of the Plankton Ecology Group (PEG) Model. Inland Waters 6, 565–580. doi:10.5268/IW-6.4.890
Callbeck, C. M., Ehrenfels, B., Baumann, K. B. L., Wehrli, B., and Schubert, C. J. (2021). Anoxic Chlorophyll Maximum Enhances Local Organic Matter Remineralization and Nitrogen Loss in Lake Tanganyika. Nat. Commun. 12, 830. doi:10.1038/s41467-021-21115-5
Carey, C. C., Weathers, K. C., and Cottingham, K. L. (2008). Gloeotrichia Echinulata Blooms in an Oligotrophic lake: Helpful Insights from Eutrophic Lakes. J. Plankton Res. 30, 893–904. doi:10.1093/plankt/fbn055
Carlson, R. E. (1977). A Trophic State index for Lakes1. Limnol. Oceanogr. 22, 361–369. doi:10.4319/lo.1977.22.2.0361
Chaumeil, P.-A., Mussig, A. J., Hugenholtz, P., and Parks, D. H. (2020). GTDB-tk: A Toolkit to Classify Genomes with the Genome Taxonomy Database. Bioinformatics 36, 1925–1927. doi:10.1093/bioinformatics/btz848
Cocquyt, C., and Vyverman, W. (2005). Phytoplankton in Lake Tanganyika: a Comparison of Community Composition and Biomass off Kigoma with Previous Studies 27 Years Ago. J. Great Lakes Res. 31, 535–546. doi:10.1016/S0380-1330(05)70282-3
De Wever, A., Muylaert, K., Langlet, D., Alleman, L., Descy, J. P., André, L., et al. (2008). Differential Response of Phytoplankton to Additions of Nitrogen, Phosphorus and Iron in Lake Tanganyika. Freshw. Biol. 53, 264–277. doi:10.1111/j.1365-2427.2007.01890.x
De Wever, A., Muylaert, K., Van Der Gucht, K., Pirlot, S., Cocquyt, C., Descy, J., et al. (2005). Bacterial Community Composition in Lake Tanganyika: Vertical and Horizontal Heterogeneity. Appl. Environ. Microbiol. 71, 5029–5037. doi:10.1128/AEM.71.9.5029–5037.2005
Delandmeter, P., Lambrechts, J., Legat, V., Vallaeys, V., Naithani, J., Thiery, W., et al. (2018). A Fully Consistent and Conservative Vertically Adaptive Coordinate System for SLIM 3D v0.4 with an Application to the Thermocline Oscillations of Lake Tanganyika. Geosci. Model. Dev. 11, 1161–1179. doi:10.5194/gmd-11-1161-2018
Descy, J.-P., Hardy, M.-A., Sténuite, S., Pirlot, S., Leporcq, B., Kimirei, I., et al. (2005). Phytoplankton Pigments and Community Composition in Lake Tanganyika. Freshw. Biol. 50, 668–684. doi:10.1111/j.1365-2427.2005.01358.x
Descy, J.-P., and Sarmento, H. (2008). Microorganisms of the East African Great Lakes and Their Response to Environmental Changes. Freshw. Rev. 1, 59–73. doi:10.1608/FRJ-1.1.4
Descy, J.-P., Tarbe, A.-L., Stenuite, S., Pirlot, S., Stimart, J., Vanderheyden, J., et al. (2010). Drivers of Phytoplankton Diversity in Lake Tanganyika. Hydrobiologia 653, 29–44. doi:10.1007/s10750-010-0343-3
Di Cesare, A., Cabello-Yeves, P. J., Chrismas, N. A. M., Sánchez-Baracaldo, P., Salcher, M. M., and Callieri, C. (2018). Genome Analysis of the Freshwater Planktonic Vulcanococcus Limneticus Sp. Nov. Reveals Horizontal Transfer of Nitrogenase Operon and Alternative Pathways of Nitrogen Utilization. BMC Genomics 19, 1–12. doi:10.1186/s12864-018-4648-3
Dore, J. E., Letelier, R. M., Church, M. J., Lukas, R., and Karl, D. M. (2008). Summer Phytoplankton Blooms in the Oligotrophic North Pacific Subtropical Gyre: Historical Perspective and Recent Observations. Prog. Oceanography 76, 2–38. doi:10.1016/j.pocean.2007.10.002
Downing, J. A., Watson, S. B., and McCauley, E. (2001). Predicting Cyanobacteria Dominance in Lakes. Can. J. Fish. Aquat. Sci. 58, 1905–1908. doi:10.1139/f01-143
Edmond, J. M., Stallard, R. F., Craig, H., Craig, V., Weiss, R. F., and Coulter, G. W. (1993). Nutrient Chemistry of the Water Column of Lake Tanganyika. Limnol. Oceanogr. 38, 725–738. doi:10.4319/lo.1993.38.4.0725
Ehrenfels, B., Mbonde, A. S., Dinkel, C., Brand, A., Baumann, K. B. L., Junker, J., et al. (2020). Physical, Biogeochemical, and Biological Data for Lake Tanganyika (2017–2018). ETH Res. Collect. Dataset. doi:10.3929/ethz-b-000418479
Follett, C. L., Dutkiewicz, S., Karl, D. M., Inomura, K., and Follows, M. J. (2018). Seasonal Resource Conditions Favor a Summertime Increase in North Pacific Diatom-Diazotroph Associations. ISME J. 12, 1543–1557. doi:10.1038/s41396-017-0012-x
Foster, R. A., Kuypers, M. M. M., Vagner, T., Paerl, R. W., Musat, N., and Zehr, J. P. (2011). Nitrogen Fixation and Transfer in Open Ocean Diatom-Cyanobacterial Symbioses. ISME J. 5, 1484–1493. doi:10.1038/ismej.2011.26
Foster, R. A., and O'Mullan, G. D. (2008). “Nitrogen-fixing and Nitrifying Symbioses in the marine Environment,” in In Nitrogen In the marine Environment. Editors D. G. Capone, D. Bronk, M. Mulholland, and E. J. Carpenter (New York: Elsevier Science), 1197–1218. doi:10.1016/b978-0-12-372522-6.00027-x
Foster, R. A., and Zehr, J. P. (2019). Diversity, Genomics, and Distribution of Phytoplankton-Cyanobacterium Single-Cell Symbiotic Associations. Annu. Rev. Microbiol. 73, 435–456. doi:10.1146/annurev-micro-090817-062650
Glibert, P. M., Heil, C. A., Wilkerson, F. P., and Dugdale, R. C. (2018). “Nutrients and Harmful Algal Blooms: Dynamic Kinetics and Flexible Nutrition,” in Global Ecology and Oceanography of Harmful Algal Blooms. Editors P. M. Glibert, and E. Al. (Cham: Springer International Publishing AG), 93–112. doi:10.1007/978-3-319-70069-4_6
Gondwe, M. J., Guildford, S. J., and Hecky, R. E. (2008). Planktonic Nitrogen Fixation in Lake Malawi/Nyasa. Hydrobiologia 596, 251–267. doi:10.1007/s10750-007-9101-6
Gordon, N., Angel, D., Neorl, A., Kress, N., and Kimor, B. (1994). Heterotrophic Dinoflagellates with Symbiotic Cyanobacteria and Nitrogen Limitation in the Gulf of Aqaba. Mar. Ecol. Prog. Ser. 107, 83–88. doi:10.3354/meps107083 Available at: https://www.jstor.org/stable/24844780.
Grasshoff, K., Kremling, K., and Ehrhardt, M. (1999). Methods of Seawater Analysis. New York: Wiley.
Guildford, S. J., and Hecky, R. E. (2000). Total Nitrogen, Total Phosphorus, and Nutrient Limitation in Lakes and Oceans: Is There a Common Relationship? Limnol. Oceanogr. 45, 1213–1223. doi:10.4319/lo.2000.45.6.1213
Healey, F. P., and Hendzel, L. L. (1979). Indicators of Phosphorus and Nitrogen Deficiency in Five Algae in Culture. J. Fish. Res. Bd. Can. 36, 1364–1369. doi:10.1139/f79-195
Hecky, R. E., Fee, E. J., Kling, H., and Rudd, J. W. M. (1978). Studies on the Planktonic Ecology of Lake Tanganyika. Manitoba: Winnipeg.
Hecky, R. E., and Kling, H. J. (1981). The Phytoplankton and Protozooplankton of the Euphotic Zone of Lake Tanganyika: Species Composition, Biomass, Chlorophyll Content, and Spatio-Temporal Distribution1. Limnol. Oceanogr. 26, 548–564. doi:10.4319/lo.1981.26.3.0548
Hecky, R. E., Spigel, R. H., and Coulter, G. W. (1991). “The Nutrient Regime,” in In Lake Tanganyika And its Life. Editor G. W. Coulter (Oxford, England: Oxford University Press), 76–89.
Holmes, R. M., Aminot, A., Kérouel, R., Hooker, B. A., and Peterson, B. J. (1999). A Simple and Precise Method for Measuring Ammonium in marine and Freshwater Ecosystems. Can. J. Fish. Aquat. Sci. 56, 1801–1808. doi:10.1139/f99-128
Horion, S., Bergamino, N., Stenuite, S., Descy, J.-P., Plisnier, P.-D., Loiselle, S. A., et al. (2010). Optimized Extraction of Daily Bio-Optical Time Series Derived from MODIS/Aqua Imagery for Lake Tanganyika, Africa. Remote Sensing Environ. 114, 781–791. doi:10.1016/j.rse.2009.11.012
Idso, S. B. (1973). On the Concept of lake Stability1. Limnol. Oceanogr. 18, 681–683. doi:10.4319/lo.1973.18.4.0681
Kelly, L. T., Champeaud, M., Beuzenberg, V., Goodwin, E., Verburg, P., and Wood, S. A. (2021). Trace Metal and Nitrogen Concentrations Differentially Affect Bloom Forming Cyanobacteria of the Genus Dolichospermum. Aquat. Sci. 83, 1–11. doi:10.1007/s00027-021-00786-8
Komárek, J., and Anagnostidis, K. (1999). Süßwasserflora von Mitteleuropa: Cyanoprokaryota (Chloroococales). Editors E. Ettl, G. Gärtner, H. Heynig, and D. Mollernhauer (Jena, Germany: Gustav Fischer Verlag).
Komárek, J., and Anagnostidis, K. (2007). Süßwasserflora von Mitteleuropa: Cyanoprokaryota (Oscillatoriales). Editors B. Büdel, G. Gärtner, L. Krienitz, and M. Hagemann (Schagerl München, Germany: Spektrum Akademischer Verlag).
Lahmi, R., Sendersky, E., Perelman, A., Hagemann, M., Forchhammer, K., and Schwarz, R. (2006). Alanine Dehydrogenase Activity Is Required for Adequate Progression of Phycobilisome Degradation during Nitrogen Starvation in Synechococcus Elongatus PCC 7942. J. Bacteriol. 188, 5258–5265. doi:10.1128/JB.00209-06
Langenberg, V. T., Mwape, L. M., Tshibangu, K., Tumba, J.-M., Koelmans, A. A., Roijackers, R., et al. (2002). Comparison of thermal Stratification, Light Attenuation, and Chlorophyll- a Dynamics between the Ends of Lake Tanganyika. Aquat. Ecosystem Health Manage. 5, 255–265. doi:10.1080/146349802900319510.1080/14634980290031956
Langenberg, V. T., Nyamushahu, S., Roijackers, R., and Koelmans, A. A. (2003). External Nutrient Sources for Lake Tanganyika. J. Great Lakes Res. 29, 169–180. doi:10.1016/S0380-1330(03)70546-2
Lewis, W. M. (1987). Tropical Limnology. Annu. Rev. Ecol. Syst. 18, 159–184. doi:10.1146/annurev.es.18.110187.001111
Li, D., Liu, C.-M., Luo, R., Sadakane, K., and Lam, T.-W. (2015). MEGAHIT: An Ultra-Fast Single-Node Solution for Large and Complex Metagenomics Assembly via Succinct de Bruijn Graph. Bioinformatics 31, 1674–1676. doi:10.1093/bioinformatics/btv033
Lukas, R., and Lindstrom, E. (1991). The Mixed Layer of the Western Equatorial Pacific Ocean. J. Geophys. Res. 96, 3343–3357. doi:10.1029/90JC01951
Maldonado, M., and Price, N. (1996). Influence of N Substrate on Fe Requirements of marine Centric Diatoms. Mar. Ecol. Prog. Ser. 141, 161–172. doi:10.3354/meps141161
Mayr, M. J., Zimmermann, M., Dey, J., Brand, A., Wehrli, B., and Bürgmann, H. (2020). Growth and Rapid Succession of Methanotrophs Effectively Limit Methane Release during lake Overturn. Commun. Biol. 3, 1–9. doi:10.1038/s42003-020-0838-z
Molot, L. A., Watson, S. B., Creed, I. F., Trick, C. G., Mccabe, S. K., Verschoor, M. J., et al. (2014). A Novel Model for Cyanobacteria Bloom Formation: The Critical Role of Anoxia and Ferrous Iron. Freshw. Biol. 59, 1323–1340. doi:10.1111/fwb.12334
Muggéo, V. (2008). Scenegraph-Based Platform for 3D Computer Graphics Training. R. News 4, 20–30. doi:10.4018/jicte.2008070103
Mziray, P., Kimirei, I. A., Staehr, P. A., Lugomela, C. V., Perry, W. L., Trolle, D., et al. (2018). Seasonal Patterns of thermal Stratification and Primary Production in the Northern Parts of Lake Tanganyika. J. Great Lakes Res. 44, 1209–1220. doi:10.1016/j.jglr.2018.08.015
Naithani, J., and Deleersnijder, E. (2004). Are There Internal Kelvin Waves in Lake Tanganyika? Geophys. Res. Lett. 31, a–n. doi:10.1029/2003GL019156
Naithani, J., Deleersnijder, E., and Plisnier, P.-D. (2003). Analysis of Wind-Induced Thermocline Oscillations of Lake Tanganyika. Environ. Fluid Mech. 3, 23–39. doi:10.1023/A:1021116727232
Narita, T., Mulimbwa, N., and Mizuno, T. (1986). Vertical Distribution and Seasonal Abundance of Zooplankters in Lake Tanganyika. Afr. Study Monogr. 6, 1–16. doi:10.14989/68016
Nieves‐Morión, M., Flores, E., and Foster, R. A. (2020). Predicting Substrate Exchange in marine Diatom‐heterocystous Cyanobacteria Symbioses. Environ. Microbiol. 22, 2027–2052. doi:10.1111/1462-2920.15013
North, R. L., Guildford, S. J., Smith, R. E. H., Twiss, M. R., and Kling, H. J. (2008). Nitrogen, Phosphorus, and Iron Colimitation of Phytoplankton Communities in the Nearshore and Offshore Regions of the African Great Lakes. SIL Proc. 1922-2010 30, 259–264. doi:10.1080/03680770.2008.11902122
Parks, D. H., Imelfort, M., Skennerton, C. T., Hugenholtz, P., and Tyson, G. W. (2015). CheckM: Assessing the Quality of Microbial Genomes Recovered from Isolates, Single Cells, and Metagenomes. Genome Res. 25, 1043–1055. doi:10.1101/gr.186072.114
Plisnier, P.-D., Chitamwebwa, D., Mwape, L., Tshibangu, K., Langenberg, V., and Coenen, E. (1999). Limnological Annual Cycle Inferred from Physical-Chemical Fluctuations at Three Stations of Lake Tanganyika. Hydrobiologia 407, 45–58. doi:10.1023/A:100376211987310.1007/978-94-017-1622-2_4
Pomati, F., Shurin, J. B., Andersen, K. H., Tellenbach, C., and Barton, A. D. (2020). Interacting Temperature, Nutrients and Zooplankton Grazing Control Phytoplankton Size-Abundance Relationships in Eight Swiss Lakes. Front. Microbiol. 10, 3155. doi:10.3389/fmicb.2019.03155
Posch, T., Köster, O., Salcher, M. M., and Pernthaler, J. (2012). Harmful Filamentous Cyanobacteria Favoured by Reduced Water Turnover with lake Warming. Nat. Clim Change 2, 809–813. doi:10.1038/nclimate1581
Post, A., Dedej, Z., Gottlieb, R., Li, H., Thomas, D., El-Absawi, M., et al. (2002). Spatial and Temporal Distribution of Trichodesmium Spp. In the Stratified Gulf of Aqaba, Red Sea. Mar. Ecol. Prog. Ser. 239, 241–250. doi:10.3354/meps239241
Przytulska, A., Bartosiewicz, M., and Vincent, W. F. (2017). Increased Risk of Cyanobacterial Blooms in Northern High-Latitude Lakes through Climate Warming and Phosphorus Enrichment. Freshw. Biol. 62, 1986–1996. doi:10.1111/fwb.13043
Salonen, K., Sarvala, J., Järvinen, M., Langenberg, V., Nuottajärvi, M., Vuorio, K., et al. (1999). Phytoplankton in Lake Tanganyika - Vertical and Horizontal Distribution of In Vivo Fluorescence. Hydrobiologia 407, 89–103. doi:10.1023/a:1003764825808
Schmidt, W. (1928). Über die Temperatur- und Stabilitätsverhältnisse von Seen. Geografiska Annaler 10, 145–177. doi:10.2307/519789
Schmieder, R., and Edwards, R. (2011). Quality Control and Preprocessing of Metagenomic Datasets. Bioinformatics 27, 863–864. doi:10.1093/bioinformatics/btr026
Schnetger, B., and Lehners, C. (2014). Determination of Nitrate Plus Nitrite in Small Volume marine Water Samples Using vanadium(III)chloride as a Reduction Agent. Mar. Chem. 160, 91–98. doi:10.1016/j.marchem.2014.01.010
Seemann, T. (2014). Prokka: Rapid Prokaryotic Genome Annotation. Bioinformatics 30, 2068–2069. doi:10.1093/bioinformatics/btu153
Stal, L. J. (2009). Is the Distribution of Nitrogen-Fixing Cyanobacteria in the Oceans Related to Temperature? Environ. Microbiol. 11, 1632–1645. doi:10.1111/j.1758-2229.2009.00016.x
Stelzer, K., Simis, S., and Müller, D. (2018). Copernicus Glob. L. Oper. “Cryosph. Water.”. Available at: https://land.copernicus.eu/global/products/lwq (Accessed June 30, 2020). Product User Manual Lake Water Quality 300 M and 1 Km Products, v1.3.1.
Stenuite, S., Pirlot, S., Hardy, M.-A., Sarmento, H., Tarbe, A.-L., Leporcq, B., et al. (2007). Phytoplankton Production and Growth Rate in Lake Tanganyika: Evidence of a Decline in Primary Productivity in Recent Decades. Freshw. Biol. 52, 2226–2239. doi:10.1111/j.1365-2427.2007.01829.x
Stenuite, S., Tarbe, A.-L., Sarmento, H., Unrein, F., Pirlot, S., Sinyinza, D., et al. (2009). Photosynthetic Picoplankton in Lake Tanganyika: Biomass Distribution Patterns with Depth, Season and basin. J. Plankton Res. 31, 1531–1544. doi:10.1093/plankt/fbp090
Streble, H., and Krauter, D. (1988). Das Leben im Wassertropfen. Mikroflora und Mikrofauna des Süßwassers. Stuttgart, Germany: Francklische Verlagshandlung, W. Keller und Co.
Uritskiy, G. V., Diruggiero, J., and Taylor, J. (2018). MetaWRAP-a Flexible Pipeline for Genome-Resolved Metagenomic Data Analysis. Microbiome 6, 1–13. doi:10.1186/s40168-018-0541-1
Vahtera, E., Conley, D. J., Gustafsson, B. G., Kuosa, H., Pitkänen, H., Savchuk, O. P., et al. (2007). Internal Ecosystem Feedbacks Enhance Nitrogen-Fixing Cyanobacteria Blooms and Complicate Management in the Baltic Sea. AMBIO: A J. Hum. Environ., 36, 186–194. doi:10.1579/0044-7447(2007)3610.1579/0044-7447(2007)36 [186:IEFENC]2.0.CO;2.
Van Meel, L. V. (1954). “Le phytoplancton,” in Résultats scientifiques de l’exploration hydrobiologique du lac Tanganika (1946–1947) (Bruxelles. Inst. Roy. Sc. Nat. Belg.
Verburg, P., Antenucci, J. P., and Hecky, R. E. (2011). Differential Cooling Drives Large-Scale Convective Circulation in Lake Tanganyika. Limnol. Oceanogr. 56, 910–926. doi:10.4319/lo.2011.56.3.0910
Vuorio, K., Nuottajärvi, M., Salonen, K., and Sarvala, J. (2003). Spatial Distribution of Phytoplankton and Picocyanobacteria in Lake Tanganyika in March and April 1998. Aquat. Ecosystem Health Manage. 6, 263–278. doi:10.1080/14634980301494
Ward, B. A., Dutkiewicz, S., Moore, C. M., and Follows, M. J. (2013). Iron, Phosphorus, and Nitrogen Supply Ratios Define the Biogeography of Nitrogen Fixation. Limnol. Oceanogr. 58, 2059–2075. doi:10.4319/lo.2013.58.6.2059
Wasmund, N., Topp, I., and Schories, D. (2006). Optimising the Storage and Extraction of Chlorophyll Samples. Oceanologia 48, 125–144.
White, A. E., Spitz, Y. H., and Letelier, R. M. (2007). What Factors Are Driving Summer Phytoplankton Blooms in the North Pacific Subtropical Gyre? J. Geophys. Res. 112, 1–11. doi:10.1029/2007JC004129
Winslow, L., Read, J., Woolway, R., Brentrup, J., Leach, T., Zwart, J., et al. (2019). Package ‘rLakeAnalyzer. CRAN (The Comprehensive R Archive Network).
Keywords: cyanobacterial blooms, stratification, oligotrophic, dolichospermum, diazotrophs, phycocyanin, phycoerythrin
Citation: Ehrenfels B, Bartosiewicz M, Mbonde AS, Baumann KB, Dinkel C, Junker J, Kamulali TM, Kimirei IA, Niederdorfer R, Odermatt D, Pomati F, Sweke EA and Wehrli B (2021) Diazotrophic Cyanobacteria are Associated With a Low Nitrate Resupply to Surface Waters in Lake Tanganyika. Front. Environ. Sci. 9:716765. doi: 10.3389/fenvs.2021.716765
Received: 29 May 2021; Accepted: 06 July 2021;
Published: 23 July 2021.
Edited by:
Teresa Ferreira, University of Lisbon, PortugalReviewed by:
Salomé Almeida, University of Aveiro, PortugalTiina Nõges, Estonian University of Life Sciences, Estonia
Copyright © 2021 Ehrenfels, Bartosiewicz, Mbonde, Baumann, Dinkel, Junker, Kamulali, Kimirei, Niederdorfer, Odermatt, Pomati, Sweke and Wehrli. This is an open-access article distributed under the terms of the Creative Commons Attribution License (CC BY). The use, distribution or reproduction in other forums is permitted, provided the original author(s) and the copyright owner(s) are credited and that the original publication in this journal is cited, in accordance with accepted academic practice. No use, distribution or reproduction is permitted which does not comply with these terms.
*Correspondence: Benedikt Ehrenfels, YmVuZWRpa3QuZWhyZW5mZWxzQGVhd2FnLmNo