 Tuukka Petäjä1*
 Aino Ovaska1Pak Lun Fung1Pyry Poutanen1
 Jaakko Yli-Ojanperä2Jari Suikkola2Mikko Laakso2Taneli Mäkelä3Jarkko V. Niemi3Jorma Keskinen4Anssi Järvinen4
 Joel Kuula5Mona Kurppa5
 Tareq Hussein1Sasu Tarkoma6
 Markku Kulmala1Ari Karppinen5Hanna E. Manninen3
 Hilkka Timonen4
- 1Faculty of Science, Institute for Atmospheric and Earth System Research (INAR)/Physics, University of Helsinki, Helsinki, Finland
- 2Vaisala Oyj, Helsinki, Finland
- 3Helsinki Region Environmental Services Authority HSY, Helsinki, Finland
- 4Aerosol Physics Laboratory, Physics Unit, Faculty of Engineering and Natural Sciences, Tampere University, Tampere, Finland
- 5Atmospheric Composition Research, Finnish Meteorological Institute, Helsinki, Finland
- 6Department of Computer Science, University of Helsinki, Helsinki, Finland
Poor air quality influences the quality of life in the urban environment. The regulatory observation stations provide the backbone for the city administration to monitor urban air quality. Recently a suite of cost-effective air quality sensors has emerged to provide novel insights into the spatio-temporal variability of aerosol particles and trace gases. Particularly in low concentrations these sensors might suffer from issues related e.g., to high detection limits, concentration drifts and interdependency between the observed trace gases and environmental parameters. In this study we characterize the optical particle detector used in AQT530 (Vaisala Ltd.) air quality sensor in the laboratory. We perform a measurement campaign with a network of AQT530 sensors in Helsinki, Finland in 2020–2021 and present a long-term performance evaluation of five sensors for particulate (PM10, PM2.5) and gaseous (NO2, NO, CO, O3) components during a half-year co-location study with reference instruments at an urban traffic site. Furthermore, short-term (3–5 weeks) co-location tests were performed for 25 sensors to provide sensor-specific correction equations for the fine-tuning of selected pollutants in the sensor network. We showcase the added value of the verified network of 25 sensor units to address the spatial variability of trace gases and aerosol mass concentrations in an urban environment. The analysis assesses road and harbor traffic monitoring, local construction dust monitoring, aerosol concentrations from fireworks, impact of sub-urban small scale wood combustion and detection of long-range transport episodes on a city scale. Our analysis illustrates that the calibrated network of Vaisala AQT530 air quality sensors provide new insights into the spatio-temporal variability of air pollution within the city. This information is beneficial to, for example, optimization of road dust and construction dust emission control as well as provides data to tackle air quality problems arising from traffic exhaust and localized wood combustion emissions in the residential areas.
Introduction
Air quality is one of the grand challenges that the society faces at the moment (Gimeno, 2013; Lappalainen et al., 2014; Arnold et al., 2016; Kulmala et al., 2016). The problem arises from a suite of anthropogenic activities including e.g., traffic, biomass combustion and industrial emissions of gases and particulate matter and associated land use changes (e.g., Foley et al., 2005; Baklanov et al., 2016). Furthermore, the air quality can deteriorate via atmospheric chemical reactions producing harmful pollutants, such as ozone (Zhang et al., 2004) and secondary particulate matter (Chu et al., 2019). Meteorology governs the dispersion of pollutants, both vertically and horizontally (e.g., He et al., 2017; Teinilä et al., 2019; Kurppa et al., 2020) and various feedback mechanisms can deteriorate the local air quality within cities even further (e.g., Ding et al., 2016; Petäjä et al., 2016). Regulations have already improved the air quality regionally and globally (Crippa et al., 2016), but more targeted restrictions and support from observations are needed to further tackle the air quality problem in the future (Zheng et al., 2018).
The urban air quality is monitored with a network of in-situ analyzers for key gas phase pollutants (such as O3, NOx, CO, and SO2) and particulate mass below 2.5 μm or 10 μm (PM2.5 and PM10, respectively). The regulatory observations typically represent different urban environments (e.g., traffic sites, urban background, and rural) and the air pollution at these sites are reported and taken as representatives for similar urban environments (e.g., Duyzer et al., 2015; Rohde and Mü;ller, 2015). Recently, this view has evolved to include dense supplementary air quality observations with a suite of air quality sensors (e.g., Popoola et al., 2018; Kuula et al., 2020a), combining this sensor network with more comprehensive benchmarking supersites and integrating the observed air quality situation and prediction with spatially and temporally high-resolution models (e.g., Johanssen et al., 2015). Although no official definition exists, air quality sensors are usually perceived as relatively low-cost, small, and easy to use (e.g, WMO, 2018). Wireless data transfer is a characteristic feature of sensors, and low power consumption coupled with a possibility for battery operation enables them to be placed more freely within the urban infrastructure. These features are the foundation of cost-efficient and convenient air quality monitoring, which facilitates the high-density deployment and the consequent higher spatiotemporal air quality data.
For sensor type devices, the most common measurement techniques applied for gas phase pollutants include electrochemical and metal oxide detectors (Mead et al., 2013; Spinelle et al., 2015). These detectors have been utilized successfully in dense air quality monitoring networks, although cross-sensitivity between different gases (e.g., O3 and NO2), influence of relative humidity, temperature dependency and long-term drift may often hinder their overall performance (Jiao et al., 2016; Cross et al., 2017). For particle phased pollutants, the dominant detection technique is based on the detection of light scattered from illuminated particles (Karagulian et al., 2019; Alfano et al., 2020). This technique is applicable mainly for the particle mass concentration monitoring as its sensitivity for the detection of ultrafine particles is limited (Hinds, 1999). Particle sensors also include measurement devices for the particle lung deposited surface area (LDSA) and black carbon (BC) measurements, which utilize diffusion charging and an aethalometer-based detection technique, respectively, (Caubel et al., 2018; Rostedt and Keskinen, 2018; Kuula et al., 2020a; Kuula et al., 2020b). Although LDSA and BC are not regulated pollutants, they have been shown to be valuable parameters in air quality assessments (Caubel et al., 2019; Hama et al., 2017; Kuula et al., 2020a; Luoma et al., 2021). Previous studies investigating the characteristics of light scattering sensors have identified factors, which affect the sensors’ response characteristics, namely relative humidity and particle size-selectivity (e.g., Di Antonio et al., 2018; Jayaratne et al., 2018; Kuula et al., 2020b; Kosmopoulos et al., 2020). In comparison to light scattering-based sensors, LDSA and BC sensors have been shown to be technically more mature, but they are often also considerably more expensive (Kuuluvainen et al., 2016; Holder et al., 2018).
The usefulness of low-cost sensors for air quality monitoring has been underlined by multiple different studies; however, it is often reminded that the risk of data misinterpretation due to inadequate device specifications provided by the manufacturers is still a valid concern, and that caution should be applied when using advanced modelling techniques for the calibration of sensors (e.g., Liu et al., 2019). Correction factors for known artefacts, such as relative humidity, can be justifiable, but it is also important to ensure that the data generated from advanced calibration processes are still true and independent measurements of the sensor system and not a combination of secondary data and statistical prediction (Hagler et al., 2018; Schneider et al., 2019). Furthermore, the lack of standardization and inconsistent evaluation protocols used in the research community hinder the wide-scale adoption of sensors to routine air quality monitoring, where higher data quality and traceability are required (e.g., Williams et al., 2019).
In the Helsinki metropolitan area, the observations from two supersites—one representing urban background and the other an urban street canyon—and a regulatory network of air quality stations are extended with supplementary observations with AQT530 (Air Quality Transmitter 530, Vaisala Ltd.) sensors. The aim of this work is to 1) characterize the Vaisala AQT530 air quality sensors’ laser particle counters in the laboratory for their detection efficiency as a function of particle size and number concentration using monodisperse particles, 2) conduct a co-location study with a suite of sensors to explore the long-term performance of the sensors against verified instrumentation of gaseous and particulate pollutants at an air quality monitoring station, and 3) deploy the sensor network consisting of 25 sensor units in different regions in the Helsinki metropolitan area to explore the benefits of such a network of sensors for specific air quality challenges, such as long-range transport, local hot-spot of trace gas or aerosol emissions and road dust episodes.
Experimental
Vaisala AQT530 Sensor
The Vaisala Air Quality Transmitter AQT530 (Figure 1) combines electrochemical sensors for trace gas measurements and optical single particle counting for aerosol mass determination. The former provides ppb level observation capacity of common gas phase pollutants, such as nitrogen dioxide (NO2), nitric oxide (NO), carbon monoxide (CO) and ozone (O3) and the latter provide a measure of aerosol mass concentration. The instrument also has a built-in temperature and humidity sensor for compensation purposes. The Vaisala AQT530 sensor package enables compact and cost-effective observations of air quality parameters in a dense observation network.
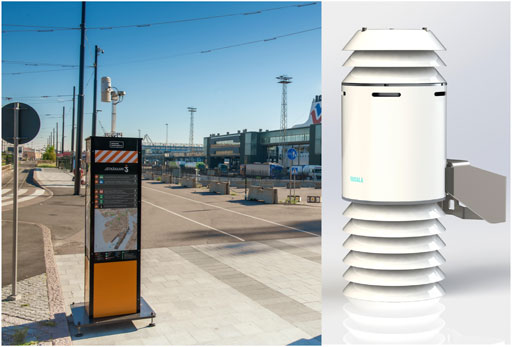
FIGURE 1. Vaisala AQT530 sensor installation on the top an infopylon in Jätkäsaari and a close view of the sensor.
The air pollution data from the AQT530 sensors was recorded as 1-min data. In the ambient applications, we typically calculated 1-h averaged concentrations. We only included hours that had at least 75% data coverage. For specific cases, we calculated 15-min averages to better capture rapidly changing concentrations, such as during the New Year celebration case study.
Aerosol mass concentrations are determined as follows. First, aerosol count size distribution is detected with a laser particle counter. The raw measurement results are then converted to aerosol mass in PM2.5 and PM10 mass categories using sensor flow rate and sensor’s internal algorithms. According to manufacturer’s specifications the lower detection limit of the laser particle counter is 600 nm, and the upper limit of measurement range is 10 µm. The mass concentration range is from 0 to 1,000 μg m−3 for PM2.5 and from 0 to 2,500 μg m−3 for PM10, with measurement resolution of 0.1 μg m−3.
Laboratory Calibration Setup
The performance of the Vaisala AQT530 laser particle counter was determined in the laboratory. The sensor operation relies on single particle counting with optical detection of the particles. This principal operation was tested by comparing sensor particle count rates with known flow rate to reference particle number concentrations in laboratory conditions with monodisperse particles using methods traceable to the Système International (SI), the International System of Units.
The calibration setup is presented in Figure 2. The particles were generated using the Single Charged Aerosol Reference (SCAR, Yli-Ojanperä et al., 2010), modified to extend the size range up to 5 µm (Järvinen et al., 2018). The system produces dioctyl sebacate (DOS) particles with a single elementary charge enabling both accurate measurement of particle concentration through electrical detection of particles and accurate determination of particle size through electrical classification. Particle size information in the calibration was determined by electrical classification with Differential Mobility Analyzers (DMA). A commercial DMA (Model 3,071, TSI Inc.) was used up to 1 µm and larger particle sizes were covered with the Tampere Long DMA (Järvinen et al., 2018). Both DMAs were calibrated with SI-traceable standard particles (Product number 95585, Sigma-Aldrich). After the DMA, the aerosol passed through a static mixer and subsequently it was directed into equal length rigid stainless-steel lines leading to the instruments.
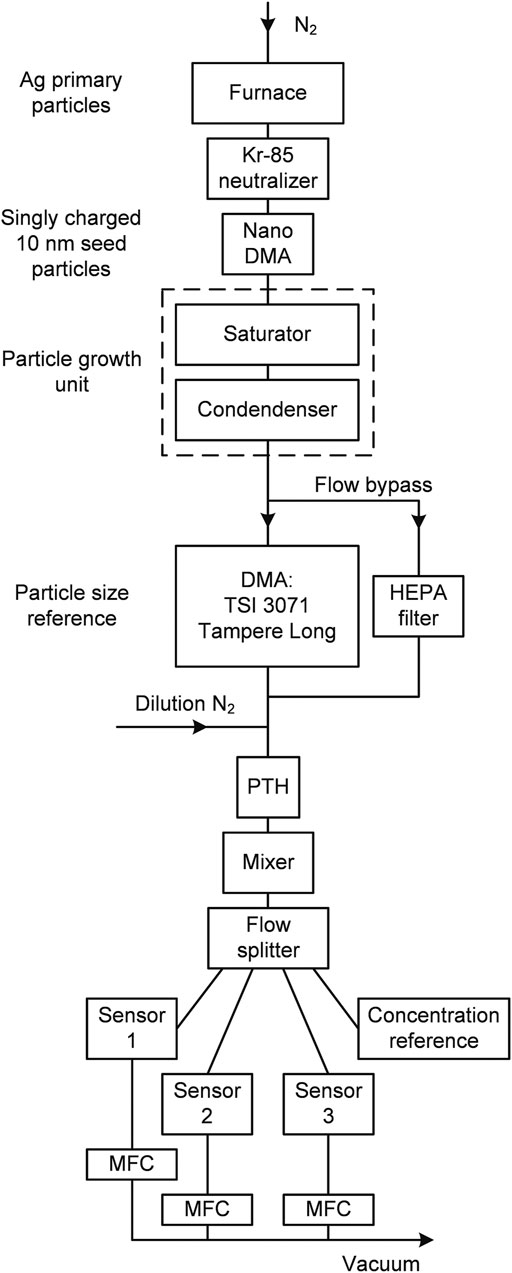
FIGURE 2. The calibration setup for the Vaisala AQT530 sensors. Silver nanoparticles are produced by evaporation–condensation technique, which are charged with a radioactive source. The primary particles are small enough so that they accommodate only one elementary charge. A well-defined electrical mobility equivalent size is selected from the generated silver particle population with a differential mobility analyer (nano-DMA). These particles are then grown by condensing dioctyl sebacate (DOS) onto the seed particles under controlled conditions. This leads to a population of singly charged micrometer sized aerosol particles. The AQT sensors (Sensors 1,2,3) are compared against a reference instrument, which is either a Condensation Particle Counter (CPC) or Faraday Cup Aerosol Electrometer (FCAE), depending on the particle size and number concentration. In the figure, MFC refers to a mass flow controller and PTH to a pressure, temperature and humidity instrument.
A Condensation Particle Counter (CPC, Model 3,750, TSI Inc.) was used as a concentration reference in the size range between 0.3 and 2 µm and a Faraday Cup Aerosol Electrometer (FCAE) at 4.8 µm particle size. The CPC was calibrated at 0.5 and 1.9 µm particle sizes with the FCAE before the calibration measurements. All the main components of the FCAE, i.e., measurement of the electric current, flow, pressure and temperature were calibrated with traceability to SI primary units. In addition, the FCAE has participated to the international inter-comparison (Högström et al., 2014).
Co-Location Study of the Sensors
The AQT530 sensors were first co-located at the Mäkelänkatu air quality supersite, which is operated by the Helsinki Region Environmental Services Authority (HSY), as a reference station for in-field calibration. The sensors we distributed as an air quality monitoring network within three selected areas (Pakila, Vallila, and Jätkäsaari) within the Helsinki Metropolitan Area (HMA). The total number of sensors distributed in these areas was 25 sensors: eight sensors in Pakila, six sensors in Vallila, and eleven sensors in Jätkäsaari.
Co-Location at the Mäkelänkatu Supersite
The Mäkelänkatu air quality supersite is located at the curbside of a street canyon with a high traffic rates of approximately 28,100 vehicles per weekday in 2019 (Kuuluvainen et al., 2018). Traffic volumes were clearly lower in 2020 due to Covid-19 restrictions, but official traffic estimates were not yet available. Concentrations of particulate matter (PM2.5 and PM10) and gaseous pollutants (NOx, O3, CO) are continuously monitored at the site (e.g., Anttila, 2020; Barreira et al., 2021). The air quality parameters were measured with the following reference instruments: PM2.5 and PM10 with Fidas 200 (Palas), NOx with APNA 370 (Horiba), O3 with APOA 370 (Horiba), and CO with APMA 360 (Horiba). The sensors were installed on a platform on top of the container, which hosted the reference instruments. The sampling height of the sensors were at the same level as the reference instruments, 4 m above ground level.
We installed all the AQT530 sensors first to the Mäkelänkatu supersite for short co-location tests and then distributed the sensors to their specified locations (Figure 3). This ensured that all the sensors were performing adequately for atmospheric observations and their data communication systems were operational. We kept five of the AQT530 sensors for an extended half-year period at the Mäkelänkatu site to explore the stability and long-term capacity of the sensors for ambient applications.
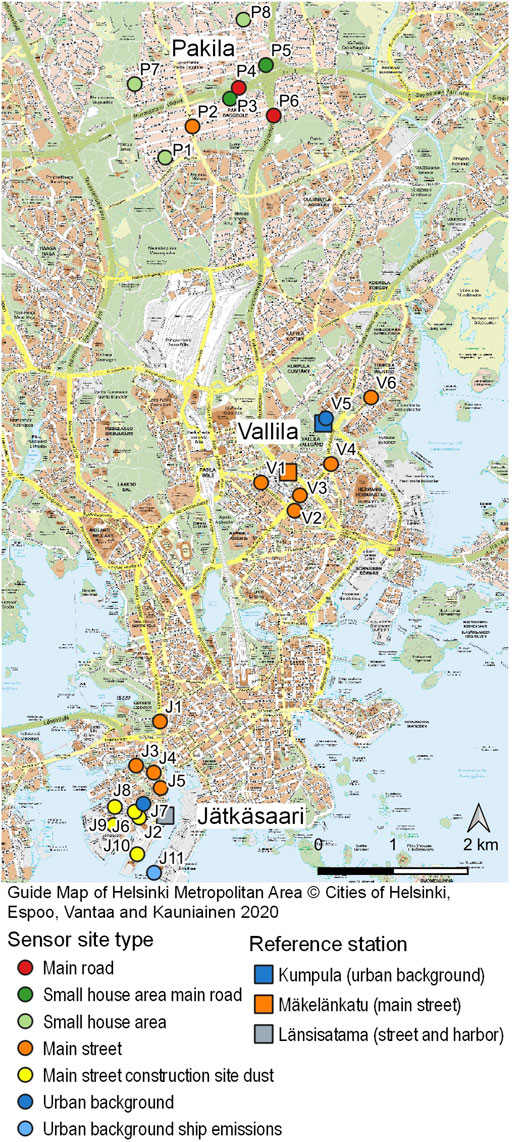
FIGURE 3. A map of Helsinki area with the AQT530 sensor network sites in Jätkäsaari, Pakila and Vallila as well as the location of three reference air quality monitoring stations. The color codes show the sensor environment classification.
Hourly mean reference pollutant concentrations as well as temperature and relative humidity at the Mäkelänkatu supersite between 23 May 2020 and 28 February 2021 is illustrated in Supplementary Figure 1. The diagrams of Supplementary Figure 1 covers the short-term tests and long-term co-location study period as well as the demonstration periods of the sensor network showcases, described in the next sections. The short-term tests were performed in summer (see Sect. 2.4) and the long-term co-location study between August 2020 and January 2021 (see Co-location study results—in–field calibration). During the co-location study period the temperature ranged between −21 and +26°C and the typical air quality characteristics of Nordic urban traffic site in late-summer, autumn and winter were present: high concentration peaks of NO, NO2, and CO from exhaust gases as well as high PM10 concentration peaks in November and December caused by road dust due to studded tyres and occasionally drying street surfaces (Supplementary Figure 1). CO concentration increased towards winter, due to the reduced atmospheric mixing in winter and increased emissions in the region from residential wood combustion. In contrast, O3 concentrations decreased towards winter due to reduced O3 formation in dark conditions and increased O3 depletion by local NO emissions from traffic. Elevated PM2.5 concentrations are mainly caused by three different factors: regionally and long-range transported particles, local road dust and exhaust emissions.
Network of Sensors in the Helsinki Metropolitan Area
After the co-location study, the AQT530 sensors were distributed within the HMA in different regions (Jätkäsaari, Vallila, and Pakila) as indicated in Figure 3. The three districts experience different air quality problems. Jätkäsaari hosts a large harbor (Länsisatama), which suffers from emissions not only from ships but also consequently increased vehicular traffic in the area. In addition, Jätkäsaari is a rapidly growing district with a considerable amount of construction and thus dust emissions (PM10). Vallila is an old city district mainly influenced by emissions from busy main streets and street canyons with high exhaust gas and seasonal street dust concentrations. Pakila consists of detached and semi-detached housing, where residential wood combustion in fireplaces and sauna stoves causes air quality problems particularly in winter during cold inversion periods. Two of the main roads in area, Tuusulanväylä towards the Helsinki city center (Tuusulanväylä) and the first ring road (Kehä I) with very high traffic volumes go through the Pakila district.
A total of 25 sensors deployed in the HMA are listed in Supplementary Table 1 with characteristic features of the environment and placement details. The overall sensor network design reflected Healthy Outdoor Premises for Everyone (HOPE)-project aim to provide novel information on air quality on a higher spatial scale resolution that is available through regulatory air quality observation networks. In particular, we targeted air quality in the developing area of Jätkäsaari and therefore we deployed 11 sensors in this area. They were placed into representative locations, such as close to traffic, in the vicinity of construction sites or in urban background environments. In the region of Vallila we wanted to explore local scale variability and traffic related air pollution. There we placed six Vaisala AQT530 sensors into spatially representative locations. In Pakila we wanted to test the sensor capacity to detect small scale wood combustion aerosols and contrast the traffic sites between the residential area against the results from Vallila. In Pakila we accomplished this with eight sensors. As a summary, the exact position of each sensor was determined by several factors. For example, spatial representativeness, target air pollutant (e.g., PM10, NO2) and availability of electricity and data connectivity. The sensor placements are summarized in Supplementary Table 1.
The air quality monitoring stations operated by HSY provided reference air quality data during the deployment period. In this study we used reference data for comparisons from Mäkelänkatu supersite in a street canyon in Vallila and Länsisatama station, located nearby a street and vehicle route to the harbor in Jätkäsaari. Furthermore, data from SMEAR III research station in Kumpula (Järvi et al., 2006) situated in an urban background area near Vallila district, operated by the University of Helsinki and Finnish Meteorological Institute, were used in this study.
Results and Discussion
Laboratory Calibrations
The laser particle counter in three Vaisala AQT530 sensors were tested in laboratory conditions. The key parameter is the detection efficiency (Deff), which is defined as:
where Cs is the particle concentration measured by the sensor and Cref the particle number concentration measured by the reference instrument. The detection efficiency was determined as a function of particle concentration and particle diameter, because these factors usually affect the detection efficiency. For the optical counters, high particle number concentrations induce detector deadtime and coincidence, which lower the counting accuracy. The detection efficiency generally falls from unity at both ends of the size range. This is due to the fact that the scattering signal from the small particles is low, which reduces the detection efficiency for the small particle sizes. In contrast, large particles are easily lost in the inlet region due to their inertia, reducing the detection efficiency at the larger sizes.
The effect of particle size on the sensor response is presented in Figure 4A. All three sensors showed similar particle detection characteristics. Based on our observations, 50% of detection efficiency is achieved at approximately 0.6 µm particle diameter and the detection efficiency saturates (95–105%) from 0.8 µm up to the last measurement point with size of 4.8 µm. The local maximum in the detection efficiency between 0.4 and 0.5 µm probably is a display of Mie-scattering oscillations. In the detection efficiency measurements, a calibrated CPC was used as a reference instrument between 0.3 and 2 µm particle sizes. The largest 4.8 µm particle size was covered with a FCAE. In this case, sensor two was first calibrated with the FCAE and then the other two sensors were calibrated using the sensor 2 as a reference.
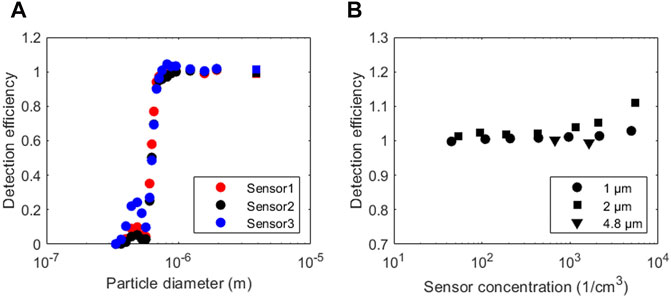
FIGURE 4. Detection efficiency as a function of particle diameter (A) and as a function of particle concentration (B). In figure (A) points marked with circles refer to CPC-based points and points marked with squares refers to a point where Sensor two was calibrated with the FCAE and other sensors were compared to Sensor 2. In figure (B) detection efficiency of Sensor 2 as a function of concentration is presented for three different particle sizes.
Detection efficiency as a function of particle concentration is presented in Figure 4B. These measurements were conducted with singly charged aerosol particles at 1 µm and at 2 µm particle diameters using a CPC as a reference instrument and at 4.8 µm using the FCAE as a reference instrument. The AQT530 sensors seem to have slightly increasing detection efficiency towards the highest concentrations. This effect is not an artefact caused by the reference instrument. However, the response curves are relatively flat up to 1,000 cm−3. Assuming 1,000 kg m−3 bulk density and spherical shape, this corresponds to circa 4,200 μg m−3 mass concentration at 2 µm particle diameter. Such high ambient mass concentrations are unlikely in the PM2.5 range.
Co-Location Study Results–In-Field Calibration
We performed a short co-location experiment with 25 sensors at the Mäkelänkatu supersite and an extended co-location study at the same site for five sensors for six months.
The short co-location tests at the Mäkelänkatu supersite were performed for all 25 sensor units before their installation to the sensor network. The tests were conducted in three sensor batches during the following summer periods: 23 May—15 June (23 days), 18 June—27 July (39 days) and 5 August—7 September (33 days) in 2020. The NO2 and NO concentrations were unusually low (Supplementary Figure 1), especially during the first testing period, since vehicle traffic volume was reduced (about −33% based on the traffic data from the City of Helsinki) by the Covid-19 restrictions. During the second testing period, summer holidays also significantly reduced traffic volumes.
The hourly averaged concentrations of reference instruments and sensors were described by scatter plots, correlation analysis (coefficient of determination r2) as well as the slopes and intercepts of linear fits (not shown here; the more important long-term characterization shown below). Based on the tests, all 25 sensors seem to perform properly. The linear correction equations (slopes and intercepts) of the sensor test were decided to apply for CO and NO2 measurements to fine-tune the accuracy results in the sensor network. However, NO2 correction was not applied to the sensors of the first co-location test batch, since the combination of unusually low NO2 concentrations (maximum hourly mean only 61 μg m−3) and relatively short testing period (23 days) leads to too scattering results, which were not accurate enough to provide correction equations. For the CO correction equations, the slopes and intercepts varied in the range of 0.89–1.09 and 12–79 μg m−3, respectively. For the NO2 correction equations, the slopes and intercepts were in the range of 0.81–1.35 and −4–3 μg m−3, respectively.
For other pollutant components, correction equations were not applied, since low concentrations and three different test periods were not favorable to obtain accurate and uniform correction equations. The variation in pollutant concentration levels and weather conditions during the short co-location periods slightly affect the comparison results. Especially, the changes in size distributions of particles also affect the PM response of optical sensors (e.g., smallest particles are not detected, see Laboratory Calibrations). Therefore, spring would have been the optimal testing period for PM10 measurements in Helsinki, since high PM10 concentrations and dust problems are mainly caused by spring-time road dust in Finnish cities. However, it was not possible to carry out the comparisons in spring and simultaneously for 25 sensors in this study due to practical reasons.
Five AQT530 sensors were co-located at the Mäkelänkatu supersite for six months (from August 11, 2020 to January 31, 2021) for an extended quality control. The correlation between the individual sensors against the corresponding reference measurements for all components (NO, NO2, CO, O3, PM2.5, PM10) is presented in Supplementary Table 2. The general description of reference pollutant concentrations and weather are presented in Supplementary Figure 1 and in Co-location study of the sensors, respectively.
In general, the measurements by the individual AQT530 sensors correlate well with the reference measurements for NO, NO2, CO and PM10. The coefficients of determination (r2) for NO2 and CO reach a good level of 0.8 while that for NO and PM10 even exceed 0.9. The range of their r2 is also narrow which suggests that the individual sensors work similarly. However, the correlations of AQT530 sensors and the reference instruments for O3 and PM2.5 are weaker, and they have stronger inconsistency among the five AQT520 sensors (O3: r2 = 0.35−0.49, PM2.5: r2 = 0.66−0.82). The weaker correlations of PM2.5 results are probably partly explained by the inability of the sensors to detect very small particles (50% detection efficiency about 0.6 µm, Laboratory Calibrations), and therefore the size distribution of PM2.5 particles in the ambient air affects the sensor response. By comparing the normalized root mean squared error (NRMSE) between low-cost sensors and reference instrument data, NO has the highest values (NRMSE = 0.34−0.41) which indicate the absolute errors of some data points are large compared to the mean NO concentration measured by reference instrument. On the other hand, CO has the lowest NRMSE of 0.08−0.10 while the NRMSE of the rest of the parameters fall in the range between 0.15 and 0.27.
Overall, in comparison with the reference instruments, the AQT530 sensors tended to underestimate concentrations at high concentrations for all the parameters measured by the AQT530 sensors, i.e., NO, NO2, O3, CO, PM2.5, PM10, as indicated by the slopes smaller than 1 (Supplementary Figure 2, Supplementary Table 2). This appeared to be the most severe for O3 as the slopes ranged from 0.32 to 0.39. However, at low concentrations, the AQT530 sensors appeared to overestimate NO as seen by the relatively large intercepts compared with the mean reference concentrations. For all pollutant components, there is also internal variation between sensor units that is visible in the differences of slope and intercept values of linear fits (Supplementary Table 2).
The residuals of the AQT530 sensors for all the reported variables were also calculated throughout the co-location study period (Supplementary Figure 3). They are the difference between the measured values and the fitted values and describe how much a fitted line vertically misses a data point. The residuals of CO and O3 appear to drift with time. The values of residuals increase throughout the whole measurement period for the former while a sudden drop of residuals for O3 can be identified in mid-January probably due to the very low ambient temperature. The gradual drifting of CO during the 6-months co-location period might be partly caused by the aging of electrochemical sensor. Furthermore, there seem to be clear temperature dependency in CO results, causing underestimation of CO concentrations in low temperatures (Supplementary Figure 4).
The impact of very high relative humidity (about >95%) was clearly visible in PM10 results (Supplementary Figure 5), as typical in optical sensors without sample line heating or other drying method. The highest PM10 artefact peaks were observed in foggy conditions.
Results From Air Quality Showcases
In this section we explore the air quality in different regions of the Helsinki metropolitan area based on the network of AQT530 sensor network during specific periods that represent local challenges.
Detection of Traffic and Shipping Emissions
Both road traffic and shipping are significant sources of pollutants, especially in urban areas (e.g., Lelieveld et al., 2015; Kuittinen et al., 2020). Traffic exhaust emissions contain a mixture of submicron size particles and gaseous compounds such as NOx, CO2, CO, and hydrocarbons (Aakko-Saksa et al., 2020). Traffic exhaust emission have been shown to have both climate (IPCC, 2014) and health effects (e.g., Gan et al., 2011; Atkinson et al., 2016) and thus it is of utmost importance to accurately characterize the spatial and temporal variation of traffic emissions.
Impact of Local Traffic in Vallila Area
In the urban district of Vallila, all six sensors were installed in street canyons. Consequently, the concentrations measured by the sensors reflect the temporal pattern of the traffic emissions. The traffic temporal pattern was clearly seen in the results of sensors deployed in roadside environment (Figures 5–7). For CO (Figure 5), elevated concentrations were observed in weekdays between 7–21 and in weekends between 10–22. Similar diurnal cycle for CO was observed at close-by air quality station in Mäkelänkatu. The concentrations shown by the sensors were slightly lower when compared to that of CO measured with the reference analyzer, but the diurnal behavior of the sensors was in line with the reference analyzers. The lower CO concentration levels by the sensors were probably caused by their aging and cold temperatures in late autumn and winter (Co-location study results – in-field calibration).
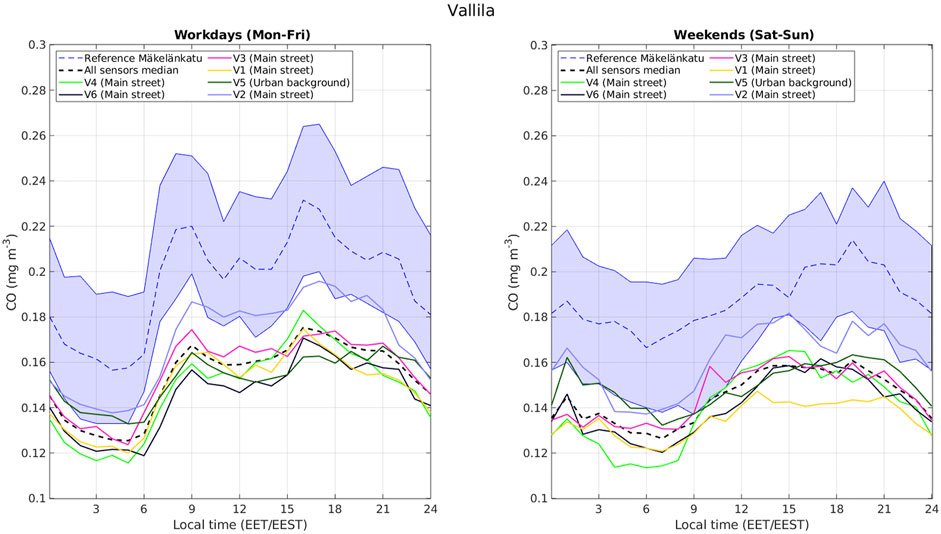
FIGURE 5. Median CO diurnal cycles during 5-month period (1.8.-31.12.2020) for sensors located in Vallila (left) workdays (Mon-Fri) and (right) weekends (Sat-Sun). Reference measurements show median (dashed line) and 25th and 75th percentiles (shaded area) from nearest reference instruments. Black dashed line shows median diurnal cycle calculated for all data from that location.
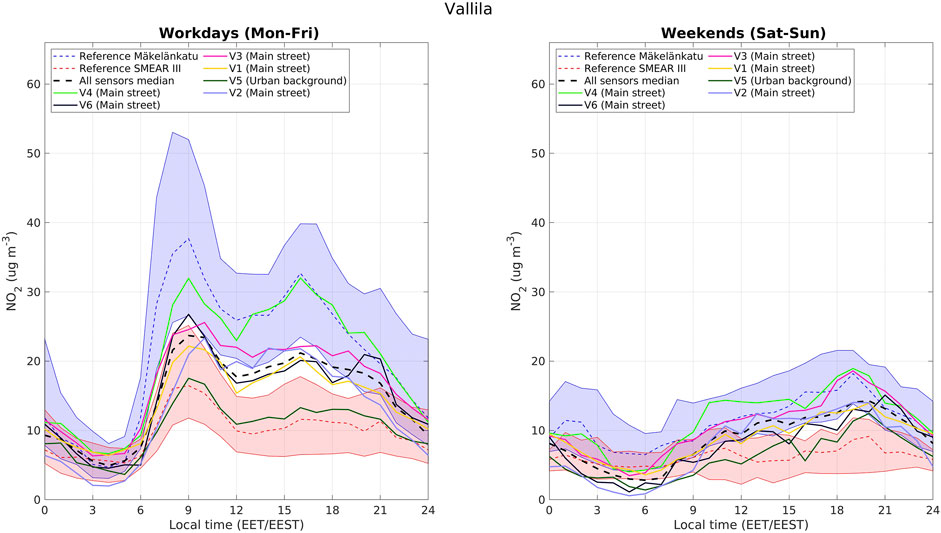
FIGURE 6. Median diurnal cycle of NO2 during 5-month period (1.8.-31.12.2020) for sensors located in Vallila (left) workdays (Mon-Fri) and (right) weekends (Sat-Sun). Reference measurements show median (dashed line) and 25th and 75th percentiles (shaded area) from nearest reference instruments. Black dashed line shows median diurnal cycle calculated for all data from that location.
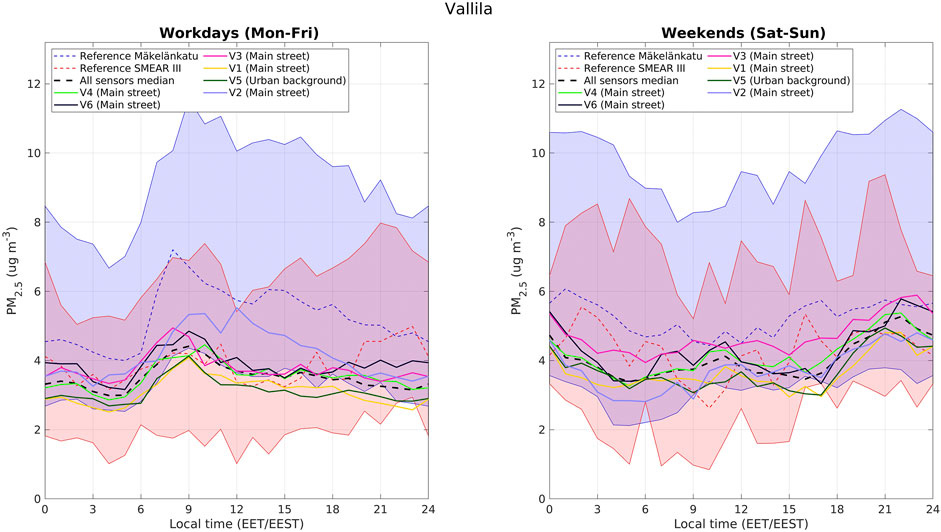
FIGURE 7. Median diurnal cycle of PM2.5 mass concentration during 5-month period (1.8.-31.12.2020) for sensors located in Vallila (left) workdays (Mon-Fri) and (right) weekends (Sat-Sun). Reference measurements show median (dashed line) and 25th and 75th percentiles (shaded area) from nearest reference instruments. Black dashed line shows median diurnal cycle calculated for all data from that location.
For NO2 (Figure 6), the maximum concentrations were measured during the traffic rush-hour, between 7–10 and 15–18 local time concurrent with the traffic intensity. The observed concentrations by the individual sensors varied between the median concentrations observed at the Kumpula urban background station (SMEAR III station) and the median concentrations observed at the roadside AQ station (Mäkelänkatu station) by reference level instruments. In the weekend the variation in the concentrations was smaller with some increase in the concentrations as the anthropogenic activity increased during 9–20 local time.
For PM2.5 (Figure 7), mass concentration an increase in concentrations was seen during the workdays during morning rush-hour (7–10) and during weekends at the evening time (18–24). The observed PM2.5 concentrations by individual sensors were fairly similar and on the same level as the results obtained by reference instruments at the roadside AQ station.
Impact of Harbor Activities in Jätkäsaari
At the Jätkäsaari area, the road traffic and shipping emissions were measured with 11 sensors. Two of the sensors were located at locations defined as urban background, four of the sensors were located along the main streets leading to the harbor and five of the sensors were located along the streets nearby active construction sites.
The highest CO concentrations were detected during the daytime, both morning (7–10 local time) and evening (15–18 local time) rush hour were easily detectable from the CO timeseries measured with sensors during weekdays (Figure 8). During weekends a large increase in CO was seen at daytime between 11 and 17 local time, correlating well with diurnal variation typically observed in weekends (e.g., Helin et al., 2018). The highest CO concentrations were observed by sensors located along the main streets whereas the lowest concentrations were observed at the urban background sites.
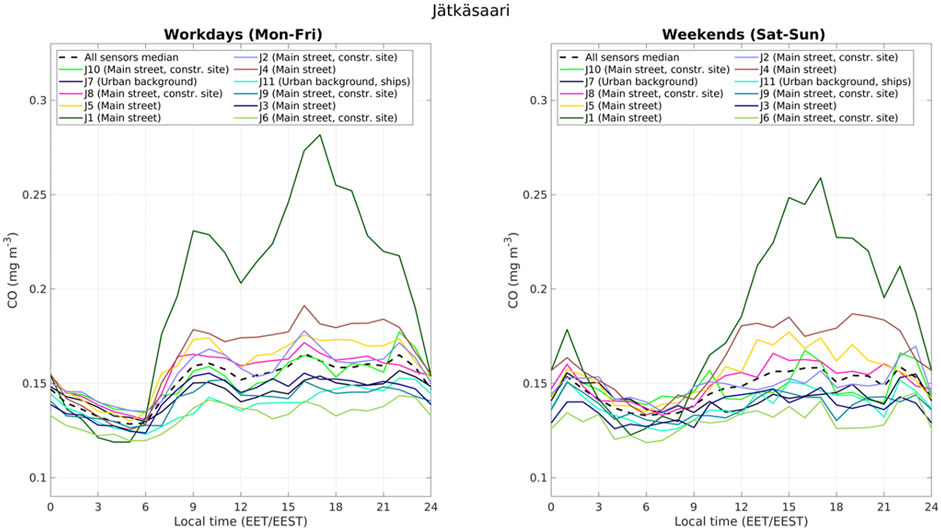
FIGURE 8. Median diurnal cycles of CO during 5-month period (1.8.-31.12.2020) for sensors located in Jätkäsaari (left) workdays (Mon-Fri) and (right) weekends (Sat-Sun). Black dashed line shows median diurnal cycle calculated for all data from that location.
For NO2 an increase in concentrations was observed between 6–22 local time both on weekdays and on weekends (Figure 9). The maximum concentrations were observed during traffic rush hour (morning 8–9, afternoon 15–17 local time); however, clearly detectable spikes in NO2 concentrations were seen also at the times when the ferry ships were leaving the harbor. Most easily detectable increase was seen at 21.30 local time, which was the scheduled departure time of the last ferry from Helsinki to Tallinn. These increases in the NO2 concentrations were likely caused both by the ship exhaust emissions and cars and trucks loaded into the ferry or leaving the ferry and consequently queueing in Tyynenmerenkatu street.
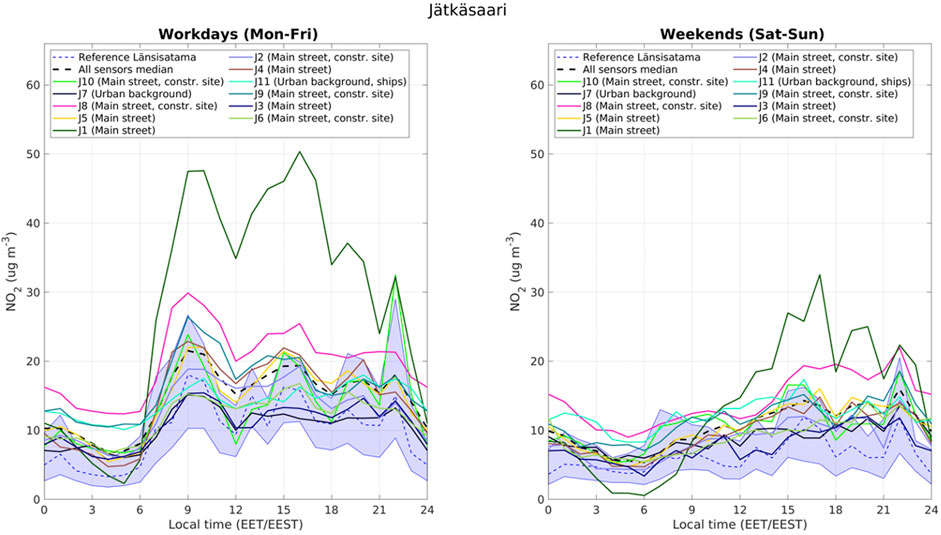
FIGURE 9. Median diurnal cycles of NO2 during 5-month period (1.8.-31.12.2020) for sensors located in Jätkäsaari (left) workdays (Mon-Fri) and (right) weekends (Sat-Sun). Reference measurements show median (dashed line) and 25th and 75th percentiles (shaded area) from nearest reference instrument. Black dashed line shows median diurnal cycle calculated for all data from that location.
For PM2.5 the elevated concentrations were observed during daytime from 7 to 18 local time during weekdays and at evening between 18–24 local time on weekends (Figure 10). On weekdays a larger variation in the PM2.5 concentrations was observed with the individual sensors when compared to weekends. A plausible reason for this is the higher heterogeneity of anthropogenic particle emissions in the Jätkäsaari area during the work weeks.
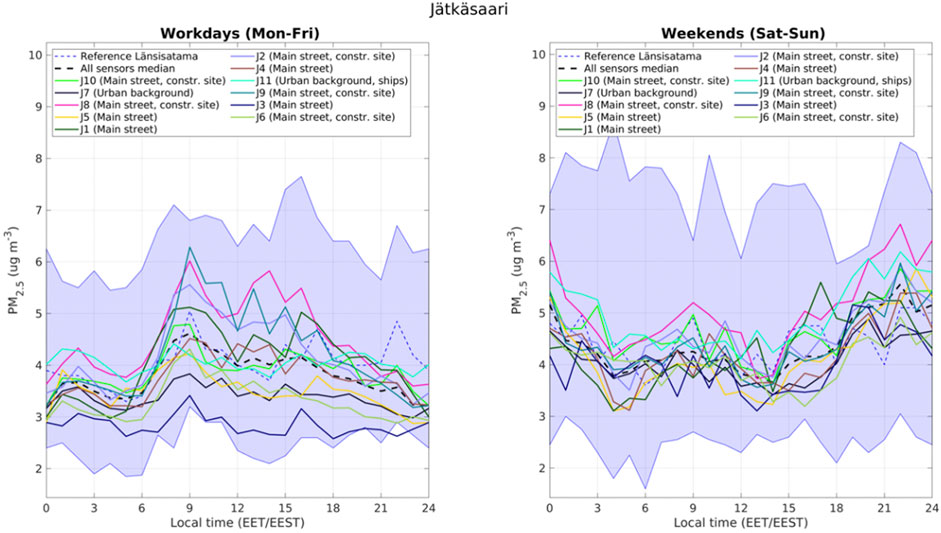
FIGURE 10. Median diurnal cycles of PM2.5 mass concentration during 5-month period (1.8.-31.12.2020) for sensors located in Jätkäsaari (left) workdays (Mon-Fri) and (right) weekends (Sat-Sun). Reference measurements show median (dashed line) and 25th and 75th percentiles (shaded area) from nearest reference instrument. Black dashed line shows median diurnal cycle calculated for all data from that location.
Impact of Construction Dust (PM10) in Jätkäsaari
PM10 concentrations are influenced by long-range transport and local anthropogenic activities (e.g., Querol et al., 2019; Hussein et al., 2020). In Helsinki area, one of the main air quality challenges particularly in the springtime is connected to high concentration of PM10 mass due to a combination of sanding the streets and use of studded tyres (e.g., Kupiainen et al., 2016). Road dust problems are tackled by street cleaning (Stojiljkovic et al., 2019), which reduces both the street wear as well as the resuspension of the dust. Furthermore, dusts binding with CaCl2 solution (∼10 weight% in water) is commonly applied to dusty streets in Helsinki downtown (Stojiljkovic et al., 2019). Another localized air quality effect linked to the coarse particles is construction site emitted dust (e.g., Amato et al., 2016). The construction sites have a negative impact on the quality of life of the people. The cost-effective sensor network provides new tools to monitor and control the dispersion of the dust emissions in the urban environment.
Jätkäsaari neighborhood is currently under active development and new residential buildings are being constructed. We explored how the local construction emissions are detected with the Vaisala sensor network. The results depicted in Figure 11 show the typical diurnal cycles of PM10 mass concentration in Jätkäsaari in summer and autumn conditions (July-October 2020), before the start of the use of studded winter tyres and the winter-sanding of streets. The reference observations show that the PM10 mass concentration remains below 10 μg m−3 during the nighttime and has a maximum concentration of 15 μg m−3 during afternoon hours. The diel cycles of the individual sensors show a large variability. For example, the sensor J8 located in the vicinity of both the main street and a construction site showed maximum mass concentrations up to twice the regional average and reaching values up to 30 μg m−3. However, there was a considerable range between the sensors and depending on the location the mass concentrations varied between the extreme concentrations and the regional average. The coarse particles were clearly connected to anthropogenic actions as the concentrations were below 10 μg m−3 in all sensor locations with a flat diurnal cycle during weekends. Our results show that the network of AQT530 sensors were able to detect the spatio-temporal variability of the dust emissions in the urban environment.
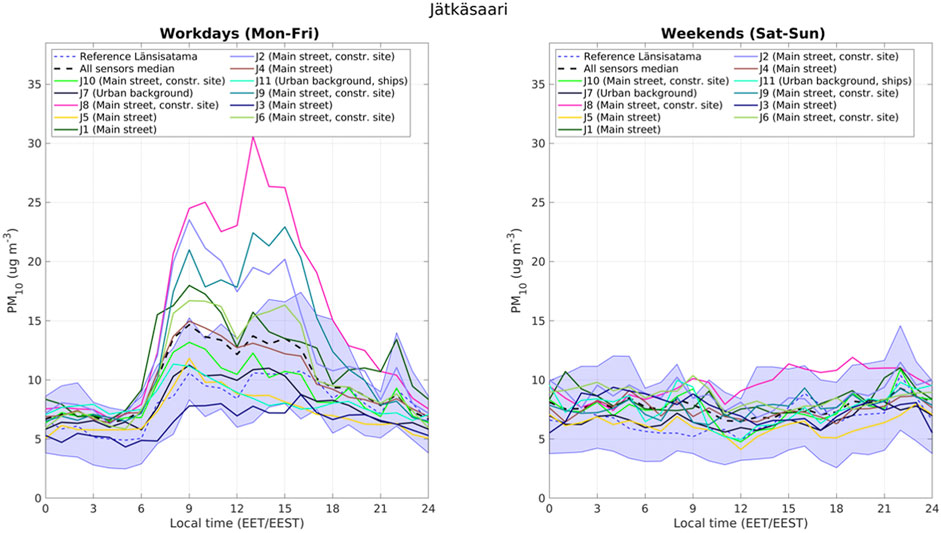
FIGURE 11. Median diurnal cycles of PM10 mass concentration during 4-month period (1.7.-31.10.2020) for sensors located in Jätkäsaari (left) workdays (Mon-Fri) and (right) weekends (Sat-Sun). Reference measurements show median (dashed line) and 25th and 75th percentiles (shaded area) from nearest reference instrument. Black dashed line shows median diurnal cycle calculated for all data from that location.
Detection of the Influence of Residential Wood-Combustion
Residential small-scale combustion of biomass, mostly wood, is one of the major pollution sources affecting air quality in urban areas across the globe (e.g., Chen et al., 2017, Helin et al., 2018; Olsen et al., 2020; Luoma et al., 2021). Wood combustion in Finland is typically a source for residential heating including saunas and fireplaces, especially during cold season (Savolahti et al., 2016). A recent study estimated that residential wood combustion constitutes approximately 13% of the total disease burden caused by PM2.5 concentrations in Finland (Savolahti et al., 2019). The influence of residential wood combustion in Helsinki is the largest in wintertime due to increased residential heating (Helin et al., 2018; Luoma et al., 2021). Residential wood combustion produces a complex mixture of gaseous (e.g., CO, CO2, hydrocarbons, and Polyaromatic hydrocarbons PAHs) and particulate emissions (e.g., Kortelainen et al., 2018). The particulate emissions are known to be mostly in PM2.5 size fraction and composed of wide variety of organic compounds, black carbon and inorganic ions (Lamberg et al., 2011; Frey et al., 2014; Kortelainen et al., 2018; Luoma et al., 2021).
A previous study indicated that during wintertime Pirkkola area air quality is strongly influenced by the biomass burning during winter (Kuula et al., 2020c). Furthermore, previous studies in similar residential areas conducted with the reference level instrumentation have indicated that the biggest increases in PM2.5 and BC are seen during evening times (18–21 local time), both on weekdays and on weekends (Helin et al., 2018).
In this study we focused on the ability of the sensors to detect combustion emissions and studied PM2.5 and CO concentrations and their diurnal variation during the cold season (January–February 2021) using eight AQT350 sensors (Figure 3) in Pakila region. The diurnal variation of CO (Figure 12) and PM2.5 (Figure 13) concentrations showed clear spikes in the morning during the traffic rush hour on weekdays. The observed CO and PM2.5 concentrations remained elevated until the afternoon rush hour. On weekends, the morning or afternoon high concentrations due to rush hour were not seen in the PM2.5 and CO timeseries.
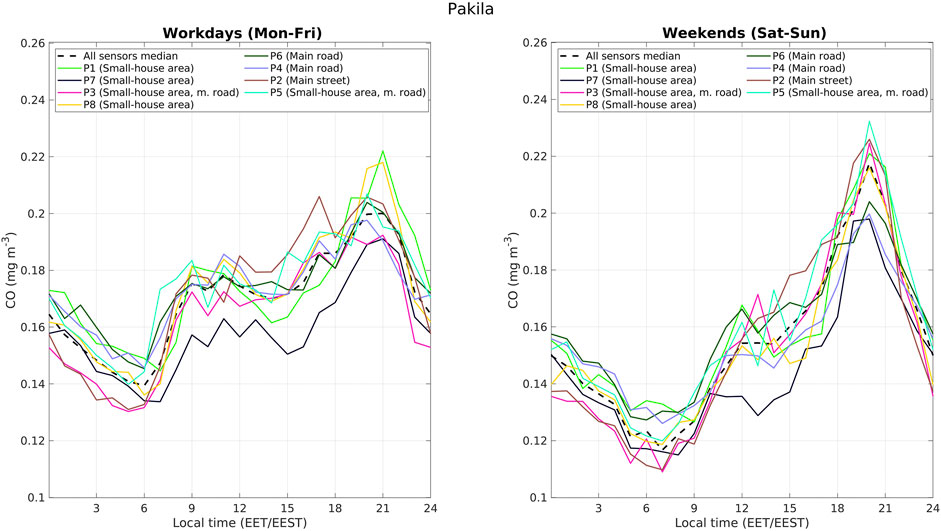
FIGURE 12. Median diurnal cycles of CO during 1.1.-28.2.2021 for sensors located in Pakila (left) workdays (Mon-Fri) and (right) weekends (Sat-Sun). Black dashed line shows median diurnal cycle calculated for all data from that location.
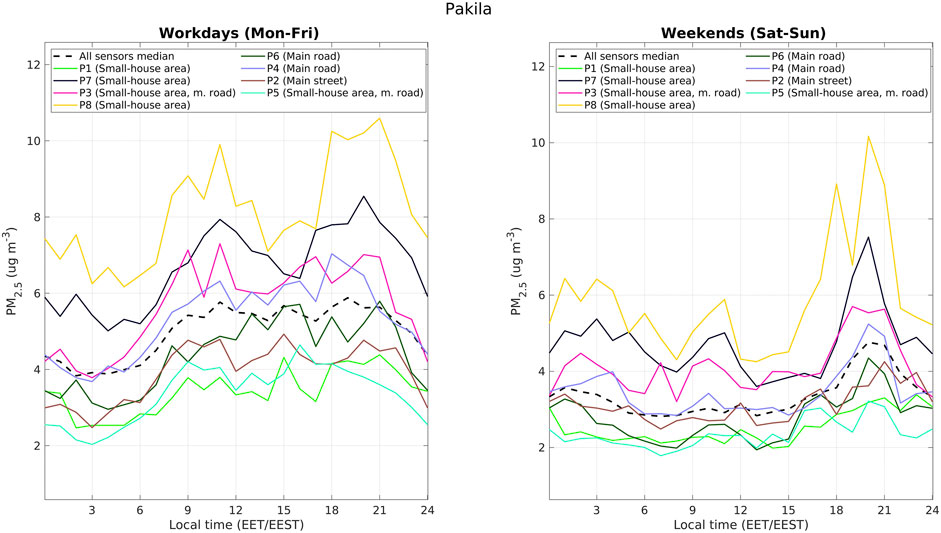
FIGURE 13. Median diurnal cycles of PM2.5 mass concentrations during 1.1.-28.2.2021 for sensors located in Pakila (left) workdays (Mon-Fri) and (right) weekends (Sat-Sun). Black dashed line shows median diurnal cycle calculated for all data from that location.
Another increase in PM2.5 and CO concentrations was seen in the evening, between 18–22 local time. A plausible explanation for this is local biomass combustion associated with wood burning in fireplaces and sauna stoves in the area. In the case of CO, the evening maximum exceeded the values detected during daytime. On weekends the evening concentrations of CO and PM2.5 were roughly two times larger than the daytime concentrations. Within the area, the observed CO concentrations were relatively similar in all seven measurement locations, whereas significant variation in the PM2.5 concentration levels were observed between the sensor measurement locations. The particulate emissions seemed to vary more in the area while the gas phase combustion product dispersed more evenly based on the sensor network data.
Detection of Long-Range Transport of Air Pollution
The air quality in Helsinki is influenced by long-range transport episodes, when air masses with high aerosol concentrations arrive from Central and Eastern Europe and from Russia. Based on data from 1999 to 2007, Niemi et al. (2009) summarized that the WHO guideline level of diurnal average concentration of 25 µg m-3 is exceeded 1–7 times per year due to such episodes. Approximately half of these events were partly caused by wildfires and agricultural waste burning and the rest from anthropogenic emissions through industrial activities, traffic or wood-combustion (Niemi et al., 2009). In sub-micron size range majority of these particles are composed of inorganics followed by organic compounds, nitrate and black carbon (Barreira et al., 2020).
In September–October 2020, Helsinki experienced deteriorated air quality due to long-range transport event. This can be seen from Figure 14, which shows that a large contribution of accumulation mode (larger than 100 nm in electrical equivalent diameter) was observed at SMEAR III station in Kumpula (Järvi et al., 2009; Luoma et al., 2021). This is a characteristic feature of the aerosol size distribution that is influenced by long-range transport (Hussein et al., 2014). The episode started on September 23 and lasted until October 6, 2020. The higher PM2.5 mass concentrations were observed with the sensor network in a consistent manner. Long-range transported particles are typically quite large in size and thus they are easily detected by optical sensors, such as AQT530. The intermittent improvement in air quality can be attributed to the changes in the air mass back trajectories.
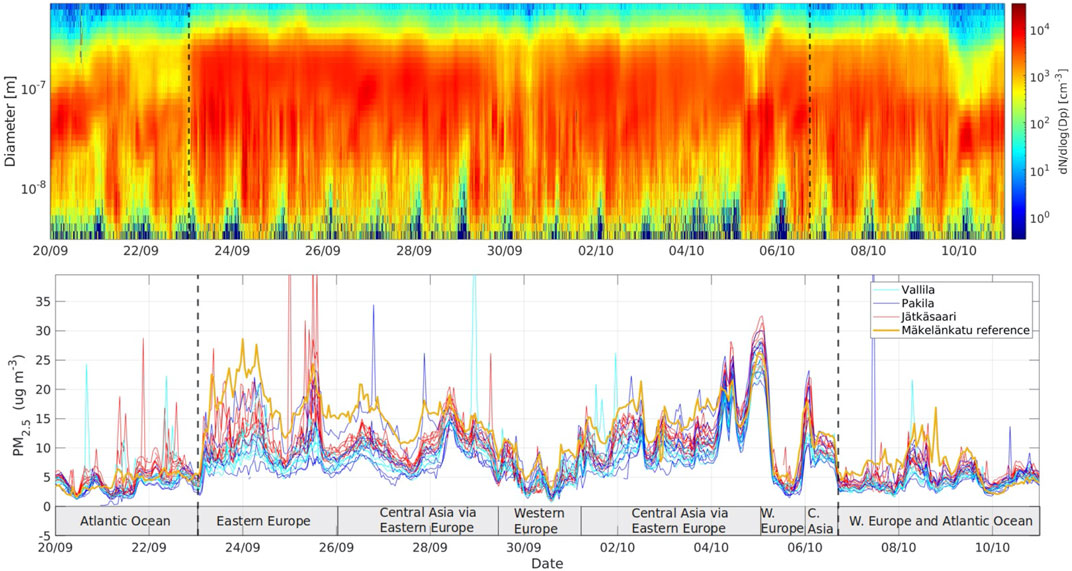
FIGURE 14. (Top) Aerosol number size distribution measured at SMEAR III station in Helsinki during September 2020. (Bottom) Aerosol mass measurements during September 2020 with a reference instruments and with the sensor network. The air mass backtrajectories indicate that the elevated accumulation mode aerosol particles originate from Eastern Europe. During the long-range transport episodes, aerosol mass concentration is elevated from a typical 5 µg m-3 up to 25 µg m-3 throughout the Helsinki Metropolitan Area. The intermittent lower mass concentrations are concurrent with back trajectories from West Atlantic.
Impact of New Year Celebrations
Fireworks are known to cause a significant short-term increase in air pollution during celebrations (e.g., Hoyos et al., 2019; Singh et al., 2019; Foreback et al., 2021; Lorenzo et al., 2021). The pollution consists mainly of PM2.5, PM10, black carbon (BC) and trace gases, such as NOx, CO, and SO2 (Singh et al., 2019). Especially particulate matter mass concentrations can be several times higher during firework events (Seidel and Birnbaum, 2015; Wang et al., 2007; Hoyos et al., 2019), and the levels usually return to normal in the following day (Drewnick et al., 2006; Seidel and Birnbaum, 2015). Particles produced by fireworks have increased metal content from colorants and black gun powder, resulting in distinctly different chemical composition compared to background aerosols (Drewnick et al., 2006; Wang et al., 2007).
In the HMA, the use of fireworks is permitted during New Year in the period stating from 31.12. at 18 local time and ending on 1.1. at 2 after midnight. PM10 concentrations measured by the sensors started increasing around 22 local time and the maximum was reached just after midnight (Figure 15). The levels stayed elevated until next morning. The night was rather cold and humid. Consequently, the relative humidity remained high during the night. Especially in Jätkäsaari the PM10 concentration increased with the increasing RH during the early hours of 2021, implying that the ground level conditions were foggy and the aerosol particles grew by condensation of water vapor. Since the sensors do not dry the aerosol, the observations are influenced by the high humidity conditions. However, the impact of fireworks is seen in the reference data as well. At the reference site at SMEAR III in Kumpula, where the mass concentration was determined with a TEOM instrument and dried before sampling, the mass concentration reached values as high as 62 μg m−3 just after midnight. Although the high mass concentrations from the sensor network were influenced and overestimated by the fog, the firework emissions seemed to increase the aerosol mass concentrations in the Helsinki area as seen from the reference observations.
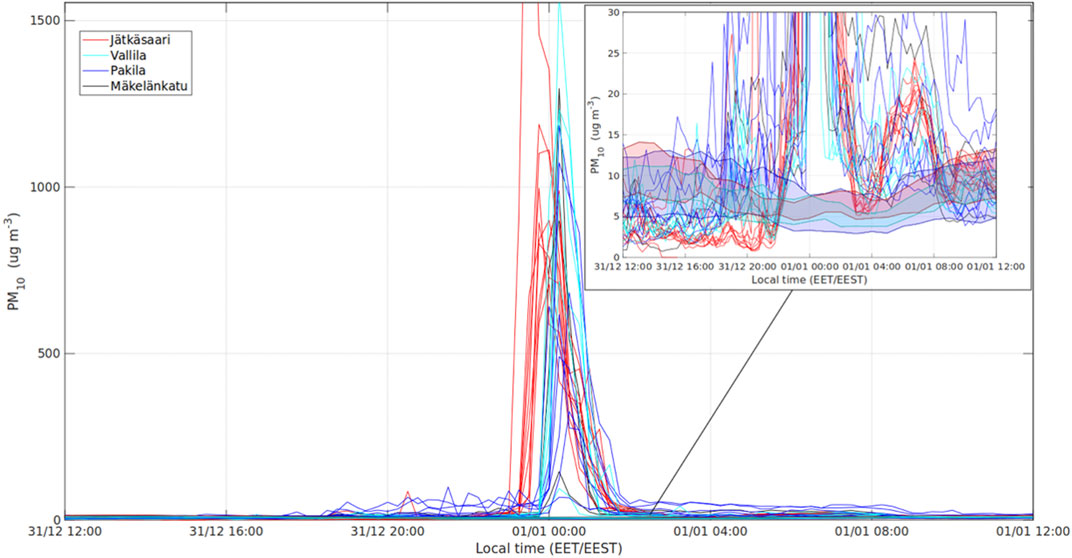
FIGURE 15. PM10 mass concentration during the New Year celebrations as 15-min averages. Shaded areas show range of diurnal cycles in workdays (Mon-Fri) during 1.12.2020–31.1.2021 for sensors at different locations.
Conclusion
Air quality is monitored with standardized air quality stations representing different urban environments. An arising trend is to supplement the spatio-temporal data on air quality with a suite of cost-effective air quality sensors. It is therefore important to understand the performance characteristics of sensing technologies used in this type of instruments. Here we characterized the performance of the optical detector used in Vaisala AQT530 air quality sensor in the laboratory. The results indicated that the sensors can detect the aerosol particles down to 600 nm in diameter and the mass concentration determined from the optical sensor is linear in the typical mass concentration range in urban areas.
We deployed a set of AQT530 sensors in the Mäkelänkatu curbside air quality monitoring site for a half-year period of time to explore the long-term stability of the instruments. The results from the five individual sensors correlated well with the reference data for NO, NO2, CO and PM10 with correlation coefficients (r2) of 0.77–0.95. The variability between the sensors was relatively small indicating stable quality of the sensors. PM2.5 mass concentrations exhibited lower correlation (r2 = 0.66–0.82) against the reference instruments and larger sensor-to-sensor variability. The weaker correlations of PM2.5 results are partly explained by the inability of the sensors to properly detect small particles (Dp<0.6 µm), and therefore the variation in particle size distributions in the ambient air affects the PM results of sensors. The O3 results of sensors were clearly the weakest with r2 values of 0.36–0.49.
In the long-term co-location study, we observed: 1) PM10 artefact peaks caused by very high humidity (RH>95%, especially fog) and 2) the long-term drifting of CO results probably due to the combined effects of aging and ambient temperature on electrochemical cells. The co-location study at the traffic site in Helsinki was performed between August and January, in the temperature range of −21 to +26°C. It is important to continue the evaluation of sensor performance in co-location tests covering the whole year in different urban sites and climate zones, including higher temperatures and humidity.
The accuracy of sensor results can be improved using correction equations based on co-location tests in local conditions. Therefore, we performed short-term (3–5 weeks) co-location tests at the reference site for all 25 sensors before their installation to the sensor network. These results were used to calculate sensor-specific correction equations for selected pollutants (CO and partly NO2). We did not get reliable enough correction equations for all pollutant components, since we had to carry out the co-location tests in three subsequent sensor batches and in unusually low pollutant concentration levels caused by COVID-19 related restrictions (e.g., Torkmahalleh et al., 2021) and summer holidays. Based on these experiences, it would be optimal to perform short co-location test at the same time, containing also typical and high pollutant concentrations.
We deployed Vaisala AQT530 sensors in different urban environments in Helsinki Metropolitan Area (HMA) to showcase the added value and novel insights that can be gained through the combination of regulatory air quality monitoring stations and the AQT530 sensor network. Eleven sensors in Jätkäsaari environment and six in Vallila underlined the role of road traffic and harbor activities particularly in the local NO2 and PM2.5 concentrations. The PM10 mass concentrations showed a considerable variability between locations close to construction sites and the regional reference measurements. With eight sensors in the suburban Pakila residential area, the Vaisala AQT530 network indicated the role of small-scale wood combustion particularly during evening times to contribute to CO and PM2.5 concentrations. The network of sensors reacted to the long-range transport episode in a harmonized manner during the period in September–October 2020, when air masses brought polluted air from the Central and Eastern Europe and European Russia. During the New Year celebrations, the sensors detected elevated aerosol mass concentrations, but the absolute concentration was influenced by high humidity and fog causing a bias in the optical detection.
As a summary, our results underline the importance of co-located on-site calibration period before deploying the sensor network to the different environments. This provides data on sensor-to-sensor variability for each air pollution component. A network of calibrated Vaisala AQT530 air quality sensors provided new insights into the variability of gas phase and particulate phase air pollution within the city. This can be utilized by the city administrations to optimize control of road and construction dust emissions and raising awareness of air quality problems connected to residential wood combustion.
Data Availability Statement
The raw data supporting the conclusions of this article will be made available by the authors, without undue reservation.
Author Contributions
TP had the idea for the paper; TP, HT, JN, ML, MK, and HM coordinated the atmospheric observations; JY-O, AJ, and JK performed, analysed and supervised laboratory work; TM and JN performed and supervised the co-location tests and field measurements with the sensors; AO, PF, PP analysed the atmospheric observations; TP, AO, PF, JY-O, JS, ML, MK, TH, AK, ST, MK, JN, TM, and HT contributed to the data interpretation; TP, AO, PF, JY-O, JN, JK, AJ, and HT wrote the article. All authors commented on the article.
Funding
Financial support from European Regional Development Fund, Urban innovative actions initiative (HOPE; Healthy Outdoor Premises for Everyone, project nro: UIA03-240), MegaSense Growth Engine: Air Quality Monitoring funded by Business Finland (Grant 7517/31/2018), trans-national ERA-PLANET project SMURBS (Grant Agreement 689,443) under the EU Horizon 2020 Framework Programme, and Academy of Finland Flagship funding (grant no. 337549, 337551, and 337552) is gratefully acknowledged.
Conflict of Interest
Authors JY-O, JS, and ML are employed by Vaisala.
The remaining authors declare that the research was conducted in the absence of any commercial or financial relationships that could be construed as a potential conflict of interest.
Acknowledgments
Petri Keronen from University of Helsinki/INAR is acknowledged for providing SMEAR III data.
Supplementary Material
The Supplementary Material for this article can be found online at: https://www.frontiersin.org/articles/10.3389/fenvs.2021.719567/full#supplementary-material.
References
Aakko-Saksa, P., Koponen, P., Roslund, P., Laurikko, J., Nylund, N.-O., Karjalainen, P., et al. (2020). Comprehensive Emission Characterisation of Exhaust from Alternative Fuelled Cars. Atmos. Environ. 236, 117643. doi:10.1016/j.atmosenv.2020.117643
WMO (2018). in Low-cost Sensors for the Measurement of Atmospheric Composition: Overview of Topic and Future Applications. Editors A. C. Lewis, E. von Schneidemesser, and R. E. Peltier, 68.
Alfano, B., Barretta, L., Del Giudice, A. Del., De Vito, S., Di Francia, G., Esposito, E., et al. (2020). A Review of Low-Cost Particulate Matter Sensors from the Developers' Perspectives. Sensors 20, 6819–6856. doi:10.3390/s20236819
Amato, F., Alastuey, A., Karanasiou, A., Lucarelli, F., Nava, S., Calzolai, G., et al. (2016). AIRUSE-LIFE+: a Harmonized PM Speciation and Source Apportionment in Five Southern European Cities. Atmos. Chem. Phys. 16, 3289–3309. doi:10.5194/acp-16-3289-2016
Anttila, P. (2020) Air Quality Trends in Finland, 1994–2018, Finnish Met. Inst. Contrib., 163, 54 pp, doi:10.35614/isbn.9789523361027
Arnold, S. R., Law, K. S., Brock, C. A., Thomas, J. L., Starkweather, S. M., von Salzen, K., et al. (2016). Arctic Air Pollution: Challenges and Opportunities for the Next Decade. Elem. Sci. Anth 4, 000104. doi:10.12952/journal.elementa.000104
Atkinson, R. W., Analitis, A., Samoli, E., Fuller, G. W., Green, D. C., Mudway, I. S., et al. (2016). Short-Term Exposure to Traffic-Related Air Pollution and Daily Mortality in London, UK. J. Expo. Sci. Environ. Epidemiol. 26, 125–132. doi:10.1038/jes.2015.65
Baklanov, A., Molina, L. T., and Gauss, M. (2016). Megacities, Air Quality and Climate. Atmos. Environ. 126, 235–249. doi:10.1016/j.atmosenv.2015.11.059
Barreira, L. M. F., Helin, A., Aurela, M., Teinilä, K., Friman, M., Kangas, L., et al. (2020). In-depth Characterization of Submicron Particulate Matter Inter-annual Variations at a Street canyon Site in Northern Europe. Atmos. Chem. Phys. 21, 6297–6314. doi:10.5194/acp-21-6297-2021
Caubel, J., Cados, T., and Kirchstetter, T. (2018). A New Black Carbon Sensor for Dense Air Quality Monitoring Networks. Sensors 18, 738–818. doi:10.3390/s18030738
Caubel, J. J., Cados, T. E., Preble, C. V., and Kirchstetter, T. W. (2019). A Distributed Network of 100 Black Carbon Sensors for 100 Days of Air Quality Monitoring in West Oakland, California. Environ. Sci. Technol. 53, 7564–7573. doi:10.1021/acs.est.9b00282
Chen, J., Li, C., Ristovski, Z., Milic, A., Gu, Y., Islam, M. S., et al. (2017). A Review of Biomass Burning: Emissions and Impacts on Air Quality, Health and Climate in China. Sci. Total Environ. 579, 1000–1034. doi:10.1016/j.scitotenv.2016.11.025
Chu, B., Kerminen, V.-M., Bianchi, F., Yan, C., Petäjä, T., and Kulmala, M. (2019). Atmospheric New Particle Formation in China. Atmos. Chem. Phys. 19, 115–138. doi:10.5194/acp-19-115-2019
Crippa, M., Janssens-Maenhout, G., Dentener, F., Guizzardi, D., Sindelarova, K., Muntean, M., et al. (2016). Forty Years of Improvements in European Air Quality: Regional Policy-Industry Interactions with Global Impacts. Atmos. Chem. Phys. 16, 3825–3841. doi:10.5194/acp-16-3825-2016
Cross, E. S., Williams, L. R., Lewis, D. K., Magoon, G. R., Onasch, T. B., Kaminsky, M. L., et al. (2017). Use of Electrochemical Sensors for Measurement of Air Pollution: Correcting Interference Response and Validating Measurements. Atmos. Meas. Tech. 10, 3575–3588. doi:10.5194/amt-10-3575-2017
Di Antonio, A., Popoola, O., Ouyang, B., Saffell, J., and Jones, R. (2018). Developing a Relative Humidity Correction for Low-Cost Sensors Measuring Ambient Particulate Matter. Sensors 18 (9), 2790. doi:10.3390/s18092790
Ding, A. J., Huang, X., Nie, W., Sun, J. N., Kerminen, V. M., Petäjä, T., et al. (2016). Enhanced Haze Pollution by Black Carbon in Megacities in China. Geophys. Res. Lett. 43, 2873–2879. doi:10.1002/2016GL067745
Drewnick, F., Hings, S. S., Curtius, J., Eerdekens, G., and Williams, J. (2006). Measurement of fine Particulate and Gas-phase Species during the New Year's Fireworks 2005 in Mainz, Germany. Atmos. Environ. 40 (23), 4316–4327. doi:10.1016/j.atmosenv.2006.03.040
Duyzer, J., van den Hout, D., Zandveld, P., and van Ratingen, S. (2015). Representativeness of Air Quality Monitoring Networks. Atmos. Environ. 104, 88–101. doi:10.1016/j.atmosenv.2014.12.067
Foley, J. A., DeFries, R., Asner, G. P., Barford, C., Bonan, G., Carpenter, S. R., et al. (2005). Global Consequences of Land Use. Science 309, 570–574. doi:10.1126/science.1111772
Foreback, B., Dada, L., Dällenbach, K., Yan, C., Wang, L., Chu, B., et al. (2021). Measurement Report: A Multi-Year Study on the Impacts of Chinese New Year Celebrations on Air Quality in Beijing, China. Atmos. Chem. Phys. Discuss. doi:10.5194/acp-2021-192
Frey, A. K., Saarnio, K., Lamberg, H., Mylläri, F., Karjalainen, P., Teinilä, K., et al. (2014). Optical and Chemical Characterization of Aerosols Emitted from Coal, Heavy and Light Fuel Oil, and Small-Scale wood Combustion. Environ. Sci. Technol. 48, 827–836. doi:10.1021/es4028698
Gan, W. Q., Koehoorn, M., Davies, H. W., Demers, P. A., Tamburic, L., and Brauer, M. (2011). Long-Term Exposure to Traffic-Related Air Pollution and the Risk of Coronary Heart Disease Hospitalization and Mortality. Environ. Health Perspect. 119, 501–507. doi:10.1289/ehp.1002511
Gimeno, L. (2013). Grand Challenges in Atmospheric Science. Front. Earth Sci. 1. doi:10.3389/feart.2013.00001
Hagler, G. S. W., Williams, R., Papapostolou, V., and Polidori, A. (2018). Air Quality Sensors and Data Adjustment Algorithms: When Is it No Longer a Measurement?. Environ. Sci. Technol. 52, 5530–5531. doi:10.1021/acs.est.8b01826
Hama, S. M. L., Ma, N., Cordell, R. L., Kos, G. P. A., Wiedensohler, A., and Monks, P. S. (2017). Lung Deposited Surface Area in Leicester Urban Background site/UK: Sources and Contribution of New Particle Formation. Atmos. Environ. 151, 94–107. doi:10.1016/j.atmosenv.2016.12.002
He, J., Gong, S., Yu, Y., Yu, L., Wu, L., Mao, H., et al. (2017). Air Pollution Characteristics and Their Relation to Meteorological Conditions during 2014-2015 in Major Chinese Cities. Environ. Pollut. 223, 484–496. doi:10.1016/j.envpol.2017.01.050
Hinds, W. C. (1999). Aerosol Technology: Properties, Behaviour, and Measurement of Airborne Particles. 2nd ed. John Wiley & Sons.
Högström, R., Quincey, P., Sarantaridis, D., Lüönd, F., Nowak, A., Riccobono, F., et al. (2014). First Comprehensive Inter-comparison of Aerosol Electrometers for Particle Sizes up to 200 Nm and Concentration Range 1000 Cm−3to 17 000 Cm−3. Metrologia 51, 293–303. doi:10.1088/0026-1394/51/3/293
Holder, A., Seay, B., Brashear, A., Yelverton, T., Blair, J., and Blair, S. (2018). “Evaluation of a Multi-Wavelength Black Carbon (BC) Sensor,” in Clean Air Soc. Australia and New ZealandLidcomeA, October 5–6, 2018.
Hoyos, C. D., Herrera-Mejía, L., Roldán-Henao, N., and Isaza, A. (2019). Effects of Fireworks on Particulate Matter Concentration in a Narrow valley: the Case of the Medellín Metropolitan Area. Environ. Monit. Assess. 192, 6. doi:10.1007/s10661-019-7838-9
Hussein, T., Li, X., Al-Dulaimi, Q., Daour, S., Atashi, N., Viana, M., et al. (2020). Particulate Matter Concentrations in a Middle Eastern City - an Insight to Sand and Dust Storm Episodes. Aerosol Air Qual. Res. 20, 2780–2792. doi:10.4209/aaqr.2020.05.0195
Hussein, T., Molgaard, B., Hannuniemi, H., Martikainen, J., Järvi, L., Wegner, T., et al. (2014). Fingerprints of the Urban Particle Number Size Distribution in Helsinki, Finland: Local versus Regional Characteristics. Boreal Environ. Res. 19, 1–20.
Järvi, J., Hannuniemi, H., Hussein, T., Junninen, H., Aalto, P. P., Hillamo, R., et al. (2009). The Urban Measurement Station SMEAR III: Continuous Monitoring of Air Pollution and Surface–Atmosphere Interactions in Helsinki, Finland. Boreal Env. Res. 14, 86–109.
Järvinen, A., Keskinen, J., and Yli-Ojanperä, J. (2018). Extending the Faraday Cup Aerosol Electrometer Based Calibration Method up to 5 Μm. Aerosol Sci. Technology 52, 828–840. doi:10.1080/02786826.2018.1472742
Jayaratne, R., Liu, X., Thai, P., Dunbabin, M., and Morawska, L. (2018). The Influence of Humidity on the Performance of a Low-Cost Air Particle Mass Sensor and the Effect of Atmospheric Fog. Atmos. Meas. Tech. 11, 4883–4890. doi:10.5194/amt-11-4883-2018
Jiao, W., Hagler, G., Williams, R., Sharpe, R., Brown, R., Garver, D., et al. (2016). Community Air Sensor Network (CAIRSENSE) Project: Evaluation of Low-Cost Sensor Performance in a Suburban Environment in the southeastern United States. Atmos. Meas. Tech. 9, 5281–5292. doi:10.5194/amt-9-5281-2016
Karagulian, F., Barbiere, M., Kotsev, A., Spinelle, L., Gerboles, M., Lagler, F., et al. (2019). Review of the Performance of Low-Cost Sensors for Air Quality Monitoring. Atmosphere 10, 506. doi:10.3390/atmos10090506
Kortelainen, M., Jokiniemi, J., Tiitta, P., Tissari, J., Lamberg, H., Leskinen, J., et al. (2018). Time-resolved Chemical Composition of Small-Scale Batch Combustion Emissions from Various wood Species. Fuel 233, 224–236. doi:10.1016/j.fuel.2018.06.056
Kosmopoulos, G., Salamalikis, V., Pandis, S. N., Yannopoulos, P., Bloutsos, A. A., and Kazantzidis, A. (2020). Low-cost Sensors for Measuring Airborne Particulate Matter: Field Evaluation and Calibration at a South-Eastern European Site. Sci. Total Environ. 748, 141396. doi:10.1016/j.scitotenv.2020.141396
Kulmala, M., Lappalainen, H. K., Lappalainen, H., Petäjä, T., Kerminen, V.-M., Viisanen, Y., et al. (2016). Pan-Eurasian Experiment (PEEX) Program: Grand Challenges in the Arctic-Boreal Context. Ges 9, 5–18. doi:10.15356/2071-9388_02v09_2016_01
Kupiainen, K., Ritola, R., Stojiljkovic, A., Pirjola, L., Malinen, A., and Niemi, J. (2016). Contribution of mineral Dust Sources to Street Side Ambient and Suspension PM10 Samples. Atmos. Environ. 147, 178–189. doi:10.1016/j.atmosenv.2016.09.059
Kurppa, M., Roldin, P., Strömberg, J., Balling, A., Karttunen, S., Kuuluvainen, H., et al. (2020). Sensitivity of Spatial Aerosol Particle Distributions to the Boundary Conditions in the PALM Model System 6.0. Geosci. Model Dev. 13, 5663–5685. doi:10.5194/gmd-13-5663-2020
Kuula, J., Friman, M., Helin, A., Niemi, J. V., Aurela, M., Timonen, H., et al. (2020c). Utilization of Scattering and Absorption-Based Particulate Matter Sensors in the Environment Impacted by Residential wood Combustion. J. Aerosol Sci. 150, 105671. doi:10.1016/j.jaerosci.2020.105671
Kuula, J., Kuuluvainen, H., Niemi, J. V., Saukko, E., Portin, H., Kousa, A., et al. (2020a). Long-term Sensor Measurements of Lung Deposited Surface Area of Particulate Matter Emitted from Local Vehicular and Residential wood Combustion Sources. Aerosol Sci. Technology 54, 190–202. doi:10.1080/02786826.2019.1668909
Kuula, J., Mäkelä, T., Aurela, M., Teinilä, K., Varjonen, S., González, Ó., et al. (2020b). Laboratory Evaluation of Particle-Size Selectivity of Optical Low-Cost Particulate Matter Sensors. Atmos. Meas. Tech. 13, 2413–2423. doi:10.5194/amt-13-2413-2020
Kuuluvainen, H., Poikkimäki, M., Järvinen, A., Kuula, J., Irjala, M., Dal Maso, M., et al. (2018). Vertical Profiles of Lung Deposited Surface Area Concentration of Particulate Matter Measured with a Drone in a Street canyon. Environ. Pollut. 241, 96–105. doi:10.1016/j.envpol.2018.04.100
Kuuluvainen, H., Rönkkö, T., Järvinen, A., Saari, S., Karjalainen, P., Lähde, T., et al. (2016). Lung Deposited Surface Area Size Distributions of Particulate Matter in Different Urban Areas. Atmos. Environ. 136, 105–113. doi:10.1016/j.atmosenv.2016.04.019
Lamberg, H., Nuutinen, K., Tissari, J., Ruusunen, J., Yli-Pirilä, P., Sippula, O., et al. (2011). Physicochemical Characterization of fine Particles from Small-Scale wood Combustion. Atmos. Environ. 45, 7635–7643. doi:10.1016/j.atmosenv.2011.02.072
Lappalainen, H. K., Petäjä, T., Kujansuu, J., Kerminen, V.-M., Shvidenko, A., Bäck, J., et al. (2014). Pan Eurasian Experiment (Peex) - a Research Initiative Meeting the Grand Challenges of the Changing Environment of the Northern Pan-eurasian Arctic-Boreal Areas. Geogr. Environ. Sustain. 7, 13–48. doi:10.24057/2071-9388-2014-7-2-13-48
Liu, H.-Y., Schneider, P., Haugen, R., and Vogt, M. (2019). Performance Assessment of a Low-Cost PM2.5 Sensor for a Near Four-Month Period in Oslo, Norway. Atmosphere 10, 41. doi:10.3390/atmos10020041
Lorenzo, G. R., Bañaga, P. A., Cambaliza, M. O., Cruz, M. T., AzadiAghdam, M., Arellano, A., et al. (2021). Measurement Report: Firework Impacts on Air Quality in Metro Manila, Philippines, during the 2019 New Year Revelry. Atmos. Chem. Phys. 21, 6155–6173. doi:10.5194/acp-21-6155-2021
Luoma, K., Niemi, J. V., Aurela, M., Fung, P. L., Helin, A., Hussein, T., et al. (2021). Spatiotemporal Variation and Trends in Equivalent Black Carbon in the Helsinki Metropolitan Area in Finland. Atmos. Chem. Phys. 21, 1173–1189. doi:10.5194/acp-21-1173-2021
Mead, M. I., Popoola, O. A. M., Stewart, G. B., Landshoff, P., Calleja, M., Hayes, M., et al. (2013). The Use of Electrochemical Sensors for Monitoring Urban Air Quality in Low-Cost, High-Density Networks. Atmos. Environ. 70, 186–203. doi:10.1016/j.atmosenv.2012.11.060
Niemi, J. V., Saarikoski, S., Aurela, M., Tervahattu, H., Hillamo, R., Westphal, D. L., et al. (2009). Long-range Transport Episodes of fine Particles in Southern Finland during 1999-2007. Atmos. Environ. 43, 1255–1264. doi:10.1016/j.atmosenv.2008.11.022
Olsen, Y., Nøjgaard, J. K., Olesen, H. R., Brandt, J., Sigsgaard, T., Pryor, S. C., et al. (2020). Emissions and Source Allocation of Carbonaceous Air Pollutants from wood Stoves in Developed Countries: A Review. Atmos. Pollut. Res. 11, 234–251. doi:10.1016/j.apr.2019.10.007
Petäjä, T., Järvi, L., Kerminen, V.-M., Ding, A. J., Sun, J. N., Nie, W., et al. (2016). Enhanced Air Pollution via Aerosol-Boundary Layer Feedback in China. Sci. Rep. 6, 18998. doi:10.1038/srep18998
Popoola, O. A. M., Carruthers, D., Lad, C., Bright, V. B., Mead, M. I., Stettler, M. E. J., et al. (2018). Use of Networks of Low Cost Air Quality Sensors to Quantify Air Quality in Urban Settings. Atmos. Environ. 194, 58–70. doi:10.1016/j.atmosenv.2018.09.030
Querol, X., Pérez, N., Reche, C., Ealo, M., Ripoll, A., Tur, J., et al. (2019). African Dust and Air Quality over Spain: Is it Only Dust that Matters?. Sci. Total Environ. 686, 737–752. doi:10.1016/j.scitotenv.2019.05.349
IPCC (2014). in Climate Change Synthesis Report. Contribution of Working Groups I, II and III to the Fifth Assessment Report of the Intergovernmental Panel on Climate Change [Core Writing Team. Editors R. K. Pachauri, and L. A. Meyer (Geneva, Switzerland: IPCC), 151–169.
Rohde, R. A., and Müller, R. A. (2015). Air Pollution in China: Mapping of Concentrations and Sources. PLOS One 10, e0135749. doi:10.1371/journal.pone.0135749
Rostedt, A., and Keskinen, J. (2018). Flow Rate-independent Electrical Aerosol Sensor. Aerosol Sci. Technology 52, 1283–1292. doi:10.1080/02786826.2018.1498586
Savolahti, M., Karvosenoja, N., Tissari, J., Kupiainen, K., Sippula, O., and Jokiniemi, J. (2016). Black Carbon and fine Particle Emissions in Finnish Residential wood Combustion: Emission Projections, Reduction Measures and the Impact of Combustion Practices. Atmos. Environ. 140, 495–505. doi:10.1016/j.atmosenv.2016.06.023
Savolahti, M., Lehtomäki, H., Karvosenoja, N., Paunu, V. V., Korhonen, A., Kukkonen, J., et al. (2019). Residential wood Combustion in Finland: PM2.5 Emissions and Health Impacts with and without Abatement Measures. Ijerph 16, 2920. doi:10.3390/ijerph16162920
Schneider, P., Bartonova, A., Castell, N., Dauge, F. R., Gerboles, M., Hagler, G. S. W., et al. (2019). Toward a Unified Terminology of Processing Levels for Low-Cost Air-Quality Sensors. Environ. Sci. Technol. 53, 8485–8487. doi:10.1021/acs.est.9b03950
Seidel, D. J., and Birnbaum, A. N. (2015). Effects of Independence Day Fireworks on Atmospheric Concentrations of fine Particulate Matter in the United States. Atmos. Environ. 115, 192–198. doi:10.1016/j.atmosenv.2015.05.065
Singh, A., Pant, P., and Pope, F. D. (2019). Air Quality during and after Festivals: Aerosol Concentrations, Composition and Health Effects. Atmos. Res. 227, 220–232. doi:10.1016/j.atmosres.2019.05.012
Spinelle, L., Gerboles, M., Villani, M. G., Aleixandre, M., and Bonavitacola, F. (2015). Field Calibration of a Cluster of Low-Cost Available Sensors for Air Quality Monitoring. Part A: Ozone and Nitrogen Dioxide. Sensors Actuators B: Chem. 215, 249–257. doi:10.1016/j.snb.2015.03.031
Stojiljkovic, A., Kauhaniemi, M., Kukkonen, J., Kupiainen, K., Karppinen, A., Denby, B. R., et al. (2019). The Impact of Measures to Reduce Ambient Air PM10 Concentrations Originating from Road Dust, Evaluated for a Street canyon in Helsinki. Atmos. Chem. Phys. 19, 11199–11212. doi:10.5194/acp-19-11199-2019
Teinilä, K., Aurela, M., Niemi, J. V., Kousa, A., Petäjä, T., Järvi, L., et al. (2019). Concentration Variation of Gaseous and Particulate Pollutants in the Helsinki City centre — Observations from a Two-Year Campaign from 2013–2015. Boreal Env. Res. 24, 115–136.
Torkmahalleh, M. A., Akhmetvaliyeva, Z., Omran, A. D., Omran, F. D., Kazemitabar, M., Naseri, M., et al. (2021). Global Air Quality and COVID-19 Pandemic: Do We Breathe Cleaner Air?. Aerosol Air Qual. Res. 21, 200567. doi:10.4209/aaqr.200567
Wang, Y., Zhuang, G., Xu, C., and An, Z. (2007). The Air Pollution Caused by the Burning of Fireworks during the Lantern Festival in Beijing. Atmos. Environ. 41, 417–431. doi:10.1016/j.atmosenv.2006.07.043
Williams, R., Duvall, R., Kilaru, V., Hagler, G., Hassinger, L., Benedict, K., et al. (2019). Deliberating Performance Targets Workshop: Potential Paths for Emerging PM2.5 and O3 Air Sensor Progress. Atmos. Environ. X 2, 100031. doi:10.1016/j.aeaoa.2019.100031
Yli-Ojanperä, J., Mäkelä, J. M., Marjamäki, M., Rostedt, A., and Keskinen, J. (2010). Towards Traceable Particle Number Concentration Standard: Single Charged Aerosol Reference (SCAR). J. Aerosol Sci. 41, 719–728. doi:10.1016/j.jaerosci.2010.04.012
Zhang, R., Lei, W., Tie, X., and Hess, P. (2004). Industrial Emissions Cause Extreme Urban Ozone Diurnal Variability. Proc. Natl. Acad. Sci. 101, 6346–6350. doi:10.1073/pnas.0401484101
Keywords: air quality, air quality sensors, sensor network, particulate matter, gaseous pollutants
Citation: Petäjä T, Ovaska A, Fung PL, Poutanen P, Yli-Ojanperä J, Suikkola J, Laakso M, Mäkelä T, Niemi JV, Keskinen J, Järvinen A, Kuula J, Kurppa M, Hussein T, Tarkoma S, Kulmala M, Karppinen A, Manninen HE and Timonen H (2021) Added Value of Vaisala AQT530 Sensors as a Part of a Sensor Network for Comprehensive Air Quality Monitoring. Front. Environ. Sci. 9:719567. doi: 10.3389/fenvs.2021.719567
Received: 02 June 2021; Accepted: 01 July 2021;
Published: 16 July 2021.
Edited by:
Dmitry Efremenko, Helmholtz Association of German Research Centers (HZ), GermanyReviewed by:
Sreekanth Vakacherla, Technology and Policy–CSTEP, IndiaMikhail Yu Kataev, University TUSUR, Russia
Copyright © 2021 Petäjä, Ovaska, Fung, Poutanen, Yli-Ojanperä, Suikkola, Laakso, Mäkelä, Niemi, Keskinen, Järvinen, Kuula, Kurppa, Hussein, Tarkoma, Kulmala, Karppinen, Manninen and Timonen. This is an open-access article distributed under the terms of the Creative Commons Attribution License (CC BY). The use, distribution or reproduction in other forums is permitted, provided the original author(s) and the copyright owner(s) are credited and that the original publication in this journal is cited, in accordance with accepted academic practice. No use, distribution or reproduction is permitted which does not comply with these terms.
*Correspondence: Tuukka Petäjä, dHV1a2thLnBldGFqYUBoZWxzaW5raS5maQ==