 Ling Lu
 Kai Fang
 Chuan Ming Liu
 Cheng Sun
- 1School of Low Carbon Economics, Hubei University of Economics, Wuhan, China
- 2Center of Hubei Cooperative Innovation for Emissions Trading System, Hubei University of Economics, Wuhan, China
- 3School of Public Affairs, Zhejiang University, Hangzhou, China
- 4School of Economics, Shandong University of Finance and Economics, Jinan, China
Under the tide of global economic integration with aggravated environmental risks caused by intensive human activities, the spatial network correlation of environmental risks has become intensified. The close exchange of activities among the countries under the Belt and Road Initiative (BRI) will especially feel this contagion of environmental risks. Given this situation, this article analyzes the environmental risk contagion relations among the BRI countries and the characteristics of their network structure by using social network analysis (SNA). A block model is used to analyze the spatial clustering characteristics of the environmental risk contagion. Specifically, the driving factors of environmental risk contagion are analyzed through the quadratic assignment procedure (QAP) of SNA. The results of this article provide some references for the BRI to reduce the environmental risks and jointly control the environmental risk contagion, so as to assist in the promotion of a green silk road.
Introduction
In September and October of 2013, China’s President Xi Jinping put forward the cooperation initiatives, the “New Silk Road Economic Belt” and the “21st Century Maritime Silk Road” (known together as “One Belt and One Road”), intending to seek common development and win-win cooperation with China’s neighboring countries. The Belt and Road Initiative (BRI) countries have rich mineral resources but complex geographical conditions and fragile ecological environments. They are mainly developing countries still in the stage of promoting economic growth through large-scale resource consumption and concomitant pollution emissions, and faced with increasingly severe ecological and environmental problems. The environmental risk of the BRI is the primary concern due to the presence of many ecologically sensitive areas within the regions. These locations with higher ecological sensitivity include arid regions, biodiversity hotspots, and protected areas (Tracy et al., 2017).
The Belt and Road Initiative will greatly influence the future of global trade. However, it may also promote permanent environmental degradation (Ascensão et al., 2018). As globalization is typically accompanied by the transfer of industries with high carbon emissions from developed countries to emerging economies, many of the regions along the BRI are already experiencing resource and environmental problems along with their economic growth (Dong et al., 2015; Han et al., 2018).
However, disturbances to the BRI regional environmental risk could rise dramatically because of these intense human activities and productive activities. Moreover, environmental risks generated by implementing these projects may result in wastes of human and material resources, and misunderstanding and conflicts between outsiders and locals (Xiao, 2019; Yang and Li, 2019). To help address this problem, Xi Jinping called for a “green, healthy, intelligent, and peaceful” Silk Road (Ma, 2016). He suggested that the participating countries “deepen cooperation in environmental protection, intensify ecological preservation, and build a green Silk Road” (MOFCOM, 2017). While strengthening its ecological progress, China is committed to building a “green silk road” with its BRI copartners. Therefore, a comprehensive analysis of the spatial network contagion of the environmental risks in the BRI is of great significance for countries aiming to coordinate the control of environmental risk levels, reduce the environmental risk contagion, and build a green silk road.
Literature Review
Environmental risk is the probability and consequences of unfortunate events caused by spontaneous natural events and human activities spread through environmental media. It can have destructive effects on human society and the natural environment (Zhong et al., 1996; Torinelli and Silva Júnior, 2021). The dimensions of the environmental physical risks are climatic, geologic, and ecosystemic (Leadership, 2017).
Mainly, studies on environmental risk always focus on the assessments of environmental risk. Greenpeace (2017) advocated that environmental impact assessments should be integrated into the BRI and that the results of these assessments be made publicly available. Torinelli and Silva Júnior (2021) used the environmental physical risks and associated transition risks to construct an environmental risk measurement index to assess the impact of environmental risks on financial assets and investments. Environment-related risks can cause “stranded assets,” or ones impacted by unanticipated or premature write-downs, devaluations, or conversion to liabilities (Caldecott et al., 2014). Huang (2019) took three dimensions, including environmental quality, climate change, and ecological vulnerability, into account when assessing environmental risks, and analyzed the environmental opportunities of the BRI.
The level of environmental risk in a country may not only be determined by local environmental conditions but also by affected other regions. On the one hand, increased environmental risk in a country will affect the local environmental policy standard. If environmental regulation standards are too high, companies will locate their production activities in countries with lax environmental regulation and high emission intensity due to the “pollution paradise effect” (Copeland and Taylor, 2003), thereby affecting the environmental risks of other countries.
On the other hand, as an important link among macroeconomic activities, trade plays an irreplaceable guiding role in producing and consuming goods and services (Hu et al., 2018). In the global value chain, each country and department faces a potential environmental cost for each unit of GDP. The environmental cost will be transferred among different countries and departments through trade, which is closely related to the degree, mode, and position of a country’s participation in the value chain (Meng et al., 2016). As more than 95% of the world’s net carbon sequestration occurs in regions along the Belt and Road (Yao et al., 2018), the BRI bears considerable carbon emission pressures. International trade changes a country’s technological progress and carbon productivity (Li et al., 2016), thereby affecting each country’s environmental risk changes. Global trade can lead to a “carbon leak” of greenhouse gas emissions, with rich countries relocating their emission-intensive production activities to poorer countries (Kuik and Hofkes, 2010; Li et al., 2020). Hence, environmental risks are reduced in rich countries and increased in poor countries.
International trade also affects global biodiversity. Consumers in developed countries threaten some plant and animal species through their demand for commodities that are mainly produced in developing countries (Lenzen et al., 2012). Some environmental risks caused by consumers in developed countries have been transferred to developing countries through trade. Moreover, some consumers derive benefits from various services provided by nature, referred to as “natural capital,” and cause plant and animal extinctions. The loss of biodiversity poses significant risks to the global economy and society (Dasgupta and McKenzie, 2020). The environmental risk caused by such biodiversity destruction increases the contagiousness of environmental risk among countries through economic and social systems.
As there are multiple activities taking place in the BRI countries under the ambit of common development, the contagion of environmental risks may be significant. With such concern, this article mainly targets on the countries along the BRI, to study the spatial network contagion of environmental risks among the countries.
The contributions of this article are as follows: first, the research object of this article is the environmental risk contagion relationship. Environmental risks are not only determined by local environmental risks but also be affected by environmental risks in other regions. Second, this article employs the social network analysis method to study the environmental risk contagion of the BRI. This method is mainly applied to the research of attribute data relations, which can not only examine the spatial relations of neighboring regions but also present the spatial relations between distant regions.
Methodology and Data
The Social Network Analysis Model
In this article, social network analysis (SNA) is used to investigate the spatial correlation network contagion of environmental risk among the BRI countries. SNA is an interdisciplinary analysis method for relational data which has been widely used in many fields (Wasserman and Faust, 1994; Benítez-Andrades, et al., 2020). It takes the relationship between individuals in the structure as the analysis object and describes the relationship pattern among individuals. Owing to the advantages of iconic expression and precise calculation, SNA has been extensively adopted in an army of disciplines, including economics, sociology, management, geography, and tourism (Scott and Carrington, 2011). This method was chosen for two main reasons. First, the network analysis method has the characteristics of global analysis, which can avoid the limitation of the spatial econometric analysis method, that can only analyze “adjacent” and “close” areas (Wolfe, 1995; Borgatti et al., 2009). Second, the network analysis method mainly analyzes the structural relationship data, which often determines the attribute data and has more analytical value (Yin et al., 2020). Therefore, this article uses the social network analysis method to analyze the environmental risk contagion among the BRI countries. Reilly (1929) first introduced the gravity model to demographic geography, and it has since been incorporated into social science studies (Cantore and Cheng, 2018; Yu and Di, 2020). The modified gravity model was based on the law of universal gravitation (Wu et al., 2016) that was used to determine the spatial correlation of SNA (Liu and Xiao, 2021).
Environmental risk–related influenced factors include air quality, natural resources, and biodiversity (Tracy et al., 2017; Ascensão et al., 2018). Air pollutants dominated by particulate matter with a diameter <2.5 μm (PM2.5) cause economic losses equal to 1% of the world’s GDP (Sheehan et al., 2014; Silver et al., 2018). Natural resource depletion is a concern for sustainable development as it has the ability to degrade current environments and the potential to impact the needs of future generations (Salvati and Marco, 2008). Threatened species is one of the indicators of ecological vulnerability that reflects the degree of ecological fragility and sensitivity, as well as the degree to which regional ecological and environmental damage may occur (Huang, 2019). In gravity, the attraction between two objects depends on their masses and distance. Environmental footprints, including water, land, carbon, nitrogen, and phosphorus footprints, show strong spatial heterogeneity within the BRI (Fang et al., 2021). Therefore, the contagion paths should be affected by the distance between the nodes in the spatial network. Based on the above considerations, this article modifies the gravity model by taking into account the following key environmental risk contagion indicators, including distance between countries, threatened species, natural resource loss, and particulate matter emission damage. The formula is as follows:
where Rij refers to the gravitational force between the environmental risks of country
Spatial Correlation Index
Overall Network Characteristics
Density indicates the closeness of the spatial correlation of environmental risks among the countries in the network. Network density is applied to evaluate the level of closeness among different nodes in a network (Bai et al., 2020). The value of this measure ranges from 0 to 1: the higher the density, the closer the contagion of environmental risks among the BRI countries. Network density can be defined as the ratio of the number of relationships owned by the node to the maximum possible relationships in the entire network (Scott and Carrington, 2011). Assume that the number of countries in the network is N and the relationship number of environmental risk contagion is L, then the calculation formula of network density (Den) is expressed as follows:
Connectedness represents the robustness and vulnerability of the spatial association network of environmental risks among countries, and the value range is 0–1. If there is a direct or indirect path between any two countries in the environmental risk contagion network that connects the environmental risks as a whole, the network has intense correlation. Let the number of nodes in the network be N and the logarithm of unreachable points in the network be V, then the calculation formula of connectedness (CD) is expressed as follows:
The hierarchy represents the extent to which countries are asymmetrically accessible and whether there is a rigid hierarchical structure in the network, indicating the dominant position of countries in the network. Let the symmetrically reachable point logarithm in the network be K and the maximum possible symmetrically reachable point logarithm be max (K), then the hierarchy (H) is expressed as follows:
Efficiency refers to the extent that redundant connections exist in the spatial network contagion of environmental risks among countries. Moreover, the greater the efficiency, the more intensive the network structure’s stability. Let the number of redundant lines in the network be M and the maximum possible number of redundant lines be max (M), then the efficiency (E) is expressed as follows:
Individual Centrality
In addition to describing the overall network structure characteristics, social network analysis can also analyze the network structure characteristics of each node through individual centrality so as to describe the status and role of each country in the network (Freeman, 2004; Liu et al., 2015). Degree centrality measures the degree to which a node is in the center of the network according to the number of connections in the network. The country with a higher degree is in the central position of the network. The degree is also divided into point out degree (Out) and point in degree (In). The point out degree of country
Closeness indicates the degree to which other countries do not control a node. The higher closeness indicates that the country belongs to the central actor. The shortcut distance between countries is denoted as dij, and closeness C is denoted as follows:
Betweeness is used to measure the degree where a country controls the contagion of environmental risk. If a region is on the shortest path of multi-pair regions, it is likely to play an important role of “intermediary” or “bridge” in the network. Betweeness B is calculated by the following formula:
where
Block Model
Block model analysis means dividing all of the nodes into different modules and investigating the role and status of different modules in the environmental risk contagion. In this article, the BRI countries are divided into four types by the block model: main beneficiary, two-way spillover, broker, and net spillover.
The Quadratic Assignment Procedure Method
There is a premise in the traditional multiple regression model; that is, the explained variables are independent, and there can be no multicollinearity. Otherwise, serious errors will occur in the regression. Therefore, the “relation” variables in this article are highly correlated and do not fit the traditional multiple linear regression. QAP (quadratic assignment procedure) analysis is a nonparametric test method based on random permutation. By comparing the differences between two matrices, the relation number between matrices is determined.
According to the gravity model of environmental risk mentioned constructed above, the most direct influencing factor of the environmental risk contagion between countries includes geographical distance, loss of natural resources, damage from particulate matter emissions, and threatened species. These indicators are presented in Table 1.
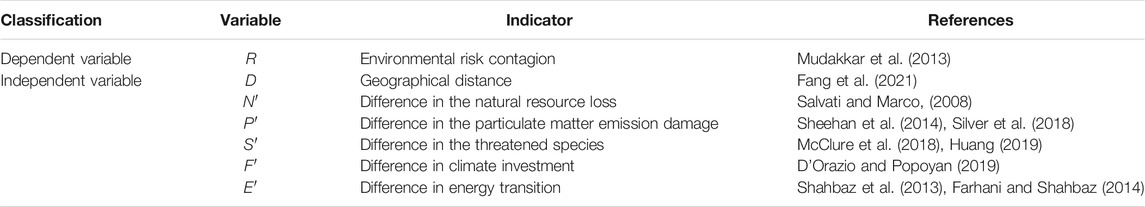
TABLE 1. Classification, variable, indicator, and reference.
Climate investment is used mainly for national mitigation and adaptation projects to address environmental vulnerability caused by climate change, which will affect the contagious relationship of environmental risks between countries to a certain extent. Energy transition difference represented by differences in installed capacity of renewable energy indicates that the degree of energy transformation and upgrading in different countries may affect the environmental risk level and the contagion effect. The model is established as follows:
The Data Source
The BRI countries were taken as the research objects. All data were extracted from the World Bank database. We selected 44 countries from 65 commonly accepted BRI countries due to lack of data in some countries. The selected 44 countries are presented in Table 2. The distance between the countries (D) was represented by spherical distance, which was calculated by ArcGIS. The World Bank estimated the damage from particulate emissions (P) and the depletion of natural resources (dollar as the unit) based on sources and methods described in the World Bank’s The Changing Wealth of Nations (2011). Natural resource depletion (N) is the sum of net forest depletion, energy depletion, and mineral depletion. Energy depletion is highly related to fossil fuel energy consumption, which results in climate change risk. Net forest depletion is unit resource rent times the excess of roundwood harvest over natural growth. Energy depletion is the ratio of the value of the stock of energy resources to the remaining reserve lifetime; it covers coal, crude oil, and natural gas. Mineral depletion is the ratio of the value of the stock of mineral resources to the remaining reserve lifetime; it covers tin, gold, lead, zinc, iron, copper, nickel, silver, bauxite, and phosphate. Threatened species (S) is the number of species classified by the International Union for Conservation of Nature (IUCN) as endangered, vulnerable, rare, indeterminate, out of danger, or insufficiently known. The data of threatened species are only available in 2018. In order to ensure the data neatly in the paper, all data of variables are selected in the same year.
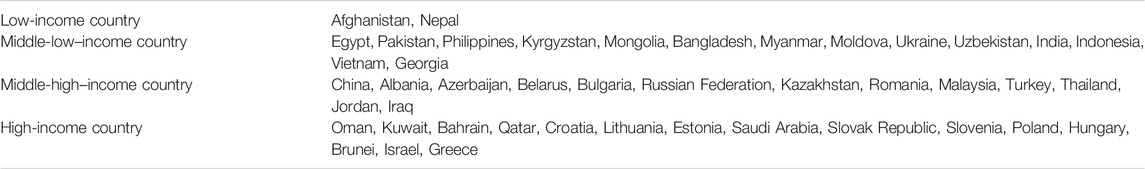
TABLE 2. Income situation of the BRI.
The difference in percentage of natural resource loss in GNI (N′), the difference in particulate emission damage as a percentage of GNI(P′), and the difference in threatened species (S′) are all from World Bank database with matrix operations. In addition, it includes the climate investment difference (F′), which is represented by the Asian Infrastructure Investment Bank (AIIB) climate investment in the BRI. The AIIB's climate investment in the BRI was funded until the end of December 2018. The data come from the project information compilation on the official website of the AIIB, and the unit is 100 million dollars. The installed capacity of renewable energy data was derived from the International Renewable Energy Agency (IRENA) database in 2018, and the unit is MW.
Results and Discussion
Overal Network Stucture Analysis
The spatial correlation network diagram of environmental risks in the BRI was drawn by ArcGIS (Figure 1). The environmental risks of the BRI countries present a complex and multi-threaded network structure, and present obvious spatial contagion effects along the “One Belt and One Road” economic corridor.
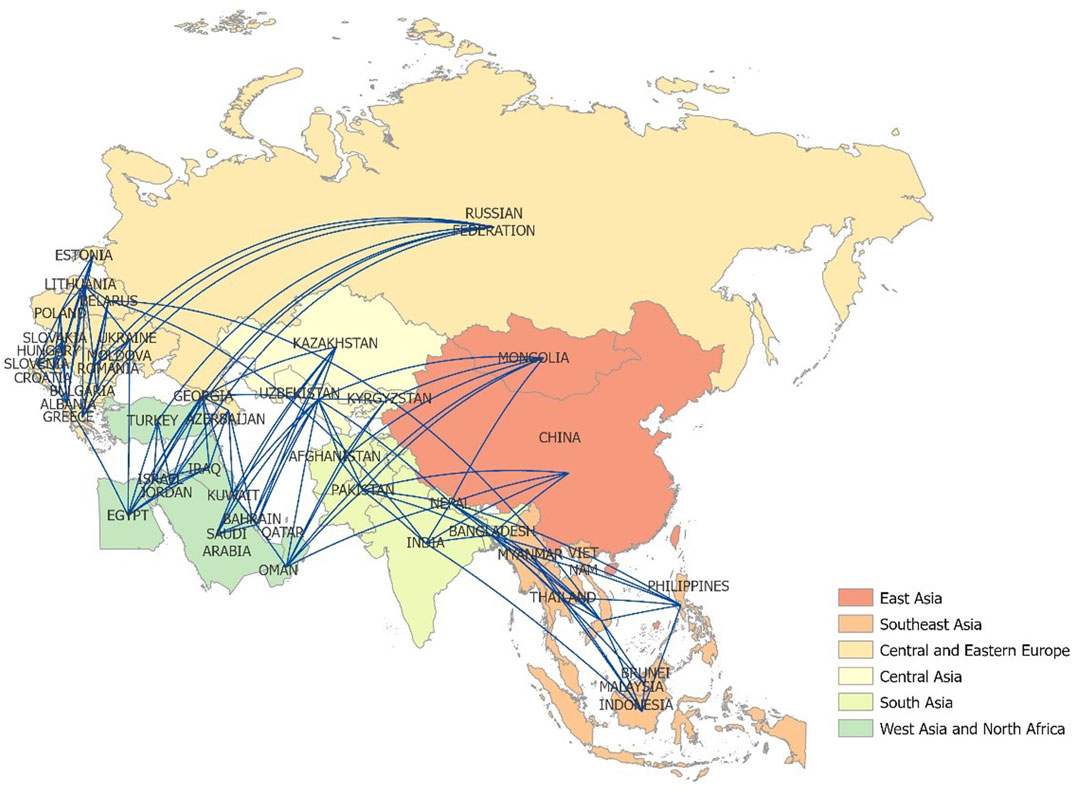
FIGURE 1. Spatial correlation network of environmental risks in the BRI.
This article used SNA to analyze the network relevance of environmental risks in the BRI. The network correlation degree was 1, indicating that the correlation degree between the countries is strong, the environmental risk contagion exists among countries, and the network structure is relatively stable. As can be seen from Figure 1, the two important main lines of environmental risk network transmission are “Belarus–Vietnam–other Southeast Asian countries” and “Belarus–India–Indonesia,” which are important paths to form the “One Belt and One Road” environmental risk network contagion structure, running through the whole Eurasian continent. In addition, the spatial network transmission routes of environmental risks on the “Silk Road Economic Belt” (China-Central Asia–Europe) and the “21st Century Maritime Silk Road” (China–Africa–Europe) are obvious. They show that the Belt and Road Initiative has played a decisive role in forming the spatial network pattern of environmental risk transmission among countries along the Silk Road. This article uses the network density to measure the tightness of the environmental risks of the BRI. With a network density of 0.093, 44 countries showed that environmental risks among the countries had certain compactness, but the compactness was low. The network rating is 0.7674, indicating the existence of a rigid hierarchical network structure. To a large extent, the environmental risk contagion is concentrated in a few countries so that these countries need to focus on the control of environmental risks. The network efficiency is 0.9048, which is relatively high with many redundant connections, indicating that the network of spatial association of environmental risks between countries is stable.
Network Centralization Analysis
Degree
The higher the degree, the higher the environmental risk contagion of these countries that will affect the surrounding countries to a greater extent. As shown in Figure 2, Uzbekistan, Nepal, Bangladesh, and Lithuania are in the highest range of degree for the following reasons.

FIGURE 2. Degree of environmental risk in the BRI.
First, in terms of economic development, these countries are all low-income or middle-low–income countries, except Lithuania (Table 2). They have a single economic structure and an extensive economic growth mode, and the investment in environmental governance is not enough. In addition, their economic development is relatively dependent on the exploitation and utilization of water, oil, and gas, and mineral resources. The insufficient environmental protection in the process of exploitation and utilization further exacerbates the ecological environment vulnerability, thereby seriously affecting the sustainable development of the region. Therefore, the countries in the highest range of degree centers have greater environmental risk contagiousness that may transmit environmental risk to other countries through various channels. Second, in terms of geographical location, these countries are the transportation hubs of the BRI and have a strong possibility to transmit environmental risks to the surrounding countries. Uzbekistan is at the center of the BRI, and Nepal and Bangladesh are adjacent. They are located in South Asia, connecting East and Southeast Asia. Lithuania is a developed country in eastern Europe, located in the heart of Europe. They are important individuals contributing to forming the spatial contagion network pattern of environmental risks along the “One Belt and One Road.”
Similarly, the countries of lower degree have lower environmental risk contagiousness in the network and will not significantly impact neighboring countries. The countries with the lowest degree are Moldova, Brunei, Malaysia, Slovak Republic, China, Belarus, Bulgaria, Estonia, and Turkey. With the exception of Moldova which is categorized as a middle-low–income country, the other countries are high-income or middle-high–income countries. High-income countries invest more in environmental governance, optimizing their industrial structure, and have a stronger ability to control environmental risks. Hence, the contagion of environmental risks is lower. Moldova is in central and eastern European with relatively poor natural resources. It is a typical energy importer which lacks hard coal, iron ore, oil, and natural gas. Therefore, its potential environmental risks are relatively small, and the possibility of environmental risk contagion is relatively low.
Closeness
As shown in Figure 3, countries at the highest range of closeness include Georgia, Uzbekistan, and Egypt, indicating that they have more direct connections with others and are prone to transmitting environmental risks to other countries while being less susceptible to be controlled and contagious from other countries. Countries with closeness at the lowest closeness include Brunei in Southeast Asia, Croatia, Slovakia, and Slovenia in central and eastern Europe, which are located at the edge of the BRI and have fewer direct connections with other countries. Thus, their environmental risks have fewer external contagion paths, and they are more vulnerable to be contagious from other countries.
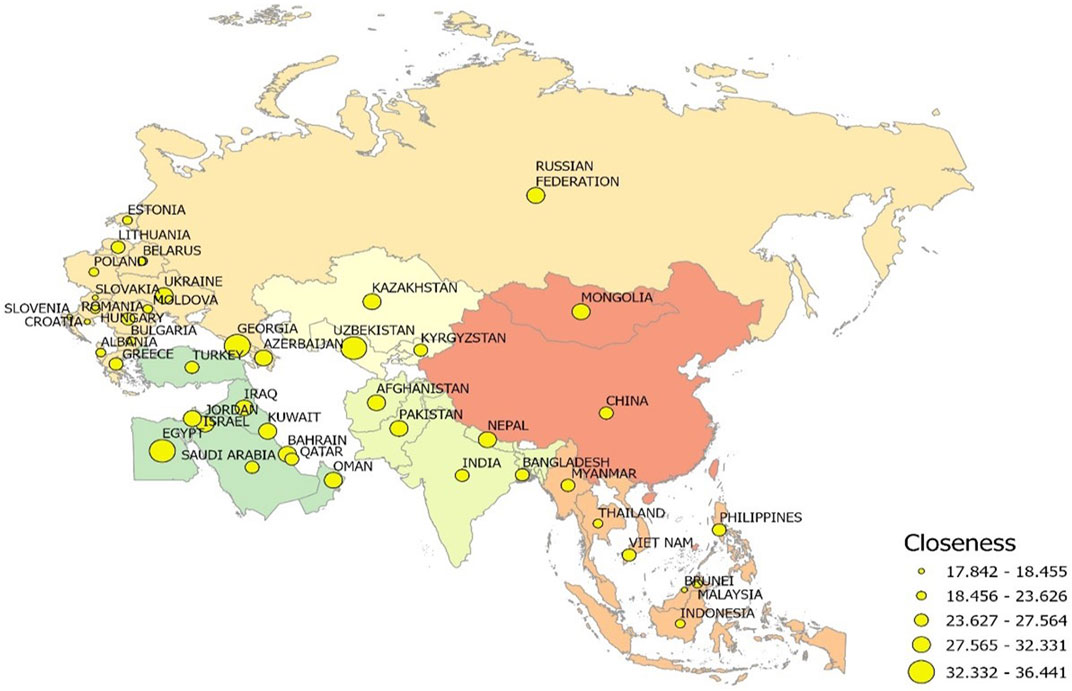
FIGURE 3. Closeness of environmental risk in the BRI.
Betweeness
Countries with higher betweeness have a stronger ability to influence other countries in the spatial correlation network of environmental risks and act as intermediaries and bridges. As shown in Figure 4, Uzbekistan, Georgia, Egypt, Ukraine, Lithuania, and Nepal have the highest betweeness, indicating that they play strong intermediary roles in the environmental risk contagion. Among them, Lithuania, Ukraine, and Georgia are located in central and eastern Europe, Uzbekistan is located in Central Asia, Egypt is located in West Asia and North Africa, and Nepal is located in South Asia. These countries with high betweeness are scattered in various regions and play the roles of intermediary contagion.
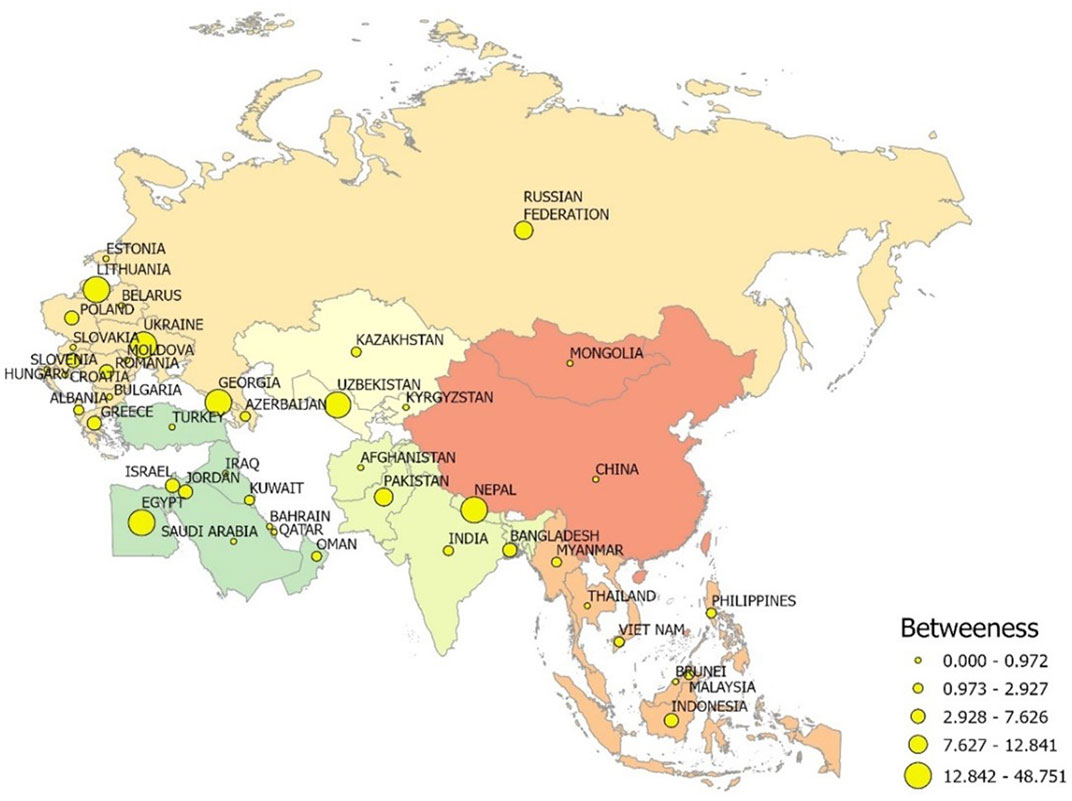
FIGURE 4. Betweeness of environmental risk in the BRI.
Countries with betweeness of 0 include China, Belarus, Brunei, Estonia, Kyrgyzstan, Moldova, Saudi Arabia, Slovak Republic, and Turkey, and they have almost no mediating effect in the network contagion of environmental risks. This indicates that they have relatively strict environmental governance and strong defense against environmental risks, and will hardly transmit environmental risks to other countries.
Block Model Analysis
The block model was used to analyze the spatial clustering characteristics of the spatial correlation network of environmental risks in the BRI. The CONCOR method was used to select the maximum depth as 2 and the concentration standard as 2. The BRI countries were divided into four sections. The results are shown in Figure 5. There are seven members in the first plate, namely, Afghanistan, Nepal, Oman, Pakistan, Mongolia, Kyrgyzstan, and Uzbekistan, which are mainly situated in South Asia, West Asia, and Central Asia. The second plate has seven members, including Qatar, Saudi Arabia, Kuwait, Bahrain, India, China, and Kazakhstan, distributed mainly in East Asia and West Asia. The third plate has 10 members, including Croatia, Lithuania, Albania, Hungary, Slovak Republic, Estonia, Belarus, Slovenia, Bulgaria, and Poland, distributed mainly in central and eastern Europe. The fourth plate has 20 members, including Azerbaijan, Greece, Israel, Bangladesh, Moldova, Brunei Darussalam, Iraq, Egypt, Jordan, Georgia, Romania, Russian Federation, Myanmar, Indonesia, Malaysia, Thailand, the Philippines, Vietnam, Turkey, and Ukraine, distributed mainly in Southeast Asia, West Asia, and central and eastern Europe. The total number of contagion relationships in the BRI is 352, the number of intra-plate relations is 139, and the number of inter-plate relations is 213, indicating that the spillover effect between plates was noticeable.
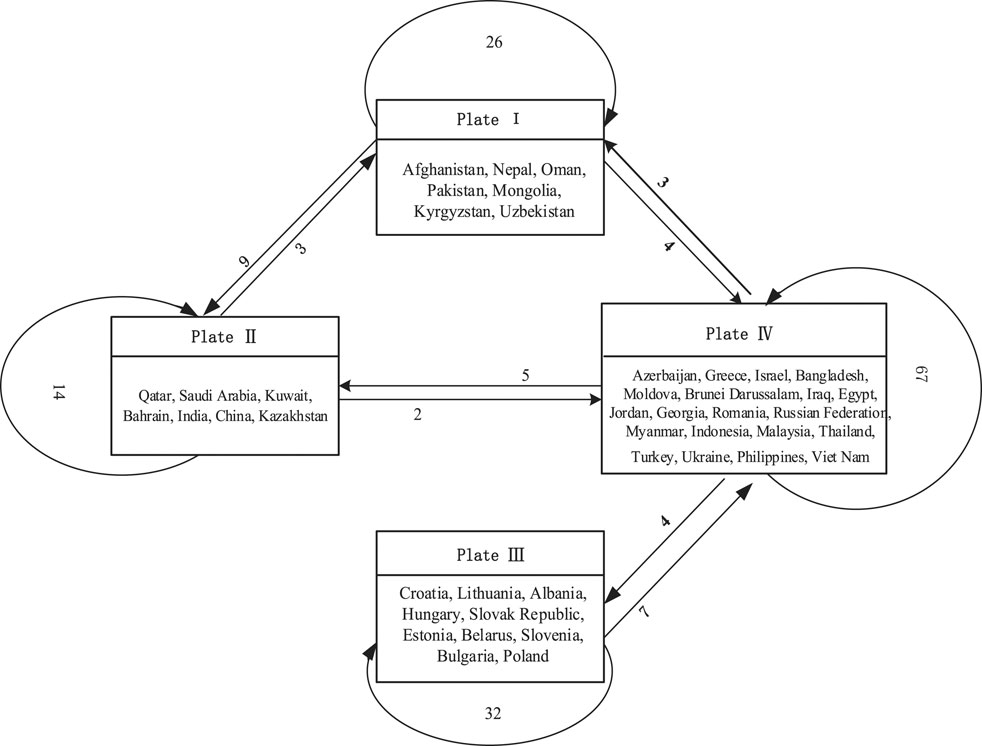
FIGURE 5. Contagion relationship of environmental risk between the four major plates.
According to the block theory model (White et al., 1976; Snyder and Kick, 1979), we divided the BRI into four plates (Table 3). The number of outgoing relations of plate I is 39, but the number of receiving relations is 32, and the number of internal relations is 26. The expected internal relation proportion is 14%, but the actual internal relation proportion is 69%. The members of this plate send more connections to other plates than they receive, which is the “net overflow” plate. The sending relation number of plate II is 19, the receiving relation number is 28, and the internal relation number is 14. The number of internal relations of this plate is less than that of external relations, so it is the “broker” plate. The sending relation number of plate III is 39, the receiving relation number is 36, and the internal relation number is 32. The sending relation number of members of this plate is also higher than the receiving relation number of other plates, and it is the “main beneficiary” plate. The sending relation number of plate IV is 79, the receiving relation number is 80, and the internal relation number is 67. The expected internal relation ratio is 44%, and the actual internal relation ratio is 85%. The actual internal relation ratio is greater than the expected internal relation ratio, so it is a “two-way overflow” plate.
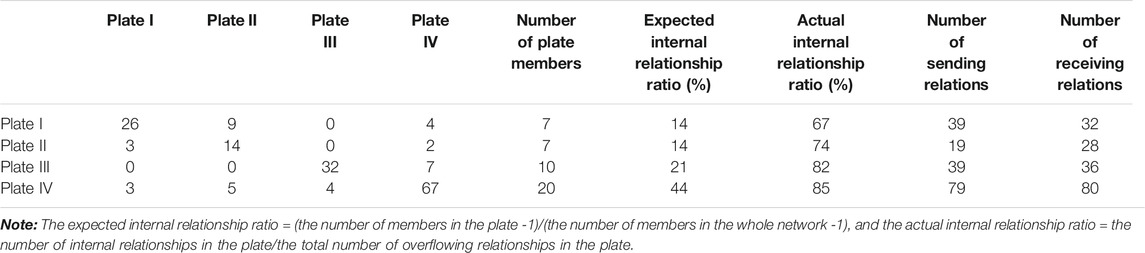
TABLE 3. Spillover effects of environmental risk contagion among four plates.
In addition, according to the distribution of the contagion relationship among environmental risk plates, this article calculates the network density matrix of each plate. If the plate density is greater than the network density which is 0.093, the value is assigned 1; otherwise, it is 0. In this way, the multivalued density matrix is transformed into an image matrix (Table 4). The probability value on the main diagonal of the image matrix is 1, indicating that the environmental risk contagion of the BRI within the plate has a significant correlation, showing an obvious “club” effect. As shown in Table 4, the spillover effect of the first plate is mainly reflected in the first and second plates, while the spillover effect on the other environmental risk plates is mainly reflected in the interior of each plate and has no significant impact on the other plates. Figure 5 shows that the engine of environmental risk is the third plate, which transmits environmental risk to the fourth plate, and the fourth plate acts as a bridge and hub.
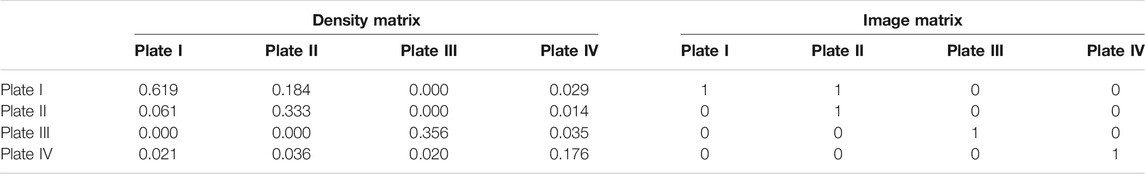
TABLE 4. Density matrix and image matrix.
Quadratic Assignment Procedure Analysis
Quadratic Assignment Procedure Correlation Analysis
Environmental risk contagion represents a kind of “relationship” between countries. All variables in the model are “relational data” and appear in the form of a matrix. Therefore, it is not possible to test whether there are mutual effects among the relational data through the conventional statistical test method. The QAP method is one of the most common methods in network analysis (Li et al., 2014). As it does not require the assumption that independent variables are independent, it is more robust than the parametric method. Based on the substitution of the matrix, QAP correlation analysis generates the correlation coefficient by comparing the similarity of each lattice value in the two square matrices and then carries out a nonparametric test on the correlation coefficient.
The UCINET software is used herein to randomly permute the matrix data 5,000 times, thus obtaining the correlation coefficient between the spatial association matrix of environmental risk contagion and other driving factors with selective random permutation 5,000 times. Minimum value and maximum value, respectively, represent the minimum and the maximum correlation coefficients obtained by the matrix permutation, and p ≥ 0 and p ≤ 0, respectively, indicate the proportion of the correlation coefficients obtained by the matrix permutation greater than or equal to and less than or equal to the actual correlation coefficient. As can be seen from Table 5, all the driving factors including geographical distance D, difference in the proportion of natural resource loss N′, difference in the proportion of particulate matter emission damage P′, difference in threatened species S′, difference in AIIB’s climate investment F′, and difference in renewable energy investment E′ are significantly correlated with the spatial contagion of environmental risks.
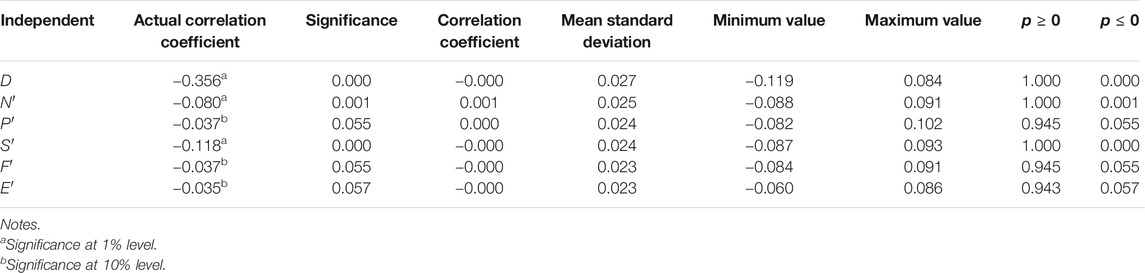
TABLE 5. QAP analysis results of environmental risk contagion and other driving factors.
Table 6 shows the correlation between the different variables in this part. Other variables have relationships with spatial adjacency relation under different significant levels; D is significantly correlated with S′ at the 1% level, P′ is also significantly correlated with F′ at the 10% level, and N′ is significantly correlated with S′ at the 10% level and E′ at the 1% level. There exists a multicollinearity problem between independent variables. To address this issue, we have applied the QAP method to study the following regression analysis.
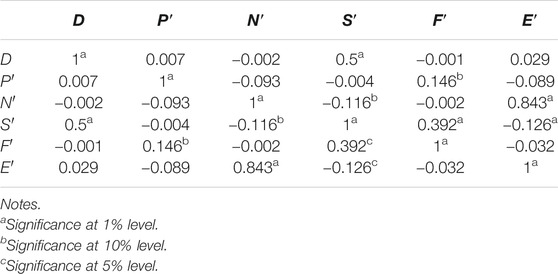
TABLE 6. Data on the relationships of driving factors using the QAP method.
Quadratic Assignment Procedure Regression Analysis
QAP regression analysis is used to investigate the regression relationship between multiple independent variable matrices and one dependent variable matrix. According to the QAP correlation analysis results, the five driving factors with significant correlation coefficients are selected as the independent variables for QAP regression analysis. Then, the UCINET software is used to randomly permute the data 2000 times, and the QAP regression results are obtained, as shown in Table 7. Since the QAP regression is based on matrix permutation to perform the test, normal standard errors cannot be obtained (Peoples and Sutton, 2015). The regression coefficients of the relation matrix variables and their significance test results are analyzed as follows. The absolute regression coefficients are significant except P′; the significance levels of D, N′, S′, and E′ are at 1% level, and the significance level of F is at 5% level. The regression coefficients of D, N′, F′, and E′ were negatively significant.
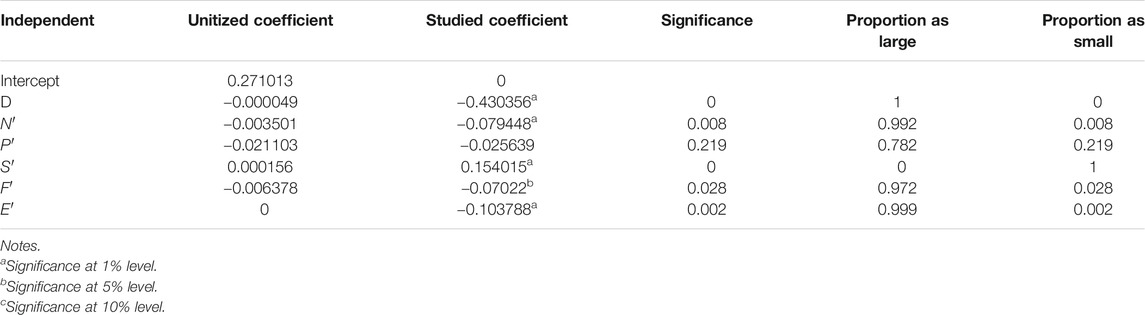
TABLE 7. QAP regression analysis of each variable matrix.
Geographical distance significantly decreases the contagion of environmental risk among countries. The farther the geographical distance, the lower the possibility of the environmental risk contagion among countries.
The greater the difference in loss of natural resources, the smaller the environmental risk contagion. If the loss of natural resources in a country is lower than that in other countries, the stronger ability will the country own to control environmental risks, and the less likely it is to transmit risks to other countries or be transmitted from other countries.
The greater the difference in threatened species, the greater the environmental risk contagion, that is, the more the threatened species in one country relative to other countries, the more serious the destruction of biodiversity, and the more likely it is to transmit the risks to other countries.
Climate investment difference is significantly negatively correlated with environmental risk contagion. The greater the climate investment difference, that is, the more the climate investment one country receives relative to other countries, the more the funds will be used to tackle climate change, the less likely it is to transmit risks to other countries or be transmitted from other countries.
Particulate matter emission damage difference is insignificant for environmental risk contagiousness. The possible reason is that the environmental pollutants such as PM2.5 show significant spatial autocorrelation and spatial spillover effects in the BRI countries (Fang et al., 2020). Particulate matter emissions as environmental pollution source have produced spatial spillover effect before they resulted in environmental risk, so the contagion effect of environmental risk is weakened.
Energy transformation difference is significantly negatively correlated with environmental risk contagiousness. The greater the difference in the energy transformation, the greater the degree of energy transformation in the country than that in other countries, and the smaller the environmental risk contagion between the two countries. This indicates that the countries with the greater energy transformation and upgrading have the stronger ability to resist the environmental risk and will not be affected by other countries. Moreover, the lower the level of environmental risk within a country, the less likely it is to transmit the risks to other countries.
Conclusion and Policy Recommendations
Conclusion
The environmental risks among the BRI countries present a complex and multi-threaded network structure with strong spatial correlation and a stable network structure. The Belt and Road Initiative has played an important role in the formation of the spatial network pattern of the environmental risk contagion in countries along the Silk Road Economic Belt (China–Central Asia–Europe) and the 21st Century Maritime Silk Road (China–Africa–Europe). The spatial network contagion paths of environmental risk are obvious.
The environmental risk of the BRI has a strict hierarchical network structure, and the environmental risk contagion was concentrated in a few countries to a large extent that these countries need to focus on controlling environmental risk. The degree of Uzbekistan, Nepal, Bangladesh, and Lithuania is in the highest range. Compared with other countries in the network, the environmental risk contagious of these countries is higher, which will affect the surrounding countries to a large extent. Uzbekistan, Georgia, Egypt, Ukraine, Lithuania, and Nepal have the highest degree of betweeness, which played intermediary roles in the environmental risk contagion and have strong ability to influence the environmental risks of other countries.
According to the block model, the spatial clustering characteristics of environmental risk contagiousness of the countries along the “One Belt and One Road” route were analyzed and divided into four plates. The countries of different plates play different roles in the spacial network contagion of environmental risks. The spillover effect of the first plate is reflected mainly in the first plate and the second plate, while the spillover effect of other environmental risk plates is reflected mainly in the interior of each plate. The engine of environmental risk is the third plate, which transmits environmental risk to the fourth plate, and the fourth plate acts as an obvious bridge and hub.
The environmental risk contagion relationship of the BRI is significantly negatively correlated with geographical distance, differences in natural resource loss, differences in particular matter emission damage, differences in climate investment, and differences in energy transition. It was significantly positively correlated with differences in threatened species.
The limitations and future works of the article are as follows. First, the data in this article are cross-sectional data, which makes it impossible to do time series analysis. Second, this paper only aims to analyze the overall situation of “environmental risk contagion” between countries, and lack of country-by-country analysis. It’s difficult to analyze all aspects in a single study, the following research may further analyze the influence mechanism of the environmental risk level of the BRI countries.
Policy Recommendations
The Belt and Road Initiative has played an important role in the formation of the spatial network structure of the environmental risk contagion. While strengthening environmental governance and striving to reduce their environmental risks, the countries should strengthen collaborative governance, reduce ecological and environmental risks, prevent environmental risk contagion, so as to achieve the green silk road. From the analysis of this article, it can be concluded that reducing a country’s environmental risk loss and strengthening the ability of environmental risk defense can effectively prevent the environmental risk contagion from other countries. Therefore, we put forward the following suggestions for reducing the contagion of environmental risks among the BRI countries.
Strict environmental systems and strong environmental regulation can reduce the environmental risk and improve the ability to resist the environmental risk contagion effectively. Stricter environmental regulations should be formulated, especially for the countries in the BRI’s transport hub, with high betweeness that play the role of the intermediary contagion. Green trade barriers should be strengthened, such as adding “green labels” to products, to achieve green production and consumption from the upstream and downstream in the trade.
The loss of natural resources is one of the driving factors of the environmental risk contagion that include forest loss, energy loss, and mineral resource loss. Therefore, the countries should expand the forest area to enhance the ecological environment’s self-repair ability and carbon storage ability, and provide a suitable living environment for biodiversity. In the process of mining mineral resources, attention should be paid to protect the environment and take rational exploitation. The BRI should further increase investment in developing renewable energy by taking advantages of the geographical resources of various countries to reduce greenhouse gas emissions.
The BRI should attach great importance to protect biodiversity. As the BRI includes 27 of the 35 globally recognized biodiversity hotspots, biodiversity conservation needs to be considered as an important aspect of high-quality development in the BRI. The investment in biodiversity hotspots must take green development into consideration with the active implementation of the Convention on Biological Diversity (CBD) to avoid increasing environmental risks due to excessive investment and consumption.
Climate investment from AIIB should be increased more, especially for low-income countries. The BRI should leverage the role of the assistance fund for South-South cooperation, strengthen climate change projects, and promote energy transformation and upgrading. The BRI also can improve the green financial system and encourage more financial institutions to participate in green investments such as renewable energy.
Data Availability Statement
The original contributions presented in the study are included in the article/Supplementary Materials; further inquiries can be directed to the corresponding author.
Author Contributions
LL: conceptualization, methodology, formal analysis, writing original draft and editing. KF: writing - review and editing. CL: writing - review and editing. CS: draw graph by ArcGis and editing.
Funding
This work has received support from the UK-China Cooperation on Climate Change Risk Assessment (PF3051_CH-WS3HBUE) and the Project of Excellent Young and Middle-aged Scientific and Technological Innovation Team in colleges and universities of Hubei Province (T201917).
Conflict of Interest
The authors declare that the research was conducted in the absence of any commercial or financial relationships that could be construed as a potential conflict of interest.
Publisher’s Note
All claims expressed in this article are solely those of the authors and do not necessarily represent those of their affiliated organizations, or those of the publisher, the editors and the reviewers. Any product that may be evaluated in this article, or claim that may be made by its manufacturer, is not guaranteed or endorsed by the publisher.
References
Ascensão, F., D'Amico, M., and Barrientos, R. (2019). Validation data is needed to support modelling in road ecology. Biol. Conservation 230, 199–200. doi:10.1016/j.biocon.2018.12.023
Bai, C., Zhou, L., Xia, M., and Feng, C. (2020). Analysis of the spatial association network structure of China's transportation carbon emissions and its driving factors. J. Environ. Manage. 253, 109765. doi:10.1016/j.jenvman.2019.109765
Benítez-Andrades, J. A., García-Rodríguez, I., Benavides, C., Alaiz-Moretón, H., and Labra Gayo, J. E. (2020). An ontology-based multi-domain model in social network analysis: Experimental validation and case study. Inf. Sci. 540, 390–413. doi:10.1016/j.ins.2020.06.008
Borgatti, S. P., Mehra, A., Brass, D. J., and Labianca, G. (2009). Network Analysis in the Social Sciences. Science 323 (323), 892–895. doi:10.1126/science.1165821
Caldecott, B., Tilbury, J., and Carey, C. (2014). Stranded Assets and Scenarios. Oxford, United Kingdom: University of Oxford.
Cantore, N., and Cheng, C. F. C. (2018). International trade of environmental goods in gravity models. J. Environ. Manage. 223, 1047–1060. doi:10.1016/j.jenvman.2018.05.036
Copeland, B. R., and Taylor, M. S. (2003). Trade, Growth and the Environment. J. Econ. Lit. 42 (1), 7–71. Working papers. doi:10.3386/w9823
D'Orazio, P., and Popoyan, L. (2019). Fostering green investments and tackling climate-related financial risks: which role for macroprudential policies? SSRN J. 160 (JUN), 25–37. doi:10.2139/ssrn.3106350
Dasgupta, P., and McKenzie, E. (2020). The Dasgupta Review - Independent Review on the Economics of Biodiversity Interim Report. Available at: https://www.researchgate.net/publication/346629601_The_Dasgupta_Review__Independent_Review_on_the_Economics_of_Biodiversity_Interim_Report (Accessed January 30, 2021).
Dong, S., Li, Z., Li, Y., Shi, G., Yu, H., Wang, J., et al. (2015). Resources, Environment and Economic Patterns and Key Scientific Issues of the Silk Road Economic Belt. Am. J. Polit. Sci. 47 (3), 389–402. doi:10.1101/lm.1480309
Fang, K., Wang, S., He, J., Song, J., Fang, C., and Jia, X. (2021). Mapping the environmental footprints of nations partnering the belt and road initiative. Resour. Conservation Recycling 164, 105068. doi:10.1016/j.resconrec.2020.105068
Fang, K., Wang, T., He, J., Wang, T., Xie, X., Tang, Y., et al. (2020). The distribution and drivers of PM2.5 in a rapidly urbanizing region: The Belt and Road Initiative in focus. Sci. Total Environ. 716, 137010. doi:10.1016/j.scitotenv.2020.137010
Farhani, S., and Shahbaz, M. (2014). What role of renewable and non-renewable electricity consumption and output is needed to initially mitigate CO2 emissions in MENA region?. Renew. Sust. Energ. Rev. 40, 80–90. doi:10.1016/j.rser.2014.07.17010.1016/j.rser.2014.07.170
Freeman, L. C. (2004). The Development of social network Aanalysis: A study in the social networks. Vancouver, BC Canada: Empirical Press.
Greenpeace (2017). Sustainability should be priority for China's Belt and Road-Greenpeace. Available online. http://www.greenpeace.org/eastasia/press/releases/others/2017-/Sustainability-should-be-priority-forChinas-Belt-and-Road–Greenpeace.
Han, M., Yao, Q., Liu, W., and Dunford, M. (2018). Tracking Embodied Carbon Flows in the Belt and Road Regions. J. Geogr. Sci. 28 (9), 1263–1274. doi:10.1007/s11442-018-1524-7
Hu, T., and Yang, D.WWF-US. (2018). Constructing sustainable trade under the background of a community of shared future for mankind: Promoting UN SDGs by sustainable trade. J. Environ. Econ. 3 (1), 139–149. doi:10.19511/j.cnki.jee.2018.01.009
Huang, Y. (2019). Environmental risks and opportunities for countries along the belt and road: location choice of China's investment. J. Clean. Prod. 211 (FEB.20), 14–26. doi:10.1016/j.jclepro.2018.11.093
Kuik, O., and Hofkes, M. (2010). Border adjustment for European emissions trading: competitiveness and carbon leakage. Energy Policy 38 (4), 1741–1748. doi:10.1016/j.enpol.2009.11.048
Leadership (2017). ‘Enhancing environmental risk assessment in financial decision-making.’ Background Paper for the G20 Green Finance Study Group. Available online at: http://www.pbc.gov.cn/goutongjiaoliu/113456/113469/3344238/2017071318341876206.pdf.
Lenzen, M., Moran, D., Kanemoto, K., Foran, B., Lobefaro, L., and Geschke, A. (2012). International trade drives biodiversity threats in developing nations. Nature 486 (7401), 109–112. doi:10.1038/nature11145
Li, H., Jiang, W., and Tang, Z. (2020). Net embodied carbon flow network in global trade and community finding analysis. Resour. Sci. 42 (6), 1027–1039. doi:10.18402/resci.2020.06.02
Li, J., Chen, S., Wan, G., and Fu, C. (2014). Study on the spatial correlation and explanation of regional economic growth in China: Based on analytic network process. Econ. Res. J. 11, 4–16. CNKI:SUN:JJYJ.0.2014-11-002.
Li, X., Yang, X., and Wang, Y. (2016). Does international trade improve the carbon productivity in China's manufacturing?. J. Environ. Econ. 1 (2), 8–24.
Liu, H. J., Liu, C. M., Sun, Y. N., and Economics, S. O. (2015). Spatial correlation network structure of energy consumption and its effect in China. China Ind. Econ. 326 (5), 86–95. doi:10.19581/j.cnki.ciejournal.2015.05.008
Liu, S., and Xiao, Q. (2021). An empirical analysis on spatial correlation investigation of industrial carbon emissions using SNA-ICE model. Energy 224, 120183. doi:10.1016/j.energy.2021.120183
Ma, Z. (2016). President Xi Calls for Building 'green, Healthy, Intelligent and Peaceful Silk Road. Available online http://www.scio.gov.cn/32618/Document/1481477/htm.
McClure, C. J. W., Westrip, J. R. S., Johnson, J. A., Schulwitz, S. E., Virani, M. Z., Davies, R., et al. (2018). State of the world's raptors: Distributions, threats, and conservation recommendations. Biol. Conservation 227, 390–402. doi:10.1016/j.biocon.2018.08.012
Meng, B., Peters, G., and Wang, Z. (2016). Tracing China's CO2 emissions in global value chains. Environ. Economy Res. 1 (1), 139–149. doi:10.19511/j.cnki.jee.2016.01.002
MOFCOM (2017). Guidance on Promoting Green Belt and Road. (Ministry of Commerce of the People's Republic of China). Available online at: https://www.yidaiyilu.gov.cn/wcm.files/upload/CMSydylgw/201705/201705161104041.pdf.
Mudakkar, S. R., Zaman, K., Khan, M. M., and Ahmad, M. (2013). Energy for Economic Growth, Industrialization, Environment and Natural Resources: Living with just Enough. Renew. Sust. Energ. Rev. 25, 580–595. doi:10.1016/j.rser.2013.05.024
Peoples, C. D., and Sutton, J. E. (2015). Congressional bribery as state-corporate crime: a social network analysis. Crime L. Soc Change 64 (2-3), 103–125. doi:10.1007/s10611-015-9584-4
Reilly, W. J. (1929). Methods for the Study of Retail Relationships. Austin, TX: University of Texas.
Salvati, L., and Marco, Z. (2008). Natural Resource Depletion and Economic Performance ofLocal Districts: Suggestions from Within Country Analysis. J. Sust. Dev. World Ecol. 15 (6), 518–523. doi:10.1080/13504500809469847
Scott, J. P., and Carrington, P. J. (2011). The sage handbook of social network analysis. New York: Sage Publication.
Shahbaz, M., Hye, Q. M. A., Tiwari, A. K., and Leitão, N. C. (2013). Economic Growth, Energy Consumption, Financial Development, International Trade and CO2 Emissions in Indonesia. Germany: MPRA Paper.
Sheehan, P., Cheng, E., English, A., and Sun, F. (2014). China's response to the air pollution shock. Nat. Clim Change 4 (5), 306–309. doi:10.1038/nclimate2197
Silver, B., Reddington, C. L., Arnold, S. R., and Spracklen, D. V. (2018). Substantial changes in air pollution across China during 2015-2017. Environ. Res. Lett. 13 (11), 114012. doi:10.1088/1748-9326/aae718
Snyder, D., and Kick, E. L. (1979). Structural position in the world system and economic growth, 1955-1970: A multiple-network analysis of transnational interactions. Am. J. Sociol. 84 (5), 1096–1126. doi:10.1086/226902
Torinelli, V. H., and Silva Júnior, A. F. d. A. d. (2021). Environmental risk analysis (era) in the strategic asset allocation (saa) of the international reserves (irs) managed by central banks (cbs). Latin Am. J. Cent. Banking 2 (3), 100021. doi:10.1016/j.latcb.2021.100021
Tracy, E. F., Shvarts, E., Simonov, E., and Babenko, M. (2017). China's new Eurasian ambitions: the environmental risks of the Silk Road Economic Belt. Eurasian Geogr. Econ. 58, 56–88. doi:10.1080/15387216.2017.1295876
Wasserman, S., and Faust, K. (1994). Social network analysis: Methods and applications. Cambridge, UK: Cambridge University Press. doi:10.1017/cbo9780511815478
White, H. C., Boorman, S. A., and Breiger, R. L. (1976). Social Structure from Multiple Networks. United Kingdom: Oxford University Press.
Wolfe, A. W. (1995). Social network analysis: methods and applications. Contemp. Sociol. 91 (435), 219–220. doi:10.2307/2077235
Wu, P.-C., Liu, S.-Y., Hsiao, J.-M., and Huang, T.-Y. (2016). Nonlinear and time-varying growth-tourism causality. Ann. Tourism Res. 59 (Jul), 45–59. doi:10.1016/j.annals.2016.04.005
Xiao, B. (2019). Environmental risks of outward investment in BRI countries and China’s legal countermeasures. Int. Forum. doi:10.7176/JESD/11-16-04
Yang, Y., and Li, C. (2019). Green governance innovation against eco-environmental risks of the Belt and Road Initiative - A case study of Lancang-Mekong River Subregion. Probe 35, 184–193. doi:10.16501/j.cnki.50-1019/d.2019.05.020
Yao, Q. H., Han, M. Y., and Liu, W. D. (2018). Tracking embodied carbon flows in the belt and road regions. Acta Geographica Sinica 28 (9), 1263–1274. doi:10.1007/s11442-018-1524-7
Yin, C., Gu, H., and Zhang, S. (2020). Measuring technological collaborations on carbon capture and storage based on patents: A social network analysis approach. J. Clean. Prod. 274, 122867. doi:10.1016/j.jclepro.2020.122867
Yu, Z., and Di, Q. (2020). The coordination between maritime economies and marine carrying capacity and their spatiotemporal evolution in the cities of the bohai rim in China. Ecol. Model. 438, 109192. doi:10.1016/j.ecolmodel.2020.109192
Keywords: green silk road, environmental risk contagion, SNA, QAP, the gravity model, climate investment, energy transformation
Citation: Lu L, Fang K, Liu CM and Sun C (2021) The Spatial Network Contagion of Environmental Risks Among Countries Along the Belt and Road Initiative. Front. Environ. Sci. 9:721408. doi: 10.3389/fenvs.2021.721408
Received: 07 June 2021; Accepted: 07 July 2021;
Published: 05 August 2021.
Edited by:
Tsun Se Cheong, Hang Seng University of Hong Kong, ChinaReviewed by:
Ya Zhou, Guangdong University of Technology, ChinaXianchun Liao, University of Jinan, China
Copyright © 2021 Lu, Fang, Liu and Sun. This is an open-access article distributed under the terms of the Creative Commons Attribution License (CC BY). The use, distribution or reproduction in other forums is permitted, provided the original author(s) and the copyright owner(s) are credited and that the original publication in this journal is cited, in accordance with accepted academic practice. No use, distribution or reproduction is permitted which does not comply with these terms.
*Correspondence: Ling Lu, bHlubmx1Njk5QDEyNi5jb20=