 Julie A. Peeling
 Aditya Singh
 Jasmeet Judge
- Center for Remote Sensing, Agricultural and Biological Engineering Department, Institute of Food and Agricultural Sciences, University of Florida, Gainesville, FL, United States
Land cover (LC) change is an integrative indicator of changes in ecosystems due to anthropogenic or natural forcings. There is a significant interest in the investigation of spatio-temporal patterns of LC transitions, and the causes and consequences thereof. While the advent of satellite remote sensing techniques have enhanced our ability to track and measure LC changes across the globe, significant gaps remain in disentangling specific factors that influence, or in certain cases, are influenced by, LC change. This study aims to investigate the relative influence of regional-scale bioclimatology and local-scale anthropogenic factors in driving LC and environmental change in Ghana. This analysis builds upon previous research in the region that has highlighted multiple drivers of LC change in the region, especially via drivers such as deforestation, urbanization, and agricultural expansion. It used regional-scale remotely sensed, demographic, and environmental data for Ghana across 20 years and developed path models on causal factors influencing LC transitions in Ghana. A two-step process is utilized wherein causal linkages from an exploratory factor analysis (EFA) are constrained with literature-based theoretical constructs to implement a regional-scale partial least squares path model (PLSPM). The PLSPM reveals complex interrelationships among drivers of LC change that vary across the geography of Ghana. The model suggests strong effects of local urban expansion on deforestation and vegetation losses in urban and peri-urban areas. Losses of vegetation are in turn related to increases in local heating patterns indicative of urban heat island effects. Direct effects of heat islands are however masked by strong latitudinal gradients in climatological factors. The models confirm that decreases in vegetation cover results in increased land surface albedo that is indirectly related to urban and population expansion. These empirically-estimated causal linkages provide insights into complex spatio-temporal variations in potential drivers of LC change. We expect these models and spatial data products to form the basis for detailed investigations into the mechanistic underpinnings of land cover dynamics across Ghana. These analyses are aimed at building a template for methods that can be utilized to holistically design spatially-disaggregated strategies for sustainable development across Ghana.
1 Introduction
Patterns of land cover change (LCC) are often integrative indicators of climatic, environmental, and anthropogenic effects across the globe. While factors influencing LCC include changes in environmental conditions, anthropogenic forcings often promote unstable ecological regimes and disruptions in natural processes that exacerbate LCC (Lambin et al., 2003). Drivers of LCC may therefore be difficult to measure and assess as they represent complex interactions of many different forcings. There is therefore considerable interest in studying the intersections between environmental, socioeconomic, and climatic data as causes or consequences of LCC. For example, changes in land cover (LC) have been found to be correlated to measurable indicators such as erosion, population expansion, industrial growth, surface heating, and soil quality (Teuling et al., 2010; Kuenzer et al., 2014; Rahaman et al., 2020). Direct human activity, such as increased agricultural land use, has been a significant component of change throughout history in natural LC dynamics (Malhi et al., 2013; Lewis et al., 2015; Addo-Fordjour and Ankomah, 2017). In turn, shifting land dynamics are influential in altering anthropogenic characteristics such as culture, economics, and urban expansion (Owusu, 2009; Edusah, 2011; Frondoni et al., 2011). Although governments have often created protective policies in an attempt to preserve environmental stability, a lack of enforcement and the continuation of illegal activity strains these boundaries (Nang, 2016; Kyere-Boateng and Marek, 2021). Ecologically detrimental practices have been a complicated problem to address, in part due to difficulties in identifying definitive long-term consequences of these interferences (Frondoni et al., 2011; Malhi et al., 2013).
Technological and methodological advances in remote sensing techniques have helped close this knowledge gap. Using satellite data, LC trends have been examined to investigate how regions have undergone environmental modifications and been influenced by human activities (Enaruvbe and Atafo, 2016) (Kleemann et al., 2017a). As population growth and anthropogenic developments have escalated over time, many studies have focused on identifying ecological changes, such as within climate and vegetation, that occur with the expansion of urban LC classes (Kleemann et al., 2017b; Asabere et al., 2020; Nyamekye et al., 2020). The large amounts of natural resources required by rapid industrial growth has placed significant demands on the environment that advances LCC beyond natural shifts (Yiran et al., 2012; Kuenzer et al., 2014; Mensah et al., 2019; Sedano et al., 2020). The methods used to acquire these materials also create disturbances within LC dynamics (Alo and Pontius, 2008; Kusimi, 2008; Tutu Benefoh et al., 2018).
Remote sensing techniques have also been used to capture specific environmental indicators and investigate how they follow LC patterns (Jamali et al., 2015; Liu et al., 2017; Rahaman et al., 2020; Chowdhury et al., 2021). Time-series data on vegetative growth has been used to demonstrate the importance of LC conditions on plant productivity (Haile et al., 2019). Rahaman et al., 2020 used remotely sensed measures including land surface temperature (LST), leaf area index (LAI), and normalized difference vegetation index (NDVI) to demonstrate the susceptibility of the environment to these variables involved in LCC. Environmental indicators such as NDVI, rainfall, and temperature gathered through remote sensing were used to predict future land degradation risk zones in Ghana (Mensah et al., 2015). Remote sensing methods have also been utilized to generate LC maps of various regions and time periods, furthering our knowledge of what drives landscape dynamics at large scales (Hackman et al., 2017; Boryan et al., 2011; Masiliūnas et al., 2021). Historical maps of previous LC classes provide base knowledge of past environmental dynamics (Bodart et al., 2013; Spruce et al., 2020). Maps of LCC can also be generated for the purpose of investigating temporal patterns occurring in various LC classes (Fry et al., 2011; Vittek et al., 2013; Bicudo da Silva et al., 2020; Calderón-Loor et al., 2021).
Detecting LCC is especially important in environmentally sensitive nations whose policy-making has the potential to significantly impact their future ecological state and the well being of their populations. This is especially true for regions where regular cloud cover limits the availability of viable satellite data (Hackman et al., 2017). Gaps in satellite coverage often result in information misinterpretations or incomplete characterization of ecological variables. However, modern developments have incorporated algorithms that remove or reduce cloud cover interference from the satellite images to provide clearer data (Lossou et al., 2019).
While previous studies have provided vital information on relationships between the environment, human activity, and LCC, most research has focused largely on correlative analyses of remote sensing-based proxies with measured changes. A lack of the understanding of causal connections of LCC is still a major gap. This study aims to combine socio-ecological and remotely sensed data to determine potential causal linkages between these variables, which are measurable data used in the study, and LC trends. Specific objectives include: 1) assessing spatial patterns of long-term regional-scale environmental and socio-ecological changes using satellite imagery, climate data, and socio-demographic datasets; 2) identifying underlying structural characteristics that explain the linkages between socio-ecological and environmental variables; and 3) utilizing a structural modeling approach to determine causal relationships between regional-scale patterns of landscape, demographic, and environmental change. The methodology is implemented in Ghana, which has undergone significant LCC in recent decades, especially with respect to anthropogenic agents such as urbanization and deforestation (Hackman et al., 2017).
2 Methods
2.1 Study Area and Datasets
Ghana is a West African nation bordering Togo to the East, Cote d’Ivoire to the West, and Burkina Faso to the North, and bound to the South by the Atlantic Ocean (Figure 1). Ghana measures ca. 240,000 km2, and is representative of a diversity of terrain and landscapes, including savannas, forests, wetlands, and mountains (Hackman et al., 2017). Ghana has a tropical climate with precipitation ranging from 900 to 2000 mm during the months of April-June in the South and April-November in the North (World Bank Group, 2020). Forest cover (21.7%) in Ghana displays a marked North-to-South gradient, with most forests concentrated in the South (Butler, 2020). Ghana’s LC primarily consists of agriculture (65.0%), while urban LC and protected areas make up around 16.8 and 15.5% of the region, respectively. Ghana’s reported population is around 30 million people (2019), with an estimated 2.15% annual growth.
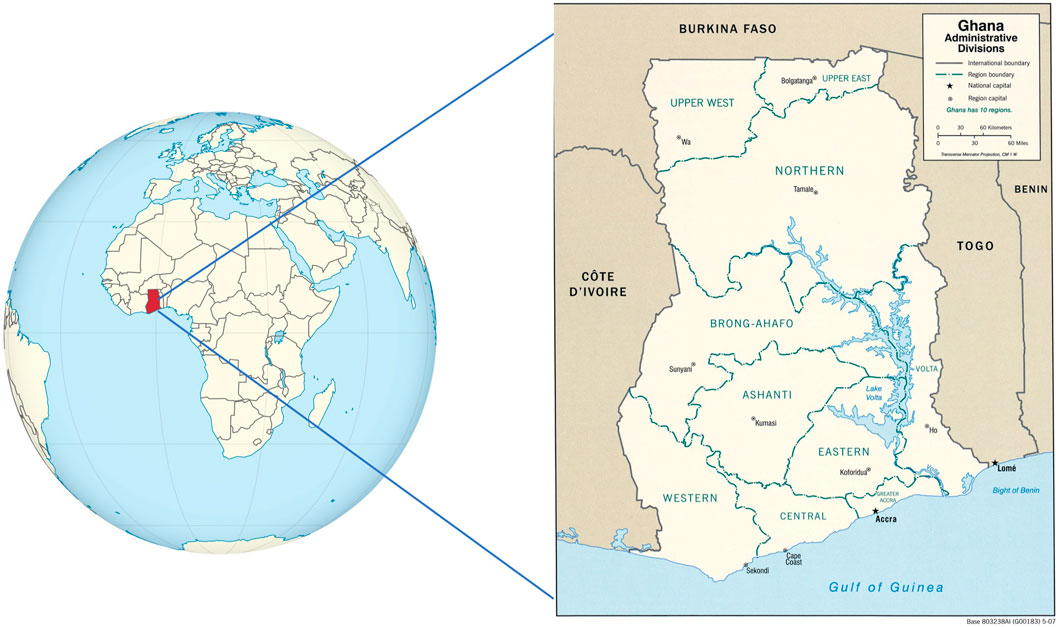
FIGURE 1. Ghana, location within the larger West African region, major cities, and regional borders.
Ghana’s land use has undergone significant changes in recent decades, with anthropogenic influence being an important driver (Hackman et al., 2017). For example, in recent decades, Ghana has experienced significant deforestation due to mining activities, lumber extraction, and agricultural intensification (Alo and Pontius, 2008). Ghana is also rapidly urbanizing, with direct links to reductions in urban open spaces, loss of vegetation, and stresses on water resources (Kleemann et al., 2017b; Asabere et al., 2020). Recent research in the region has established connections between agricultural change with indicators such as soil quality, population density, and road networks (Braimoh and Vlek, 2005). LC transitions in Ghana have also been linked to changes in climatic and land surface conditions in Ghana (Ghartey-Tagoe et al., 2020). A map of current LC classes across Ghana is presented in Figure 2.
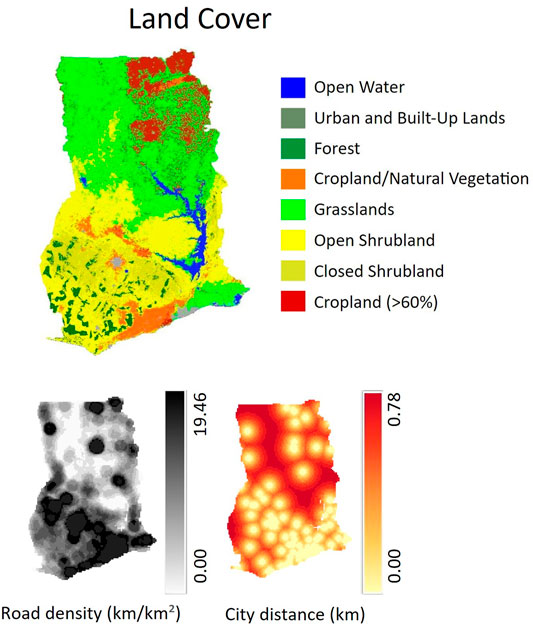
FIGURE 2. MODIS land cover (2019), spatial variations in road density and proximity to major urban centers. Data sources are presented in Table 1.
This study combined remotely sensed data with environmental and anthropogenic variables (Table 1) to disentangle the spatio-temporal relationships between land surface dynamics with changes in these variables. The Google Earth Engine (GEE) cloud platform was the primary platform for curating and pre-processing all geospatial data in this study. All data obtained from GEE were retrieved using high-quality QA bits and scaled to a uniform resolution of 5 km. Coarse-scale data were linearly down-sampled and fine-scale data were up-sampled through linear averaging. For assessing spatio-temporal trends, linear regressions to pixels across the entire area of Ghana were conducted over a 20-year period, from 2000 to 2020, except for night lights and forest cover data, which were available over 11 and 15 years, respectively, as shown in Table 1. The temporal coverage varies slightly due to the multi-source nature of the dataset, but the data were processed for maximized consistency and all trends were considered on an annual scale. Slopes estimated from the regression were used as indicators of long-term trends in temporal variables (e.g., NDVI, temperature, precipitation) on a pixel-wise basis. Long-term means of each temporal dataset were calculated to represent average conditions across the region. Reducing the multi-temporal dataset to slopes minimizes temporal noise, identifies secular trends, and provides a spatial representation of the pattern of changes over time. On the other hand, estimates of means provide time-integrated indicators of the long-term steady-state conditions of the landscape. Combined, the means and slopes help compare and contrast the steady-state with secular changes to provide a richer representation of landscape dynamics across this diverse landscape. Figures 3–5 show the means and slopes of vegetative, biophysical, and climatic and landscape variables, respectively. In addition to the above datasets, road density was scaled to 5 km with a moving window approach and included in the analysis (see Figure 2). Distance to cities was also added as a variable. These static variables were included in the analysis to provide spatial references to variables in combination with discovered trends.
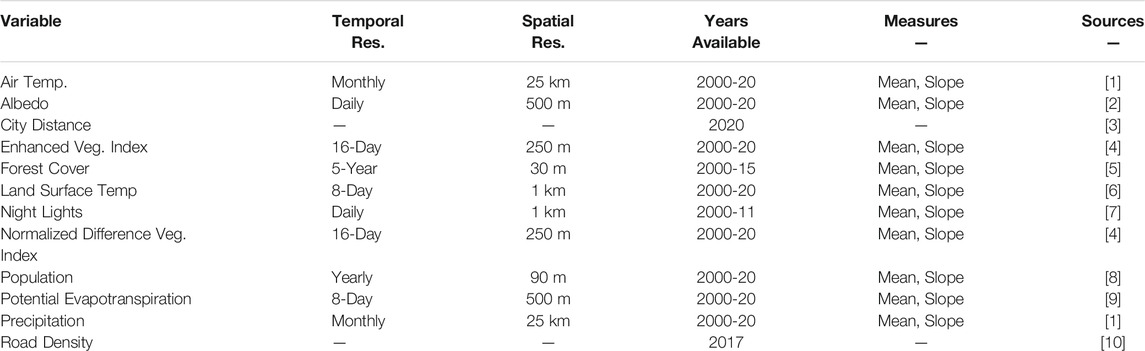
TABLE 1. The comprehensive remote sensing, environmental, and socio-economic datasets used in this study. [1] = Hersbach et al., 2021; [2] = Schaaf and Wang, 2021; [3] = Sahel and West Africa Club, 2020; [4] = Didan, 2021; [5] = Townshend, 2016; [6] = Wan et al., 2015; [7] = Earth Observation Group Payne Institute for Public Policy Colorado School of Mines, 2011; [8] = Linard et al., 2021; [9] = Running et al., 2021 [10] = OpenStreetMap contributors, 2017.
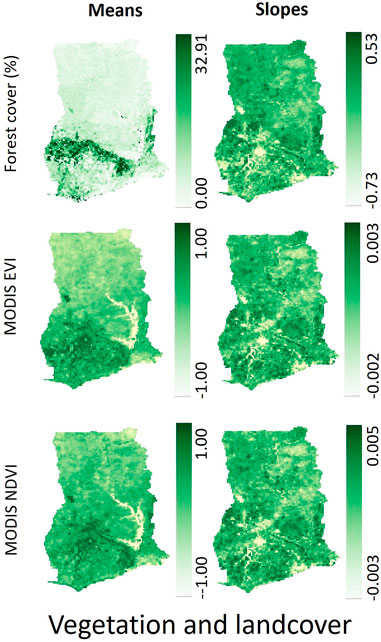
FIGURE 3. Spatial variations in mean and trends in MODIS-derived and forest cover. Data sources are presented in Table 1.
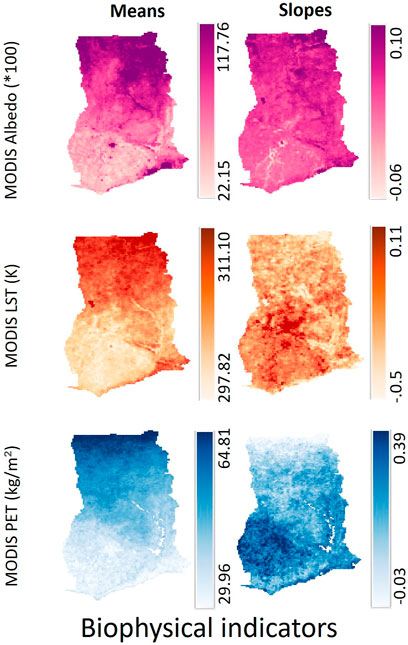
FIGURE 4. Spatial variations in means and trends of MODIS-derived biophysical variables. Note albedo is dimensionless. Data sources presented in Table 1.
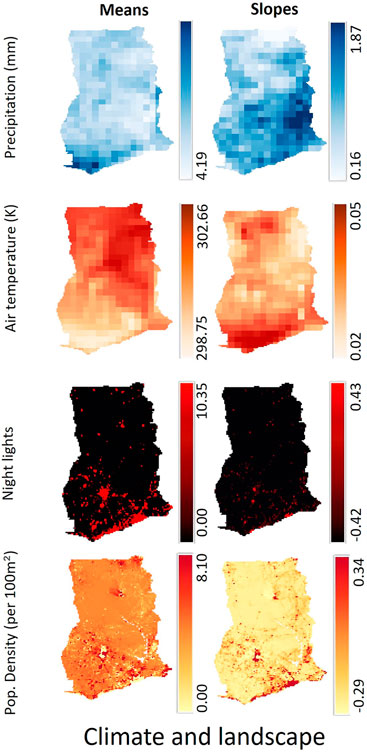
FIGURE 5. Spatial variations in means and trends of precipitation, temperature, night lights, and population density. Data sources are presented in Table 1.
2.2 Statistical Analysis
The analyses were conducted in two steps, a preliminary exploratory factor analysis (EFA) step to explore latent relationships between observed variables, followed by a structural equation model, partial least squares path modeling (PLSPM), for formalized testing of hypotheses generated from the literature and the EFA.
2.2.1 Exploratory Factor Analysis (EFA)
The EFA is a statistical analysis technique utilized primarily to uncover the underlying structure of a dataset comprising potentially several correlated variables. EFA works by reducing measured variables to a smaller number of latent factors using an eigenvalue decomposition. By this construct, these factors represent the common axes of variation within the dataset and are used to describe the output of the statistical process to which the variables are linked (Yong and Pearce, 2013). In general, factors are computed as linear constructs of measured (“manifest”) variables:
where Xj denotes the jth observed variable of the dataset, ajm represents the factor loading of the variable onto the mth underlying factor, Fm, and ej is representative of any remaining variation.
The number of factors is generally determined using the magnitudes of their computed eigenvalues (eigenvalues
2.2.2 Partial Least Squares Path Modeling (PLSPM)
PLSPM is a structural equation modeling framework that allows assessing the strengths of relationships between measured and latent factors hypothesized to have causal linkages using partial least squares techniques. PLSPM has been utilized for evaluating environmental effects in areas of study such as species richness, agritourism, and sustainability (Assaker et al., 2014; Ibrahim, 2017; Sanches Fernandes et al., 2018; Cataldo et al., 2020; Kazlouski et al., 2020; Li et al., 2020).
PLSPM utilizes an iterative algorithm to determine the weights of latent variables (“inner variables”) vis-a-vis observed data (“manifest,” “outer,” or observed variables) as linear constructs of the measured variables (Assaker et al., 2014; Benitez et al., 2020). This process produces loadings of the manifest variables on the latent variables and path coefficients between the latent variables (Assaker et al., 2014). The loadings indicate the strength of relationships between the manifest variables and their corresponding latent vectors, and the path coefficients indicate the strengths of relationships between the latent vectors.
In contrast with standard covariance-based structural equation models, PLSPM allows for the differentiation between “reflective” or “formative” relationships between latent vectors and manifest variables. If the manifest variable is assumed to cause or be created by the given latent factor, the association is considered reflective (e.g., population increase causes urbanization). Conversely, if the manifest variable is assumed to cause changes in the latent factor (e.g., urbanization causes temperature increases), the relationship is considered formative (Benitez et al., 2020). In PLSPM parlance, Mode A is used for the reflective variables and Mode B represents the formative ones (Assaker et al., 2014).
We fit the PLSPM to our data using the plspm package in Python after grouping the EFA outputs to reflect ecological and anthropogenic linkages within the region based upon evidence from literature (Benitez et al., 2020). For example, past studies have found that population levels in West Africa strongly indicate LCC, especially in the declines of forested areas and expansion of urbanized regions (Kusimi, 2008; Yiran et al., 2012; Kleemann et al., 2017a). Shifting LC dynamics in Ghana tracked by NDVI, such as vegetation loss have also been linked to changes in temperature and rainfall (Asante and Amuakwa-Mensah, 2015; Ghartey-Tagoe et al., 2020).
We repeated the modeling process till the model converged to a form with acceptable measures of validity. Finally, we assessed model performance using goodness-of-fit statistics produced by PLSPM. Once the base model had been fit, we used 0.7 as an acceptable cutoff for loadings to identify significant variables within the model, following Sanchez, 2013.
Model fit was assessed by inspecting commonality scores (how well manifest variables explain their latent factors), unidimensionality statistics (how well latent factors represent manifest variables), goodness-of-fit (how well the latent structure explains the variations in the data), and confidence intervals of path loadings estimates. The average commonality is estimated as:
where n is the number of loadings. Goodness-of-fit is then calculated by the equation
where GF represents the goodness-of-fit as a function of the average communality and R-squared values of the model (Sanchez, 2013). We used 500 bootstrapped iterations to generate 95% confidence intervals (Henseler et al., 2014). We considered variables whose confidence intervals contained zero non-significant (Sanchez, 2013).
3 Results
3.1 Trends in Climatological and Biophysical Variables
Spatial trends of climatological and biophysical variables across Ghana are presented in Figures 2–5. Climatic variables such as air temperature, LST, potential evapotranspiration (PET), and albedo are on average higher in the Northern part of Ghana, closer to the equator and savanna ecosystem. Air temperature and LST also seem to show increasing trends in the South and close to major cities, such as Kumasi and Accra, likely indicating effects of recent LCC from largely vegetated cover to more built-up uses (see Figure 1). Precipitation (PPT) tends to be higher along the coastline, and seems to show an increasing trend in the Volta region. Measures of vegetation vigor such as NDVI and EVI follow almost identical patterns of high average values (but negative trends) closer to major cities, mirroring trends in LST and temperature. Forest cover largely tracks vegetation indices, but only along the forest belt along Southwestern Ghana. Indicators of urbanization, including night lights, population, road density, and city distance all follow trends that match with the geographic locations of settled areas, and trends in night lights and population growth identify urban growth centers of Kumasi, Accra, and Tamale.
3.2 EFA
Randomized simulations of EFA using the parallelizing methods (see Figure 6) revealed that five factors were sufficient to characterize variations in the data. The strength and direction of the relationships between the factors is presented in Figure 7A. Overall, the first factor strongly correlates to NDVI mean and mean forest cover, and it negatively correlates to mean albedo and air temperature, with the relationship to albedo being stronger in magnitude by about 0.3. This factor seems to track cooler areas with high forest cover. Factor 2 has the strongest association with mean PET with moderate correlations with other variables (0.3
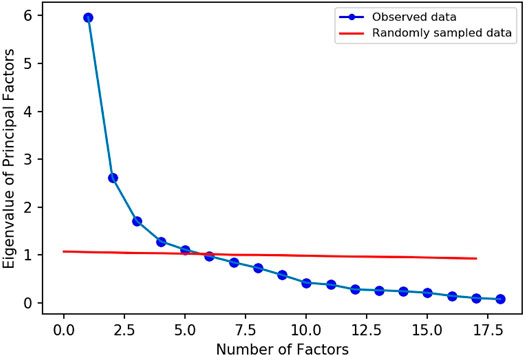
FIGURE 6. Scree plot of eigenvalues for selecting an optimum number of factors for the exploratory factor analysis. The analysis utilizes a null-model based randomization to propose a parsimonious formulation of the full EFA model. Five factors were used for all subsequent analyses.
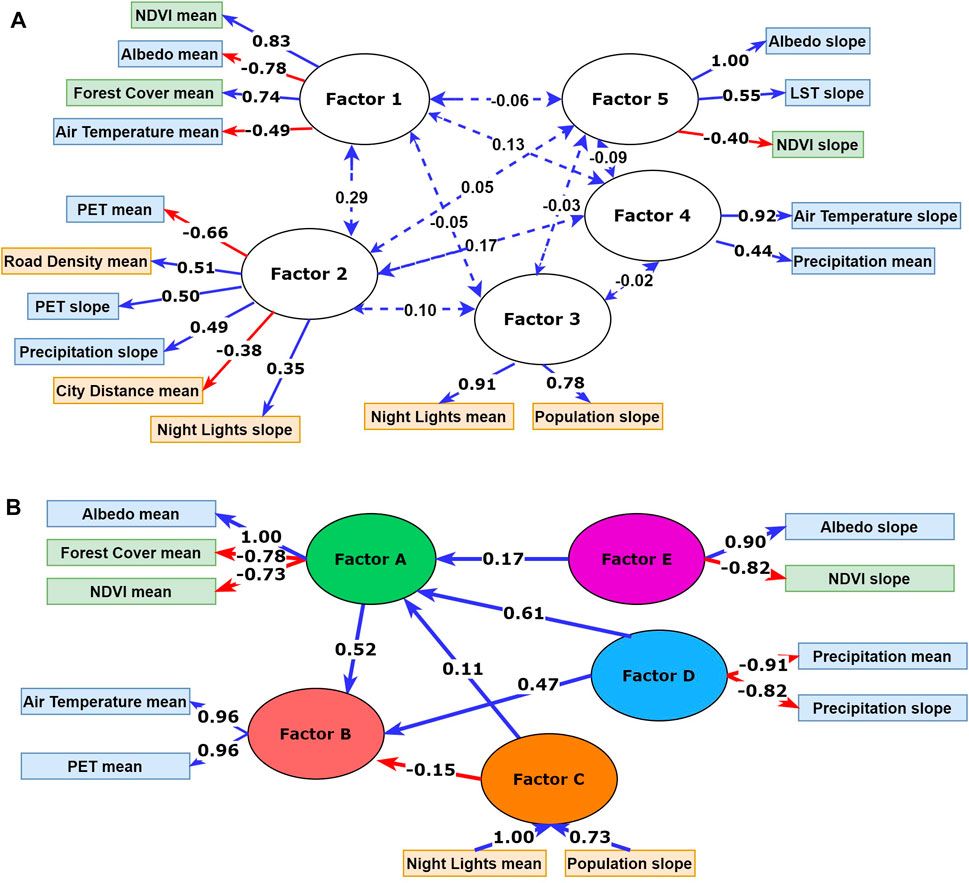
FIGURE 7. (A) Preliminary form of the model suggested by the EFA. Solid arrows represent block correlations of factors with respective manifest variables, dashed arrows represent covariances between latent vectors. Manifest variables are color coded as vegetation (green), climatic (blue), and anthropogenic (yellow). (B) Final form of the PLS path model formulated for explaining the relationships between environmental, demographic, and spatial factors influencing LC change in Ghana.
3.3 PLSPM
Results obtained from the EFA provided a strong basis for formulating hypotheses on the likely causal factors driving LCC across Ghana. We utilized information from the EFA to formulate the structure of the PLSPM (see Figure 7B) that might be representative of observed patterns in greenness and bioclimatology. Since the EFA and PLSPM are independent statistical processes that represent their own variable-factor relationships, even though the factors generated through them are similar in their representations of LC, the factors from the PLSPM are labeled with different symbols: A through E. The overall goodness-of -fit of the PLSPM model was found to be acceptable (GF: 0.71) (Sanchez, 2013). Factors D and E showed values of Cronbach’s alpha below the acceptable standard (0.7) (Table 2) (Sanchez, 2013). However, the Dillon-Goldstein’s rho for each reflective variable was found to be acceptable (

TABLE 2. Measures of unidimensionality from the PLSPM analysis, by factor. Reflective (A) or formative (B) relationships to variables are listed, as well as the number of manifest variables assigned to each factor. The unidimensionality statistics, Cronbach’s alpha, Dillon-Goldstein’s rho, and the first and second eigenvalues are given for the reflective variables.
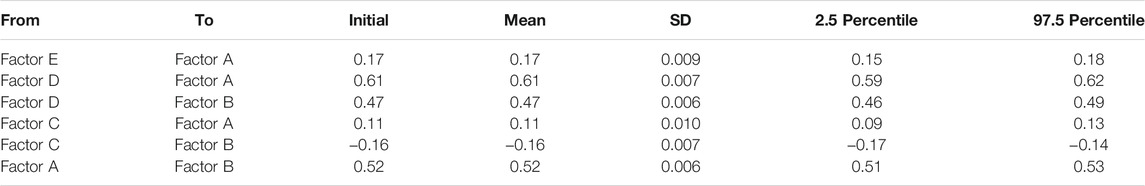
TABLE 3. PLSPM path coefficients of causal factor relationships with the original value before bootstrap validation, and the mean, standard deviation, and 95% confidence interval range after bootstrap validation with 500 iterations.
The model indicates that Factor A (interpreted as losses in forest cover) tracks increased mean albedo (loading = 1.0) in regions with low mean forest cover (and NDVI, loadings
4 Discussion
The overall intent of this research was to test if widely-used satellite-data based proxies of urban growth can help disentangle regional-scale changes in bioclimatic and land cover patterns across Ghana. We postulated that losses of forest cover tracked by available multi-temporal tree cover estimates would be related to urban and agricultural expansion, and that these changes would cause changes in local bioclimatology in nonrandom patterns across Ghana. These assumption are supported by studies in the region that have correlated reductions in NDVI measures with forest losses (Ghartey-Tagoe et al., 2020). However, this relationship may not be straightforward as declines in NDVI may be confounded by changes in agriclutural practices (Liu et al., 2017). Although NDVI can track forest density, increases in NDVI can also indicate increased agricultural intensification that might mask forest losses. As expected, forested areas generally corresponded with lower albedo levels, high measures of NDVI, and low air temperatures. Areas with dense forest cover also corresponded with lower air temperature and PET trends. This observation supports the role of forests in regional cooling and suggests that losses in forest cover may be leading temperatures increases in certain regions (Mildrexler et al., 2011). We also found that declines in forest density corresponded with declining precipitation trends. While we do not have the data to corroborate this finding, low rainfall levels have been predicted to result in increased desertification and evapotranspiration (Asante and Amuakwa-Mensah, 2015). Research on droughts in Ghana suggests that this trend may lead to reduced forest productivity (Amissah et al., 2018). Declining precipitation was also related to increasing temperatures, but this observation may be an artifact of the latitudinal gradient from the coastal regions northwards towards the Sahel.
One of the apparent contradictions in our findings indicates that population expansion has a negative effect on land temperatures. According to previous studies conducted on impacts of urbanization on local environments, increases in population density should result in elevated temperatures in and around highly urbanized regions. This is largely attributed to the fact that urban areas tend to be less effective at dissipating heat via evapotranspiration than rural regions (Zhao et al., 2014; Deilami et al., 2016). We speculate that the patterns we find arise out of a latitudinal climatological gradient across Ghana: coastal regions in Ghana tend to be more populated and urbanized and this spatial patterns corresponds strongly with the N-S temperature and precipitation gradients from the coast to the southern Sahel. Trends in urbanization may also indicate rural-urban migration patterns following environmental stress and soil fertility patterns that drive people south (Van der Geest, 2011). The relationship between factor C and B is likely dominated by this socio-environmental gradient. That said, the model does suggest that urban expansion may indirectly affect local climatology, albeit through an indirect link via an effect through vegetation losses. The model suggests strong causal linkages between urban expansion (Factor C) and low green cover (Factor A), which in turn has a strong feedback on Factor B. This observation suggests a scale-dependent relationship between local urban heat island effects, and the proximal drivers of these observations: while the model confounds effects of urban expansion with national-scale gradients in climatology, it captures the fine-scale effects of vegetation losses on elevated temperatures caused in part by reductions in local vegetation cover (Deilami et al., 2016; Simwanda et al., 2019). Areas with high population scores correspond with areas of low forest, most likely due to the agricultural expansion that accompanies migration within Ghana (Damnyag et al., 2013). Due to the substantial role it plays in Ghana’s economy and its continual expansion, agriculture has previousy been identified as a significant influence on deforestation (Kyere-Boateng and Marek, 2021).
One of the limitations of this study is that we were unable to incorporate specific measures of agricultural cover into the model due to a lack of available data. While we can avail multiple sources for estimating forest cover trends, a lack of accurate crop cover data hampers the ability of our model to directly address causality of losses in green cover in Ghana (Hackman et al., 2017). We have attempted to deduce trends in agricultural land use by controlling for forest cover against trends in generic indicators such as NDVI. Locations where forest degradation are superimposed with agricultural expansion may therefore be missed. Similarly, some amount of population expansion (largely encoded as urban growth in our model) may be masked by increasing agricultural land use (Braimoh and Vlek, 2005; Bicudo da Silva et al., 2020). Results therefore indicate that improvements in accurate agricultural LC mapping would likely improve model fits further as agricultural activities support a sizeable and growing Ghanaian population (Braimoh and Vlek, 2005). Further, the difficulty in distinguishing plantations (such as oil palm) from forests may also obscure model interpretation when functional land uses are considered (Chong et al., 2017). The two forest types are relatively easily distinguishable in high spatial resolution but not at coarser resolutions. While many of these issues are gradually being resolved with ongoing improvements in remote sensing instrumentation and algorithms, better access to accurate agricultural data will be needed to resolve several of these issues.
Figure 8 provides a visualization of spatial patterns of the latent vector scores produced by the model. Note that scores for Factors A, D, and E have been inverted to make interpretation clearer (i.e., darker colors indicate higher forest density, PPT levels, and vegetation increases, respectively). Taken together, these maps provide insights into the spatio-temporal variation in drivers of deforestation, urbanization, and bioclimatic changes across Ghana. We hope that these maps can form a starting point for further developing methods for informing regional-scale land use planning policies for sustainably managing Ghana’s landscapes.
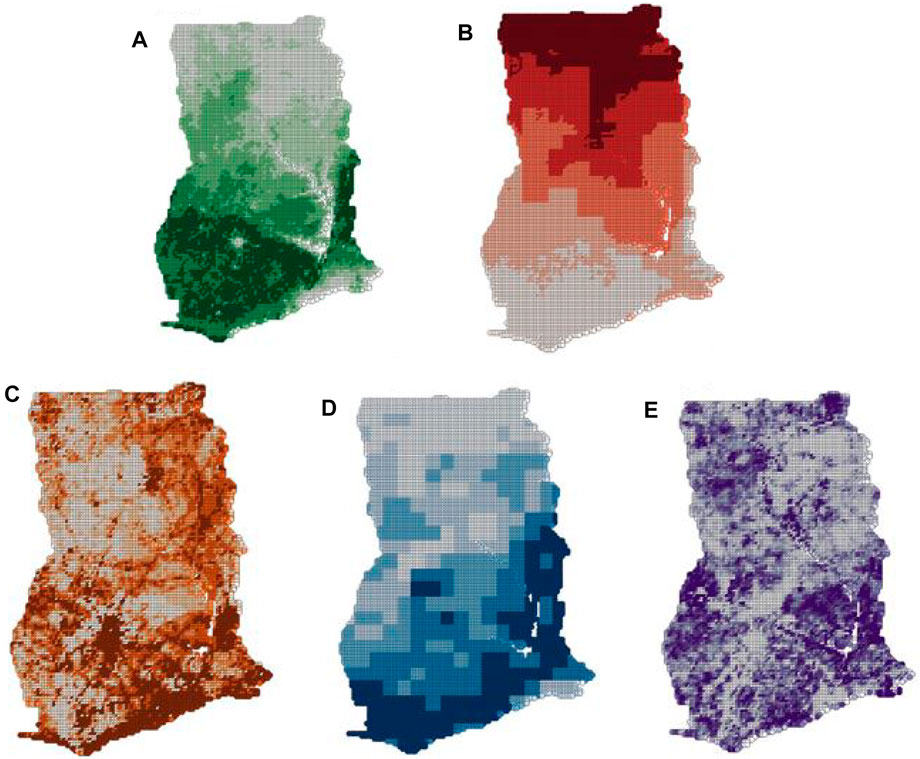
FIGURE 8. Maps of standardized latent vector scores obtained from the PLSPM: (A) Factor A; (B) Factor B; (C) Factor C; (D) Factor D; (E) Factor E. Values range from −1.96 to 1.96, darker colors denote negative values. Note that the gradient is reversed for (B) and (C) for clarity.
5 Conclusion
Environmental systems naturally undergo transitions over time, but in recent decades, these shifts have become amplified, leading to largely unknown long-term effects. While location and ecological characteristics are the major determinants of LCC, human modification of the land surface can play a large role in altering natural dynamics. In this regard, remotely-sensed indicators of environmental change can be immensely helpful in measuring and characterizing dynamics of the Earth’s surface that might otherwise be difficult to assess. In this study of decadal LCC and environmental dynamics across Ghana, we found that RS-estimated measurements of surface reflectance, greenness, temperature, precipitation, and population change simultaneously impact, and are impacted by, complex interactions between location, socio-economics of migration and urbanization, and the biophysical impacts of such interactions. We find strong evidence of the impacts of spatially disaggregated and non-uniform urbanization and population growth, especially on forest cover, and indirectly on modulating the meso-scale climate of the region. The establishment of these causal-phenomenological relationships may allow predictions to be made about the future ecological state of Ghana using observable and future data. Understanding the nature of LCC in Ghana, and generating information on interconnections between putative determining factors may be important in guiding policy decisions at regional-to-national scales for moving forward with the nation’s development in a sustainable manner.
Data Availability Statement
Publicly available datasets were analyzed in this study. This data can be found here: https://developers.google.com/earth-engine/datasets/ https://www.openstreetmap.org/ https://africapolis.org/.
Author Contributions
JP and AS: data collection, analysis, and writing results and discussion. JP: writing. JJ and AS: review and editing. JJ: overall study direction and supervision.
Funding
This research was funded by the NASA/USAID-SERVIR Program (80NSSC20K0153).
Conflict of Interest
The authors declare that the research was conducted in the absence of any commercial or financial relationships that could be construed as a potential conflict of interest.
Publisher’s Note
All claims expressed in this article are solely those of the authors and do not necessarily represent those of their affiliated organizations, or those of the publisher, the editors, and the reviewers. Any product that may be evaluated in this article, or claim that may be made by its manufacturer, is not guaranteed or endorsed by the publisher.
Acknowledgments
We would like to acknowledge the NASA/USAID-SERVIR Program for providing the funding to support this research (80NSSC20K0153).
References
Addo-Fordjour, P., and Ankomah, F. (2017). Patterns and Drivers of forest Land Cover Changes in Tropical Semi-Deciduous Forests in Ghana. J. Land Use Sci. 12, 71–86. doi:10.1080/1747423X.2016.1241313
Alo, C. A., and Pontius, R. G. (2008). Identifying Systematic Land-Cover Transitions Using Remote Sensing and GIS: The Fate of Forests inside and outside Protected Areas of Southwestern Ghana. Environ. Plann. B Plann. Des. 35, 280–295. doi:10.1068/b32091
Amissah, L., Mohren, G. M. J., Kyereh, B., Agyeman, V. K., and Poorter, L. (2018). Rainfall Seasonality and Drought Performance Shape the Distribution of Tropical Tree Species in Ghana. Ecol. Evol. 8, 8582–8597. doi:10.1002/ece3.4384
Asabere, S. B., Acheampong, R. A., Ashiagbor, G., Beckers, S. C., Keck, M., Erasmi, S., et al. (2020). Urbanization, Land Use Transformation and Spatio-Environmental Impacts: Analyses of Trends and Implications in Major Metropolitan Regions of Ghana. Land Use Policy 96, 104707. doi:10.1016/j.landusepol.2020.104707
Asante, F., and Amuakwa-Mensah, F. (2015). Climate Change and Variability in Ghana: Stocktaking. Climate 3, 78–99. doi:10.3390/cli3010078
Assaker, G., Hallak, R., Vinzi, V. E., and O’Connor, P. (2014). An Empirical Operationalization of Countries' Destination Competitiveness Using Partial Least Squares Modeling. J. Trav. Res. 53, 26–43. doi:10.1177/0047287513481275
Benitez, J., Henseler, J., Castillo, A., and Schuberth, F. (2020). How to Perform and Report an Impactful Analysis Using Partial Least Squares: Guidelines for Confirmatory and Explanatory IS Research. Inf. Manage. 57, 103168. doi:10.1016/j.im.2019.05.003
Bicudo da Silva, R. F., Millington, J. D., Moran, E. F., Batistella, M., and Liu, J. (2020). Three Decades of Land-Use and Land-Cover Change in Mountain Regions of the Brazilian Atlantic Forest. Landscape Urban Plann. 204, 103948. doi:10.1016/j.landurbplan.2020.103948
Bodart, C., Brink, A. B., Donnay, F., Lupi, A., Mayaux, P., and Achard, F. (2013). Continental Estimates of forest Cover and forest Cover Changes in the Dry Ecosystems of Africa between 1990 and 2000. J. Biogeogr. 40, 1036–1047. doi:10.1111/jbi.12084
Boryan, C., Yang, Z., Mueller, R., and Craig, M. (2011). Monitoring US Agriculture: The US Department of Agriculture, National Agricultural Statistics Service, Cropland Data Layer Program. Geocarto Int. 26, 341–358. doi:10.1080/10106049.2011.562309
Braimoh, A. K., and Vlek, P. L. G. (2005). Land-cover Change Trajectories in Northern Ghana. Environ. Manage. 36, 356–373. doi:10.1007/s00267-004-0283-7
[Dataset] Butler, R. A. (2020). Ghana forest Information and Data. Available at: https://rainforests.mongabay.com/deforestation/2000/Ghana.htm#8-protected (Accessed 2020).
Calderón-Loor, M., Hadjikakou, M., and Bryan, B. A. (2021). High-Resolution Wall-to-Wall Land-Cover Mapping and Land Change Assessment for Australia from 1985 to 2015. Remote Sensing Environ. 252, 112148. doi:10.1016/j.rse.2020.112148
Cataldo, R., Crocetta, C., Grassia, M. G., Lauro, N. C., Marino, M., and Voytsekhovska, V. (2020). Methodological PLS-PM Framework for SDGs System. Soc. Indic Res. 156, 701–723. doi:10.1007/s11205-020-02271-5
Chong, K. L., Kanniah, K. D., Pohl, C., and Tan, K. P. (2017). A Review of Remote Sensing Applications for Oil Palm Studies. Geo-Spatial Inf. Sci. 20, 184–200. doi:10.1080/10095020.2017.1337317
Chowdhury, S., Peddle, D. R., Wulder, M. A., Heckbert, S., Shipman, T. C., and Chao, D. K. (2021). Estimation of Land-Use/Land-Cover Changes Associated with Energy Footprints and Other Disturbance Agents in the Upper Peace Region of Alberta Canada from 1985 to 2015 Using Landsat Data. Int. J. Appl. Earth Observation Geoinformation 94, 102224. doi:10.1016/j.jag.2020.102224
Damnyag, L., Saastamoinen, O., Blay, D., Dwomoh, F. K., Anglaaere, L. C. N., and Pappinen, A. (2013). Sustaining Protected Areas: Identifying and Controlling Deforestation and forest Degradation Drivers in the Ankasa Conservation Area, Ghana. Biol. Conservation 165, 86–94. doi:10.1016/j.biocon.2013.05.024
Deilami, K., Kamruzzaman, M., and Hayes, J. (2016). Correlation or Causality between Land Cover Patterns and the Urban Heat Island Effect? Evidence from Brisbane, Australia. Remote Sensing 8, 716. doi:10.3390/rs8090716
[Dataset] Didan, K. (2021). MOD13Q1 MODIS/Terra Vegetation Indices 16-Day L3 Global 250m SIN Grid V006. Sioux Falls, SD: USGS. doi:10.5067/MODIS/MOD13Q1.006
[Dataset] Earth Observation Group, Payne Institute for Public Policy, Colorado School of Mines (2011). Version 4 DMSP-OLS Nighttime Lights Time Series. Available at: https://eogdata.mines.edu/products/dmsp/ (Accessed 2020).
Edusah, S. E. (2011). The Impact of forest Reserves on Livelihoods of Fringe Communities in Ghana. J. Sci. Technol. (Ghana) 31, 64882. doi:10.4314/just.v31i1.64882
Enaruvbe, G. O., and Atafo, O. P. (2016). Analysis of Deforestation Pattern in the Niger Delta Region of Nigeria. J. Land Use Sci. 11, 113–130. doi:10.1080/1747423X.2014.965279
Franklin, S. B., Gibson, D. J., Robertson, P. A., Pohlmann, J. T., and Fralish, J. S. (1995). Parallel Analysis: A Method for Determining Significant Principal Components. Carbondale, IL: Tech. Rep. 1, Southern Illinois University Carbondale. doi:10.2307/3236261
Frondoni, R., Mollo, B., and Capotorti, G. (2011). A Landscape Analysis of Land Cover Change in the Municipality of Rome (Italy): Spatio-Temporal Characteristics and Ecological Implications of Land Cover Transitions from 1954 to 2001. Landscape Urban Plann. 100, 117–128. doi:10.1016/j.landurbplan.2010.12.002
Fry, J. A., Xian, G., Jin, S., Dewitz, A., Homer, C. G., Yang, L., et al. (2011). Completion of the 2006 National Land Cover Database for the Conterminous United States. Photogrammetric Eng. Remote Sensing 77 (9), 858–864.
Ghartey-Tagoe, F., Ekumah, B., Pappoe, A. N. M., and Akotoye, H. K. (2020). Effects of Anthropogenic Activities on Land-Use Dynamics in an upland Tropical evergreen forest in Ghana. Afr. Geographical Rev. 40, 1–17. doi:10.1080/19376812.2020.1785318
Hackman, K. O., Gong, P., and Wang, J. (2017). New Land-Cover Maps of Ghana for 2015 Using Landsat 8 and Three Popular Classifiers for Biodiversity Assessment. Int. J. Remote Sensing 38, 4008–4021. doi:10.1080/01431161.2017.1312619
Haile, B., Signorelli, S., Azzarri, C., and Guo, Z. (2019). A Spatial Analysis of Land Use and Cover Change and Agricultural Performance: Evidence from Northern Ghana. Envir. Dev. Econ. 24, 67–86. doi:10.1017/s1355770x18000323
Henseler, J., Dijkstra, T. K., Sarstedt, M., Ringle, C. M., Diamantopoulos, A., Straub, D. W., et al. (2014). Common Beliefs and Reality about PLS: Comments on Rönkkö and Evermann (2013). Organizational Res. Methods 17, 182–209. doi:10.1177/1094428114526928
[Dataset] Hersbach, H., Bell, B., Berrisford, P., Biavati, G., Horányi, A., Muñoz Sabater, J., et al. (2021). ERA5 Hourly Data on Single Levels from 1979 to Present. Reading, United Kingdom: Climate Change Service (C3S) Climate Data Store (CDS). doi:10.24381/cds.adbb2d47
Ibrahim, S. H. (2017). Sustainability Assessment and Identification of Determinants in Community-Based Water Supply Projects Using Partial Least Squares Path Model. J. Sustain. Dev. Energy Water Environ. Syst. 5, 345–358. doi:10.13044/j.sdewes.d5.0153
Jamali, S., Jönsson, P., Eklundh, L., Ardö, J., and Seaquist, J. (2015). Detecting Changes in Vegetation Trends Using Time Series Segmentation. Remote Sensing Environ. 156, 182–195. doi:10.1016/j.rse.2014.09.010
Kazlouski, V., Ganski, U., Platonenka, A., Vitun, S., and Sabalenka, I. (2020). Sustainable Development Modeling of Agritourism Clusters. Manage. Theor. Stud. Rural Business Infrastructure Develop. 42, 118–127. doi:10.15544/mts.2020.12
Kleemann, J., Baysal, G., Bulley, H. N. N., and Fürst, C. (2017a). Assessing Driving Forces of Land Use and Land Cover Change by a Mixed-Method Approach in north-eastern Ghana, West Africa. J. Environ. Manage. 196, 411–442. doi:10.1016/j.jenvman.2017.01.053
Kleemann, J., Inkoom, J. N., Thiel, M., Shankar, S., Lautenbach, S., and Fürst, C. (2017b). Peri-urban Land Use Pattern and its Relation to Land Use Planning in Ghana, West Africa. Landscape Urban Plann. 165, 280–294. doi:10.1016/j.landurbplan.2017.02.004
Kuenzer, C., van Beijma, S., Gessner, U., and Dech, S. (2014). Land Surface Dynamics and Environmental Challenges of the Niger Delta, Africa: Remote Sensing-Based Analyses Spanning Three Decades (1986-2013). Appl. Geogr. 53, 354–368. doi:10.1016/j.apgeog.2014.07.002
Kusimi, J. M. (2008). Assessing Land Use and Land Cover Change in the Wassa West District of Ghana Using Remote Sensing. GeoJournal 71, 249–259. doi:10.1007/s10708-008-9172-6
Kyere-Boateng, R., and Marek, M. V. (2021). Analysis of the Social-Ecological Causes of Deforestation and forest Degradation in ghana: Application of the Dpsir Framework. Forests 12, 409. doi:10.3390/f12040409
Lambin, E. F., Geist, H. J., and Lepers, E. (2003). Dynamics of Land-Use and Land-Cover Change in Tropical Regions. Annu. Rev. Environ. Resour. 28, 205–241. doi:10.1146/annurev.energy.28.050302.105459
Lewis, S. L., Edwards, D. P., and Galbraith, D. (2015). Increasing Human Dominance of Tropical Forests. Science 349 (6250), 827–832. doi:10.1126/science.aaa9932
Li, Z., Li, Z., Tong, X., Zhang, J., Dong, L., Zheng, Y., et al. (2020). Climatic Humidity Mediates the Strength of the Species Richness–Biomass Relationship on the Mongolian Plateau Steppe. Sci. Total Environ. 718, 137252. doi:10.1016/j.scitotenv.2020.137252
[Dataset] Linard, C., Gilbert, M., Snow, R., Noor, A., and Tatem, A. (2021). Population Distribution, Settlement Patterns and Accessibility across Africa in 2010. Available at: www.worldpop.org (Accessed 2021).
Liu, Z., Wimberly, M., and Dwomoh, F. (2017). Vegetation Dynamics in the Upper Guinean forest Region of West Africa from 2001 to 2015. Remote Sensing 9, 5. doi:10.3390/rs9010005
Lossou, E., Owusu-Prempeh, N., and Agyemang, G. (2019). Monitoring Land Cover Changes in the Tropical High Forests Using Multi-Temporal Remote Sensing and Spatial Analysis Techniques. Remote Sensing Appl. Soc. Environ. 16, 100264. doi:10.1016/j.rsase.2019.100264
Malhi, Y., Adu-Bredu, S., Asare, R. A., Lewis, S. L., and Mayaux, P. (2013). African Rainforests: Past, Present and Future. Phil. Trans. R. Soc. B 368, 20120312. doi:10.1098/rstb.2012.0312
Masiliūnas, D., Tsendbazar, N. E., Herold, M., Lesiv, M., Buchhorn, M., and Verbesselt, J. (2021). Global Land Characterisation Using Land Cover Fractions at 100 M Resolution. Remote Sensing Environ. 259, 112409. doi:10.1016/j.rse.2021.112409
Mensah, A. A., Akoto Sarfo, D., and Partey, S. T. (2019). Assessment of Vegetation Dynamics Using Remote Sensing and GIS: A Case of Bosomtwe Range Forest Reserve, Ghana. Egypt. J. Remote Sensing Space Sci. 22, 145–154. doi:10.1016/j.ejrs.2018.04.004
Mensah, F., Adanu, S. K., and Adanu, D. K. (2015). Research Article: Remote Sensing and GIS Based Assessment of Land Degradation and Implications for Ghana's Ecological Zones. Environ. Pract. 17, 3–15. doi:10.1017/S1466046614000465
Mildrexler, D. J., Zhao, M., and Running, S. W. (2011). A Global Comparison between Station Air Temperatures and MODIS Land Surface Temperatures Reveals the Cooling Role of Forests. J. Geophys. Res. 116, 1–15. doi:10.1029/2010JG001486
Nang, B. (2016). Anthropogenic and Institutional Determinants of forest Resource Degradation in the savanna Ecological Zone of Northern Ghana. Res. J. Environ. Earth Sci. 8, 44–55. doi:10.19026/rjees.8.3065
Nyamekye, C., Kwofie, S., Ghansah, B., Agyapong, E., and Boamah, L. A. (2020). Assessing Urban Growth in Ghana Using Machine Learning and Intensity Analysis: A Case Study of the New Juaben Municipality. Land Use Policy 99, 105057. doi:10.1016/j.landusepol.2020.105057
[Dataset] OpenStreetMap contributors (2017). Planet Dump. Retrieved from . https://planet.osm.orghttps://www.openstreetmap.org.
Owusu, G. (2009). Urbanization and Changing Land Access and Rights in Ghana’s Largest metropolis, Accra and Kumasi. Afr. Popul. Stud 30, 177–198.
Rahaman, S., Kumar, P., Chen, R., Meadows, M. E., and Singh, R. B. (2020). Remote Sensing Assessment of the Impact of Land Use and Land Cover Change on the Environment of Barddhaman District, West Bengal, India. Front. Environ. Sci. 8, 127. doi:10.3389/fenvs.2020.00127
[Dataset] Running, S., Mu, Q., and Zhao, M. (2021). MOD16A2 MODIS/Terra Net Evapotranspiration 8-Day L4 Global 500m SIN Grid. Sioux Falls, SD: USGS. doi:10.5067/MODIS/MOD16A2.006
[Dataset] Sahel and West Africa Club (2020). Visualize Urbanisation in Africa. Available at: https://africapolis.org/ (Accessed 2021).
Samuels, P. (2016). Advice on Exploratory Factor Analysis. Birmingham City University. Tech. rep. doi:10.13140/RG.2.1.5013.9766
Sanches Fernandes, L. F., Fernandes, A. C. P., Ferreira, A. R. L., Cortes, R. M. V., and Pacheco, F. A. L. (2018). A Partial Least Squares - Path Modeling Analysis for the Understanding of Biodiversity Loss in Rural and Urban Watersheds in Portugal. Sci. Total Environ. 626, 1069–1085. doi:10.1016/j.scitotenv.2018.01.127
[Dataset] Schaaf, C., and Wang, Z. (2021). MCD43A3 MODIS/Terra+Aqua BRDF/Albedo Daily L3 Global - 500m V006. Sioux Falls, SD: USGS. doi:10.5067/MODIS/MCD43A3.006
Schmitt, T. A. (2011). Current Methodological Considerations in Exploratory and Confirmatory Factor Analysis. J. Psychoeducational Assess. 29, 304–321. doi:10.1177/0734282911406653
Sedano, F., Lisboa, S., Duncanson, L., Ribeiro, N., Sitoe, A., Sahajpal, R., et al. (2020). Monitoring Intra and Inter Annual Dynamics of forest Degradation from Charcoal Production in Southern Africa with Sentinel – 2 Imagery. Int. J. Appl. Earth Observation Geoinformation 92, 102184. doi:10.1016/j.jag.2020.102184
Simwanda, M., Ranagalage, M., Estoque, R. C., and Murayama, Y. (2019). Spatial Analysis of Surface Urban Heat Islands in Four Rapidly Growing African Cities. Remote Sensing 11, 1645. doi:10.3390/rs11141645
Spruce, J., Bolten, J., Mohammed, I. N., Srinivasan, R., and Lakshmi, V. (2020). Mapping Land Use Land Cover Change in the Lower Mekong Basin from 1997 to 2010. Front. Environ. Sci. 8, 21. doi:10.3389/fenvs.2020.00021
Teuling, A. J., Seneviratne, S. I., Stöckli, R., Reichstein, M., Moors, E., Ciais, P., et al. (2010). Contrasting Response of European forest and Grassland Energy Exchange to Heatwaves. Nat. Geosci. 3, 722–727. doi:10.1038/ngeo950
[Dataset] Townshend, J. (2016). Global Forest Cover Change (GFCC) Tree Cover Multi-Year Global 30 M V003. Sioux Falls, SD: USGS. doi:10.5067/MEaSUREs/GFCC/GFCC30TC.003
Tutu Benefoh, D., Villamor, G. B., van Noordwijk, M., Borgemeister, C., Asante, W. A., and Asubonteng, K. O. (2018). Assessing Land-Use Typologies and Change Intensities in a Structurally Complex Ghanaian Cocoa Landscape. Appl. Geogr. 99, 109–119. doi:10.1016/j.apgeog.2018.07.027
Van der Geest, K. (2011). North-South Migration in Ghana: What Role for the Environment? Int. Migration 49, e69–e94. doi:10.1111/j.1468-2435.2010.00645.x
Vittek, M., Brink, A., Donnay, F., Simonetti, D., and Desclée, B. (2013). Land Cover Change Monitoring Using Landsat MSS/TM Satellite Image Data over West Africa between 1975 and 1990. Remote Sensing 6, 658–676. doi:10.3390/rs6010658
[Dataset] Wan, Z., Hook, S., and Hulley, G. (2015). MOD11A2 MODIS/Terra Land Surface Temperature/Emissivity 8-Day L3 Global 1km SIN Grid V006. Sioux Falls, SD: USGS. doi:10.5067/MODIS/MOD11A2.006
Wood, N. D., Akloubou Gnonhosou, D. C., and Bowling, J. W. (2015). Combining Parallel and Exploratory Factor Analysis in Identifying Relationship Scales in Secondary Data. Marriage Fam. Rev. 51, 385–395. doi:10.1080/01494929.2015.1059785
[Dataset] World Bank Group (2020). World Bank Climate Change Knowledge portal. Available at: https://climateknowledgeportal.worldbank.org/country/ghana/climate-data-historical#:∼:text=Climate\\%20Data\\%20Historical&text=The\\%20South\\%2DWestern\\%20system\\%20is,mm\\%20in\\%20the\\%20forest\\%20area (Accessed 2021).
Yiran, G. A. B., Kusimi, J. M., and Kufogbe, S. K. (2012). A Synthesis of Remote Sensing and Local Knowledge Approaches in Land Degradation Assessment in the Bawku East District, Ghana. Int. J. Appl. Earth Observation Geoinformation 14, 204–213. doi:10.1016/j.jag.2011.09.016
Yong, A. G., and Pearce, S. (2013). A Beginner’s Guide to Factor Analysis: Focusing on Exploratory Factor Analysis. Tutorials Quantitative Methods Psychol. 9 (2), 79–94. doi:10.20982/tqmp.09.2.p079
Keywords: urbanization, climate, MODIS, remote sensing, partial least squares path modeling, deforestation, exploratory factor analysis, Ghana
Citation: Peeling JA, Singh A and Judge J (2022) A Structural Equation Modeling Approach to Disentangling Regional-Scale Landscape Dynamics in Ghana. Front. Environ. Sci. 9:729266. doi: 10.3389/fenvs.2021.729266
Received: 22 June 2021; Accepted: 08 December 2021;
Published: 12 January 2022.
Edited by:
Juergen Pilz, University of Klagenfurt, AustriaReviewed by:
Devaraju Narayanappa, University of Oslo, NorwayTemesgen Abera, University of Helsinki, Finland
Tekleab Gala, Chicago State University, United States
Copyright © 2022 Peeling, Singh and Judge. This is an open-access article distributed under the terms of the Creative Commons Attribution License (CC BY). The use, distribution or reproduction in other forums is permitted, provided the original author(s) and the copyright owner(s) are credited and that the original publication in this journal is cited, in accordance with accepted academic practice. No use, distribution or reproduction is permitted which does not comply with these terms.
*Correspondence: Julie A. Peeling, anVsaWVwZWVsaW5nQHVmbC5lZHU=