 Yinglin Tian
 Di Xie1
 Tiejian Li
 Jiaye Li
 Deyu Zhong
- 1State Key Laboratory of Hydroscience and Engineering, Department of Hydraulic Engineering, Tsinghua University, Beijing, China
- 2School of Environment and Civil Engineering, Dongguan University of Technology, Dongguan, China
- 3Joint-Sponsored State Key Laboratory of Plateau Ecology and Agriculture, School of Water Resources and Electric Power, Qinghai University, Xining, China
Facing irreversible and catastrophic changes on the earth, China has committed to peak the net carbon emission by 2030 and to achieve carbon neutrality by 2060. The pledge requires significant mitigation immediately and sustainably. Considering this background, some perspectives are given in this article based on the comprehensive use of natural resources. First, utilizing the STIRPAT (stochastic impacts by regression on population, affluence, and technology) model and statistical data, net carbon emissions of provinces in China are anticipated, which lays a foundation for the further “three-step” carbon neutralization route. Second, a strategy of water–temperature–radiation–land coupling use is proposed, considering 1) the carbon emission cut, which relies on comparing the energy intensity and energy structure in China with those in developed countries; 2) the carbon sink increase, which depends on the evaluation of constraints of hydrometeorological factors on ecological productivity. Finally, the necessity and possibility of carbon trading and redistribution of the natural resources are discussed to ensure that China's national net carbon emission would be reduced to zero by 2060.
Introduction
Greenhouse gas (GHG) emission is continuously increasing worldwide, which has received wide attention from researchers, governments, and the whole society. Since 2010, the GHG emission has been growing at a speed of 1.3%/a without land-use-change (LUC) emissions and reached a record high of 52.4 GtCO2e in 2019 (The UN Environment Programme 2020). Although 2020 has witnessed a dip in carbon emission due to COVID-19, it has a negligible impact on long-term climate change (Le et al., 2020). The global GHG emission is predicted to surge to around 59 GtCO2e in 2030 under current policies (The UN Environment Programme 2020).
The increasing GHG concentration in the atmosphere has led and will continue to lead to irreversible climate change on a global scale, bringing more unprecedented survival crises for human beings. As it has been reported by the Intergovernmental Panel on Climate Change Special Report on 1.5°C (IPCC 2018), human activities have induced the increase in the global mean surface temperature (GMST) of 0.87°C during the decade 2006–2015 relative to 1985–1900, resulting in multiple negative impacts on the natural and human system. The rising trends of frequency, intensity, and duration of extreme weather (i.e., heat waves, floods, and droughts) have been detected worldwide (Landsea 2005; Trenberth et al., 2014; Fischer and Knutti 2015; Perkins–Kirkpatrick and Lewis 2020). In addition, other hazards also occur more frequently, such as earthquakes, landslides, volcanic activities, and wildfires. According to the analysis of the UN Office for Disaster Risk Reductions (2020), the number of natural disasters in the world doubled during the past 20 years compared with the period 1980–1999. Moreover, some other slow but hazardously evolving disasters are gradually appearing, such as the melting glaciers on the polar, rising sea levels, weakening Atlantic Meridional Overturning Circulation (AMOC), and intensified seabed methane release (Serreze et al., 2007; James et al., 2016; Sevellec et al., 2017; Kulp and Strauss 2019).
Threatened by these multiple and cascading risks, a comprehensive low-carbon transition for all countries is in urgent need. As the world’s largest developing country, energy consumer, and carbon emitter, with the most frequent natural disasters (UN Office for Disaster Risk Reductions, 2020), China has made announcements to become carbon neutral by 2060, and to peak the CO2 emission in the next decade (Central People’s Government of the People’s Republic of China 2021; The Guardian 2020; Chinadialogue 2020). Oriented at this target, China promised to lower its carbon dioxide emissions per unit of Gross Domestic Production (GDP) by 65% by 2030 compared with the 2005 levels, while boosting the forest stock volume by 6 billion m3 from the 2005 levels. In addition, China also pledged a 25% share of nonfossil fuels in primary energy consumption and over 1.2 billion kilowatts of its total installed capacity of wind and solar power by 2030 (Reuters 2020).
Although the climate goal of China reignites the hope for controlling global warming and may even attract more countries to the track of carbon cut, the discrepancy between the ambitiousness and the status quo is still vast. On the one hand, despite a slowdown during 2010–2016 after the rapid growth during the 2000s, the GHG emission of China speeded up again in 2019 (3.1%/a), reaching a record high of 14 GtCO2e and accounting for more than 25 percent of the global GHG emission (The UN Environment Programme 2020). On the other hand, unlike developed countries, which have peaked carbon emission and therefore possess 50–70 years to rein in fossil fuel use and to offset the remaining emission (The UN Environment Programme 2020), the time from carbon emission peak to neutrality is only 30 years for China. China is bearing a heavier burden, but given a tighter time line. Therefore, China undoubtedly needs more investment in related researches and more vigorous measures and policies, especially during the 14th Five Year Plan (FYP for 2021–2025). And it is widely accepted that China should expand the generation and consumption of clean power while encouraging more capture, utilization, and storage for carbon (CCUS) both biophysically and chemically (Li et al., 2016; Zhou et al., 2016; Li et al., 2021).
However, the clear and quantitative roadmap for the Chinese carbon neutrality is still unclear, which is vital for implementing the commitments. Even if the carbon neutrality goal of China has been translated into several near-term breakdowns of energy and climate goals from the country’s viewpoint, regional research remains to consider the uneven distribution of social and natural resources (Zhang and Hao 2015). Generally, China’s population, urban regions, and carbon emissions are mainly concentrated in northeastern and eastern China (Chen et al., 2016; Chen et al. 2019; Chen et al. 2020), while China’s main carbon sequestration is concentrated in southwestern and south China (Wang et al., 2020). In other words, there is a natural contradiction between the “carbon debt” (i.e., the positive amount of net carbon emission) and the “carbon credit” (i.e., the negative amount of net carbon emission) in various regions of China. Furthermore, the spatial distribution of water, soil, and heat resources is also not completely matched in China, leading to the inhomogeneous distribution of the carbon sequestration potential (Tao et al., 2005; Beer et al., 2010; Huang et al., 2019). As a result, the pathways for carbon neutrality in 2060 should vary with provinces, which nevertheless are currently unclear.
Furthermore, few strategies have been put forward from the perspective of hydrology and hydraulic engineering, which have played an important role in carbon removal for a long time. For the carbon cut, up to 2019, the hydropower of China has generated electricity more than 16 trillion kilowatt-hours, approximately equivalent to 15.4 billion tons of carbon dioxide emission reduction (China Society for Hydropower Engineering 2020). For carbon sequestration, water resources have become one of the key constraints for revegetation in relatively arid regions (Zhou et al., 2019), like China’s Loess Plateau (Feng et al., 2016), thus limiting the opportunities for intensifying biological carbon sequestration. Furthermore, water resources play an important role in determining clean energy generation and ecological production not solely but coupled with other hydrometeorological factors like radiation, wind, and temperature. Therefore, long-term deep decarbonization in the context of hydrology, hydraulic engineering, and comprehensive natural resource use can give a worthy sight to achieving carbon neutrality.
Under this situation, this perspective paper is aimed to explore the solutions for the two issues mentioned above. In The Roadmap for Chinese Carbon Neutrality Considering Differences Between Provinces, the Chinese carbon neutrality goal is split into three steps considering the characteristics of carbon emission variation in different provinces. In A Strategy of Water-temperature-radiation-land Coupling Use for Carbon Neutrality of China, a strategy of carbon cut from the perspective of water–temperature–radiation–land coupling use is elaborated. In Discussions, the Chinese carbon cut is further discussed in the context of carbon trading and redistribution of natural resources in the foreseen future.
The Roadmap for Chinese Carbon Neutrality Considering Differences Between Provinces
The net carbon emission is estimated by extracting the carbon sink from the carbon emission. The data and methods used to assess the carbon emission and carbon sink are provided in Supplementary Text S1.1 and Text S1.2 in detail, respectively. Supplementary Figure S1 (in Supplementary Material) presents the tendency of net carbon emission in the whole China and the three representative provinces under four different scenarios (including the scenario of total green development, S1; the scenario of strong energy conservation and emission reduction, S2; the scenario of energy conservation and emission reduction, S3; and the scenario of extensive development, S4), which are described in detail in Supplementary Table S1 (in Supplementary Material). As shown by the blue solid line in Supplementary Figure S1A, only in the S1 scenario, carbon neutrality will be realized in China by 2060. However, it is still difficult to kick the coal habit quickly in a period as short as 1 or 2 decades, considering the inertia in energy consumption and the economic development of China. As a result, a gradual transition is more feasible. As presented by the red dashed line in Supplementary Figure S1A, the whole country is suggested to develop the S3 scenario before 2030. Thereafter, the transition is supposed to be made from the S3 to the S2 scenario by 2040. From then on, more efforts must be made to accomplish the total green development in all fields (the S1 scenario) and to finally cut the net carbon emission to zero by 2060.
After the national pathway is clear, the net carbon emission for different provinces is projected considering their economic structure, industrial development, and vegetational cover, to evaluate the challenge of meeting the regional targets. As shown in Supplementary Figure S1B, Qinghai has peaked carbon emission and has the potential to achieve carbon neutrality from 2037 to 2053 as long as Qinghai would not develop its economy by extensively using its fossil fuel (the S4 scenario). Comparatively, the possible carbon neutrality is much later for Hubei, which can approximately be achieved by 2052, and the total green development (the S1 scenario) is the only choice for Hubei. Furthermore, carbon neutrality is much harder for Guangdong, the earliest time for which to cut the carbon emission is 2060, which is only possible under the S1 scenario.
Under this situation, China’s 2060 carbon neutrality target could be split into three steps based on the carbon emission estimation for more provinces. As shown in Supplementary Table S3 (in Supplementary Material), in the first step, by 2045, the demonstrational areas of Chinese carbon neutrality should meet the standards, including the western provinces such as Qinghai and Xinjiang. In the second step, by 2055, the key areas of Chinese carbon neutrality should cut the carbon emission to zero, including Sichuan, Hubei, and Hunan etc. Finally, in the third step, by 2060, it is time for the difficult areas of Chinese carbon neutrality to reach the standard, including Henan, Shaanxi (105°E–111°E, 31°N–39°N), and Guangdong etc. It is worthy to note that some provinces, Liaoning, for instance, may be hard to realize carbon neutrality even in 2060. As a result, the demonstrational areas need to take their advantages and contribute to the carbon sink of the difficult areas after offsetting the carbon emission of their own, thus guaranteeing the achievement of national carbon neutrality.
A Strategy of Water–Temperature–Radiation–Land Coupling Use for Carbon Neutrality of China
After the general route of China’s carbon neutrality is made clear, reformation should be performed in every field to reach the objectives, among which the natural resource regulation plays pivotal roles. In this context, a strategy of water–temperature–radiation–land coupling use is proposed, which is divided into two dimensions as the following:
Cutting the Carbon Emission
The carbon emission is largely determined by the efficiency and structure of the energy consumption, which can be represented by the energy consumption per unit of gross regional production (GRP), or carbon intensity, and the proportion of nonfossil fuel in primary energy. The data and methods used to assess the carbon intensity and the account of nonfossil fuel in primary energy are provided in Supplementary Text S1.3 detail. The results of different provinces in China in 2017 are shown in Figure 1.
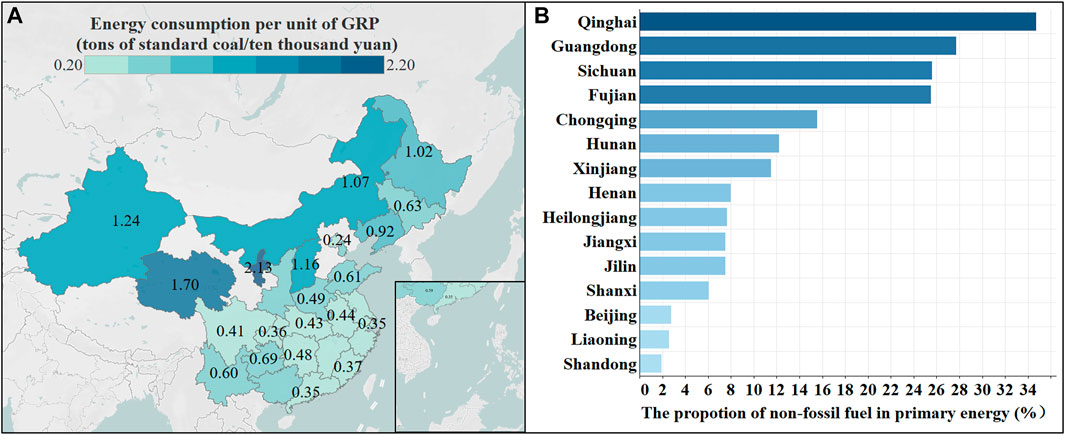
FIGURE 1. (A) Energy consumption per unit of GRP and (B) the proportion of nonfossil fuel in primary energy of different provinces in China in 2017. Some provinces are not presented because of the data deficiency.
In 2017, the energy consumption per GDP of China, America, and Europe are approximately 0.4, 0.2, and 0.1 tons of standard coal per ten thousand yuan, respectively (National Bureau of Statistics of China 2000–2019). Moreover, as presented in Figure 1A, the carbon intensity in the majority of provinces in China exceeds the average value for America (0.2). Generally, southern, eastern, and southeastern China have relatively low energy consumption per unit of GRP, ranging from 0.35 (Jiangsu) to 0.69 (Guizhou) tons of standard coal per ten thousand yuan, although the net carbon emission is relatively high there (Chen et al., 2020). On the contrary, the northwestern, northern, and northeastern provinces have a lower efficiency of energy usage, with the energy consumption per unit of GRP varying from 1.02 (Heilongjiang) to 2.13 (Ningxia) tons of standard coal per ten thousand yuan. Notably, Ningxia, Qinghai, Xinjiang, and Inner Mongolia have especially high carbon intensity, asking for quick reformation of the energy utilization structure.
Apart from the use efficiency of the primary energy, the components of energy consumption also account for the final carbon emission. In other words, the fewer fossil fuel is consumed, the less GHGs would be generated. The average proportion of the nonfossil fuel of China is 15.6% in 2017, less than that of America (18%) and Europe (27%). Several provinces, such as Qinghai (34.7%), Guangdong (27.7%), Sichuan (25.6%), and Fujian (25.5%), have widely applied hydro, wind, and solar energies, thus gaining a higher proportion of nonfossil fuel than that of America. The ratio of the zero-emission resources is urgently needed to be increased in more provinces, especially in Shandong, Liaoning, Beijing, and Shanxi.
Enhancing the Biological Carbon Sequestration
Apart from cutting the carbon emission, the amount of carbon sequestration needs to be increased in the meanwhile, because even in the S1 scenario, about 1.6 billion tons of carbon emission (not the net one) would be emitted in total in 2050, which remains to be offset both naturally and artificially. In other words, increasing carbon sequestration capacity is not a risk compensation but a rigid demand for 2060 carbon neutrality. From 2010 to 2016, the whole terrestrial ecosystem in China absorbed approximately 1.11 billion tons of carbon annually, accounting for about 10% of the Chinese total carbon emissions in that period and 45% of the carbon released in total fossil fuel combustion and cement production (Wang et al., 2020). In the Chinese terrestrial ecosystem, the forest is of vital significance, with its vegetation carbon storage amounting to 5.49 PgC on average (Ni 2013). And the grassland also explains a lot for the carbon sink, accounting for about 40% of the country’s land area (the NBS) and storing the carbon of approximately 1.41 PgC (Ni 2013). Therefore, growth in forest and grassland stock during the next 3 decades is the key to striving for carbon neutrality by 2060.
The carbon sequestration capacity of both forests and grasslands is affected by natural factors such as, among others, climate conditions, soil quality, and water resources, which all show obvious temporal and spatial heterogeneities (Bastin et al., 2019). To give some scientific supports for China’s afforestation, the restrictions of temperature, water, and radiation on the gross primary production (GPP) in China during 2000–2019 are calculated based on the data and method provided in Supplementary Text S1.4, and the results are presented in Figure 2. It is found that the major factors determining the carbon capture of plants vary with the region and the season. Except for winter, the water resource is the most important factor in northwestern China, especially for Xinjiang, Inner Mongolia, and Qinghai, and its effect is more pronounced in the summer. Comparatively, radiation accounts for more in southeastern China, and its influences extend to the northeastern areas in the summer. As for the temperature, it reasonably controls northern China in the winter and also explains the limited carbon sink over the large part of the Tibet Plateau nearly all over the year.
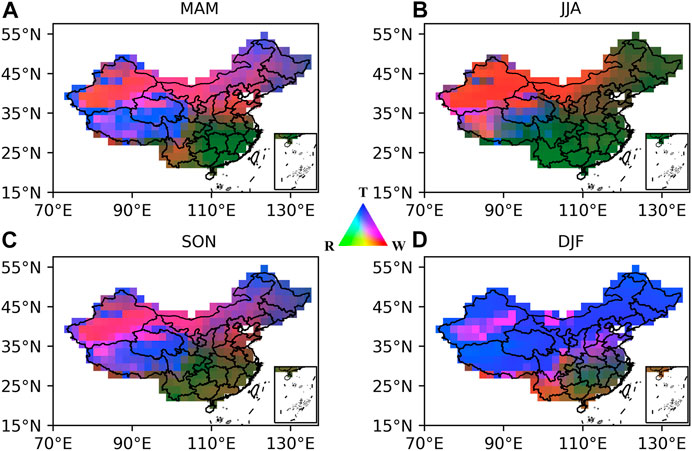
FIGURE 2. Geographic distribution of potential climatic constraints to plant growth derived from long-term (2000–2019) climate statistics in (A) spring, (B) summer, (C) autumn, and (D) winter. R, T, and W represent radiation, temperature, and water resources, respectively. Deeper green indicates stronger constraints of radiation on GPP, deeper blue indicates stronger constraints of temperature on GPP, and deeper red indicates stronger constraints of water on GPP.
Discussions
Carbon Trading
Based on the anticipation of the net carbon emission of provinces introduced in The Roadmap for Chinese Carbon Neutrality Considering Differences Between Provinces, the net carbon emissions of representative provinces in 2050 under the scenario of total green development (the S1 scenario) are provided in Supplementary Table S4, which quantifies the potential and the need of different provinces for the carbon trading in China. As it is presented in Supplementary Table S4, in 2050, Qinghai, Sichuan, and Hunan can additionally sequestrate 20.45 GtCO2e, 14.08 GtCO2e, and 9.52 GtCO2e in addition to local carbon emission, respectively, which can be regarded as the “carbon credit.” On the contrary, the net carbon emissions of Liaoning, Chongqing, Guangdong, Henan, Shanxi, and Hubei in 2050 are still positive, ranging from 10.98 to 103.49 GtCO2e, which can be regarded as the “carbon debt.” In other words, provinces with a relatively low economic development level and high potential of carbon sequestration, like Qinghai, can swap the net carbon sinks for economic support and resource supply from those provinces having difficulties in carbon mitigation.
Moreover, embedded in distinctive political, economic, and institutional contexts, the emission trading systems (ETSs) can control carbon emission both effectively and economically. Comprehensive ETSs rely on the ex-ante investigation of carbon footprint, improvement of carbon tax policy, reasonable carbon pricing, fair allowance allocation among sectors and enterprises, unified carbon market construction, and ex-post impact assessments (Lu et al., 2010; Wang et al., 2015; Jiang et al., 2016; Zhang et al., 2020; Wei 2021).
Redistribution of Natural Resources
Figure 2 shows significantly different features of the climate constraints on plant growth in northwestern China and southeastern China. For further investigation, we present the multiyear-averaged distribution of minimum temperature, precipitable water, and cloud cover in Supplementary Figures S2–S4 based on the data from NCEP-DOE Reanalysis 2 (Kanamitsu et al., 2002). Moreover, the distribution of elevation in China is drawn in Supplementary Figure S5 based on the 90 m digital elevation model (Jarvis et al., 2008). The dividing line from southwest to northeast can be found in Supplementary Figures S2–S4, mainly due to the latitudes and spatial characteristics of the elevation in China (Supplementary Figure S5), which decreases from northwest to southeast. With higher elevation, northwestern China experiences lower temperature (Supplementary Figure S2) and thinner air overlying it, which together led to less precipitable water in the region (Supplementary Figure S3) and thus less cloud cover (Supplementary Figure S4). Since the reflection and absorption of radiation by the clouds are less, more radiation can arrive at the surface in northwestern China. Apart from that, southeastern China is close to the South China Sea, western North Pacific, and the East China Sea, thus having adequate moisture supply and experiences frequent moisture convergence due to the large-scale atmospheric circulation (Huang et al., 2018).
Further, Figure 2 implies that rational redistribution of natural resources is conducive to the enhancement of the carbon fixation capacity. For example, land resources are adequate in western China, which nevertheless severely lacks the water and heat resources, and therefore has restricted the growth of grasslands. According to Figure 2B, the ecological productivity in the northwestern Qinghai (around the Chaidamu Basins) during the growing season (approximately in the summer season) can be added if more water resources were transferred there. The pronounced positive trend in natural precipitation has been observed around the Chaidamu Basins based on the Climate Forecast System Reanalysis (CFSR) product during 1980–2016, favoring the increases in ecological carbon capture (Ayantobo et al., 2016). If the artificial precipitation enhancements are performed at the places where the moisture converges and are followed by water resource regulation of surface water conservancy projects, the precipitation over the Chaidamu Basins can be increased by around 2.4 billion cubic meters per year during 2020–2060 (Meng and Wang 2019), which can largely boost the net ecological productivity there.
Conclusion
In this study, based on the statistical data and grid data, using the STIRPAT model (Pan et al., 2021) and Nemani’s (Nemani et al., 2003) method, the roadmap is drawn for the Chinese commitment to peak emissions in 2030 and reach carbon neutrality in 2060. Further, a strategy of water–temperature–radiation–land coupling use for carbon neutrality of China is provided. Specifically, our major findings are as the following:
1) China’s 2060 carbon neutrality target is supposed to be split into three steps based on the carbon emission estimation of provinces. The demonstrational areas (such as Qinghai and Xinjiang), the key areas (such as Sichuan, Hubei, and Hunan), and the difficult areas (such as Henan, Shaanxi, and Guangdong) should cut the net carbon emission to zero by 2045, 2055, and 2060, respectively. Also, carbon trading is a requisite considering the interprovincial dispatch of economic development levels, natural resource storage, and carbon emission.
2) The energy intensity of China is higher than that of Europe and America, while the account of nonfossil fuels in China is lower than those of Europe and America. Thereby, more efforts should be made to improve the efficacy of energy consumption in China.
3) In summer, the plant growth in northwestern and southeastern China is limited by water and radiation, respectively. Rational redistribution of natural resources is conducive to the enhancement of the carbon fixation capacity.
Data Availability Statement
The original contributions presented in the study are included in the article/Supplementary Material; further inquiries can be directed to the corresponding author.
Author Contributions
YT analyzed the constraints of the natural sources on the GPP and wrote the manuscript. DX investigated the net carbon emission in the present and forecasted it based on the STIRPAT model. TL made suggestions on carbon trading. JL reviewed the reasons and effects of global warming. YZ generalized the difficulties for China to achieve carbon neutrality and compared the energy consumption of China with that of foreign countries. HJ reviewed the key technologies to lower carbon emission in sectors of industry, construction, transportation, and agriculture. DZ and GW put forward the framework of the strategy of water–temperature–radiation–land coupling use for the carbon neutrality of China and helped to improve the interpretation of the paper.
Funding
This research was supported by the Second Tibetan Plateau Scientific Expedition and Research Program (2019QZKK0208).
Conflict of Interest
The authors declare that the research was conducted in the absence of any commercial or financial relationships that could be construed as a potential conflict of interest.
Publisher’s Note
All claims expressed in this article are solely those of the authors and do not necessarily represent those of their affiliated organizations, or those of the publisher, the editors, and the reviewers. Any product that may be evaluated in this article, or claim that may be made by its manufacturer, is not guaranteed or endorsed by the publisher.
Supplementary Material
The Supplementary Material for this article can be found online at: https://www.frontiersin.org/articles/10.3389/fenvs.2021.740665/full#supplementary-material
References
Ayantobo, O. O., Wei, J., Kang, B., Li, T., and Wang, G. (2021). Spatial and Temporal Characteristics of Atmospheric Water Vapour Content and its Relationship with Precipitation Conversion in China during 1980-2016. Int. J. Climatol. 41, 1747–1766. doi:10.1002/joc.6928
Bastin, J.-F., Finegold, Y., Garcia, C., Mollicone, D., Rezende, M., Routh, D., et al. (2019). The Global Tree Restoration Potential. Science 365 (6448), 76–79. doi:10.1126/science.aax0848
Beer, C., Reichstein, M., Tomelleri, E., Ciais, P., Jung, M., Carvalhais, N., et al. (2010). Terrestrial Gross Carbon Dioxide Uptake: Global Distribution and Covariation with Climate. Science 329 (5993), 834–838. doi:10.1126/science.1184984
Central People's Government of the People's Republic of China (2021). How Can China Peak Emissions before 2030 and Reach Carbon Neutrality before 2060? Beijing, China: Xinhuanet. (in Chinese) http://www.gov.cn/xinwen/2021-04/02/content_5597403.htm.
Chen, D., Zhang, Y., Yao, Y., Hong, Y., Guan, Q., and Tu, W. (2019). Exploring the Spatial Differentiation of Urbanization on Two Sides of the Hu Huanyong Line -- Based on Nighttime Light Data and Cellular Automata. Appl. Geogr. 112, 102081. doi:10.1016/j.apgeog.2019.102081
Chen, J., Gao, M., Cheng, S., Hou, W., Song, M., Liu, X., et al. (2020). County-level CO2 Emissions and Sequestration in China during 1997-2017. Sci. Data 7, 391. doi:10.1038/s41597-020-00736-3
Chen, M., Gong, Y., Li, Y., Lu, D., and Zhang, H. (2016). Population Distribution and Urbanization on Both Sides of the Hu Huanyong Line: Answering the Premier's Question. J. Geogr. Sci. 26, 1593–1610. doi:10.1007/s11442-016-1346-4
China Society for Hydropower Engineering (2020). Annual Report for China Hydropower Information of 2019 Beijing, China: China Electric Power Press, 14–16. (in Chinese) http://www.hydropower.org.cn/showNewsDetail.asp?nsId=27366.
China dialogue (2020). China’s New Carbon Neutrality Pledge: What Next? London, England: China Dialogue. https://www.thethirdpole.net/en/climate/chinas-new-carbon-neutrality-pledge-what-next/.
Feng, X., Fu, B., Piao, S., Wang, S., Ciais, P., Zeng, Z., et al. (2016). Revegetation in China's Loess Plateau Is Approaching Sustainable Water Resource Limits. Nat. Clim Change 6, 1019–1022. doi:10.1038/nclimate3092
Fischer, E. M., and Knutti, R. (2015). Anthropogenic Contribution to Global Occurrence of Heavy-Precipitation and High-Temperature Extremes. Nat. Clim Change 5, 560–564. doi:10.1038/nclimate2617
Huang, M., Piao, S., Ciais, P., Peñuelas, J., Wang, X., Keenan, T. F., et al. (2019). Air Temperature Optima of Vegetation Productivity across Global Biomes. Nat. Ecol. Evol. 3, 772–779. doi:10.1038/s41559-019-0838-x
Huang, W., He, X., Yang, Z., Qiu, T., Wright, J. S., Wang, B., et al. (2018). Moisture Sources for Wintertime Extreme Precipitation Events over South China during 1979-2013. J. Geophys. Res. Atmos. 123, 6690–6712. doi:10.1029/2018JD028485
IPCC (2006). IPCC Guidelines for National Greenhouse Gas Inventories Hayama, Japan: The Institute for Global Environmental Strategies (IGES). https://www.ipcc.ch/report/2006-ipcc-guidelines-for-national-greenhouse-gas-inventories/.
IPCC (2018). IPCC Special Report on Global Warming of 1.5 °C Geneva, Switzerland: World Meteorological Organization. https://www.ipcc.ch/sr15/.
Jarvis, A., Reuter, H. I., Nelson, A., and Guevara, E. (2004). Hole-Filled Seamless SRTM Data V4. International Centre for Tropical Agriculture (CIAT).
James, R. H., Bousquet, P., Bussmann, I., Haeckel, M., Kipfer, R., Leifer, I., et al. (2016). Effects of Climate Change on Methane Emissions from Seafloor Sediments in the Arctic Ocean: A Review. Limnol. Oceanogr. 61 (1), S283–S299. doi:10.1002/lno.10307
Jiang, J., Xie, D., Ye, B., Shen, B., and Chen, Z. (2016). Research on China's Cap-And-Trade Carbon Emission Trading Scheme: Overview and Outlook. Appl. Energ. 178, 902–917. doi:10.1016/j.apenergy.2016.06.100
Kanamitsu, M., Ebisuzaki, W., Woollen, J., Yang, S.-K., Hnilo, J. J., Fiorino, M., et al. (2002). NCEP-DOE AMIP-II Reanalysis (R-2). Bull. Am. Meteorol. Soc. 83, 1631–1643. doi:10.1175/BAMS-83-11-163110.1175/bams-83-11-1631(2002)083<1631:nar>2.3.co;2
Kulp, S. A., and Strauss, B. H. (2019). New Elevation Data Triple Estimates of Global Vulnerability to Sea-Level Rise and Coastal Flooding. Nat. Commun. 10, 4844. doi:10.1038/s41467-019-12808-z
Le Quéré, C., Jackson, R. B., Jones, M. W., Smith, A. J. P., Abernethy, S., Andrew, R. M., et al. (2020). Temporary Reduction in Daily Global CO2 Emissions during the COVID-19 Forced Confinement. Nat. Clim. Chang. 10, 647–653. doi:10.1038/s41558-020-0797-x
Li, Q., Chen, Z. A., Zhang, J.-T., Liu, L.-C., Li, X. C., and Jia, L. (2016). Positioning and Revision of CCUS Technology Development in China. Int. J. Greenhouse Gas Control. 46, 282–293. doi:10.1016/j.ijggc.2015.02.024
Li, Y., Lan, S., Ryberg, M., Pérez-Ramírez, J., and Wang, X. (2021). A Quantitative Roadmap for China towards Carbon Neutrality in 2060 Using Methanol and Ammonia as Energy Carriers. ISCIENCE 24 (6), 102513. doi:10.1016/j.isci.2021.102513
Lu, C., Tong, Q., and Liu, X. (2010). The Impacts of Carbon Tax and Complementary Policies on Chinese Economy. Energy Policy 38 (11), 7278–7285. doi:10.1016/j.enpol.2010.07.055
Meng, C. Q., and Wang, G. Q. (2019). Status Analysis and Development Potential Evaluation of Air Water Resources in the Northwest Inland in China. (Postdoctor Thesis, in Chinese). Beijing: Tsinghua University.
National Bureau of Statistics of China (2000–2019). China Statistical Yearbook: Total Consumption of Energy and its Composition Beijing, China: China Statistic Press. http://www.stats.gov.cn/tjsj/ndsj/.
Nemani, R. R., Keeling, C. D., Hashimoto, H., Jolly, W. M., Piper, S. C., Tucker, C. J., et al. (2003). Climate-driven Increases in Global Terrestrial Net Primary Production from 1982 to 1999. Science 300 (5625), 1560–1563. doi:10.1126/science.1082750
Ni, J. (2013). Carbon Storage in Chinese Terrestrial Ecosystems: Approaching a More Accurate Estimate. Climatic Change 119, 905–917. doi:10.1007/s10584-013-0767-7
Pan, D., Li, N., and Li, F. (2021). Mitigation Strategy of Eastern China Based on Energy-Source Carbon Emission Estimation. Acta Scientiae Circumstantiae 41 (3), 1142–1152. doi:10.13671/j.hjkxxb.2020.0325
Perkins-Kirkpatrick, S. E., and Lewis, S. C. (2020). Increasing Trends in Regional Heatwaves. Nat. Commun. 11, 3357. doi:10.1038/s41467-020-16970-7
Reuters (2020). China's Xi Targets Steeper Cut in Carbon Intensity by 2030. London, England: Thomson Reuters. https://www.reuters.com/world/china/chinas-xi-targets-steeper-cut-carbon-intensity-by-2030-2020-12-12/.
Serreze, M. C., Holland, M. M., and Stroeve, J. (2007). Perspectives on the Arctic's Shrinking Sea-Ice Cover. Science 315, 1533–1536. doi:10.1126/science.1139426
Sévellec, F., Fedorov, A. V., and Liu, W. (2017). Arctic Sea-Ice Decline Weakens the Atlantic Meridional Overturning Circulation. Nat. Clim. Change 7, 604–610. doi:10.1038/nclimate3353
Tao, F., Yokozawa, M., Hayashi, Y., and Lin, E. (2005). A Perspective on Water Resources in China: Interactions between Climate Change and Soil Degradation. Climatic Change 68, 169–197. doi:10.1007/s10584-005-6013-1
The Guardian (2020). China Pledges to Become Carbon Neutral before 2060 London, England: Guardian News and Media. https://www.theguardian.com/environment/2020/sep/22/china-pledges-to-reach-carbon-neutrality-before-2060.
The UN Environment Programme (2020). Emissions Gap Report 2020: 1.5°C Goal Requires Green Recovery. Nairobi, Kenya: UN Environment Programme. https://wedocs.unep.org/bitstream/handle/20.500.11822/34438/EGR20ESE.pdf.
Trenberth, K. E., Dai, A., van der Schrier, G., Jones, P. D., Barichivich, J., Briffa, K. R., et al. (2014). Global Warming and Changes in Drought. Nat. Clim. Change 4, 17–22. doi:10.1038/nclimate2067
UN Office for Disaster Risk Reductions (2020). Human Cost of Disaster. An Overview of the Last 20 Years 2000-2019. Geneva, Switzerland: The United Nations Office for Disaster Risk Reduction (UNDRR). https://www.undrr.org/media/48008/download.
Wang, J., Feng, L., Palmer, P. I., Liu, Y., Fang, S., Bösch, H., et al. (2020). Large Chinese Land Carbon Sink Estimated from Atmospheric Carbon Dioxide Data. Nature 586, 720–723. doi:10.1038/s41586-020-2849-9
Wang, P., Dai, H.-c., Ren, S.-y., Zhao, D.-q., and Masui, T. (2015). Achieving Copenhagen Target through Carbon Emission Trading: Economic Impacts Assessment in Guangdong Province of China. Energy 79, 212–227. doi:10.1016/j.energy.2014.11.009
Wei, S. (2021). A Sequential Game Analysis on Carbon Tax Policy Choices in Open Economies: From the Perspective of Carbon Emission Responsibilities. J. Clean. Prod. 283, 124588. doi:10.1016/j.jclepro.2020.124588
Zhang, Y.-J., and Hao, J.-F. (2015). The Allocation of Carbon Emission Intensity Reduction Target by 2020 Among Provinces in China. Nat. Hazards 79, 921–937. doi:10.1007/s11069-015-1883-7
Zhang, Y., Li, S., Luo, T., and Gao, J. (2020). The Effect of Emission Trading Policy on Carbon Emission Reduction: Evidence from an Integrated Study of Pilot Regions in China. J. Clean. Prod. 265, 121843. doi:10.1016/j.jclepro.2020.121843
Zhou, B., Li, Z., Zhao, Y., Zhang, C., and Wei, Y. (2016). Rare Earth Elements Supply vs. Clean Energy Technologies: New Problems to Be Solve. Gospodarka Surowcami Mineralnymi - Mineral. Resour. Management 32 (4), 29–44. doi:10.1515/gospo-2016-0039
Keywords: carbon neutrality, carbon emission estimation, energy consumption, biological carbon sink, carbon trading
Citation: Tian Y, Xie D, Li T, Li J, Zhang Y, Jing H, Zhong D and Wang G (2021) Achieving Chinese Carbon Neutrality Based on Water–Temperature–Radiation–Land Coupling Use. Front. Environ. Sci. 9:740665. doi: 10.3389/fenvs.2021.740665
Received: 13 July 2021; Accepted: 07 September 2021;
Published: 22 October 2021.
Edited by:
Munesh Kumar, Hemwati Nandan Bahuguna Garhwal University, IndiaReviewed by:
Poyyamoli Gopalsamy, JSS Academy of Higher Education and Research, IndiaUttam Kumar Sahoo, Mizoram University, India
Copyright © 2021 Tian, Xie, Li, Li, Zhang, Jing, Zhong and Wang. This is an open-access article distributed under the terms of the Creative Commons Attribution License (CC BY). The use, distribution or reproduction in other forums is permitted, provided the original author(s) and the copyright owner(s) are credited and that the original publication in this journal is cited, in accordance with accepted academic practice. No use, distribution or reproduction is permitted which does not comply with these terms.
*Correspondence: Deyu Zhong, emhvbmdkeUB0c2luZ2h1YS5lZHUuY24=