 Ziqi Yin1
 Xin Fang2*
- 1Faculty of Information Technology, Macau University of Science and Technology, Macau, China
- 2School of Business, Macau University of Science and Technology, Macau, China
Air pollution forecasting, particularly of PM2.5 levels, can be used not only to deliver effective warning information to the public but also to provide support for decisions regarding the control and treatment of air pollution problems. However, there are still some challenging issues in air pollution forecasting that urgently need to be solved, such as how to handle and model outliers, improve forecasting stability, and correct forecasting results. In this context, this study proposes an outlier-robust forecasting system to attempt to tackle the abovementioned issues and bridge the gap in the current research. Specifically, the system developed consists of two parts that deal with point and interval forecasting, respectively. For point forecasting, a data preprocessing module is proposed based on outlier handling and data decomposition to mitigate the negative influences of outliers and noise, which can also help the model capture the main characteristics of the original time series. Meanwhile, an outlier-robust forecasting module is designed for better modeling of the preprocessed data. For the model to further improve its accuracy, a nonlinear correction module based on an error ensemble strategy is developed that can provide more accurate forecasting results. Finally, the interval forecasting part of the system is based on a newly proposed artificial intelligence–based distribution evaluation and the results of the point forecasting part to present the range of future changes. Experimental results and analysis utilizing daily PM2.5 concentration from two provincial capital cities in China are discussed to verify the superiority and effectiveness of the system developed, which can be considered an effective technique for point and interval forecasting of daily PM2.5 concentration.
Introduction
Urbanization, industrialization, and energy consumption have caused the issue of air pollution to become increasingly serious. The air pollution issue is considered a major concern (Andrade et al., 2015) and regarded as the single largest health risk (Wendel, 2014). It can have adverse effects on human beings and bring great economic losses as well as problems for society, affecting areas such as public health (Li et al., 2017), corporate cash holdings (Li et al., 2021), and the tourism industry (Hao et al., 2021). In this context, to solve air pollution issues and accelerate ecological progress, air pollution forecasting, particularly of PM2.5 (particulate matter with an aerodynamic diameter of 2.5 μm or less) levels, has been acknowledged as a promising technique for air pollution control and treatment (Liu et al., 2019a). However, the performance of air pollution forecasting suffers from many factors, and how to develop a model that can improve forecasting effectiveness is not only a challenging research topic but also a matter of growing concern. As a result, developing a more effective model for modeling PM2.5 concentration has become an imperative task that cannot be postponed (Yang et al., 2019a).
Over the past few decades, many studies have been conducted to propose an effective air pollution forecasting model. In general, the current air pollution forecasting models mainly belong to three categories, namely, the chemical transport method (CTM), the traditional statistical method, and the artificial intelligence method. In the first category, Timmermans et al. (2017) employed a kind of CTM method to analyze PM2.5 in China. Zhang et al. (2019) used the community multiscale air quality (CMAQ) method to analyze PM2.5 pollution events in Qingdao, China. Similarly, Fan et al. (2015) employed third-generation air quality modeling system Models-3/CMAQ to analyze air pollution episodes in one region of China. However, the forecasting performance of CTM methods is easily influenced by the scale and quality of the emissions data (Feng et al., 2015). Furthermore, Stern et al. (2008) suggested that due to incomplete descriptions of physical and chemical processes and limited knowledge of pollution sources, CTM models may produce poor forecasting results. In the traditional statistical method category, the widely employed statistical model mainly consists of an autoregressive integrated moving average (ARIMA) and regression method. Vlachogianni et al. (2011) employed a regression model for forecasting nitrogen oxides (NOx) and PM10 (particulate matter with an aerodynamic diameter of 10 μm or less). Zafra et al. (2017) developed an ARIMA model using hourly PM10 concentration data. However, the traditional statistical model is unable to extract the complex and nonlinear features of pollutant concentration data, which may result in undesirable results (Wang et al., 2020a). Fortunately, with the rapid development of advanced technologies, new methods, including artificial neural networks (ANN), support vector regression (SVR), extreme learning machines (ELM), and other artificial intelligence methods, have been proposed and are being widely employed in different forecasting fields, including air pollution forecasting. These novel methods are acknowledged as promising solutions to air pollution forecasting issues (Yang et al., 2019b).
However, all individual models, including artificial intelligence models, have their advantages and disadvantages. For instance, they may ignore the importance of data preprocessing and optimization and thus be unsuited to meet the requirements of decision-making and management. As a result, to overcome the deficiency of individual artificial intelligence methods and improve air pollution forecasting effectiveness, researchers have started to pay increasing attention to the development of hybrid models by hybridizing multifarious methods from individual forecasting models, mainly including data decomposition techniques (empirical mode decomposition (EMD) (Zhu et al., 2017), ensemble EMD (EEMD) (Bai et al., 2019), complementary EEMD (CEEMD) (Yang and Wang, 2017), fast EEMD (FEEMD) (Luo et al., 2018), complete EEMD with adaptive noise (CEEMDAN) (Hao and Tian, 2019), improved CEEMDAN (ICEEMDAN) (Sharma et al., 2020), variational mode decomposition (VMD) (Wu and Lin, 2019a), wavelet transform (WT) (Cheng et al., 2019), discrete WT (DWT) (Siwek and Osowski, 2012), stationary WT (SWT) (Bai et al., 2016), maximum overlap DWT (MODWT) (Prakash et al., 2011), wavelet packet decomposition (WPD) (Liu et al., 2019b), and empirical WT (EWT) (Liu and Chen, 2020), and so on) and artificial intelligence optimization (whale optimization algorithm (WOA) (Xu et al., 2017), bat algorithm (BA) (Wu and Lin, 2019b), modified grey wolf optimization (MGWO) (Xing et al., 2019), cuckoo search (CS) (Sun and Sun, 2017), multi-objective Harris hawks optimization (MOHHO) (Du et al., 2020), and so on). For example, Jiang et al. (2019) designed a hybrid system based on ICEEMDAN, imperialist competitive algorithm (ICA), and backpropagation neural network (BPNN) for pollutant forecasting. Similarly, Du et al. (2020) devised a hybrid model using ELM, MOHHO, and ICEEMDAN for air quality forecasting. The abovementioned hybrid forecasting studies prove the superiority of hybrid modeling, which has emerged as the most promising research direction in the air pollution forecasting field.
Although many hybrid models have been proposed for air pollution forecasting, there are still some challenging issues that urgently need to be solved. Specifically, as far as we are aware, most previous studies have employed data decomposition to improve forecasting performance while ignoring the significance of handling and modeling outliers in air pollution data, which may lead to the hybrid model being unable to further enhance the forecasting performance. Moreover, artificial intelligence optimization algorithms are used to search for the optimal parameters of methods in a hybrid model, but the forecasting ability can only be improved to a certain degree. Significantly, however, these studies ignore the time-consuming issues caused by incorporating artificial intelligence optimization algorithms, which may be unable to completely overcome the model’s limitations, i.e., the instability of the final results. Furthermore, most previous studies have emphasized the contribution of advanced data decomposition and optimization algorithms while ignoring the significance of mining the characteristics of the original air pollution time series and correcting forecasting results to further improve the model’s forecasting performance, despite the growing importance of air pollution forecasting performance. Moreover, another issue with air pollution forecasting, especially daily air pollution forecasting, is that it is mainly focused on point forecasting and thus can only provide deterministic information that is insufficient for real application and cannot provide uncertainty information. As far as we know, interval forecasting can make up for the defects of point forecasting, but this method has been ignored by the relevant researchers despite it being a novel research area that is especially deserving of attention.
In this study, to develop an effective model that overcomes the abovementioned limitations of most previous studies, a novel outlier-robust point and interval forecasting system is proposed for forecasting daily PM2.5 concentration, which is composed of two parts. The point forecasting part proposes a novel forecasting model based on a data preprocessing module, an outlier-robust forecasting module, and a nonlinear correction module to obtain future deterministic information, whereas the interval forecasting part is designed based on the newly proposed artificial intelligence–based distribution evaluation and point forecasting results to obtain future uncertainty information. Specifically, first, a data preprocessing module is proposed, which takes into consideration the significance of outlier handling and data decomposition, that can be employed to mitigate the negative effects of outlier and noise information so that the model developed can capture the main features and achieve better performance. Second, an outlier-robust forecasting module is designed, based on outlier-robust ELM (ORELM), to forecast preprocessed data. Next, a nonlinear correction module based on an error ensemble strategy is developed to mine information in the forecasting results and further improve the model’s forecasting performance. Finally, an artificial intelligence–based distribution evaluation method is designed in the interval forecasting part, which can be combined with the point forecasting results to provide a range of future changes. Case studies utilizing daily PM2.5 concentrations from two cities in China are designed to validate the developed system.
The main novelty and contribution of this study to current research can be summarized as follows:
(1) The forecasting focus of the system developed is not only on point forecasting but also on interval forecasting. Previous daily PM2.5 concentration forecasting studies mainly focused on point forecasting, which can provide deterministic information and is insufficient for real application, while ignoring the research about interval forecasting, which can provide uncertainty information. Therefore, an outlier-robust forecasting system that consists of point and interval forecasting is successfully proposed in this study, which can make up for the defects of point forecasting and is validated well in two cities in China.
(2) An improved data preprocessing module is designed to solve the outlier data and noise information issues simultaneously. Most previous studies only employed data decomposition for data preprocessing while ignoring the significance of outlier handling and modeling and failed to further enhance the forecasting performance. As a result, this study develops an improved data preprocessing module based on outlier handling and data decomposition that can effectively overcome the limitations caused by outlier and noise information.
(3) Point forecasting performance is further enhanced by proposing an outlier-robust forecasting module and a nonlinear correction module. In the daily PM2.5 concentration forecasting field, outlier modeling and forecasting result correction are of great importance but have been ignored by the relevant researchers. Thus, on the one hand, the outlier-robust forecasting module is designed to further solve the outlier modeling issue; on the other hand, a nonlinear correction module is developed based on an error ensemble strategy to mine information in the forecasting results and further enhance the model’s forecasting performance.
(4) Convincing experiments are designed to verify the effectiveness and superiority of the system developed. For system evaluation, five evaluation metrics are employed in the evaluation of point forecasting, whereas two typical metrics are used in the evaluation of interval forecasting. For model comparison, four experiments are designed to prove the effectiveness and superiority of outlier handling and modeling, data decomposition, nonlinear correction module, and the system developed in daily PM2.5 concentration forecasting.
The methods are presented in the Methodology section, next the construction of the outlier-robust point and interval forecasting system are discussed, then the Experimental Analysis section presents the experiments, and the final section draws the conclusions of this study.
Methodology
This section introduces the detailed methods used in the system developed, which includes a data preprocessing module, an outlier-robust forecasting module, a nonlinear correction module, artificial intelligence–based distribution evaluation, and interval forecasting theory.
Data Preprocessing Module
The data preprocessing module is proposed on the basis of outlier handling and data decomposition, which can overcome the limitations caused by outlier and noise information.
Outlier Handling
Outliers in the original time series data will have a negative influence on the development of a model, which may bring poor results. Therefore, in this study, an outlier handling algorithm, the Hampel filter (HF), is introduced into the data preprocessing module. HF, developed by Hampel (1974), is robust against outliers (Liu et al., 2004). A brief explanation of HF can be defined as follows (Wu et al., 2021).
Given a sequence x1, x2, …, xn,
where K is the sliding window’s half-width.
The new data obtained after using HF to handle the original sequence can be defined as
where t denotes a positive integer and Si denotes the median absolute deviation (MAD), which can be given by
Data Decomposition
Data decomposition, which has been acknowledged as a promising data preprocessing technique, has been widely used in forecasting fields to solve complex nonstationary, nonlinear time series forecasting issues. Numerous studies have shown that the data decomposition algorithm has a significant influence on forecasting performance. Thus, a suitable decomposition method should be selected to identify and extract the inner characteristics of the original time series. In previous studies, such as Lin et al. (2017) and Yang et al. (2019a), VMD, proposed by Dragomiretskiy and Zosso (2014), has been shown to be superior to other algorithms, including EMD, EEMD, and CEEMD. Therefore, VMD is introduced into the data preprocessing module to mitigate the negative noise information influence. The main procedure of VMD is as follows.
Step 1: setting parameters of VMD, while each mode
Step 2: yk and w are updated by
where n is the iterations number, f(t) and yk are the original time series and the kth component, whereas
Step 3: λ can be updated by
Step 4: if
Outlier-Robust Forecasting Module
The basic forecasting model is the important foundation of a hybrid model, which can make a significant difference in forecasting results. If outliers are present within the dataset, the performance of the model developed will be significantly affected. Considering the significance of outlier modeling and outlier robustness, the ORELM model is acknowledged as a potential contributor for modeling data with outliers. Therefore, the ORELM model is introduced into daily PM2.5 concentration forecasting to design an outlier-robust forecasting module. The original version of the ORELM model is ELM, developed by Huang et al. (2004), which has many merits, such as its simple structure, better performance, fast computation speed, and the fact that it does not need a large number of samples. Furthermore, previous studies have revealed that ELM methods are superior to some typical ANN methods in solving forecasting issues (Yang et al., 2019a), and it has become one of the most promising approaches.
Given a training dataset with M samples, i.e., (xt, yt), t = 1,
where L denotes the number of hidden layer nodes, wi and bi denote the input weight and hidden bias, G is the excitation function,
By defining the hidden layer output matrix, i.e., H,
The ELM model presented in Eq. 8 can be rewritten as
where
The optimal solution of
where
As mentioned above, to enhance the ELM model’s robustness when modeling data with outliers, the ORELM model is developed by Zhang and Luo (2015). The core idea is redefining the minimum problem as
where e represents training error and k is the regularization parameter.
To solve the newly defined problem, the augmented Lagrange multiplier (ALM) algorithm is adopted, and the corresponding iteration process is defined as
where
Nonlinear Correction Module
For a forecasting model, forecasting error is inevitable, but the short-term trend in the variation of the forecasting error can be anticipated by establishing a nonlinear model (Vukicevic, 1991). To further improve the performance of the system developed, a nonlinear correction module based on an error ensemble strategy is developed to mine information in the forecasting results, which is composed of three steps.
Step 1: generating the error sequence
Defining the actual value of the t th datum as A(t) and forecasting the value of the t th datum as F(t), the forecasting error value of the t th datum can be obtained by
Step 2: developing the error forecasting model
Defining the error value of the t−d th datum as E(t−d), according to the detailed error sequence, the forecasting model can be developed and denoted as f. The error forecasting value of the t th datum, named EF(t), can be obtained by
Step 3: correcting the forecasting results
To obtain a final result on the basis of the original forecasting results and corresponding error forecasting results, an error ensemble strategy based on ORELM is proposed, which fully exploits the advantages of ORELM and is equipped with outlier robustness. By developing an outlier-robust ensemble model, denoted as En.f, the final forecasting results of the t th datum, i.e., FF(t), are
Artificial Intelligence–Based Distribution Evaluation
Distribution evaluation plays a vital role in many fields, such as wind energy evaluation, time series analysis, and interval forecasting. In recent years, in order to further mine data characteristics, researchers have focused on applying different distribution functions to fit the experimental data and obtain a suitable distribution; then, the interval forecasting results can be obtained according to the interval forecasting theory and point forecasting results. However, to the best of our knowledge, the related research is well validated in many fields, but so far, few studies have involved research on or application to daily PM2.5 concentration forecasting. In this context, four typical distributions, i.e., Weibull, Gamma, Rayleigh, and Lognormal, are introduced in this study to fit the daily PM2.5 concentration data. In general, the goodness of fit (0 ≤ R2 ≤ 1) was employed to measure the fitting performance of one distribution. Traditionally, the maximum likelihood estimation (MLE) method is used to estimate the distribution function’s parameters. However, the MLE method may not obtain the optimal distribution parameters. To the best of our knowledge, the larger the R2 value, the more optimal the distribution. As a result, the optimal distribution determination problem can be converted into solving the maximum value problem. Inspired by Wang et al. (2020b), Schwarz et al. (2020), and Ließ et al. (2021), artificial intelligence optimization can be considered a promising technique for searching for the optimal distribution parameters. Based on this idea and considering the limitations of the traditional method, the artificial intelligence–based distribution evaluation is proposed to obtain the optimal distribution in this study. In order to obtain the optimal distribution, specifically, an advanced optimization algorithm named grey wolf optimizer (GWO) is adopted to search for the optimal parameters of specific distribution by maximizing the values of R2. In this study, the minus R2 is defined as the objective function of GWO-based distribution evaluation. Finally, the distribution with the best R2 value among all distributions is selected as the optimal distribution of PM2.5, which can be combined with interval forecasting theory to achieve interval forecasting.
Interval Forecasting Theory
Given the significance level
For a random variable time series, Eq. 19 can be rewritten as
Supposing that the forecasting value has a similar distribution function, the estimated variance can be determined, and then the following conditional probability formula can be obtained as
The lower and upper limits can be obtained by
Construction of the Outlier-Robust Forecasting System
The outlier-robust point and interval forecasting system is constructed in this section; the details of the system design and system evaluation are as follows.
System Design
The system design is composed of the point forecasting part and the interval forecasting part, which can provide deterministic information and uncertainty information in the future, respectively.
Point Forecasting
The point forecasting part is developed based on three modules, i.e., a data preprocessing module, an outlier-robust forecasting module, and a nonlinear correction module, and consists of three phases as follows.
◆ Phase I: data preprocessing. Considering the negative influence of outlier data and noise information in original daily PM2.5 concentration data, a data preprocessing module is designed based on outlier handling and data decomposition that can effectively solve the outlier data and noise information issues simultaneously. Specifically, on the one hand, the HF algorithm is employed to detect and correct the outliers in the original data, which can eliminate the outliers’ negative influence on the model’s development from the perspective of improving data quality. On the other hand, the advanced data decomposition method named VMD is performed to decompose the processed data into a number of modes, which can eliminate the noise’s negative effect on the model’s performance from the perspective of signal denoising and helps the model effectively capture the main features of the daily PM2.5 concentration data.
◆ Phase II: forecasting preprocessed data. In this phase, some modes obtained in Phase I are forecasted, and then, the forecasting results can be obtained. As a result, it is necessary to select a suitable model for preprocessed data forecasting. Most previous studies tended to develop an optimized ANN model for mode forecasting while ignoring the instability parameter setting problem of artificial intelligence optimization algorithms, which not only cannot guarantee the forecasting model’s stability but also bring time-consuming issues. In this context, the ORELM model, with its simple structure, high forecasting performance, and fast calculation speed, better forecasting ability than some typical ANN models, and better outlier robustness than the original ELM model, is selected to design the outlier-robust forecasting module to obtain the future value of each mode, and finally, by summing the forecasting results of each mode, the results of daily ahead PM2.5 concentration forecasting can be achieved.
◆ Phase III: forecasting results correction. Most previous studies have focused on using data decomposition and optimization to enhance forecasting ability while ignoring the significance of forecasting results correction. Therefore, in this phase, a nonlinear correction module based on an error ensemble strategy is designed to mine information in the forecasting results and thereby enhance the model’s performance, which is composed of three steps, i.e., generating an error sequence, developing an error forecasting model, and correcting the forecasting results. Following these three steps, the results of the point forecasting can be obtained; these results can provide deterministic information in the future.
Interval Forecasting
The interval forecasting part is developed based on the previous point forecasting results, artificial intelligence–based distribution evaluation, and interval forecasting theory and consists of two phases as follows.
◆ Phase I: distribution evaluation. Distribution evaluation is the crucial basis of the interval forecasting part, whereas the traditional MLE method may not fit the optimal distribution for a specific PM2.5 concentration dataset. In order to solve this issue, an artificial intelligence–based distribution evaluation is proposed to obtain the optimal distribution. Specifically, the advanced optimization algorithm named GWO is selected to search the parameters of four typical distributions, i.e., Weibull, Gamma, Rayleigh, and Lognormal. Finally, the distribution function with the best R2 is considered the optimal distribution.
◆ Phase II: obtaining interval forecasting results. According to the point forecasting results, the interval forecasting results are estimated using the optimal distribution determined in Phase I and interval forecasting theory, which can provide uncertainty information in the future.
System Evaluation
This section is designed to provide system evaluation metrics, including point forecasting evaluation and interval forecasting evaluation.
Point Forecasting Evaluation
To evaluate the forecasting performance of the system developed for daily PM2.5 concentration point forecasting, the three typical metrics listed in Table 1 are selected in this study.
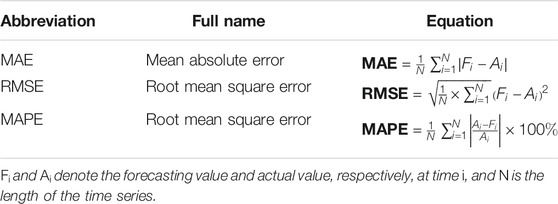
TABLE 1. Three typical metrics.
In addition to evaluating the forecasting accuracy using these three typical evaluation metrics, to measure the similarity of the forecasting value curve and actual value curve, grey relational analysis (GRA) (Wang et al., 2015) is introduced into point forecasting evaluation, which provides a new metric named grey relational degree (GRD) for further analysis. Moreover, forecasting stability is another important metric in practical application. Thus, a metric named variance ratio (VR) (Yang and Wang, 2017) is introduced into the point forecasting evaluation, which can measure the forecasting stability of different models by considering the variance between the actual and the forecast values.
Interval Forecasting Evaluation
To evaluate the interval forecasting performance, two widely used metrics named forecasting interval coverage probability (FICP) and forecasting interval normalized average width (FINAW) are introduced into the interval forecasting evaluation. Specifically, the FICP indicator is selected to measure the probability that the actual observation value falls into the forecasting interval, which can reflect the reliability of the interval forecasting results. The larger the FICP value, the higher the interval forecasting accuracy. Furthermore, to avoid the excessive pursuit of the reliability of interval forecasting while ignoring the effective measure of interval forecasting width for interval forecasting results, FINAW is employed to express the width of interval forecasting results. The FICP and FINAW can be calculated by
where
where Ui and Li denote the forecasting interval’s upper and lower limits, respectively, at time i, and R is the range of actual values.
Experimental Analysis
The experiments and analysis are presented in this section, which is mainly composed of data description, experiment design, and four detailed experiments.
Data Description
To validate the ability of the outlier-robust system developed to perform point forecasting and interval forecasting of daily PM2.5 pollution, Jinan and Zhengzhou are considered as the study areas; two datasets collected from these two study areas are used as illustrative empirical studies in this study. Jinan, the capital city of Shandong Province, is located in the middle of China. Zhengzhou, the capital city of Henan Province, is located in the middle part of the Yellow River. Specifically, two daily PM2.5 concentration datasets, covering 1 yr from July 1, 2017, to June 30, 2018, are employed in this study. In the experiment, the data, from July 1, 2017, to May 31, 2018, are employed as training data for the development of the proposed system, whereas the data from June 1, 2018, to June 30, 2018, are considered as testing data to test the forecasting performance of the system developed.
Experiment Design
As mentioned above, in this study, an outlier-robust point and interval forecasting system is developed, which is composed of a data preprocessing module, an outlier-robust forecasting module, a nonlinear correction module, artificial intelligence–based distribution evaluation, and interval forecasting theory to obtain future deterministic information and uncertainty information about daily PM2.5 pollution. To verify the forecasting superiority of the system developed, sufficient empirical research should be carried out. In addition to comparing the performance of the system developed with that of the other types of forecasting models, the contribution of each component proposed or employed in the system developed should also be proved by designing appropriate comparative studies. For this purpose, this study designs four experiments to conduct a convincing evaluation of the system developed. Specifically, in Experiment I, the effectiveness of outlier handling and modeling in the system developed is verified from the perspectives of data preprocessing and model selection. In Experiment II, the effectiveness of data decomposition in the system proposed is compared with other decomposition algorithm–based models and a model without a decomposition preprocess. In Experiment III, a nonlinear correction module is developed to correct the forecasting results, which is designed to compare the proposed system with the model without correcting the process and the model with a simple error-addition strategy. It should be noted that the experiments for each model in Experiments I–III are carried out 100 times in this study, and the average values of the forecasting results are considered the final forecasting results for practical application and model comparison, which can ensure that the system developed is more reliable, accurate, and independent of random factors to some extent. In Experiment IV, different distributions of daily PM2.5 concentration are compared to obtain the optimal distribution, and the interval forecasting results based on point forecasting are obtained and evaluated by two typical metrics.
Experiment I: The Effectiveness of Outlier Handling and Modeling
To evaluate the effectiveness of outlier handling and modeling, eight models, i.e., ELM, regularized ELM (RELM), weighted RELM (WRELM), ORELM, HF-ELM, HF-RELM, HF-WRELM, and HF-ORELM, are proposed and tested. The MAE, RMSE, MAPE, VR, and GRD values of these eight models are shown in Table 2. Meanwhile, the results of the different models in the two cities are depicted in Figures 1, 2, which indicate that the ORELM model is superior to ELM, RELM, and WRELM, whereas the HF-ORELM model is superior to the seven other models. As shown in Table 2, two types of comparison can be designed based on these eight models. Comparison I compares the forecasting results of the ELM (HF-ELM), RELM (HF-RELM), WRELM (HF-WRELM), and ORELM (HF-ORELM) models. Meanwhile, Comparison II compares the forecasting results of the ORELM and HF-ORELM models (or ELM and HF-ELM, or RELM and HF-RELM, or WRELM and HF-WRELM). In other words, transverse comparison and longitudinal comparison can be conducted according to the metric values in Table 2. The detailed comparisons are as follows:
1) In Comparison I, by comparing the ORELM (HF-ORELM) with ELM (HF-ELM), RELM (HF-RELM), and WRELM (HF-WRELM), it can be observed that the ORELM model is superior to the ELM, RELM, and WRELM models, whereas the HF-ORELM model is superior to the HF-ELM, HF-RELM, and HF-WRELM models. For example, for daily PM2.5 concentration forecasting in Jinan, the ORELM model has a lower MAPE value of 28.6266%, compared to the MAPE values of 31.5740%, 31.8239%, and 30.9697% for the ELM, RELM, and WRELM models, respectively. Furthermore, for daily PM2.5 concentration forecasting in Zhengzhou, the HF-ORELM model achieves the best MAPE value of 25.9379% compared to the MAPE values of 30.4850%, 30.5535%, and 28.8852% for the HF-ELM, HF-RELM, and HF-WRELM models, respectively. The differences in the model forecasting results compared illustrate that the ORELM model is more powerful and robust than the other models for daily PM2.5 concentration forecasting. Therefore, we can reasonably conclude that the ORELM model will make a great contribution to the final successful modeling; therefore, it can be selected as the basic forecasting model for the outlier-robust forecasting system.
2) In Comparison II, the forecasting results of models with outlier handling and those of models without outlier handling can be compared to evaluate the effectiveness of outlier handling in the proposed data preprocessing module. By comparing the forecasting results of the ORELM and HF-ORELM model (or ELM and HF-ELM, or RELM and HF-RELM, or WRELM and HF-WRELM), it can be observed that the HF-based model is superior to the models without outlier handling. For example, the MAPE values of HF-ELM, HF-RELM, HF-WRELM, and HF-ORELM for daily PM2.5 concentration forecasting in Jinan are 30.1351%, 29.9125%, 29.0110%, and 26.1079%, whereas the corresponding models without outlier handling have larger MAPE values, i.e., ELM (31.5740%), RELM (31.8239%), WRELM (30.9697%), and ORELM (28.6266%). The differences between the forecasting results of the ORELM and HF-ORELM models, ELM and HF-ELM, RELM and HF-RELM, WRELM and HF-WRELM reveal that outlier handling is of great importance for daily PM2.5 concentration forecasting, which can be combined with data decomposition to design the data preprocessing module to further improve forecasting performance.
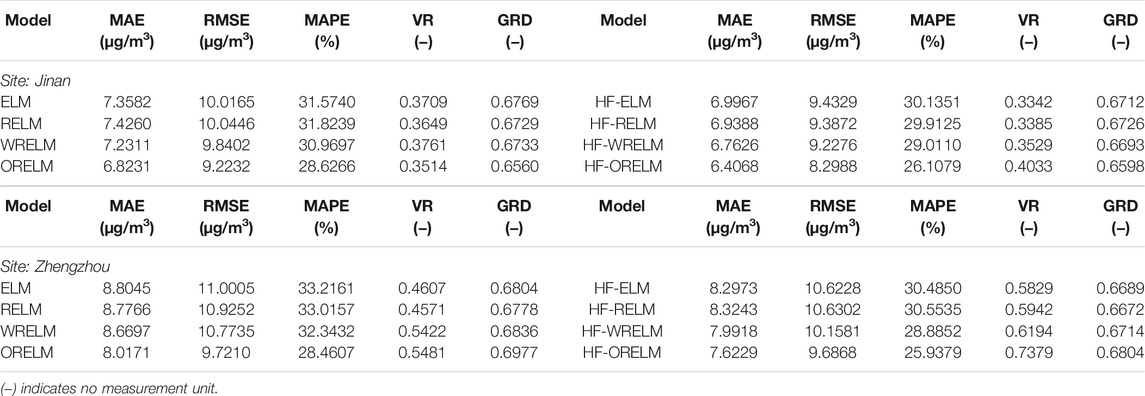
TABLE 2. Forecasting results of four individual models and HF-based models.
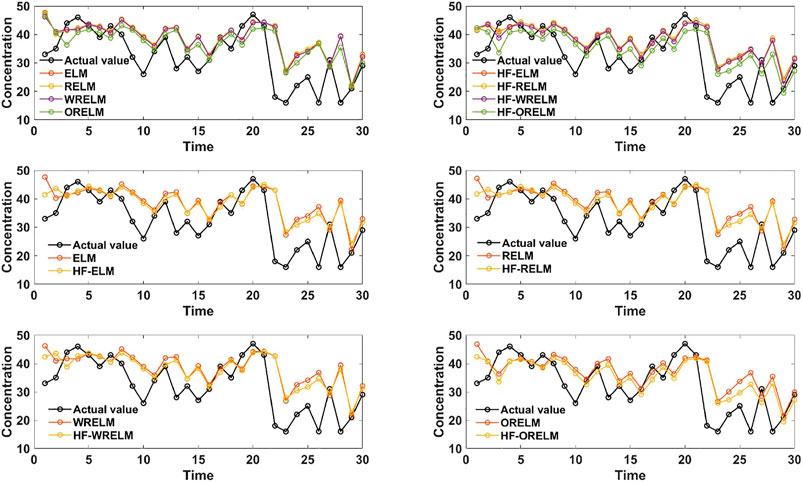
FIGURE 1. Forecasting results of different comparative studies in Jinan.
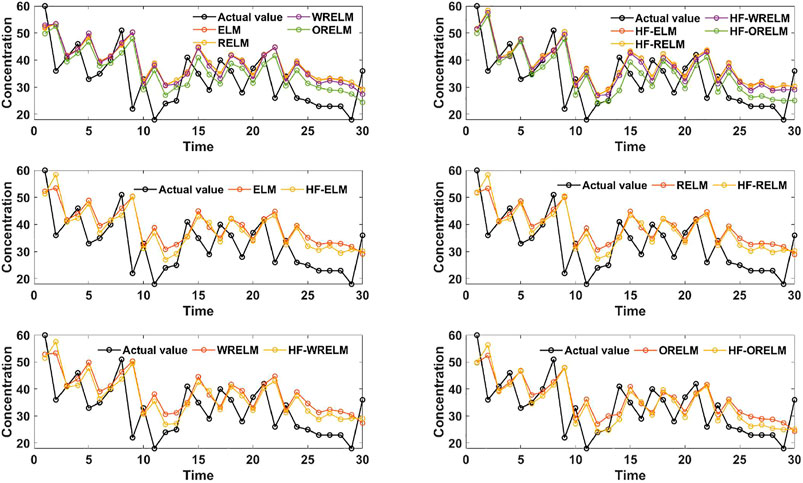
FIGURE 2. Forecasting results of different comparative studies in Zhengzhou.
Summary: by taking Zhengzhou as an example, the improvement percentage values of MAPE between the different models are employed to summarize the contribution and effectiveness of outlier handling and modeling in this study. The detailed results are 8.2222% (HF-ELM vs ELM), 7.4577% (HF-RELM vs RELM), 10.6916% (HF-WRELM vs WRELM), 8.8642% (HF-ORELM vs ORELM), 14.3166% (ORELM vs ELM), 13.7965% (ORELM vs RELM), and 12.0041% (ORELM vs WRELM). It can be concluded that the HF algorithm and ORELM model are suitable for outlier handling and modeling, which make a great contribution to the success of the system developed in this study.
Experiment II: The Effectiveness of Data Decomposition
To verify the contribution of data decomposition in the proposed data preprocessing module and the superiority of the forecasting results of the outlier-robust forecasting module developed, four models, i.e., HF-ORELM, HF-EMD-ORELM-S, HF-EEMD-ORELM-S, and HF-VMD-ORELM-S, are developed and compared in Jinan and Zhengzhou. In detail, the HF-EMD-ORELM-S, HF-EEMD-ORELM-S, and HF-VMD-ORELM-S employ different data decomposition algorithms to decompose the data after outlier handling into some modes, and the simple addition way is used to add all modes’ forecasting results to obtain the daily PM2.5 concentration forecasting results. The MAE, RMSE, MAPE, VR, and GRD values of HF-ORELM, HF-EMD-ORELM-S, HF-EEMD-ORELM-S, and HF-VMD-ORELM-S are shown in Table 3. Moreover, the forecasting results of these four models in the two cities are shown in Figure 3, which indicates that the HF-VMD-ORELM-S model is superior to the original HF-ORELM model and the EMD- or EEMD-based HF-ORELM model. In this experiment, two comparisons can be designed as follows:
1) Comparison I is proposed to validate the superiority of the data decomposition algorithm in the system developed by comparing the HF-VMD-ORELM-S with other decomposition method–based forecasting models, i.e., HF-EMD-ORELM-S and HF-EEMD-ORELM-S. It can be observed that the HF-EMD-ORELM-S model obtains worse forecasting performance compared with the EEMD- and VMD-based models, whereas the VMD-based model achieves better forecasting performance compared with the EMD- and EEMD-based models. For example, for daily PM2.5 concentration forecasting in Zhengzhou, the MAE, RMSE, MAPE, VR, and GRD values of HF-VMD-ORELM-S are 1.1259, 1.5228, 3.8169%, 0.9523, and 0.9222, respectively, whereas the metric values of HF-EMD-ORELM-S are 4.2089, 5.9923, 14.1646%, 0.9024, and 0.7705, and the values of HF-EEMD-ORELM-S are 2.1140, 2.7875, 7.0637%, 0.8161, and 0.8652. It is obvious that there are significant differences in the forecasting power of these three models, which further demonstrates the significance of selecting a suitable data decomposition algorithm for the data preprocessing module and the system developed. Therefore, in this study, the VMD algorithm is combined with outlier handling to design the data preprocessing module, which also makes great contributions to the success of the system developed.
2) Comparison II is designed to verify the superiority of the outlier-robust forecasting module developed in daily PM2.5 concentration forecasting. In Experiment I, the superiority of HF-ORELM over ORELM has been proven, which means the outlier handling is an indispensable part of the forecasting system developed. Against this background, there is no need to compare the proposed outlier-robust forecasting module’s results with those of the individual ORELM model. As a result, in Comparison II, the outlier-robust forecasting module is compared with the HF-ORELM model to prove the contribution of the VMD algorithm. From Table 3, it can be observed that the HF-VMD-ORELM-S model performs better than the HF-ORELM model in terms of MAE, RMSE, MAPE, VR, and GRD. For example, in comparison with the HF-ORELM model, the proposed HF-VMD-ORELM-S model presents an improvement from (6.4068, 8.2988, 26.1079%, 0.4033, and 0.6598) to (1.1259, 1.5228, 3.8169%, 0.9523, and 0.9222) in terms of MAE, RMSE, MAPE, VR, and GRD in Jinan. The results prove that the forecasting ability of the HF-VMD-ORELM-S model is superior to the benchmark model, which can provide a better basis for the success of the system developed.
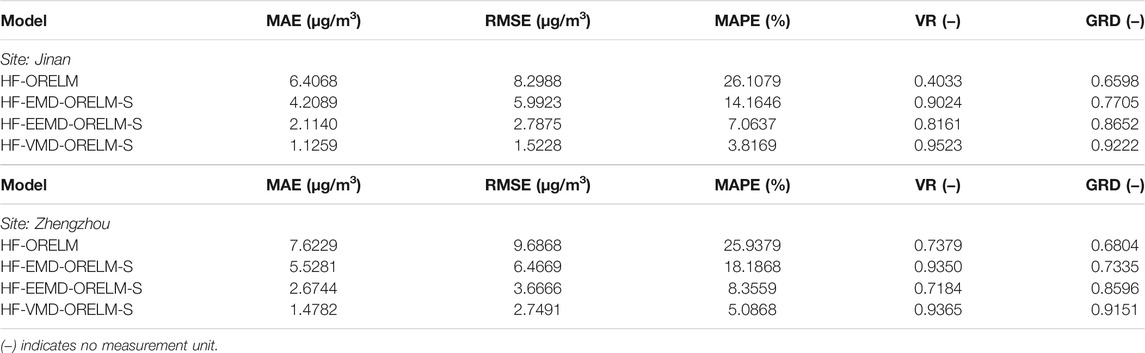
TABLE 3. Forecasting results of HF-ORELM and HF-ORELM with different data decompositions.
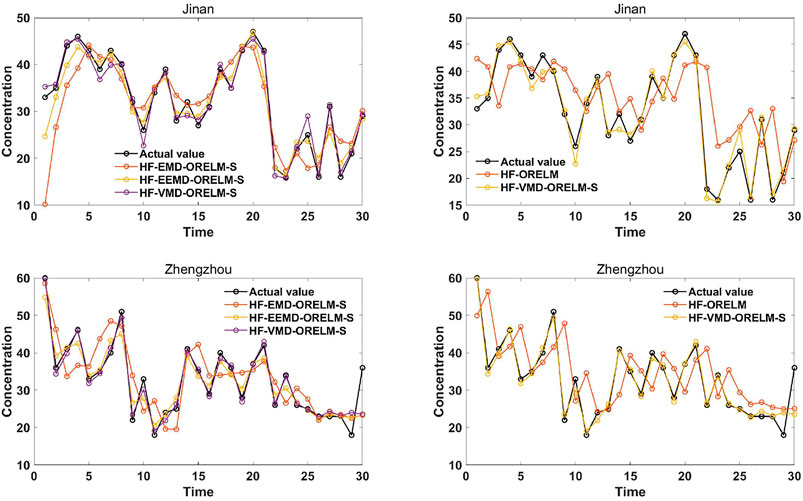
FIGURE 3. Forecasting results of HF-ORELM with/without data decomposition.
Summary: by taking Jinan as an example, the improvement percentage values of MAPE between different models are employed to summarize the contribution and effectiveness of data decomposition in this study. The detailed results are 85.3803% (HF-VMD-ORELM-S vs HF-ORELM), 73.0532% (HF-VMD-ORELM-S vs HF-EMD-ORELM-S), 45.9646% (HF-VMD-ORELM-S vs HF-EEMD-ORELM-S), 45.7459% (HF-EMD-ORELM-S vs HF-ORELM), and 72.9442% (HF-EEMD-ORELM-S vs HF-ORELM). It can be concluded that the VMD algorithm is superior to the EMD and EEMD algorithms and is a promising technique for daily PM2.5 concentration decomposition, which can also make a great contribution to the success of the system developed.
Experiment III: The Effectiveness of the Nonlinear Correction Module
As mentioned above, the third module, named the nonlinear correction module, is proposed to correct the results of the outlier-robust forecasting module to further improve the daily PM2.5 concentration forecasting performance. To prove the superiority and effectiveness of the proposed nonlinear correction module and the system developed for point forecasting, the performance of the point forecasting part developed, i.e., HF-VMD-ORELM+EnError, is compared with HF-VMD-ORELM-S and HF-VMD-ORELM+Error in this section. In detail, the HF-VMD-ORELM-S model without a correcting process is the best model in Experiment II, which can provide the results of the devised forecasting module, whereas the HF-VMD-ORELM+Error model is a model with a simple error-addition strategy. The MAE, RMSE, MAPE, VR, and GRD values of the system developed, HF-VMD-ORELM-S, and HF-VMD-ORELM+Error are listed in Table 4; meanwhile, the results of these three models are shown in Figure 4. Based on Experiment III, the following conclusions can be obtained:
1) The HF-VMD-ORELM+Error model performs better than HF-VMD-ORELM-S model in Jinan but performs worse than HF-VMD-ORELM+Error in Zhengzhou, which indicates that the simple error-addition strategy cannot guarantee the effectiveness of error correction. Therefore, how to correct the forecasting results is a challenging issue in forecasting fields. In other words, the method of correcting forecasting results plays a vital role in the success of the system developed. In this context, a nonlinear correction module based on an error ensemble strategy is presented to further improve the model’s forecasting performance.
2) By comparing the HF-VMD-ORELM+EnError model and the HF-VMD-ORELM+Error model, it can be found that the main difference between these two models is the forecasting results correcting method. As shown in Table 4, the forecasting results obtained by the system developed are better than those obtained by the HF-VMD-ORELM+Error model, with the MAE, RMSE, MAPE, VR, and GRD values in Jinan and Zhengzhou being (1.0744, 1.5525, 3.5736%, 0.9648, and 0.9228), and (1.3841, 2.7134, 4.8328%, 0.9439, and 0.9193), respectively. Therefore, the HF-VMD-ORELM+EnError model performs better than the HF-VMD-ORELM+Error model, which proves the superiority of the nonlinear correction module based on an error ensemble strategy.
3) The contribution of the proposed nonlinear correction module and the superiority of the system developed can be measured by comparing the point forecasting results of the system developed with those of the HF-VMD-ORELM-S model. As shown in Table 4, in comparison with the HF-VMD-ORELM-S model, the proposed system presents an improvement from (1.4782, 2.7491, 5.0868%, 0.9365, and 0.9151) to (1.3841, 2.7134, 4.8328%, 0.9439, and 0.9193) in terms of MAE, RMSE, MAPE, VR, and GRD in Zhengzhou. In previous experiments, the superiority of the HF-VMD-ORELM-S model over other benchmark models has been proven. Therefore, considering the system developed performs better than HF-VMD-ORELM-S, we can conclude that the system designed in this study is superior to other models and can be widely employed in daily PM2.5 concentration forecasting.
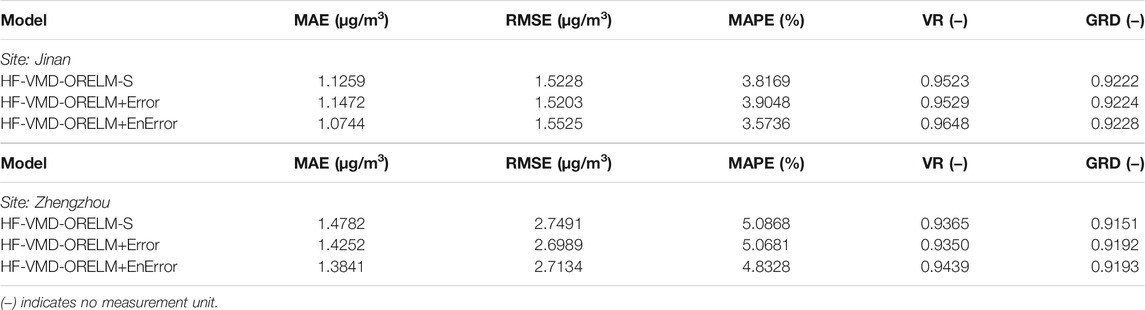
TABLE 4. Metrics of the system developed and compared models.
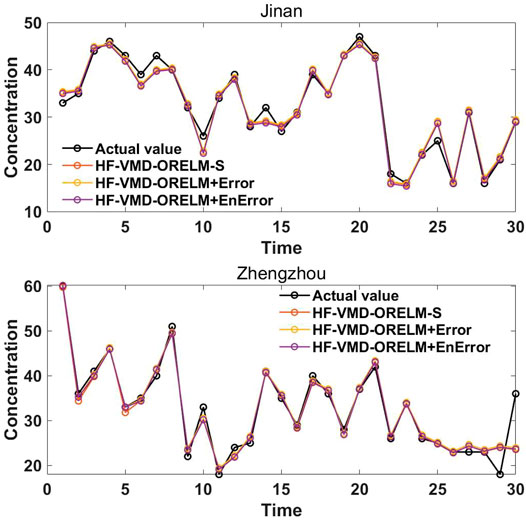
FIGURE 4. Forecasting results of the system developed and compared models in Jinan and Zhengzhou.
Summary: by taking the MAPE metric as an example, the improvement percentage values between different models are employed to summarize the contribution and effectiveness of the nonlinear correction module in this study. The detailed results for Jinan are 6.3743% (HF-VMD-ORELM+EnError vs HF-VMD-ORELM-S), 8.4819% (HF-VMD-ORELM+EnError vs HF-VMD-ORELM+Error), and −2.3029% (HF-VMD-ORELM+Error vs HF-VMD-ORELM-S), whereas the values for Zhengzhou are 4.9933% (HF-VMD-ORELM+EnError vs HF-VMD-ORELM-S), 4.6428% (HF-VMD-ORELM+EnError vs HF-VMD-ORELM+Error), and 0.3676% (HF-VMD-ORELM+Error vs HF-VMD-ORELM-S). It can be concluded that the proposed nonlinear correction module is not only effective for improving the final forecasting results but also is superior to the HF-VMD-ORELM+Error model. Furthermore, the HF-VMD-ORELM+Error model may perform worse than the HF-VMD-ORELM-S model. In other words, the proposed nonlinear correction module is suitable for correcting forecasting results, which can contribute to improving the performance of the system developed.
Experiment IV: Interval Forecasting
In the system developed, the interval forecasting can be achieved by the proposed interval forecasting part according to the results of the point forecasting part, artificial intelligence–based distribution evaluation, and interval forecasting theory. In order to perform the interval forecasting, a distribution evaluation of daily PM2.5 concentration data is conducted. As mentioned above, the traditional MLE method may not obtain the optimal distribution function for a specific PM2.5 concentration dataset, whereas artificial intelligence optimization is a powerful technique for determining the optimal distribution. Therefore, in this study, the advanced optimization algorithm named GWO is selected to fit four typical distributions, i.e., Weibull, Gamma, Rayleigh, and Lognormal. In order to prove the superiority of GWO, detailed distribution is also determined by MLE, and the parameters and R2 values provided by MLE and GWO are presented in Table 5. Furthermore, the comparison is also depicted in Figure 5.
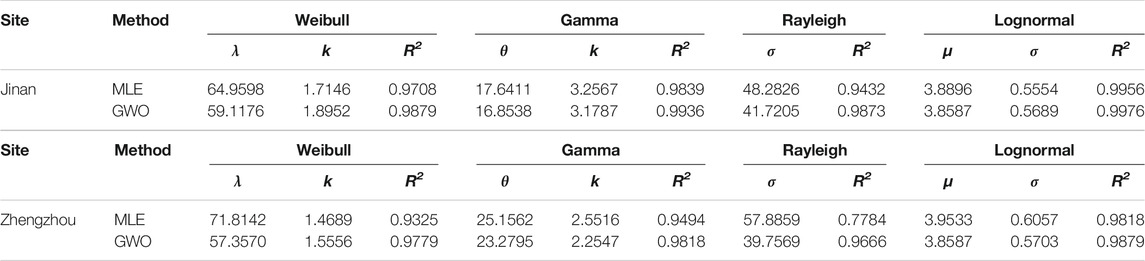
TABLE 5. Distribution parameters and R2 provided by MLE and GWO.
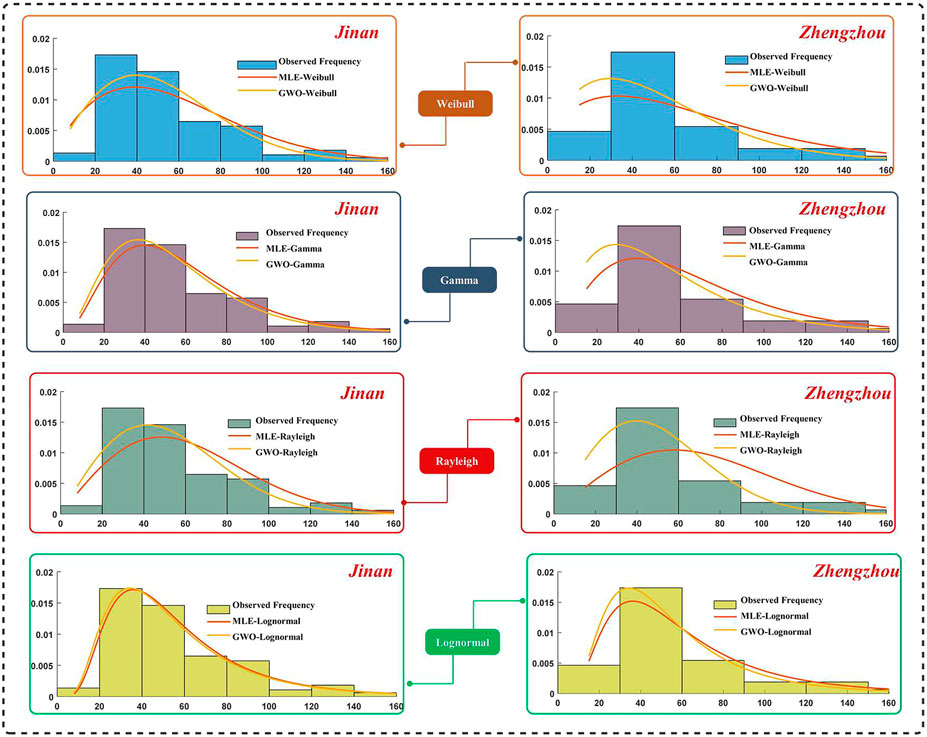
FIGURE 5. Distribution results provided by MLE and GWO.
On the basis of Table 5 and Figure 5, we find that the GWO-based distribution evaluation can obtain the best R2 values for each distribution function, which indicates that the GWO-based distribution evaluation is superior to the MLE method and is suitable for fitting the detailed distribution. As a result, the results of the GWO-based distribution evaluation can be compared by R2. As shown in Table 5, the R2 values of Weibull, Gamma, Rayleigh, and Lognormal are (0.9879, 0.9936, 0.9873, and 0.9976) and (0.9779, 0.9818, 0.9666, and 0.9879) in Jinan and Zhengzhou, respectively. It can be observed that the Lognormal distribution achieves the largest R2, which means that the Lognormal distribution can effectively fit the daily PM2.5 concentration data in Jinan and Zhengzhou. Thus, the optimal Lognormal distribution obtained can be combined with the point forecasting results and interval forecasting theory to achieve the final interval forecasting.
The interval forecasting results under different significance levels are depicted in Figure 6, and the corresponding evaluation metric values are listed in Table 6. From Table 6, we can find that the interval forecasting performances for Jinan and Zhengzhou are different at the same significance level. For example, when α = 0.30, the FINAW and FICP values for Jinan and Zhengzhou are (0.6268, 100.0000%) and (0.4695, 96.6667%), respectively. The main reasons for this phenomenon are that the interval forecasting performance largely depends on the point forecasting performance. As the system developed has achieved excellent point forecasting performance, it has also achieved ideal interval forecasting results. Moreover, for the same dataset, the FINAW and FICP values under five significance levels are different. For instance, for the Zhengzhou dataset, the FINAW and FICP values for α = 0.20 and α = 0.25 are (0.7711, 100.0000%) and (0.6097, 96.6667%), respectively. Furthermore, the solid lines represent the actual values, and the shaded areas represent the forecasting intervals in Figure 6. Obviously, as most of the observations fall into the shaded area, the interval forecasting ability of the system established can be considered effective and good. According to the abovementioned analysis and discussion, we can reasonably conclude that the system developed can be a promising tool for daily PM2.5 concentration interval forecasting.
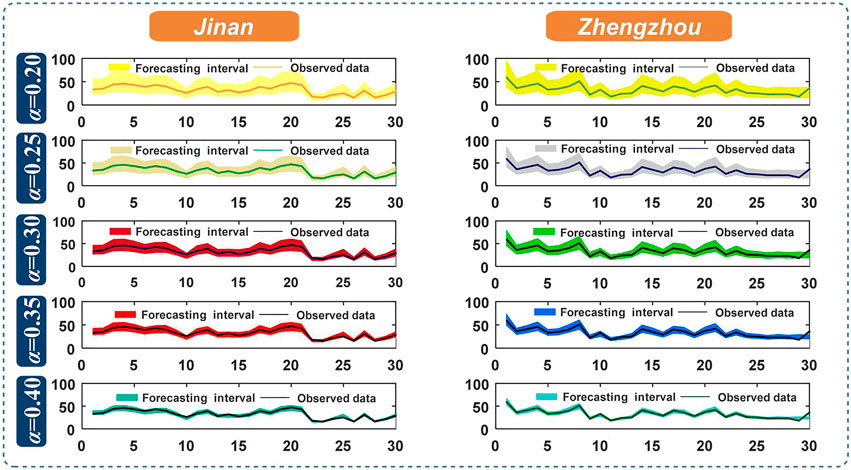
FIGURE 6. Results of interval forecasting in Jinan and Zhengzhou.
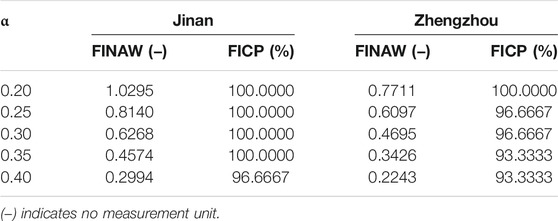
TABLE 6. Results of interval forecasting based on different significance levels.
Conclusion
Forecasting air pollution is not only a challenging research topic but also a growing concern. To model and forecast the complex PM2.5 concentration time series, in this study, a novel outlier-robust point and interval forecasting system is developed, which attempts to mitigate or solve some of the challenges in current studies. In the system developed, the point forecasting part is designed to provide future deterministic information on daily PM2.5 concentration, whereas the interval forecasting part is devised to present future uncertainty information. More specifically, three modules, named the data preprocessing module, the outlier-robust forecasting module, and the nonlinear correction module, are proposed in the point forecasting part. The data preprocessing module, considering the negative influence of outliers and noise on the development of the model, is designed on the basis of outlier handling and data decomposition for the purpose of solving the outlier data and noise information issues simultaneously. Moreover, in order to obtain a forecasting model with outlier robustness, the ORELM model with superior performance is selected to design the outlier-robust forecasting module to forecast each mode. Furthermore, the nonlinear correction module is developed based on an error ensemble strategy, which can mine information in the forecasting results and further improve the model’s forecasting performance. Afterward, the interval forecasting part is developed based on artificial intelligence–based distribution evaluation and interval forecasting theory, which can be incorporated with the point forecasting results to obtain the range of future changes. The experimental results illustrate that the system developed can not only perform better than other compared models in point forecasting but also provide uncertainty information in the future. Moreover, outside the field of daily PM2.5 concentration forecasting, the system developed can also be employed to solve other challenging issues, including energy forecasting, economic forecasting, and financial forecasting.
Although the system developed shows better performance in daily PM2.5 concentration forecasting, there are still some limitations that must be considered in future research. For example, other features neglected in this study may make the forecasting more reliable and practical and can further improve the forecasting performance, which can be a promising subject for future studies. Moreover, only 1-day-ahead forecasting is conducted by the system developed; how to achieve multi-day-ahead forecasting is of great importance and worth studying but is still a challenging task. As a result, further studies about multi-day-ahead point and interval forecasting for PM2.5 concentration can be considered an important research direction in future studies.
Data Availability Statement
Publicly available datasets were analyzed in this study. This data can be found here: China Air Quality Online Monitoring and Analysis platform (https://www.aqistudy.cn).
Author Contributions
ZY and XF conducted the research.
Conflict of Interest
The authors declare that the research was conducted in the absence of any commercial or financial relationships that could be construed as a potential conflict of interest.
Publisher’s Note
All claims expressed in this article are solely those of the authors and do not necessarily represent those of their affiliated organizations, or those of the publisher, the editors and the reviewers. Any product that may be evaluated in this article, or claim that may be made by its manufacturer, is not guaranteed or endorsed by the publisher.
Acknowledgments
The authors are grateful to the reviewers and the editor for their constructive comments and suggestions for this paper.
References
Andrade, M. d. F., Ynoue, R. Y., Freitas, E. D., Todesco, E., Vara Vela, A., Ibarra, S., et al. (2015). Air Quality Forecasting System for Southeastern Brazil. Front. Environ. Sci. 3, 9. doi:10.3389/fenvs.2015.00009
Bai, Y., Li, Y., Wang, X., Xie, J., and Li, C. (2016). Air Pollutants Concentrations Forecasting Using Back Propagation Neural Network Based on Wavelet Decomposition with Meteorological Conditions. Atmos. Pollut. Res. 7, 557–566. doi:10.1016/j.apr.2016.01.004
Bai, Y., Zeng, B., Li, C., and Zhang, J. (2019). An Ensemble Long Short-Term Memory Neural Network for Hourly PM2.5 Concentration Forecasting. Chemosphere 222, 286–294. doi:10.1016/j.chemosphere.2019.01.121
Cheng, Y., Zhang, H., Liu, Z., Chen, L., and Wang, P. (2019). Hybrid Algorithm for Short-Term Forecasting of PM2.5 in China. Atmos. Environ. 200, 264–279. doi:10.1016/j.atmosenv.2018.12.025
Dragomiretskiy, K., and Zosso, D. (2014). Variational Mode Decomposition. IEEE Trans. Signal. Process. 62, 531–544. doi:10.1109/TSP.2013.2288675
Du, P., Wang, J., Hao, Y., Niu, T., and Yang, W. (2020). A Novel Hybrid Model Based on Multi-Objective Harris Hawks Optimization Algorithm for Daily PM2.5 and PM10 Forecasting. Appl. Soft Comput. 96, 106620. doi:10.1016/j.asoc.2020.106620
Fan, Q., Lan, J., Liu, Y., Wang, X., Chan, P., Hong, Y., et al. (2015). Process Analysis of Regional Aerosol Pollution During Spring in the Pearl River Delta Region, China. Atmos. Environ. 122, 829–838. doi:10.1016/j.atmosenv.2015.09.013
Feng, X., Li, Q., Zhu, Y., Hou, J., Jin, L., and Wang, J. (2015). Artificial Neural Networks Forecasting of PM2.5 Pollution Using Air Mass Trajectory Based Geographic Model and Wavelet Transformation. Atmos. Environ. 107, 118–128. doi:10.1016/j.atmosenv.2015.02.030
Hampel, F. R. (1974). The Influence Curve and its Role in Robust Estimation. J. Am. Stat. Assoc. 69, 383–393. doi:10.1080/01621459.1974.10482962
Hao, Y., Niu, X., and Wang, J. (2021). Impacts of Haze Pollution on China's Tourism Industry: A System of Economic Loss Analysis. J. Environ. Manage. 295, 113051. doi:10.1016/j.jenvman.2021.113051
Hao, Y., and Tian, C. (2019). The Study and Application of a Novel Hybrid System for Air Quality Early-Warning. Appl. Soft Comput. 74, 729–746. doi:10.1016/j.asoc.2018.09.005
Huang, G. B., Zhu, Q. Y., and Siew, C. K. (2004). Extreme Learning Machine: A New Learning Scheme of Feedforward Neural Networks. IEEE International Conference on Neural Networks. doi:10.1109/IJCNN.2004.1380068
Jiang, P., Li, C., Li, R., and Yang, H. (2019). An Innovative Hybrid Air Pollution Early-Warning System Based on Pollutants Forecasting and Extenics Evaluation. Knowledge-Based Syst. 164, 174–192. doi:10.1016/j.knosys.2018.10.036
Li, B., He, M., Gao, F., and Zeng, Y. (2021). The Impact of Air Pollution on Corporate Cash Holdings. Borsa Istanbul Rev. 21, S90–S98. doi:10.1016/j.bir.2021.04.007
Li, L., Lei, Y., Wu, S., Chen, J., and Yan, D. (2017). The Health Economic Loss of Fine Particulate Matter (PM 2.5 ) in Beijing. J. Clean. Prod. 161, 1153–1161. doi:10.1016/j.jclepro.2017.05.029
Ließ, M., Gebauer, A., and Don, A. (2021). Machine Learning with GA Optimization to Model the Agricultural Soil-Landscape of Germany: An Approach Involving Soil Functional Types with Their Multivariate Parameter Distributions Along the Depth Profile. Front. Environ. Sci. 9, 692959. doi:10.3389/fenvs.2021.692959
Lin, Y., Luo, H., Wang, D., Guo, H., and Zhu, K. (2017). An Ensemble Model Based on Machine Learning Methods and Data Preprocessing for Short-Term Electric Load Forecasting. Energies 10, 1186. doi:10.3390/en10081186
Liu, H., and Chen, C. (2020). Prediction of Outdoor PM2.5 Concentrations Based on a Three-Stage Hybrid Neural Network Model. Atmos. Pollut. Res. 11, 469–481. doi:10.1016/j.apr.2019.11.019
Liu, H., Jin, K., and Duan, Z. (2019b). Air PM2.5 Concentration Multi-step Forecasting Using a New Hybrid Modeling Method: Comparing Cases for Four Cities in China. Atmos. Pollut. Res. 10, 1588–1600. doi:10.1016/j.apr.2019.05.007
Liu, H., Shah, S., and Jiang, W. (2004). On-line Outlier Detection and Data Cleaning. Comput. Chem. Eng. 28, 1635–1647. doi:10.1016/j.compchemeng.2004.01.009
Liu, H., Xu, Y., and Chen, C. (2019a). Improved Pollution Forecasting Hybrid Algorithms Based on the Ensemble Method. Appl. Math. Model. 73, 473–486. doi:10.1016/j.apm.2019.04.032
Luo, H., Wang, D., Yue, C., Liu, Y., and Guo, H. (2018). Research and Application of a Novel Hybrid Decomposition-Ensemble Learning Paradigm with Error Correction for Daily PM 10 Forecasting. Atmos. Res. 201, 34–45. doi:10.1016/j.atmosres.2017.10.009
Prakash, A., Kumar, U., Kumar, K., and Jain, V. K. (2011). A Wavelet-Based Neural Network Model to Predict Ambient Air Pollutants' Concentration. Environ. Model. Assess. 16, 503–517. doi:10.1007/s10666-011-9270-6
Schwarz, N., Hoffmann, F., Knapp, S., and Strauch, M. (2020). Synergies or Trade-Offs? Optimizing a Virtual Urban Region to foster Plant Species Richness, Climate Regulation, and Compactness Under Varying Landscape Composition. Front. Environ. Sci. 8, 16. doi:10.3389/fenvs.2020.00016
Sharma, E., Deo, R. C., Prasad, R., and Parisi, A. V. (2020). A Hybrid Air Quality Early-Warning Framework: An Hourly Forecasting Model with Online Sequential Extreme Learning Machines and Empirical Mode Decomposition Algorithms. Sci. Total Environ. 709, 135934. doi:10.1016/j.scitotenv.2019.135934
Siwek, K., and Osowski, S. (2012). Improving the Accuracy of Prediction of PM10 Pollution by the Wavelet Transformation and an Ensemble of Neural Predictors. Eng. Appl. Artif. Intelligence 25, 1246–1258. doi:10.1016/j.engappai.2011.10.013
Stern, R., Builtjes, P., Schaap, M., Timmermans, R., Vautard, R., Hodzic, A., et al. (2008). A Model Inter-comparison Study Focussing on Episodes with Elevated PM10 Concentrations. Atmos. Environ. 42, 4567–4588. doi:10.1016/j.atmosenv.2008.01.068
Sun, W., and Sun, J. (2017). Daily PM 2.5 Concentration Prediction Based on Principal Component Analysis and LSSVM Optimized by Cuckoo Search Algorithm. J. Environ. Manage. 188, 144–152. doi:10.1016/j.jenvman.2016.12.011
Timmermans, R., Kranenburg, R., Manders, A., Hendriks, C., Segers, A., Dammers, E., et al. (2017). Source Apportionment of PM2.5 Across China Using LOTOS-EUROS. Atmos. Environ. 164, 370–386. doi:10.1016/j.atmosenv.2017.06.003
Vlachogianni, A., Kassomenos, P., Karppinen, A., Karakitsios, S., and Kukkonen, J. (2011). Evaluation of a Multiple Regression Model for the Forecasting of the Concentrations of NOx and PM10 in Athens and Helsinki. Sci. Total Environ. 409, 1559–1571. doi:10.1016/j.scitotenv.2010.12.040
Vukicevic, T. (1991). Nonlinear and Linear Evolution of Initial Forecast Errors. Mon. Weather Rev. 119, 1602–1611. doi:10.1175/1520-0493(1991)119<1602:NALEOI>2.0.CO
Wang, J.-Z., Wang, Y., and Jiang, P. (2015). The Study and Application of a Novel Hybrid Forecasting Model - A Case Study of Wind Speed Forecasting in China. Appl. Energ. 143, 472–488. doi:10.1016/j.apenergy.2015.01.038
Wang, J., Du, P., Hao, Y., Ma, X., Niu, T., and Yang, W. (2020a). An Innovative Hybrid Model Based on Outlier Detection and Correction Algorithm and Heuristic Intelligent Optimization Algorithm for Daily Air Quality index Forecasting. J. Environ. Manage. 255, 109855. doi:10.1016/j.jenvman.2019.109855
Wang, J., Yang, W., Du, P., and Niu, T. (2020b). Outlier-robust Hybrid Electricity price Forecasting Model for Electricity Market Management. J. Clean. Prod. 249, 119318. doi:10.1016/j.jclepro.2019.119318
Wendel, J. (2014). Air Pollution Ranks as Largest Health Risk. Eos Trans. AGU 95, 120. doi:10.1002/2014eo140007
Wu, D.-C., Bahrami Asl, B., Razban, A., and Chen, J. (2021). Air Compressor Load Forecasting Using Artificial Neural Network. Expert Syst. Appl. 168, 114209. doi:10.1016/j.eswa.2020.114209
Wu, Q., and Lin, H. (2019b). A Novel Optimal-Hybrid Model for Daily Air Quality Index Prediction Considering Air Pollutant Factors. Sci. Total Environ. 683, 808–821. doi:10.1016/j.scitotenv.2019.05.288
Wu, Q., and Lin, H. (2019a). Daily Urban Air Quality index Forecasting Based on Variational Mode Decomposition, Sample Entropy and LSTM Neural Network. Sustain. Cities Soc. 50, 101657. doi:10.1016/j.scs.2019.101657
Xing, Y., Yue, J., Chen, C., Xiang, Y., Chen, Y., and Shi, M. (2019). A Deep Belief Network Combined with Modified Grey Wolf Optimization Algorithm for PM2.5 Concentration Prediction. Appl. Sci. 9, 3765. doi:10.3390/app9183765
Xu, Y., Yang, W., and Wang, J. (2017). Air Quality Early-Warning System for Cities in China. Atmos. Environ. 148, 239–257. doi:10.1016/j.atmosenv.2016.10.046
Yang, W., Wang, J., Lu, H., Niu, T., and Du, P. (2019a). Hybrid Wind Energy Forecasting and Analysis System Based on Divide and Conquer Scheme: A Case Study in China. J. Clean. Prod. 222, 942–959. doi:10.1016/j.jclepro.2019.03.036
Yang, W., Wang, J., Niu, T., and Du, P. (2019b). A Hybrid Forecasting System Based on a Dual Decomposition Strategy and Multi-Objective Optimization for Electricity Price Forecasting. Appl. Energ. 235, 1205–1225. doi:10.1016/j.apenergy.2018.11.034
Yang, Z., and Wang, J. (2017). A New Air Quality Monitoring and Early Warning System: Air Quality Assessment and Air Pollutant Concentration Prediction. Environ. Res. 158, 105–117. doi:10.1016/j.envres.2017.06.002
Zafra, C., Ángel, Y., and Torres, E. (2017). ARIMA Analysis of the Effect of Land Surface Coverage on PM 10 Concentrations in a High-Altitude Megacity. Atmos. Pollut. Res. 8, 660–668. doi:10.1016/j.apr.2017.01.002
Zhang, K., and Luo, M. (2015). Outlier-robust Extreme Learning Machine for Regression Problems. Neurocomputing 151, 1519–1527. doi:10.1016/j.neucom.2014.09.022
Zhang, Q., Xue, D., Liu, X., Gong, X., and Gao, H. (2019). Process Analysis of PM2.5 Pollution Events in a Coastal City of China Using CMAQ. J. Environ. Sci. 79, 225–238. doi:10.1016/j.jes.2018.09.007
Keywords: PM2.5 concentration, point forecasting, interval forecasting, outlier handling and modeling, forecasting system
Citation: Yin Z and Fang X (2021) An Outlier-Robust Point and Interval Forecasting System for Daily PM2.5 Concentration. Front. Environ. Sci. 9:747101. doi: 10.3389/fenvs.2021.747101
Received: 25 July 2021; Accepted: 19 August 2021;
Published: 18 October 2021.
Edited by:
Pei Du, Xi’an Jiaotong University, ChinaReviewed by:
Song Ding, Zhejiang University of Finance and Economics, ChinaKevin Li, University of Windsor, Canada
Copyright © 2021 Yin and Fang. This is an open-access article distributed under the terms of the Creative Commons Attribution License (CC BY). The use, distribution or reproduction in other forums is permitted, provided the original author(s) and the copyright owner(s) are credited and that the original publication in this journal is cited, in accordance with accepted academic practice. No use, distribution or reproduction is permitted which does not comply with these terms.
*Correspondence: Xin Fang, eGZhbmdAbXVzdC5lZHUubW8=