 E. Gramsch
 P. Oyola
 F. Reyes2
 F. Moreno
- 1Physics Department, University of Santiago de Chile, Santiago, Chile
- 2Centro Mario Molina Chile, Antonio Bellet, Santiago, Chile
- 3Facultad de Química y Biología and CEDENNA, University of Santiago de Chile, Santiago, Chile
- 4Mathematics Department, University of Santiago de Chile, Santiago, Chile
- 5El Soldado Mine, Anglo American Sur S. A., Nogales, Chile
In the last decade, many low-cost monitoring sensors and sensor-networks have been used as an alternative air quality assessment method. It is also well known that these low cost monitors have calibration, accuracy and long term variation problems which require various calibration techniques. In this work PM2.5 and PM10 low cost sensors (Plantower and Nova Fitness) have been tested in five cities under different environmental conditions and compared with collocated standard instruments. Simultaneously, particle composition (organic and black carbon, sulfate, nitrate, chloride, ammonium, and chemical elements) has been measured in the same places to study its influence on the accuracy. The results show a very large variability in the correlation between the low cost sensors and collocated standard instruments depending on the composition and size of particles present in the site. The PM10 correlation coefficient (R2) between the low cost sensor and a collocated regulatory instrument varied from to 0.95 in Temuco to 0.04 in Los Caleos. PM2.5 correlation varied from 0.97 to 0.68 in the same places. It was found that sites that had higher proportion of large particles had lower correlation between the low cost sensor and the regulatory instrument. Sites that had higher relative concentration of organic and black carbon had better correlation because these species are mostly below the 1 μm size range. Sites that had higher sulfate, nitrate or SiO2 concentrations in PM2.5 or PM10 had low correlation most likely because these particles have a scattering coefficients that depends on its size or composition, thus they can be classified incorrectly.
Introduction
Chilean legislation has dealt with air pollution problems with the help of two relevant concepts: that of saturated and latent areas. Saturated areas are those in which one or more environmental quality standards are exceeded. Meanwhile, latent zone is one in which the measurement of the concentration of pollutants in the air, is between 80 and 100% of the value of the respective environmental quality standard. The air quality standards are defined for several criteria pollutants such are PM10, PM2.5, NO2, O3 CO, and SO2, similar to international legislation (EPA, 2021). When one or more of the air quality standards are exceeded in a region of the country, a Saturated Area is declared and a Decontamination Plan has to be elaborated to help reduce pollutant levels. Many times, the plan is expensive for the industry in the area because it requires emissions reduction; it is also cumbersome for the community because it involves traffic restrictions, constraint in the use of wood stoves, etc. Usually, the decontamination plan is elaborated after consultation with the community, industries as well as technical input from studies performed in the area. The result of this process is that there are 20 areas in the country that are declared as saturated. In most of these sites, there are few technical studies and there are limited monitoring capabilities. As a consequence, a large area could be declared saturated with information from only one or two places.
It is a common practice to measure and evaluate the impact generated by air pollution with high-quality monitoring stations (Chow, 1995; EU, 2008) which have equipment with international certification (EPA Guideline, 2021). In Chile, most monitoring stations have instruments that are selected for the city or the area that is believed to have contamination problems. The pollutants that they measure are specific to the area where the station is located, for instance if the area has a copper smelter, then SO2 and PM2,5 are measured. All the stations the stations are grouped into what is called the National Air Quality Information System (SINCA 2021). However, the high cost of purchasing and maintaining these monitors, limits their extensive use—currently there are only three or less stations in each administrative region, therefore, no spatial variability of the air pollution can be extracted from the data.
In the last decade, there has been a very large increase in the development and use of low-cost sensors (LCS) that use the principle of light scattering to measure particle mass concentration. These sensors are integrated into a casing and control electronics is added, establishing a low cost monitor (LCM). How the sensor is incorporated into the LCM and the overall design of the LCM does make a difference on the performance. Low cost sensors can range from $10 to $ 700 and are used as an alternative for air quality monitoring assessment (Snyder et al., 2013; Kumar, 2015; Morawska et al., 2018; Bulot et al., 2019; Feenstra et al., 2019; Mao et al., 2019), including a viewpoint of citizen science (Clements et al., 2019; Golumbic et al., 2019; Wesseling et al., 2019; Gramsch et al., 2020; Park et al., 2020). These low-cost networks can use a larger number of LCMs for the same area (Kumar and Jasuja, 2017; Barot et al., 2020), providing high spatial and temporal resolution. This information may be very useful for uncovering high-pollution spots, time periods with high or low concentration of pollutants or allowing citizens to ask about the air quality in their immediate neighborhood. This spatial vision not only allows citizen’s consultation, but also knowledge of the dynamics of pollutants, thereby identifying possible emission sources not considered in the local emissions inventory.
It is also well known that LCMs have calibration, accuracy and long term variation problems which require various calibration techniques (Miskell et al., 2018; Badura et al., 2019; van Zoest et al., 2019; Chu et al., 2020; Gramsch et al., 2020; Han et al., 2021). Some LCMs have nonlinear response to particle size, with most of them having low performance for large particles (Feenstra et al., 2019; Kuula et al., 2020). The optical properties of particles, size and shape play an important role because they change the intensity as well as the angle of the scattered light (Wang et al., 2015; Sousan et al., 2016; Kelly et al., 2017; Liu et al., 2017; Renard et al., 2021). Direct observation of the performance of LCMs with the composition of particles has also been observed (Sayahi et al., 2019). From the large amount of literature available, it is not clear that the problem of calibration is yet resolved (Maag et al., 2018).
There are several techniques used to measure the mass concentration from the optical signal. Many of them rely on the angle of the light scattered by particles injected in an optical chamber and crossing a light beam, and measure the light at two or more angles (Gayet et al., 1997; Renard et al., 2016; Eidhammer et al., 2008). However, most measurements are usually conducted at one angle with a large field of view and assuming that the particle size is directly proportional to the pulse height (Grimm and Eatough, 2009; Morpurgo et al., 2012; Gao et al., 2013). Most low cost sensors (Hagan and Kroll, 2020; Molaie and Lino, 2021 and references therein) consist of a dark chamber, a laser or LED light source and a photodiode. The sampled air flows inside the chamber and particle is illuminated by the laser light. The wavelength of the light varies from about 400 to 980 nm (Hagan and Kroll, 2020). The light scattered by the particle is detected by a photodiode that generates a voltage pulse whose height is approximately proportional to the size of the particle. The pulses are separated by size, angle, counted and classified by a microprocessor.
Several factors determine the scattering of the incoming measured light, including composition, albedo, porosity, shape and size distribution, being relevant the size, shape and porosity of the airborne particles (Szymanski and Liu, 1986; Xu, 2002; Grimm and Eatough, 2009; Moosmüller and Arnott, 2009a; Moosmüller et al., 2009b; Morpurgo et al., 2012; Gao et al., 2013; Renard et al., 2016; Renard et al., 2016; Stavroulas et al., 2020; Renard et al., 2021). As reported, in some cases the effects of the shape and porosity of the airborne particles can be even greater than their size on the light scattering, and this deserves to be considered in further designs of low cost monitors. However, considering the cost limitations of low cost sensors mainly associated to the microcontroller and its programming, it becomes difficult to process an ensemble of measurements for controlling these factors, as recommended by Renard et al., 2021.
Most low cost sensors use laser light with wavelength between 600 and 980 nm (Hagan and Kroll, 2020). When the particle size is much smaller (d < 0.1 μm) than the wavelength (Rayleigh scattering regime, Xu, 2002; Moosmüller et al., 2009b) the pattern of the scattered light is symmetrical in the forward and backward directions and more or less independent of the shape of the particle. This is the case for ultrafine particles generated by vehicle exhaust, wood burning or other anthropogenic sources. However, in this regime, the scattered intensity is very low and most of the time light cannot be detected. The lower detection limit for the majority of low cost sensors is ∼0.3 μm, but some high end instruments can reach down to ∼0.15 µm. (Renard et al., 2016).
When the particle size is much larger (d > 2 μm) than the wavelength (geometric scattering regime, Xu, 2002; Seinfeld and Pandis, 2006; Hagan and Kroll, 2020), the scattering is dominated by the laws of geometric optics of reflection and refraction. In this case scattering is dependent on the shape and orientation of the particle during the interaction with the laser light. In this case, same size particles can generate pulses of different heights depending on the orientation of the particle. Thus, a large particle can be classified by the algorithm as small or large depending on the orientation during its interaction with the laser beam.
When the particle diameter d (0.1 μm < d < 2 μm) is similar to the wavelength, aerosol scattering, absorption, and extinction coefficients are functions of the particle size and the complex refractive index, which in turn depends on particle composition (Xu, 2002; Seinfeld and Pandis, 2006; Hagan and Kroll, 2020). In this size range Mie theory can be applied for spherical particles and the scattering is a complicated function of the size, angle and wavelength. However, most particles in this size range are not spherical, so the shape and orientation of the particle during the interaction with the laser beam also play a role. Szymanski and Liu, (1986) found that for monochromatic light the polytonic response of the scattering intensity versus particle size for particles larger than >∼ 0.7 μm may inhibit the particles from being accurately sized.
Source apportionment studies of PM have been performed in Chile (Moreno et al., 2010; Jhun et al., 2013) in which aerosol composition was analyzed from different sources and its variations related to chronological (year, month, day of the week) and meteorological factors (relative humidity, wind speed and temperature). When variations of these sources where traced across time, the effect of increased precipitations, produced a decrease of the natural dust source (composed of Si, Al, Fe, Mn, Ca, Mg, Ti), not observed in other sources. A study by Gramsch et al. (2020), in Santiago, using data from 2011 to 2018 found that the Concentration Impact Factor (CIF) for the coarse fraction (PM10-2.5), which is related to natural dust, decreased from 1 to 0.62 during days with rain and the CIF for PM2.5 decreased from 1 to 0.82.
Source apportionment studies also show a change in composition in cities in the north and south, Hedberg et al. (2005), found that in Quillota in winter, the natural dust fraction of PM10 represented 31% of the total, while in Linares (a city very close to Talca) the natural dust fraction represented only 10% of the total. Considering the results of these studies in Santiago, Linares and Quillota, it can be expected that from south to north there will be a decrease in the natural dust fraction of particle matter, because there is a decrease in the amount of rainfall from south to north.
In this work, five LCMs containing a Plantower PMS7003 or a Nova Fitness SDS011 were built and used to study their accuracy in sites with different ambient conditions. In each site, the LCM was compared with a collocated regulatory instrument. The results show a very large variability in the correlation between the LCM and collocated standard instruments depending on the particle composition and size (PM10 or PM2.5).
Description of the Sites
The study was performed in five sites over a period of 2 years; two of them are located in the center-south of Chile, Temuco (Las Encinas station) and Talca (La Florida station), the third site is located in downtown Santiago (Parque O’Higgins station), the fourth site is located in Quillota (Bomberos station), north of Santiago and the fifth site is located in Los Caleos, about 150 km north of Santiago. All sites belong to the National System for Air Quality Information (SINCA 2021), which is managed by the Ministry of the Environment, and the data publicly available on line. The stations are used to measure air quality as well as regulatory purposes, therefore the monitors are all EPA approved and have QCQA procedures according to international standards. The low cost monitors were placed in the vicinity of the stations in order to compare their data. A map with the location of the monitoring sites is shown in Figure 1. The stations are located from south (Temuco) to north (Los Caleos) and there are climate differences between the sites that are significant. Temuco has a humid continental climate with rainfall averaging 1.246 mm per year (DMC 2021). Talca has a Mediterranean climate with and average rainfall of 790 mm per year (DMC 2021). Santiago, Los Caleos and Quillota have a semiarid climate with most rain occurring in winter. The average rainfall in Santiago in the last 10 years 192 mm per year (DMC 2021; Gramsch et al., 2021). Quillota and Los Caleos have the same amount of rain per year as Santiago.
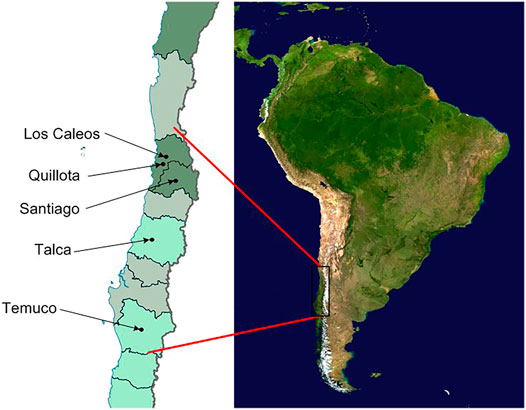
FIGURE 1. Map of Chile with the location of the monitoring sites.
Temuco is a mid-size town of 220,000 inhabitants, located about 620 km south of Santiago. The town is a main service center of agriculture and cattle farming for Chile, and there are some minor industries. In this city, most of the pollution problems come from wood burning used for residential space heating during winter, as a consequence very high PM2.5 concentrations are seen. Measurements were done at Las Encinas station (SINCA 2021) from June 21 until July 26 of 2019. The station is located in the courtyard of a health center in the middle of the city at least 50 m from large streets. And it has monitors for PM10, PM2.5 (both are Beta attenuation monitors 1,020 from Met One Instruments) and meteorological parameters. In this site, an LCM with a Plantower, temperature and humidity sensor was installed.
Talca is also a mid-size town with 203.000 inhabitants located about 255 km south of Santiago. The city is an important economic center, with agricultural (wheat), wine production and some manufacturing activities. It is located in the Central Valley of Chile, surrounded by the Andes Mountains to the east and the Coastal Range to the west. As a consequence, air stagnation frequently occurs during winter, leading to high PM concentrations. Like Temuco, during winter, most of the PM pollution comes from the use of wood for heating. Measurements were done in the La Florida station (SINCA 2021) from June 15 until August 7 of 2020. The station is located in the courtyard of a health center (La Florida Cesfam) in the middle of the city. In this site, an LCM with a Nova Fitness, temperature and humidity sensor was installed.
The Santiago site is an urban background site and it is located in a large park in the center of the Santiago, the largest city in Chile, with 5.6 million inhabitants. The station has been in operation continuously since 1989 and has monitors for PM10, PM2.5, O3, NO2, SO2, CO, and meteorological parameters. There is a major highway about 400 m east from the station and a horse racetrack about 580 m west and a large street (Blanco Encalada) 440 north. The area has a mixture of houses, retail and light industries (machine shops, auto repair shops, furniture manufacturing shops, etc.). Thus, there are many sources of pollution that contribute to the measured pollution. Measurements were done in Parque O’Higgins station (SINCA 2021) from October 1st until November 20, 2019. In this site, an LCM with a Plantower, temperature and humidity sensor were installed.
Quillota is a small town about 85 km north-west of Santiago, with 90,500 inhabitants. The economic activity of the surrounding area is mostly agricultural, and there are two power plants that use natural gas about 8 km west of the city. Quillota is located in a valley approximately 25 km from the sea. For this reason, particulate matter is influenced by marine aerosols and various industries located on the coast, including a copper smelter and four coal-fired thermoelectric plants. In addition, because there is extensive agricultural activity, movement of vehicles and machinery, there are always large quantities of resuspended dust that contributes to the formation of PM10. Measurements took place in the Cuerpo de Bomberos station (SINCA 2021), located in the courtyard of a Fire Station close to the center of the city and at least 50 m from large streets. The station has Beta Attenuation Monitors (BAM-1020) for PM10, PM2.5 from Met One Instruments, O3, NO2, NO, SO2, CO, CH4, non-methane hydrocarbons (NMHC), total hydrocarbons (THC) and meteorological parameters. Measurements in this site took place from August 26 until September 30, 2020. In this site, an LCM with a Plantower, temperature and humidity sensor was installed.
Los Caleos is a rural site about 110 km north of Santiago. The station is located 8 km west of an open–pit copper mine (El Soldado) and about 3 km north of a small town (El Melón). The site is surrounded by farms and particulate matter pollution is influenced by resuspended dust from wind, movement of vehicles and machinery and emissions from El Soldado. Measurements took place in Los Caleos station, which has BAM monitors for PM10, PM2.5, from Met One Instruments, as well as meteorological parameters. Measurements in this site took place from September 24 until November 14, 2020. In this site, an LCM with a Plantower, temperature and humidity sensor was installed.
Methods and Instrumentation
Several instruments and analytical techniques were used to obtain the data and a summary is written in Table 1. Because measurements were not simultaneous and performed over a period of 2 years, the analytical techniques and instruments were not the same in all sites. This is another complicating factor, because it is known that instruments with different measurement principles do not always give the same results (Chung Albert et al., 2001; Wang, 2016). When different monitors are compared, having different time resolutions, the higher resolution time series are averaged at the resolution of the monitor with lesser time resolution, for having pairwise of contemporary time series. Below is a description of the techniques used.
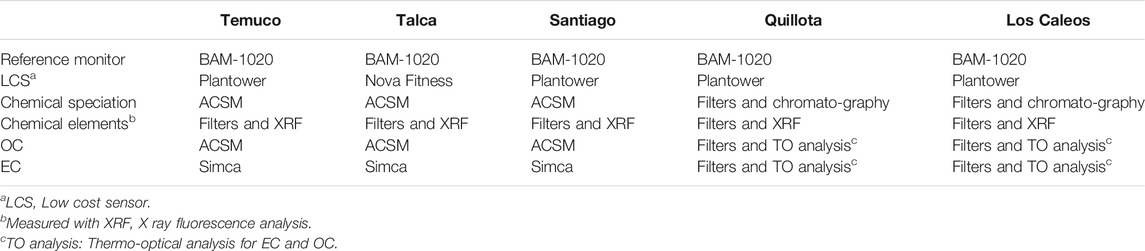
TABLE 1. Instruments and analytical techniques used at each site.
Low Cost Instrument
In all sites, PM10 and PM2.5, temperature and humidity were measured with a low cost monitor (LCM) specially designed and built for the studies. Several sensors and an electronic interface are integrated with a microprocessor (ESP32) as shown in Figure 2. The microcontroller, the interface and the sensors were placed in a plastic box of 21 cm3 × 16 cm3 × 7 cm3, weighing approximately 700 g. It is connected to the 220 VAC grid and consumes 1 W. The data is stored in an internal SD memory card and, if there is access to WiFi, it is sent to a website automatically. The equipment works autonomously, but in cases of power failure, the data recording is interrupted. However, if the power returns, the microprocessor restarts automatically. The LCM recorded data every minute, but in order to compare with other instruments, it was averaged to 1 hour. When the number of measurements was less than 50%, the hourly value was reported as missing. The box was placed outside of the monitoring station in each site for the duration of the study. A picture of the low cost instrument installed at Los Caleos site is shown in Figure 3 (red arrow). The sample inlet for the BAM-1020 instrument can be seen to the right of the picture. The white, temperature-controlled container seen in the picture houses the BAM monitor and other reference instruments. In all sites, the LCM was installed in the roof of the regulatory air quality monitoring station.
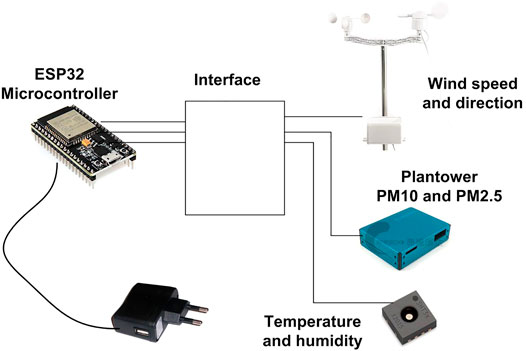
FIGURE 2. Diagram of the low cost environmental monitoring station.
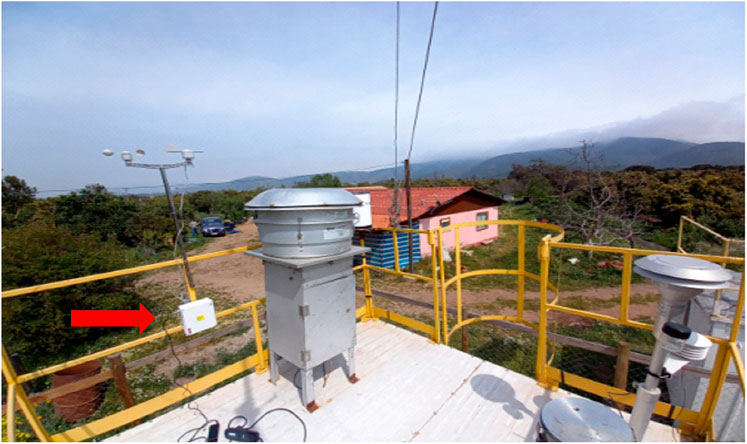
FIGURE 3. Low cost monitoring station in Los Caleos (arrow). To the right is the sample inlet for the BAM-1020 monitor.
PM10 and PM2.5 were measured with Plantower, PMS 7003 (Beijing Plantower Co., Ltd., Houshayu, Beijing, China) and with a SDS011 from Shandong Nova Fitness Co.,Ltd. Jinan., China. Temperature and humidity were measured with an SHT-30 (Sensirion, Staefa ZH, Switzerland). Calibration of the Plantower or Nova Fitness was performed at each site using data from the collocated BAM-1020 for both PM10 and PM2.5. Data from the Plantower or Nova Fitness was multiplied by a factor which was adjusted to minimize the nRSME (Manikonda et al., 2016) between the instruments.
ACSM Monitor
The Aerosol chemical speciation monitor (Aerodyne Research Inc.,) is able to routinely characterize non-refractory submicron aerosol species organics, nitrate, sulfate, ammonium and chloride with the time resolution from 15 min up (Ng et al., 2011). The instrument consists of a particle sampling inlet, three vacuum chambers and a residual gas analyzer mass spectrometer. Particles are first focused by using an aerodynamic lens system into a narrow particle beam, which is transmitted through three vacuum chambers. In the third chamber the particle beam is directed into a hot tungsten oven (600°C) where particles are flash-vaporized, ionized with a 70 eV electron impact ionizer and detected with a quadrupole mass spectrometer. The ACSM was used to obtain chemical species from particulate matter in Temuco, Talca and Santiago. According to the manufacturer, the sensitivity of the ACSM to Organic matter is 0.3 μg/m3, sulfate: 0.04 μg/m3, nitrate: 0.02 μg/m3, NH4: 0.5 μg/m3, chloride: 0.02.
BAM Monitor
The BAM 1020 monitor (Beta Attenuation Mass Monitor, Met One Instruments) measures the mass concentration of ambient particulate matter collected onto glass filter tape with a time resolution of 1 minute. The BAM 1020 employs an in-line sampling geometry in which the attenuation of beta rays across filter media is measured and particulate matter is sampled simultaneously. This allows ambient sampling to occur for virtually 60 min each hour. The data resolution is 1 μg/m3.
Filter Samples
In Santiago, coarse particles, PM2.5–10, and fine particles, PM2.5, were collected using dichotomous samplers (Andersen Instruments, Inc., Smyrna, GA), with a collection time of 24 h. The total sampling flow rate was 16.7 l/min (15 l/min for fine particles, major flow, and 1.7 L/min for coarse particles, minor flow). Particles were collected on 37 mm Teflon filters.
In Quillota, Los Caleos, Temuco and Talca sites, the Harvard Impactor (Marple and Willeke, 1976; Peters et al., 2001) was used to collect samples in Teflon or quartz filters. A flow rate of 4.0 lt/min was used with a 24 h collection time.
In all cases, each filter was inspected for its integrity before use. Particle concentrations were determined gravimetrically using an electronic microbalance, with a resolution of 0.001 mg. Both blank and field filter samples were conditioned at constant temperature (22 ± 3°C) and relative humidity (40 ± 5%) for at least 24 h before being weighed. Inhalable particle concentrations, PM10, were calculated as the sum of coarse and fine particle concentrations.
The Teflon filters from Quillota and Los Caleos were sent to Chester Lab Net (Garden Pl, Tigard, OR) to determine chemical elements, from Z = 11 to 82 using an “EDXRF Thermo Scientific ™ ARL™ QUANT'X energy-dispersive x-ray fluorescence analyzer” equipment. The Teflon filters from Santiago, Temuco and Talca were sent to the Desert Research Institute (DRI) in Reno, NV, to determine the concentration of elements with XRF.
The Teflon filters from Quillota and Los Caleos were also processed in the Chemistry Department of the University of Santiago to obtain the chemical species. Extraction of the soluble fraction of major trace elements was performed by leaching with 30 ml of ultrapure water inside PVC containers. The containers were then immersed in an ultrasonic bath during 10 min and placed in an oven at 60°C for 6 h. The resultant solution was filtered through a 0.45 μm membrane filter, and finally analyzed by ionic chromatography (high performance liquid chromatography using a WATERS IC-pakTM anion column) for the determination of Cl−, NO3− and SO42–, and by a specific electrode (WATERS 432 conductivity detector) to obtain NH4+ concentrations.
The quartz filters collected in Quillota and Los Caleos were used to obtain organic (OC) and elemental or black carbon (BC) using the thermo-optical method at Chester LabNet (Garden Pl, Tigard, OR). The equipment used to obtain the organic and elemental carbon fraction is the semi-continuous EC-OC Model-4 Analyzer, manufactured by Sunset Laboratory Inc., 10,180 SW Nimbus Avenue, Suite J/5, Tigard, OR 97223, United States. Carbon samples were analyzed with the NIOSH method 5,040 (NIOSH et al., 2016).
Black Carbon
As mentioned in the previous paragraph, in some sites (Los Caleos and Quillota) black carbon (BC) concentration was determined from filter measurements. In Temuco, Talca and Santiago, BC was determined from a continuous instrument (Simca) that measures the absorption coefficient of the particles (Gramsch et al., 2004).
Estimation of Dust Mass
Crustal material (natural dust) corresponds to the fraction of particulate matter that is directly resuspended from the ground by wind, traffic or other mechanical means. In this work, an assumption is made that dust (Rudnick et al., 2003) is made up of the most common elements of the earth’s crust, which are the following oxides: SiO2, Al2O3, Fe2O3, CaO, MgO, Na2O, K2O, TiO2, Mn3O4, SO3, P2O5. According to the methodology outlined by Andrews et al. (2000), and using the concentration of elements–Si, Al, Fe, Ca, Mg, Na, K, Ti, Mn, S and P–measured with the X-Ray Flourescence (XRF) technique and the mass of oxygen, it is possible to estimate the mass of the mentioned compounds assuming that these elements are in the form of the named species. This method tends to underestimate the soil contribution, due to artifacts mentioned in Andrews et al. (2000). However, the method may also overestimate the dust mass if there is anthropogenic contamination of the elements mentioned above. For example, in coastal cities is common to find larger concentrations of Na; in cities with wood burning, it is common to find larger concentrations of K.
Because of the anthropogenic pollutants and it may be difficult to determine dust fraction using all the measured elements. In order to determine the relative fractions of dust coming from the earth crust, that can used as a reference for clean dust in this work, a sample of earth crust in a hill near Santiago (La Cruz) was taken and analyzed. The sample was extracted by digging a 10 cm hole in a place with little organic material. The XRF analysis of the sample is shown in Figure 4A,B, along with the XRF analysis of PM2.5 from the five sites. The concentration of each element was normalized to the concentration of Si, in order to show them in the same plot.
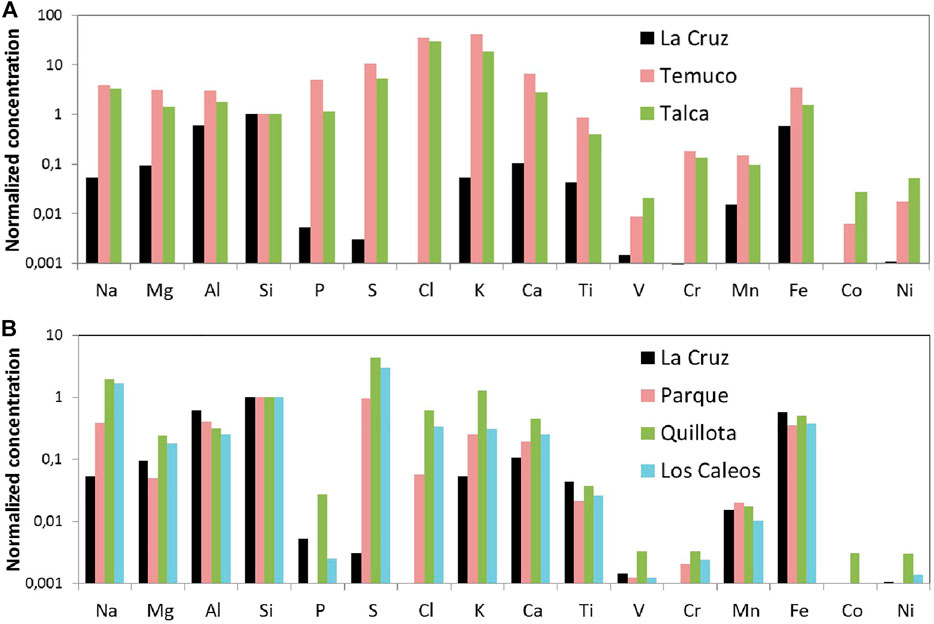
FIGURE 4. Elemental composition by XRF of a dust sample in a clean site near Santiago (La Cruz) and the elemental composition of PM2.5 from the five sites. Concentrations have been normalized to Si. (A) La Cruz and southern sites: Temuco and Talca sites, (B) La Cruz and northern sites: Parque, Quillota and Los Caleos.
For La Cruz sample, Figure 4 shows high concentrations of Si, Al and Fe; and low concentration of S, K and Cl (relative to Si), which are also commonly found in PM2.5 or PM10 samples in the air of large cities (Sax et al., 2007; Moreno et al., 2010; Jorquera et al., 2021). The low values of S and Cl indicate that the sample was not contaminated with pollution from the city. The XRF data for the southern sites (Temuco and Talca) show higher concentrations of P, Cl, Ca and K which are an indication of wood burning contamination (Hedberg et al., 2005; Jorquera et al., 2018). In the northern and southern cities, the S concentration is higher than La Cruz, indicating contamination from anthropogenic sources. S may come from many sources, such as diesel engines, boilers, heaters, coal burning, power plants, sea aerosols, etc., and it is commonly found in all cities. In the southern cities, there is relatively less concentration of P, Cl, K and Ca, but higher concentration of S.
Figure 5 shows the estimation of the dust composition according to method mentioned before. This estimation is also similar to the composition of earth crust from other places (Chorley, 1969; Rudnick and Gao, 2001). The figure shows that the largest fraction of natural dust is composed of silica particles (SiO2) which may be relevant to the accuracy of LCMs. With this method, for La Cruz site, the mass concentration of dust is obtained as:
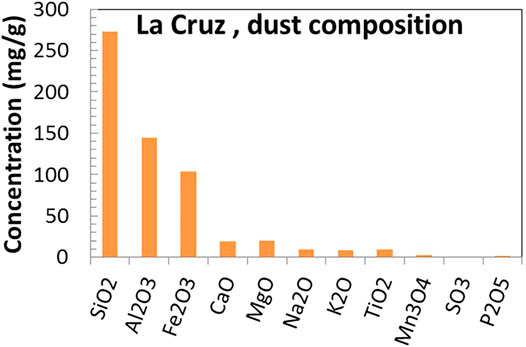
FIGURE 5. Composition of soil dust in La Cruz, estimated using the method described in the text.
Dust (La Cruz) = 2.14[Si] + 1.13[Al] + 0.81[Fe] + 0.15[Ca] + 0.16[Mg] + 0.07[Na] + 0.06[K] + 0.07[Ti] + 0.021[Mn] + 0.008[S] + 0.012[P]. (1)
where the square brackets denote concentrations of the compounds. In order to obtain the fraction of natural dust in the PM samples from the five sites, the reconstruction is going to be done assuming that dust in all sites has a relative composition similar to La Cruz site, as shown in Eq. 1. The Si concentration from each site is used to find SiO2 and the remaining compounds are constructed using the relative fractions measured at La Cruz hill and the concentration of SiO2.
Dust (all sites) = [SiO2] + 0.53[SiO2] + 0.38[SiO2] + 0.068[SiO2] + 0.073[SiO2] + 0.034[SiO2] + 0.030[SiO2] + 0.033[SiO2] + 0.010[SiO2] + 0.004[SiO2] + 0.006[SiO2]. (2)
Because in all sites there are elements that have higher concentration than what is found in the reference fractions, the difference is going to be added to a group named “other elements”. S and K are examples of these elements, because they are found in PM2.5 or PM10 in cities in concentrations much higher than the reference concentration.
In addition to the elements that form earth crust, there are other elements with much lower concentrations, such as: V, Cr, Co, Ni, Cu, Zn, As, Pb, etc., that have been measured, but whose masses are very small compared to the elements that form the dust. These elements have also been added to the “other elements” group.
Results and Discussion
PM10 and PM2.5 From all Stations
Measurements in Temuco were done during fall, from June 21 until July 25 of 2019. The time series for PM2.5 and PM10 are shown in Figure 6A,B. It seem clear that PM10 and PM2,5 come from the same source because the plots are very similar in shape and the Pearson linear coefficients, R2 is higher than 0.99. In addition the average PM10 was 33.3 μg/m3 and PM2.5 was 26.4 μg/m3, that is, only 20% difference between them. These numbers indicate that most of the PM10 is composed of fine particles (d < 2.5 μm) and one source present in Temuco that generates mostly fine particles is wood burning (Tsapakis et al., 2002; Díaz-Robles et al., 2014; Villalobos et al., 2017; Jorquera et al., 2018; Jorquera et al., 2021). The correlation between measurements with the Plantower and the BAM monitor is very high, R2 = 0.97 for PM2.5 and R2 = 0.95 for PM10.
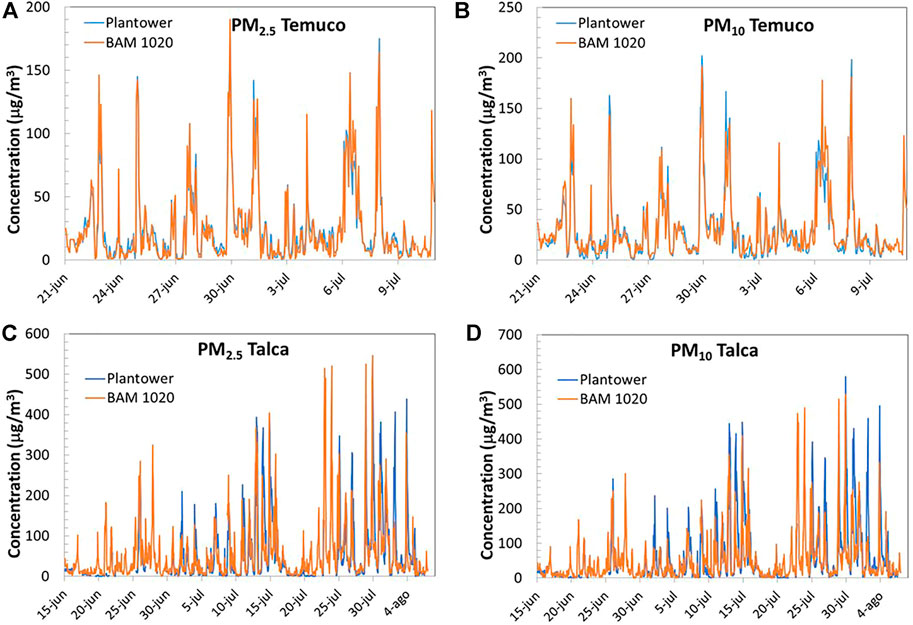
FIGURE 6. (A) and (B) Time series of the Plantower and BAM in Temuco, from June 21 until July 26, 2019. (C) and (D) Time series of the Nova Fitness and BAM in Talca, from October 1st until November 20, 2019.
In Talca, measurements were also done in winter, from June 15 until August 7, 2020. A comparison of the measurements with the low cost and the BAM monitor is shown in Figure 6C,D. The plots show that measurements with both monitors are similar and the correlation between the Nova Fitness and the BAM monitor for PM2.5 is R2 = 0.73 and for PM10 the correlation is R2 = 0.69. The correlation between PM10 and PM2.5 measured with the BAM monitor is very high R2 = 0.99. The concentration is also very similar, with the average PM10 being 61.4 μg/m3 and PM2.5 = 53.9 μg/m3.
In Santiago (Parque O’Higgins station), measurements were done during spring of 2020, from October 1st until November 20. In order to compare with the previous measurements, only 1 month is going to be used for the calculations. The times series for the first month is plotted in Figure 7A,B. In this site, there is less correlation between the measurements with the Plantower and the BAM monitor. The shape of PM10 is also different to PM2.5. The correlation between PM10 and PM2.5 is R2 = 0.49, the average PM10 was 56.5 μg/m3 and PM2.5 was 15.7 μg/m3, that is a difference of 3.6 between them. The correlation between the Plantower and the BAM monitor for PM2.5 is R2 = 0.86 and for PM10 the correlation is R2 = 0.34.
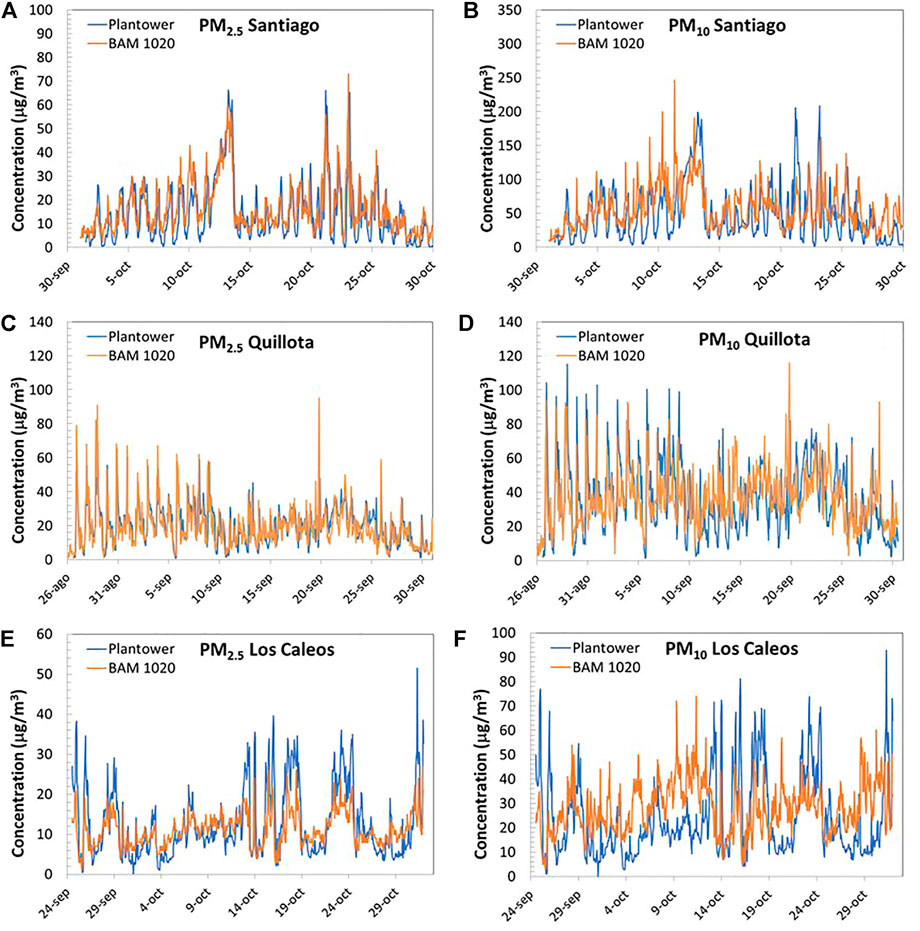
FIGURE 7. (A) and (B) Time series of the Plantower and BAM in Santiago, from October 1 until November 20, 2019, (C) and (D) Plantower and BAM in Quillota from August 26 until September 30, 2020, (E) and (F) Plantower and BAM in Caleos from September 24 until November 14, 2020.
In Quillota the measurements were done at the end of winter, from August 26 until September 30, 2020. The comparison between the Plantower and the BAM monitor is plotted in Figure 7C,D. In this site, the PM2.5 measurement with the Plantower monitor shows better agreement with the BAM monitor than the PM10 measurement. The correlation between PM10 and PM2.5 is R2 = 0.65, the average PM10 was 36.8 μg/m3 and PM2.5 was 19.4 μg/m3. The correlation between the Plantower and the BAM monitor for PM2.5 is R2 = 0.65 and the correlation for PM10 is R2 = 0.34.
In Los Caleos the measurements were done in spring of 2020, from September 24 until November 14. The comparison between the Plantower and the BAM monitor is plotted in Figure 7E,F. In this site, the PM2.5 measurement with the Plantower monitor also shows better agreement with the BAM monitor than the PM10 measurement. However, for PM10 there is almost no agreement. The correlation between the Plantower and the BAM monitor for PM2.5 is R2 = 0.68 and the correlation for PM10 is R2 = 0.04. This last number indicates that in some places, LCMs cannot be used to measure PM10.
A summary of this information is presented in Table 2. In the sites with winter measurements (Temuco and Talca) the LCM show a very high correlation between PM10 and PM2.5, with the concentration of PM2.5.
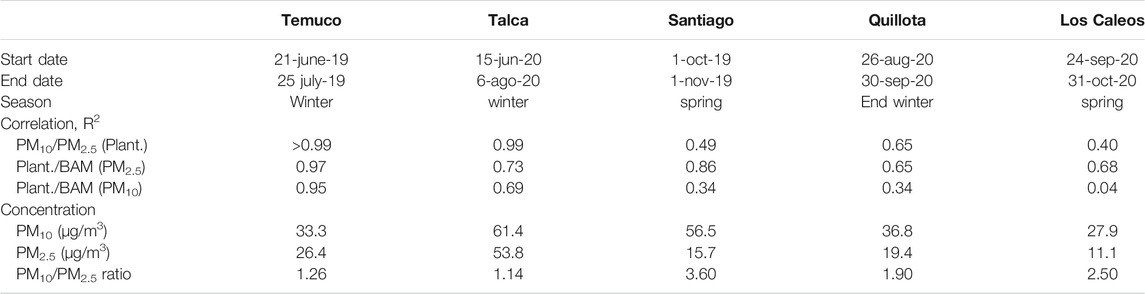
TABLE 2. Summary of the PM2.5 and PM10 data for all sites.
The sites in which the measurements were done in spring or at the end of winter (Santiago, Quillota and Los Caleos) with the LCM, show a lower correlation between PM10 and PM2.5. Spring has higher temperatures and higher wind speed than winter and there is more re-suspended dust, which is a source of PM10. In these cities PM10 is much larger than PM2.5 and the correlation between them is lower (Table 2). In contrast to the cities with winter measurements, for PM10 the correlation between the LCM and the BAM is much lower, and for Los Caleos, there is no correlation between both instruments.
The difference between these cities, seem to be the sources of the particles. Cities with high correlation for PM10 and PM2.5 between the LCM and BAM have mainly one source of particles; wood burning. For cities with lower or null correlation there are several sources of particles. In the case of Los Caleos, because it is a rural site, a larger fraction of the particles are generated from resuspension of dust.
Chemical Speciation
In each site, chemical species (sulfate, nitrate, ammonium, chlorine), black carbon, organic carbon, natural dust and chemical elements in PM2.5 were determined. The measurements were done in the same period as the PM2.5 monitoring with the low cost instrument. These species form most of the PM2.5 found in cities (Seinfeld and Pandis, 2006). As shown in Table 2, there are large variations in total PM2.5 concentration in the sites; thus, the concentration of the species has been normalized to the average for the period. The results are plotted in Figure 8, with the cities ordered from south to north. The figure shows that there are trends in the composition of the particles that depend on the location of the city. Sulfate increases from south to north, which is most likely related to the industrial activities of the area. Talca and Temuco do not have industries that emit SO2 to the atmosphere and have a colder climate that reduce photochemical activity that can form sulfate. In addition, the main source of pollution in Temuco and Talca (Pozo et al., 2015; Jorquera et al., 2018) is wood burning, which generates mostly fine and ultrafine particles without sulfate (Rau, 1989; Kleeman et al., 1999). Quillota and Los Caleos are located in an industrial zone that has several large sources of SO2 (Hedberg et al., 2005) and because the climate is drier there is more photochemical activity than the south. Santiago is a large city that also has many sources of SO2 and has large photochemical activity. Nitrate also has a clear trend from south to north. Nitrate is formed partly from NO2 emissions that undergo photochemical reactions in the atmosphere creating nitrate (Seinfeld and Pandis, 2006). For the same reasons as before there is more nitrate in the northern cities. Natural dust has also a trend from south to north, with exception from Santiago. Temuco and Talca have larger amounts of rain (DMC, 2021) which keep the ground moist, reducing the resuspension of dust (Nicholson, 1988). The cities in the north have drier climates and have more resuspension of particulate material (Nicholson, 1988). The relative larger amount of dust in Santiago is probably related to the size of the city (1.7 million inhabitants compared to 90,000 in Quillota and 10,000 in Los Caleos), consequently there is more traffic and more activities that can resuspend dust into the air. Several studies have found that when there is little rain, materials that were previously deposited on road surface can be more easily resuspended (Amato et al., 2009; Karanasiou et al., 2011; Rienda and Alves, 2021). In addition Earlier work in Santiago has characterized the elemental composition of PM10 and PM2.5 with XRF. Using source apportionment analysis, it has been found that about 25% of the elements in PM2.5, come from dust, except for a period in winter 2002 which had specially rainy months and fell to 5% (Moreno et al., 2010).
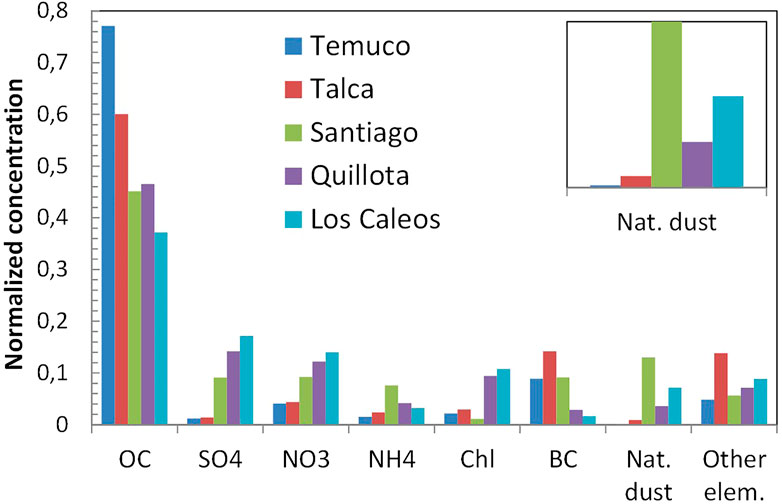
FIGURE 8. Normalized chemical composition of PM2.5 in the five cities. The order of the cities is from south to north. The inset shows a larger view of the natural dust concentration.
Influence of Particle Composition and Size on the Accuracy of the Low Cost Instrument
As seen in Table 2, the correlation between the low cost instruments and the standard instruments used for regulatory purposes decreases from south to north. The PM10 correlation coefficient (R2) between the LCM and a collocated standard instrument varied from to 0.95 in Temuco to 0.042 in Los Caleos. PM2.5 correlation varied from 0.97 to 0.68 in the same places.
Figure 8 shows that the fraction of OC in particle matter decreases from south to north, and Wang et al., 2015, observed that several LCMs had a larger response for organic carbon particles (OC) than for inorganic salt particles. Thus the relative response of the Plantower in this work could be lower in the northern cities that have less OC. However, it is also known that OC is not constant throughout the day (Seinfeld and Pandis, 2006; Carbone et al., 2013), as a consequence the Plantower response may change along the day.
He et al., 2019 used the Plantower to test ammonium nitrate and sodium chloride particles and found 1) that particle number distributions from the six channels of the sensor may not reflect actual size distributions and can be significantly erroneous; 2) the reported PM values may be underestimated, especially for larger sized particles. In this work, chloride increases from south to north (Figure 8), so the Plantower could have a larger response in the northern cities due to the relatively larger amount of sodium chloride. Zou et al. (2021) and Northcross et al. (2013) also found a different response for sulfate particles than other particles. In this work, sulfate has a clear increase from the northern to the southern cities and the relative response of the Plantower could change.
Zou et al. (2021) found that the Plantower underestimated the concentration of Arizona Test Dust; Sayahi et al. (2019) found and underestimation for aluminum oxide (a component of natural dust). As shown in Figure 8, the relative concentration of natural dust increases from south to north, so the Plantower could underestimate the concentration in the northern cities. Natural dust concentration in PM2.5 is also higher in the northern cities. Most of this component is made of SiO2 which has a scattering coefficient that has a strong dependence with the particle size (Seinfeld and Pandis 2006). Similar to sulfate and nitrate, SiO2 can generate electronics pulses in the photodiode that are not proportional to particle size, leading to incorrect classification of particles. In addition, natural dust tends to have particles with larger sizes which fall in geometric scattering regime that has a strong dependency on the orientation of the particle. Thus, measuring with low cost monitors in cities that have high concentration of natural dust may induce large errors in the results.
The under- or over-estimation of the concentration would not be a problem if it were constant, because the sensor is calibrated at each site. However, the concentration of the species mentioned is not constant throughout the day, week or season, and it is not possible to find a calibration factor that accounts for this type of changes. As shown in Figure 9 there are larger under- and over-estimations of PM10 in Los Caleos, a site with a relatively large proportion of dust, sulfate and chloride in PM10 and PM2.5.
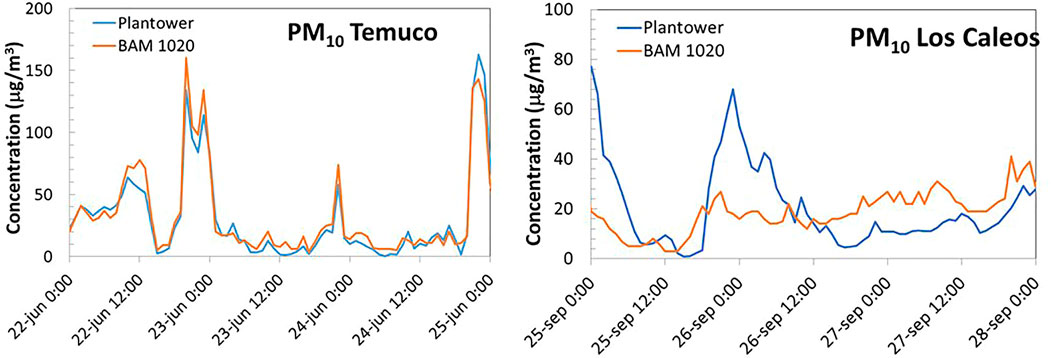
FIGURE 9. Time series of the Plantower and Beta monitors in Temuco and Los Caleos. Large under- and over-estimations of PM10 are seen in Los Caleos, a site with high relative concentrations of dust, sulfate and chloride.
Table 2 shows that in the three cities in the north (Santiago, Quillota and Los Caleos), PM10 is larger than PM2.5 (PM10/PM2.5 ratios of 3.6, 1.9 and 2.5) which indicates that there are many large particles. Some of these particles fall into the geometric scattering regime which means that the light received by the photodiode depends on the orientation of the particle with respect to the laser beam. In this case, large particles can generate electronic pulses of different sizes that can be interpreted incorrectly, thus larger uncertainties in the measurement are obtanined. In contrast, in the southern cities (Talca and Temuco) most particles are smaller (PM10/PM2.5 ratios of 1.26 and 1.14), the scattered light has less dependence with the orientation of the particle and there is smaller uncertainty in the measurement.
Figure 8 shows that in the southern cities (Temuco and Talca) the relative concentration of OC and BC is larger than the northern cities. These species have small sizes (d < 1 μm) but also they come from the same source and most of them have similar composition (Tsapakis et al., 2002; Jorquera et al., 2018) consequently the scattering coefficient is probably similar for most particles. Thus OC and BC are more likely to be classified in the correct size range.
Conclusion
The results show a very large variability in the correlation between the low cost sensors and collocated standard instruments depending on the composition and size of particles present in the site. There seems to be a relation between the accuracy of low cost sensors and the concentration of several species present in PM2.5. Sites that had higher sulfate, nitrate or SiO2 concentrations in PM2.5 had low correlation because these particles have a scattering coefficients that depends on its size, thus they can be classified incorrectly. Sites that had higher relative concentration of organic and black carbon had better correlation between the low cost monitor and the standard instrument because most particles come from the same source and the scattering coefficient is similar. The PM10 correlation coefficient (R2) between the low cost sensor and a collocated standard instrument varied from to 0.95 in Temuco to 0.04 in Los Caleos. PM2.5 correlation varied from 0.970 to 0.676 in the same places. It was found that sites that had higher proportion of large particles had lower correlation between the low cost sensor and the standard instrument. This can be explained because low cost sensors rely on light scattering from the particles to measure PM10 or PM2.5 and large particles induce more errors in the measurements, thus in some places, LCMs cannot be used to measure PM10.
Data Availability Statement
The raw data supporting the conclusion of this article will be made available by the authors, without undue reservation.
Author Contributions
EG, PO, and MR designed the campaign, discussed the results and edited the manuscript; FR and YV designed and conducted the measurement campaigns in Talca and Temuco; CS and EG conducted the measurement campaigns in Santiago, Quillota and Los Caleos; FM and PP analyzed data and prepared the manuscript. All authors contributed to manuscript revision, read, and approved the submitted version.
Funding
This work was supported by Anglo American South, contract N° 4600026126, by CEDENNA USACH AFB 1180001 and the Chilean Ministry of the Environment.
Conflict of Interest
Author NG is employed by Anglo American Sur S. A.
The remaining authors declare that the research was conducted in the absence of any commercial or financial relationships that could be construed as a potential conflict of interest.
Publisher’s Note
All claims expressed in this article are solely those of the authors and do not necessarily represent those of their affiliated organizations, or those of the publisher, the editors and the reviewers. Any product that may be evaluated in this article, or claim that may be made by its manufacturer, is not guaranteed or endorsed by the publisher.
References
Amato, F., Pandolfi, M., Viana, M., Querol, X., Alastuey, A., and Moreno, T. (2009). Spatial and chemical patterns of PM10 in road dust deposited in urban environment. Atmos. Environ. 43, 1650–1659. doi:10.1016/j.atmosenv.2008.12.009
Andrews, E., Saxena, P., Musarra, S., Hildemann, L. M., Koutrakis, P., Mcmurry, P. H., et al. (2000). Concentration and composition of atmospheric aerosols from the 1995 Seavs experiment and a review of the closure between chemical and gravimetric measurements. J. Air Waste Manag. Assoc. 50, 648–664. doi:10.1080/10473289.2000.10464116
Badura, M., Batog, P., Drzeniecka-OsiadaczModzel, A. P., and Modzel, P. (2019). Regression methods in the calibration of low-cost sensors for ambient particulate matter measurements. SN Appl. Sci. 1, 622. doi:10.1007/s42452-019-0630-1
Barot, V., Kapadia, V., and Pandya, S. (2020). QoS Enabled IoT Based Low Cost Air Quality Monitoring System with Power Consumption Optimization. Cybernetics Inf. Tech. 20 (2), 122–140. doi:10.2478/cait-2020-0021
Bulot, F. M. J., Johnston, S. J., Basford, P. J., Easton, N. H. C., Apetroaie-Cristea, M., FosterMorris, G. L. A. K. R., et al. (2019). Long-term field comparison of multiple low-cost particulate matter sensors in an outdoor urban environment. Sci. Rep. 9, 7497. doi:10.1038/s41598-019-43716-3
Carbone, S., Saarikoski, S., Frey, A., Reyes, F., Reyes, P., Castillo, M., et al. (2013). Chemical Characterization of Submicron Aerosol Particles in Santiago de Chile. Aerosol Air Qual. Res. 13, 462–473. doi:10.4209/aaqr.2012.10.0261
Casotti Rienda, I., and Alves, C. A. (2021). Road dust resuspension: A review. Atmos. Res. 261, 105740. doi:10.1016/j.atmosres.2021.105740
Chorley, R. J. (1969). Water, Earth, and Man. A Synthesis of Hydrology, Geomorphology, and Socio-Economic Geography. London: Methuen.
Chow, J. C. (1995). Measurement methods to determine compliance with ambient air quality standards for suspended particles. J. Air Waste Manag. Assoc. 45 (5), 320–382. doi:10.1080/10473289.1995.10467369
Chu, H.-J., Ali, M. Z., and He, Y.-C. (2020). Spatial calibration and PM2.5 mapping of low-cost air quality sensors. Sci. Rep. 10, 22079. doi:10.1038/s41598-020-79064-w
Chung Albert, D. P., Chang, Y., Kleeman, M. J., Perry, K. D., Cahill, T. A., Dutcher, D., et al. (2001). Comparison of Real-Time Instruments Used To Monitor Airborne Particulate Matter. J. Air Waste Manag. Assoc. 51 (1), 109–120. doi:10.1080/10473289.2001.10464254
Clements, A. L., Griswold, W. G., Rs, A., Johnston, J. E., Herting, M. M., Thorson, J., et al. (20192017). Low-Cost Air Quality Monitoring Tools: From Research to Practice (A Workshop Summary). Sensors 17, 2478. doi:10.3390/s17112478
Díaz-Robles, L. A., Fu, J. S., Vergara-Fernández, A., Etcharren, P., Schiappacasse, L. N., Reed, G. D., et al. (2014). Health risks caused by short term exposure to ultrafine particles generated by residential wood combustion: A case study of Temuco, Chile. Environ. Int. 66, 174–181. doi:10.1016/j.envint.2014.01.017
DMC (2021). Chile's Meteorological Directorate. Last accessed September 2021 https://climatologia.meteochile.gob.cl/application/index/menuTematicoPrecipitacion.
Eidhammer, T., Montague, D. C., and Deshler, T. (2008). Determination of index of refraction and size of supermicrometer particles from light scattering measurements at two angles. J. Geophys. Res. 113, D216206. doi:10.1029/2007JD009607
EPA (2021). last accessed September 2021 https://www.epa.gov/criteria-air-pollutants.
EU (2008). Directive 2008/50/EC of the European Parliament and of the Council of 21 May 2008 on Ambient Air Quality and Cleaner Air for Europe. Strasbourg, France: Official Journal of the European Union. https://eur-lex.europa.eu/legal-content/en/ALL/?uri=CELEX%3A32008L0050 (last accessed September, 2021).
Feenstra, B., Papapostolou, V., Hasheminassab, S., Zhang, H., Boghossian, B. D., Cocker, D., et al. (2019). Performance evaluation of twelve low-cost PM2.5 sensors at an ambient air monitoring site. Atmos. Environ. 216, 116946. doi:10.1016/j.atmosenv.2019.116946
Gao, R. S., Perring, A. E., Thornberry, T. D., Rollins, A. W., Schwarz, J. P., Ciciora, S. J., et al. (2013). A High-Sensitivity Low-Cost Optical Particle Counter Design. Aerosol Sci. Tech. 47, 137–145. doi:10.1080/02786826.2012.733039
Golumbic, Y. N., Fishbain, B., and Baram-Tsabari, A. (2019). User centered design of a citizen science air-quality monitoring project. Int. J. Sci. Educ. B 9 (3), 195–213. doi:10.1080/21548455.2019.1597314
Gramsch, E., Morales, L., Baeza, M., Ayala, C., Soto, C., Neira, J., et al. (2020). Citizens' Surveillance Micro-network for the Mapping of PM2.5 in the City of Concón, Chile. Aerosol Air Qual. Res. 20, 358–368. doi:10.4209/aaqr.2019.04.0179
Gramsch, E., Ormeño, I., Palma, G., Cereceda-Balic, F., and Oyola, P. (2004). Use of the Light Absorption Coefficient to Monitor Elemental Carbon and PM2.5-Example of Santiago de Chile. J. Air Waste Manag. Assoc. 54, 799–808. doi:10.1080/10473289.2004.10470956
Gramsch, E., Pedro, O., Oyola, P., Reyes, F., Henríquez, F., and Kang, C.-M. (2021). Trends in particle matter and its elemental composition in Santiago de Chile, 2011 - 2018. J. Air Waste Manag. Assoc. 71 (6), 721–736. doi:10.1080/10962247.2021.1877211
Grimm, H., and Eatough, D. J. (2009). Aerosol Measurement: The Use of Optical Light Scattering for the Determination of Particulate Size Distribution, and Particulate Mass, Including the Semi-Volatile Fraction. J. Air Waste Manag. Assoc. 59 (1), 101–107.
Hagan, D. H., and Kroll, J. H. (2020). Assessing the accuracy of low-cost optical particle sensors using a physics-based approach. Atmos. Meas. Tech. 13, 6343–6355. doi:10.5194/amt-13-6343-2020
Han, P., Mei, H., Liu, D., Zeng, N., Tang, X., Wang, Y., et al. (2021). Calibrations of Low-Cost Air Pollution Monitoring Sensors for CO, NO2, O3, and SO2. Sensors 21, 256. doi:10.3390/s21010256
He, M., Kuerbanjiang, N., and Dhaniyala, S. (2019). Performance characteristics of the low-cost Plantower PMS optical sensor. Aerosol Sci. Tech. 54 (2), 232–241. doi:10.1080/02786826.2019.1696015
Hedberg, E., Gidhagen, L., and Johansson, C. (2005). Source contributions to PM10 and arsenic concentrations in Central Chile using positive matrix factorization. Atmos. Environ. 39, 549–561. doi:10.1016/j.atmosenv.2004.11.001
Jhun, I., Oyola, P., Moreno, F., Castillo, M. A., and Koutrakis, P. (2013). PM2.5 mass and species trends in Santiago, Chile, 1998 to 2010: The impact of fuel-related interventions and fuel sales. J. Air Waste Manag. Assoc. 63 (2), 161–169. doi:10.1080/10962247.2012.742027
Jorquera, H., Barraza, F., Heyer, J., Valdivia, G., Schiappacasse, L. N., and Montoya, L. D. (2018). Indoor PM2.5 in an urban zone with heavy wood smoke pollution: The case of Temuco, Chile. Environ. Pollut. 236, 477–487. doi:10.1016/j.envpol.2018.01.085
Jorquera, H., Villalobos, A. M., and Schauer, J. J. (2021). Wood burning pollution in Chile: A tale of two mid-size cities. Atmos. Pollut. Res. 12, 50–59. doi:10.1016/j.apr.2021.02.011
Karanasiou, A., Moreno, T., Amato, F., Lumbreras, J., Narros, A., Borge, R., et al. (2011). Road dust contribution to PM levels - Evaluation of the effectiveness of street washing activities by means of Positive Matrix Factorization. Atmos. Environ. 45, 2193–2201. doi:10.1016/j.atmosenv.2011.01.067
Kelly, K. E., Whitaker, J., Petty, A., Widmer, C., Dybwad, A., Sleeth, D., et al. (2017). Ambient and laboratory evaluation of a low-cost particulate matter sensor. Environ. Pollut. 221, 491–500. doi:10.1016/j.envpol.2016.12.039
Kleeman, M. J., Schauer, J. J., and Cass, G. R. (1999). Size and Composition Distribution of Fine Particulate Matter Emitted from Wood Burning, Meat Charbroiling, and Cigarettes. Environ. Sci. Technol. 33 (20), 3516–3523. doi:10.1021/es981277q
Kumar, P., Morawska, L., Martani, C., Biskos, G., Neophytou, M., Di Sabatino, S., et al. (20152015). The rise of low-cost sensing for managing air pollution in cities. Environ. Int. 75, 199–205. doi:10.1016/j.envint.2014.11.019
Kumar, S., and Jasuja, A. (20172017). Air Quality Monitoring System Based on IoT using Raspberry Pi, International Conference on Computing. Commun. Automation (Iccca), 1341–1346.
Kuula, J., Mäkelä, T., Aurela, M., Teinilä, K., Varjonen, S., González, Ó., et al. (2020). Laboratory evaluation of particle-size selectivity of optical low-cost particulate matter sensors. Atmos. Meas. Tech. 13, 2413–2423. doi:10.5194/amt-2019-42210.5194/amt-13-2413-2020
Liu, D., Zhang, Q., Jiang, J., and Chen, D.-R. (2017). Performance calibration of low-cost and portable particular matter (PM) sensors. J. Aerosol Sci. 112, 1–10. doi:10.1016/j.jaerosci.2017.05.011
Maag, B., Zhou, Z., and Thiele, L. (2018). A Survey on Sensor Calibration in Air Pollution Monitoring Deployments. IEEE Internet Things J. 5 (6), 4857–4870. doi:10.1109/JIOT.2018.2853660
Manikonda, A., Zíková, N., Hopke, P. K., and Ferro, A. R. (2016). Laboratory assessment of low-cost PM monitors. J. Aerosol Sci. 102, 29–40. doi:10.1016/j.jaerosci.2016.08.010
Mao, F., Khamis, K., Krause, S., Clark, J., and Hannah, D. M. (2019). Low-Cost Environmental Sensor Networks: Recent Advances and Future Directions. Front. Earth Sci. 7, 2019. doi:10.3389/feart.2019.00221
Marple, V. A., and Willeke, K. (1976). Impactor Design. Atmos. Environ. (1967) 10, 891–896. doi:10.1016/0004-6981(76)90144-X
Miskell, G., Salmond, J. A., and Williams, D. E. (2018). Solution to the Problem of Calibration of Low-Cost Air Quality Measurement Sensors in Networks. ACS Sensors 3 (4), 832–843. doi:10.1021/acssensors.8b00074
Molaie, S., and Lino, P. (2021). Review of the Newly Developed, Mobile Optical Sensors for Real-Time Measurement of the Atmospheric Particulate Matter Concentration. Micromachines 12, 416. doi:10.3390/mi12040416
Moosmüller, H., and Arnott, W. P. (2009a). Particle Optics in the Rayleigh Regime. J. Air Waste Manag. Assoc. 59 (9), 1028–1031. doi:10.3155/1047-3289.59.9.1028
Moosmüller, H., Chakrabarty, R. K., and Arnott, W. P. (2009b). Aerosol light absorption and its measurement: A review. J. Quantitative Spectrosc. Radiative Transfer 110, 844–878. doi:10.1016/j.jqsrt.2009.02.035
Morawska, L., Thai, P. K., Liu, X., Asumadu-Sakyi, A., Ayoko, G., Bartonova, A., et al. (2018). Applications of low-cost sensing technologies for air quality monitoring and exposure assessment: How far have they gone. Environ. Int. 116, 286–299. doi:10.1016/j.envint.2018.04.018
Moreno, F., Gramsch, E., Oyola, P., and Rubio, M. A. (2010). Modification in the soil and traffic-related sources of particle matter between 1998 and 2007 in Santiago de Chile. J. Air Waste Manag. Assoc. 60, 1410–1421. doi:10.3155/1047-3289.60.12.1410
Morpurgo, A., Pedersini, F., and Reina, A. (20122012). A low-cost instrument for environmental particulate analysis based on optical scattering. IEEE Int. Instrumentation Meas. Tech. Conf. Proc., 2646–2650. doi:10.1109/2FI2MTC.2012.6229220
Ng, N. L., Herndon, S. C., Trimborn, A., Canagaratna, M. R., Croteau, P. L., Onasch, T. B., et al. (2011). An Aerosol Chemical Speciation Monitor (ACSM) for Routine Monitoring of the Composition and Mass Concentrations of Ambient Aerosol. Aerosol Sci. Tech. 45, 780–794. doi:10.1080/02786826.2011.560211
Nicholson, K. W. (1988). A review of particle resuspension. Atmos. Environ. (1967) 22 (12), 2639–2651. doi:10.1016/0004-6981(88)90433-7
Northcross, A. L., Edwards, R. J., Johnson, M. A., Wang, Z.-M., Zhu, K., Allen, T., et al. (2013). A Low-cost particle counter as a realtime fine-particle mass monitor. Environ. Sci. Process. Impacts 15 (2), 433–439. doi:10.1039/c2em30568b
Park, H.-S., Kim, R.-E., Park, Y.-M., Hwang, K.-C., Lee, S.-H., Kim, J.-J., et al. (2020). The potential of commercial sensors for spatially dense short-term air quality monitoring based on multiple short-term evaluations of 30 sensor nodes in urban areas in Korea. Aerosol Air Qual. Res. 20, 369–380. doi:10.4209/aaqr.2019.03.0143
Peters, T. M., Norris, G. A., Vanderpool, R. W., Gemmill, D. B., Wiener, R. W., Murdoch, R. W., et al. (2001). Field Performance of PM2.5 Federal Reference Method Samplers. Aerosol Sci. Tech. 34, 433–443. doi:10.1080/0278682011687310.1080/027868201750172879
NIOSH (2016). “Chapter DL: Monitoring of diesel exhaust in the workplace,” in NIOSH manual of analytical methods. Editors P. F O’Connor, and K Ashley. 5th ed. (Cincinnati, OH: U.S. Department of Health and Human Services, Centers for Disease Control and Prevention, National Institute for Occupational Safety and Health, DHHS (NIOSH) Publication). No. 2014-151.
Pozo, K., Estellano, V. H., Harner, T., Diaz-Robles, L., Cereceda-Balic, F., Etcharren, P., et al. (2015). Assessing Polycyclic Aromatic Hydrocarbons (PAHs) using passive air sampling in the atmosphere of one of the most wood-smoke-polluted cities in Chile: The case study of Temuco. Chemosphere 134, 475–481. doi:10.1016/j.chemosphere.2015.04.077
Rau, J. A. (1989). Composition and Size Distribution of Residential Wood Smoke Particles. Aerosol Sci. Tech. 10 (1), 181–192. doi:10.1080/02786828908959233
Renard, J.-B., Dulac, F., Berthet, G., Lurton, T., Vignelles, D., Jégou, F., et al. (2016). LOAC: a small aerosol optical counter/sizer for ground-based and balloon measurements of the size distribution and nature of atmospheric particles - Part 1: Principle of measurements and instrument evaluation. Atmos. Meas. Tech. 9, 1721–1742. doi:10.5194/amt-9-1721-2016
Renard, J.-B., Geffrin, J.-M., Valencia, V. T., Tortel, H., Ménard, F., Rannou, P., et al. (2021). Number of independent measurements required to obtain reliable mean scattering properties of irregular particles having a small size parameter, using microwave analogy measurements. J. Quantitative Spectrosc. Radiative Transfer 272 (2021), 107718. doi:10.1016/j.jqsrt.2021.107718
Rudnick, R. L., and Gao, S. (2003). “Composition of the Continental Crust,” in 1–64 of Treatise on Geochemistry. Editors R. L. Rudnick, H. D. Holland, and K. K. Turekian (Oxford: Elsevier-Pergamon), Vol. 3, 1–64. doi:10.1016/B0-08-043751-6/03016-4
Sax, S. N., Koutrakis, P., Ruiz Rudolph, P. A., Cereceda-Balic, F., Gramsch, E., and Oyola, P. (2007). Trends in the Elemental Composition of Fine Particulate Matter in Santiago, Chile, from 1998 to 2003. J. Air Waste Manag. Assoc. 57, 845–855. doi:10.3155/1047-3289.57.7.845
Sayahi, T., Kaufman, D., Becnel, T., Kaur, K., Butterfield, A. E., Collingwood, S., et al. (2019). Development of a calibration chamber to evaluate the performance of low-cost particulate matter sensors. Environ. Pollut. 255, 113131. doi:10.1016/j.envpol.2019.113131
Seinfeld, J. H., and Pandis, S. N. (2006). Atmospheric Chemistry and Physics-From Air Pollution to Climate Change. 2nd ed. HobokenNJ: John Wiley & Sons.
SINCA (2021). National Air Quality Information System in Chile. last accessed: June 2021 https://sinca.mma.gob.cl/.
Snyder, E. G., Watkins, T. H., Solomon, P. A., Thoma, E. D., Williams, R. W., Hagler, G. S. W., et al. (2013). The changing paradigm of air pollution monitoring. Environ. Sci. Technol. 47, 11369–11377. doi:10.1021/es4022602
Sousan, S., Koehler, K., Thomas, G., Park, J. H., Hillman, M., Halterman, A., et al. (2016). Inter-comparison of low-cost sensors for measuring the mass concentration of occupational aerosols. Aerosol Sci. Tech. 50, 462–473. doi:10.1080/02786826.2016.1162901
Stavroulas, I., Grivas, G., Michalopoulos, P., Liakakou, E., Bougiatioti, A., Kalkavouras, P., et al. (2020). Field Evaluation of Low-Cost PM Sensors (Purple Air PA-II) under Variable Urban Air Quality Conditions, in Greece. Atmosphere 11, 926. doi:10.3390/atmos11090926
Szymanski, W. W., and Liu, B. Y. H. (1986). On the Sizing Accuracy of Laser Optical Particle Counters. Part. Part. Syst. Charact. 3, 1–7. doi:10.1002/ppsc.19860030102
Tsapakis, M., Lagoudaki, E., Stephanou, E. G., Kavouras, I. G., Koutrakis, P., Oyola, P., et al. (2002). The composition and sources of PM2.5 organic aerosol in two urban areas of Chile. Atmos. Environ. 36, 3851–3863. doi:10.1016/S1352-2310(02)00269-8
Van Zoest, V., Osei, F. B., Stein, A., Hoek, G., and Hoek, Gerard. (2019). Calibration of low-cost NO2 sensors in an urban air quality network. Atmos. Environ. 210, 66–75. doi:10.1016/j.atmosenv.2019.04.048
Villalobos, A. M., Barraza, F., Jorquera, H., and Schauer, J. J. (20172017). Wood burning pollution in southern Chile: PM 2.5 source apportionment using CMB and molecular markers. Environ. Pollut. 225, 514–523. doi:10.1016/j.envpol.2017.02.069
Wang, Y., Li, J., Jing, H., Zhang, Q., Jiang, J., and Biswas, P. (2015). Laboratory evaluation and calibration of three low-cost particle sensors for particulate matter measurement. Aerosol Sci. Tech. 49, 1063–1077. doi:10.1080/02786826.2015.1100710
Wang, Z., Calderón, L., Patton, A. P., Sorensen Allacci, M., Senick, J., Wener, R., et al. (2016). Comparison of real-time instruments and gravimetric method when measuring particulate matter in a residential building. J. Air Waste Manag. Assoc. 66 (11), 1109–1120. doi:10.1080/10962247.2016.1201022
Wesseling, J., Ruiter, H., Blokhuis, C., Drukker, D., Weijers, E., Volten, H., et al. (2019). Development and Implementation of a Platform for Public Information on Air Quality, Sensor Measurements, and Citizen Science. Atmosphere 10, 445. doi:10.3390/atmos10080445
Xu, R. (2002). in Brian Scarlett (Kluwer: Academic Publishers).Particle Characterization: Light Scattering Methods.
Keywords: low cost sensors, accuracy, particle scattering, PM10 and PM2.5, particle composition
Citation: Gramsch E, Oyola P, Reyes F, Vásquez Y, Rubio MA, Soto C, Pérez P, Moreno F and Gutiérrez N (2021) Influence of Particle Composition and Size on the Accuracy of Low Cost PM Sensors: Findings From Field Campaigns. Front. Environ. Sci. 9:751267. doi: 10.3389/fenvs.2021.751267
Received: 31 July 2021; Accepted: 25 October 2021;
Published: 12 November 2021.
Edited by:
Dmitry Efremenko, Helmholtz Association of German Research Centers (HZ), GermanyReviewed by:
Jean-Baptiste RENARD, UMR7328 Laboratoire de physique et chimie de l'environnement et de l'Espace (LPC2E), FrancePrasenjit Acharya, Vidyasagar University, India
Alena Bartonova, Norwegian Institute for Air Research, Norway
Copyright © 2021 Gramsch, Oyola, Reyes, Vásquez, Rubio, Soto, Pérez, Moreno and Gutiérrez. This is an open-access article distributed under the terms of the Creative Commons Attribution License (CC BY). The use, distribution or reproduction in other forums is permitted, provided the original author(s) and the copyright owner(s) are credited and that the original publication in this journal is cited, in accordance with accepted academic practice. No use, distribution or reproduction is permitted which does not comply with these terms.
*Correspondence: E. Gramsch, ZWdyYW1zY2hAZ21haWwuY29t