 Acharya Asutosh
 Suvarna Fadnavis
 M. Nuncio1
 Rolf Müller
 Sarat C. Tripathy
- 1National Centre for Polar and Ocean Research (NCPOR), Ministry of Earth Sciences, Vasco da Gama, India
- 2School of Earth, Ocean and Climate Science Indian Institute of Technology Bhubaneswar, Odisha, India
- 3CCCR, Indian Institute of Tropical Meteorology, Ministry of Earth Sciences, Pune, India
- 4Forschungszentrum Jülich GmbH, IEK-7, Jülich, Germany
The mechanisms behind Arctic warming and associated climate changes are difficult to discern. Also, the complex local processes and feedbacks like aerosol-cloud-climate interactions are yet to be quantified. Here, using the Community Earth System Model (CAM5) experiments, with emission enhancement of anthropogenic sulfate 1) five-fold globally, 2) ten-times over Asia, and 3) ten-times over Europe we show that regional emissions of sulfate aerosols alter seasonal warming over the Arctic, i.e., colder summer and warmer winter. European emissions play a dominant role in cooling during the summer season (0.7 K), while Asian emissions dominate the warming during the winter season (maximum ∼0.6 K) in the Arctic surface. The cooling/warming is associated with a negative/positive cloud radiative forcing. During the summer season increase in low–mid level clouds, induced by sulfate emissions, favours the solar dimming effect that reduces the downwelling radiation to the surface and thus leads to surface cooling. Warmer winters are associated with enhanced high-level clouds that induce a positive radiative forcing at the top of the atmosphere. This study points to the importance of international strategies being implemented to control sulfate emissions to combat air pollution. Such strategies will also affect the Arctic cooling/warming associated with a cloud radiative forcing caused by sulfate emission change.
Introduction
The Arctic is warming, which is of great concern because of the twofold rise in surface temperature compared to the rest of the world (Cohen et al., 2014; Stjern et al., 2019). This enhanced Arctic warming is known as Arctic amplification. Arctic amplification is manifested as a reduction of sea ice cover (Serreze and Francis 2006; Notz and Stroeve 2016), a changing mass balance of Arctic glaciers and the Greenland ice sheet and has significant effects on the Arctic ecosystem (Hinzman et al., 2013). Arctic warming also impacts the Atlantic overturning circulation (Caesar et al., 2018),mid-latitude weather (Cohen et al., 2014; Cohen et al., 2018), and the winter monsoon over the Asian region via dynamic and teleconnection processes (Gong et al., 2001). The recent increase in anthropogenic activities in the Arctic and its vicinity is one of the factors that amplify climate change in addition to remote influences (Acosta Navarro et al., 2016).
Despite enormous efforts, the underlying causes of Arctic warming remain uncertain because of complex meteorology and a combination of remote and local influences (Screen and Simmonds 2010; Zhang et al., 2018, 2020). The heat and moisture transport from lower latitudes, local forcing and feedback are claimed to cause Arctic warming (Hao et al., 2019; Nygård et al., 2020). The role of snow and sea ice cover, water vapour, clouds, and circulation in Arctic amplification is reported in several studies (Stroeve et al., 2007; Serreze and Barry 2011; Cohen et al., 2018). Further, some studies attribute the GHG induced global warming for increasing Arctic temperatures (Gillett et al., 2008; Stocker et al., 2013), while other studies argue that the Arctic warming (due to GHGs) is compensated by the response to aerosol forcing (Yang et al., 2018; Stjern et al., 2019; Ren et al., 2020).
Arctic warming is also influenced by the long-range transport of aerosols from mid-latitudes (Brock et al., 2011; Breider et al., 2014; Yang et al., 2018). Due to the short residence time, aerosols act as a localized forcing. They have a negative temperature response with an increase in aerosol concentrations. Thus, the regional reduction in aerosol burden has been shown to have a significant warming response in the Arctic (Acosta Navarro et al., 2016). Modelling and observation studies show that variations in Black Carbon (BC), sulfate, and other short-lived air pollutants can help in explaining the amplification of Arctic warming (Quinn et al., 2008; Shindell and Faluvegi 2009; Acosta Navarro et al., 2016; Ren et al., 2020). Among all the aerosol species, sulfate is the dominant component in Arctic regions (Breider et al., 2014; Ren et al., 2020). Sulfate aerosols absorb long wave radiations and warm a layer of the atmosphere where they are present (Zhou and Savijärvi 2014). A layer of sulfate aerosols in the upper troposphere and lower stratosphere cools the surface by solar dimming (Fadnavis et al., 2019). Additionally, sulfate aerosols play an important role in cloud microphysical processes and thus affect cloud radiative forcing (Kiehl et al., 2000; Lohmann et al., 2000; Shupe and Intrieri 2004). However, the overall importance of both the direct and indirect aerosol effects for Arctic warming is not well understood (Schmale et al., 2021).
Long-range transport of sulfate aerosols from regions like Asia and Europe increases the Arctic sulfate burden (Yang et al., 2018). A recent study shows that sulfate aerosols having sources in northern mid-latitudes have a more considerable impact on Arctic temperature than other regions and explain about 20% of the Arctic warming since the early 1980s (Ren et al., 2020). The transport occurs via different layers of the atmosphere (near the surface, mid-troposphere, and through the upper troposphere and lower stratosphere) (Shindell et al., 2008; Fisher et al., 2011). The magnitude of sulfate aerosol transport to the Arctic varies with season with peaks during winter and spring (Breider et al., 2014) (Supplementary Figure S1). Hence it is of interest to investigate the response of Arctic temperatures to the spatiotemporal perturbations of sulfate emissions. The implication of international legislation to curb air pollution has controlled the emission of sulfur dioxide (a gas from which sulfate aerosol particles form) in various countries, e.g., South Asia, East Asia, and Europe (Manktelow et al., 2007; Zheng et al., 2018; Aas et al., 2019). Because of the implementation of new emission control measures after 2013 in China, China’s anthropogenic emissions of SO2, decreased substantially during 2010–2017, while emissions of NH3 and non-methane volatile organic compounds did not change much (Zheng et al., 2018). This implementation affects sulfate aerosol loading in the Arctic since regional transport plays an important role in modulating the Arctic sulfate burden (Shindell et al., 2008). A recent study (Wobus et al., 2016) also reports that arctic temperature response is highly dependent on global sulfate aerosol emissions. The SO2 emission implementation policies may lead to Arctic climate change via sulfate aerosol-induced changes in cloud microphysical processes and radiative forcing. Hence, quantifying the response of different regional and remote forcing is very important (Stjern et al., 2019). In this study, we address the following important science question: What are the effects of sulfate aerosol forcing due to emissions from Europe, Asia, and all over the globe, on Arctic climate? For this purpose, we use datasets from the Precipitation Driver Response Model Intercomparison Project (PDRMIP) experiments (Samset et al., 2016; Myhre et al., 2017; Liu et al., 2018). The three experiments for enhanced sulfate aerosols 1) five-fold globally (SULF5), 2) ten-times over Asia (SULFASIA10), and 3) ten-times over Europe (SULFEUROPE10) are compared with the control experiment. This comparison provides an opportunity of estimating the response of Arctic temperature/climate for global, European, and Asian sulfate emission enhancement. The details about the model and datasets used for this study are provided in the subsequent section. It is worth mentioning that a detailed modelling study using PDRMIP datasets focusing the role of BC and other GHGs on Arctic amplification has already been reprted by Stjern et al. (2019).
Data and Methods
Model and Datasets
We use the Community Earth System Model (CAM5, version 1.1.2) simulations from PDRMIP (Myhre et al., 2017) (http://www.cicero.uio.no/en/PDRMIP/PDRMIP-data-access). The model is the same as Kay et al.(2015) but with a coarser resolution (Myhre et al., 2017); 2.5 × 1.9° in latitude and longitude with 30 vertical levels. CESM1 (CAM5) consists of coupled atmosphere, ocean, land, and sea ice component models. The model uses an emission database (Lamarque et al., 2010) for aerosols and calculates the life-cycle of aerosols along with their optical and physical properties. The past studies show that the model has shown good ability in simulating the mean climate state and variabilities (Myhre et al., 2018; Smith et al., 2018). The CAM5 simulations are chosen due its fair agreement to the magnitude and sign of the multi-model mean (MMM) for Arctic amplification calculation (Stjern et al., 2019).
Experimental Setup
We analyzed three sensitivity experiments for increased anthropogenic sulfate concentration 1) globally, and over 2) Asia, 3) Europe, and a control experiment (Myhre et al., 2017; Stjern et al., 2019). In the global experiment, anthropogenic sulfate concentration has been increased five times all over the globe (SUFL5). On the other hand, in another two regional sensitivity experiments, anthropogenic sulfate concentration (sulfate aerosols hereafter) has been increased by ten-times over Asia (10°–50°N, 60°–140°E) (SUFLASIA10) and Europe (35°–70°N, 10°W–40°E) (SULFEUROPE10). All the enhancements are instantaneous and a setup with fixed sea surface temperature (fixed-SST hereafter). Fixed-SST simulations were widely used to study the fast response (also known as a rapid adjustment) (on a time scale of a month to a season) of the climate system to the initial enhancement/perturbations (Hansen 2005; Bala et al., 2010; Ganguly et al., 2012; Myhre et al., 2017). All the experiments were carried out for 25 years with aerosol emissions of the year 2005. Out of 25 years of simulations, we use the only last 15 years of simulation output to investigate the rapid adjustment/fast response of Arctic temperatures to sulfate enhancement. A brief description of each of the experiments used is provided in Table 1. The spatial extent and global sulfate burden for control as well as emission enhancements are depicted in Supplementary Figure S1.
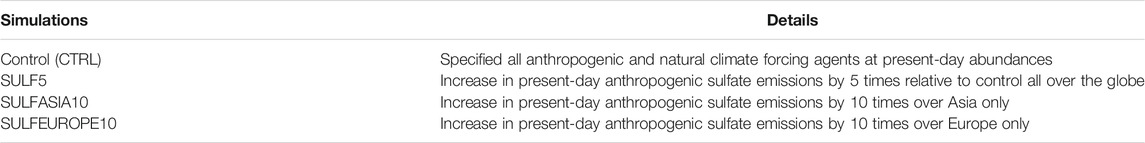
TABLE 1. Experiments used in this study.
Results and Discussion
Impact of Sulfate Forcing on Near-Surface Air Temperature
To study the fast response of the Arctic temperature to regional and global sulfate emission enhancements, we estimated surface temperature changes from EXPT-CTRL (surface temperature anomalies hereafter). Figure 1 shows surface temperature anomalies averaged over 60–80°N. A striking feature seen in Figure 1 is that sulfate aerosol has induced cold spring and summer (March-August). There is a slow transition in Arctic surface temperature; colder summer is followed by warmer autumn-winter (October-February) that passes through a cold phase at the end of summer month (September). The warmer winters are then followed by colder autumn-summers, passing through a warm phase at the end of the winter month (February). Asian emissions play a role in the cooling of the spring (March-April), while the dominant cooling effect due to European and global emissions is evident in summer. The warming effect is most pronounced for Asian and global emissions in winters, except in January where the global emissions produce higher warming than European emissions. A deep in cooling ∼ −0.8 K was seen in summer (July) due to global emissions, while a peak in warming (∼0.6 K) is seen in winter (January) due to Asian emissions. The European emissions also produce significant cooling (−0.6 K) in summer (July).
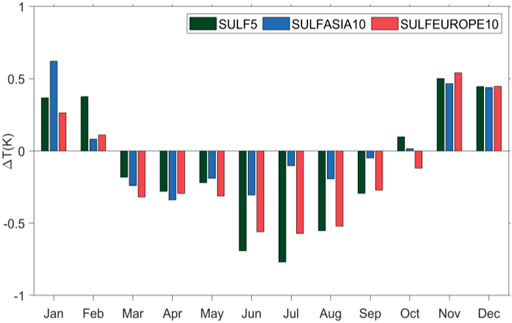
FIGURE 1. Area mean (60–80°N) near-surface air temperature anomalies (EXPTs-CTRL) over the Arctic for different months.
Figure 1 shows that the seasonal response varies in magnitude for the different emission scenarios, but the tendency of cooling (spring-summer) and warming (autumn-winter) is the same for global and regional emission enhancements. The reason for the different seasonal responses for sulfate emission enhancement; cooling in spring-summer and warming in autumn-winter seasons are investigated further in the following sections. The mechanism is the same for 1) cooling in spring and summer and 2) warming in autumn and winter. Hence, we show in the analysis below for the two seasons; summer (June, July, and August months) and winter (November, December, and January), where the emission enhancement response on surface temperature is strongest.
Spatial Distribution of Changes in the Arctic Temperature Due to Sulfate Forcing
Figure 2 shows the spatial distribution of surface temperature anomalies during the summer and winter seasons for different emission enhancement experiments. During the summer season, the surface temperature anomalies are negative over a large part of the polar region irrespective of emission sources (Figures 2A–C). The magnitude of the anomalies varies spatially for each of the emission sources. It may be noted that large spatial cooling is observed over Greenland, part of the Russian Arctic and Siberian region for a change in global and European sulfate emission. However, global emission enhancement impacts are more pronounced over the Canadian Arctic, whereas it is well marked over part of Northern Europe and the Russian Arctic for European emissions changes. Interestingly, the surface temperature anomalies during the winter season highlight the dominant effect of Asian emissions over global and European emissions (Figure 2D–F). Unlike the summer season, the winter season shows a positive anomaly (warming) over the polar and adjacent regions.
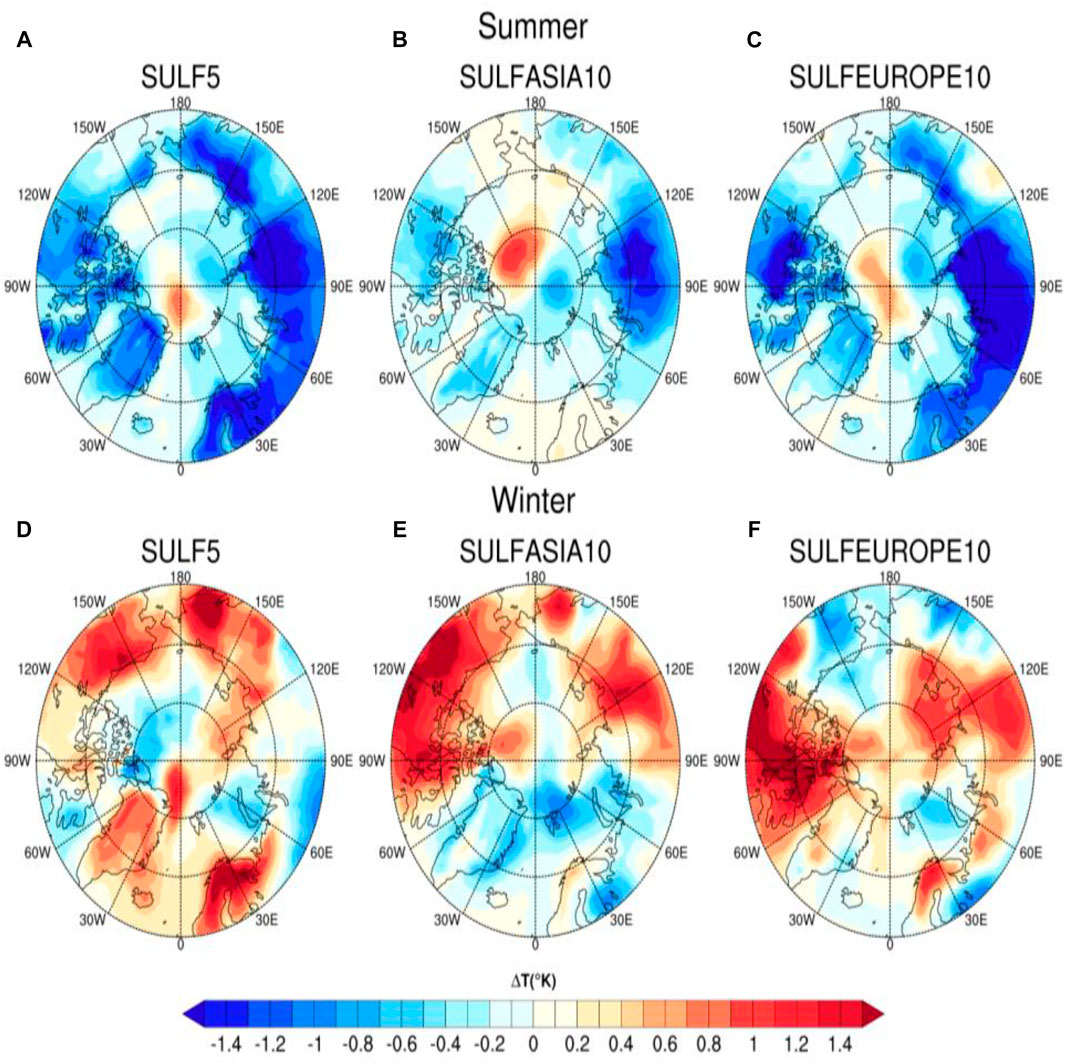
FIGURE 2. Spatial changes (EXPTs minus CTRL) of near-surface temperature during summer (A–C) and winter (D–F).
The magnitude and spatial extent of warming in winter (over 60–80°N) are larger for regional sulfate emission enhancements than for the global emission enhancement. The spatial map of anthropogenic emissions enhancements for all the scenarios (global, Asia and Europe) (Supplementary Figure S2) shows that the anthropogenic sulfate emissions are confined in the northern hemisphere. Thus, their impact on Arctic regions is largely modulated by seasonal transport processes, forcing, and through feedback and response mechanisms.
Latitudinal Temperature Changes Due to Sulfate Forcing
Figure 3 depicts the latitudinal distribution of zonal mean surface temperature anomalies for the three sulfate enhancement experiments considered in this study. It shows gradual diversification of surface temperature anomalies, over the subtropics (∼20–40°N) that amplify in the polar region. In the subtropics, the surface temperature anomalies are negative irrespective of season and forcing. The seasonal effects are opposite north of 50°N, the magnitude of summer cooling is highest due to global and European emission (∼67°N), and the winter warming is dominant due to Asian and global emissions (∼65°N). Warming during the winter season shows a maximum of ∼78°N due to European emissions. The relative strength of cooling is comparatively less than that of warming for Asian emission enhancement. It is interesting to note that the surface temperature response to anthropogenic sulfate emission is clearly visible over sub-tropical to polar latitudes. However, the changes are maximum for the polar latitudes (60–80°N) irrespective of seasons. For this reason, we have chosen the above latitude range as a representation of the Arctic region and used it for calculating spatial averaging in this study.
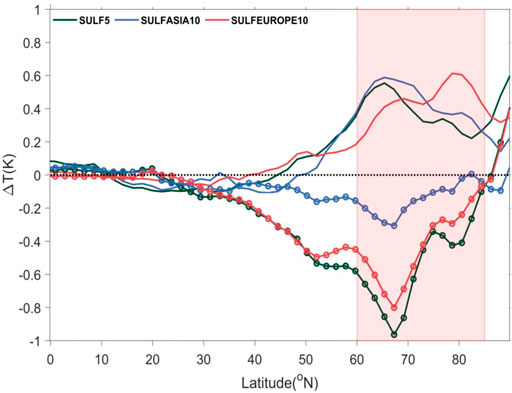
FIGURE 3. Zonal mean surface temperature anomalies for summer (solid line with markers) and winter (solid lines) for SULF5 (green line), SULFASIA10 (blue line) and SULFEUROPE10 (red line) experiments. The shading shows the zone of maximum effect.
Vertical Distribution of Temperature Changes Due to Sulfate Forcing
To examine the vertical extent of seasonal warming and cooling, we have analysed the latitude height cross-sections of temperature anomalies (Figure 4).
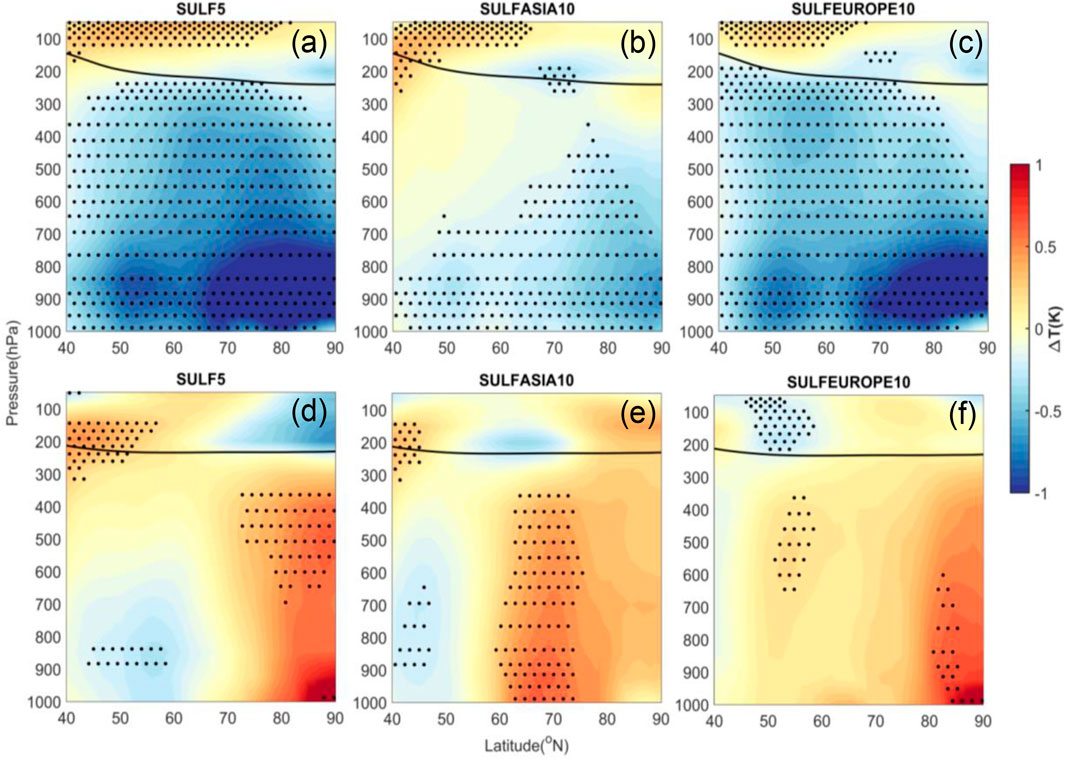
FIGURE 4. Zonal mean latitude-height plot of air temperature anomalies for summer (A–C) and winter (D–F). Stippling indicates statistical significance at 90% confidence level (EXPT-CTRL) determined using student’s t-test for the difference of the mean. The black line indicates the climatological tropopause (CTRL) for corresponding seasons.
The temperature changes are prominent beyond the north of 40°N (Figure 3); hence, we show vertical temperature anomalies between 40–90°N. Interestingly, the temperature response to emission enhancement extends from the surface to the lower stratosphere (150 hPa) at high latitudes. It may be noted that there exists a widespread anomalous cooling pattern during the summer season in all three experiments. During the summer, cooling is strongest in the lower troposphere (1,000–800 hPa) for the global and European emission experiments. Maximum cooling (>1 K) is observed north of 66° for the global and European experiment (Latitudinal Temperature Changes Due to Sulfate Forcing). The vertical extent of the magnitude of cooling is lowest for Asian emission enhancements compared to the global and European emissions.
The warming in winter, however, mostly observed over the high latitudes, are quite distinct in each experiment. The results for the different emission experiments differ in the maximum temperature anomaly and in the vertical extent of the signal. Unlike the other two experiments, the Asian emission experiment shows a high magnitude of warming extending to Upper Troposphere—Lower Stratosphere (UTLS ∼100 hPa) in the region 75–90°N. The strength of winter warming over high latitudes is moderate for global and European sulfate perturbations. The warming in the UTLS in the SULFASIA10 experiment is due to the transport of Asian sulfate aerosols to the Arctic through the UTLS (Shindell et al., 2008; Fadnavis et al., 2019). The Community Atmosphere Model, version 5 equipped with Explicit Aerosol Source Tagging (CAM5-EAST) simulations also show that increases in emissions from South and East Asia led to positive trends (1980–2018) in Arctic sulfate in the upper troposphere (Ren et al., 2020). On the other hand, the warming is mostly observed close to the Arctic surface (60–80ºN) for European emissions since a higher amount of sulfate aerosols are transported from Europe than for global/Asia to the Arctic through the lower troposphere in winter (Shindell et al., 2008). A source attribution study (Ren et al., 2020) also shows that surface concentrations of sulfate in the Arctic are mainly dominated due to emissions from Europe, Russia, and the local Arctic. On the other hand, South and East Asia sulfate emissions enhancement mainly causes an increase in the upper tropospheric sulfate concentration in the Arctic.
The magnitude and spread of emissions perturb energy balance by altering radiative forcing. As a response, the transport of moisture and energy from the tropics to the polar regions and clouds also change. The clouds are one of the important forcing agents regulating the Arctic climate (Bennartz et al., 2013; Willis et al., 2018). Cloud radiative forcing may be playing a role during summer and winter that has not been reported hitherto. In the next section, we deliberate the impact of sulfate emissions enhancement on Arctic clouds.
Impacts of Sulfate Forcing on Clouds
Clouds are critical to Arctic climate feedbacks. However, Arctic clouds and their radiative impacts are difficult to observe and evaluate in climate models (Kay and Gettelman 2009). The community atmospheric model (CAM) version 5 has a more realistic representation of cloud properties than the previous version. This version exhibits substantial improvement in three long-standing climate model cloud biases like the underestimation of total cloud, the overestimation of optically thick cloud, and the underestimation of midlevel cloud (Kay et al., 2012). The Arctic cloud fraction seasonal cycle and annual mean cloud fraction are found to be comparable with the CALIPSO observation (Kay et al., 2012). Hence, the selection of CAM5 to evaluate the response of Arctic clouds to aerosol changes may add more confidence to the findings presented in the subsequent section. However, there are other biases in the CESM-I, e.g., biases in the relative distributions of cloud cover, microphysics including phase, and the characteristics of the underlying surface. These biases are the same in the CTRL and sensitivity simulations that lenient the biases in the estimated change in cloud parameters.
The vertical distribution of anomalies in the cloud fraction/cover (Figure 5) shows a pronounced difference between the summer and winter seasons. The clouds considered are low clouds when formed between 1,000–600 hPa, mid clouds: 600–300 hPa, and high clouds: 300–50 hPa. The column average of cloud fraction/cover is depicted in Supplementary Figure S3. During summer, cloud fraction anomalies for all three experiments exhibit higher values of positive anomalies in the lower-mid troposphere (800–500 hPa) indicating higher amounts of low-mid clouds than high clouds over most of the Arctic region. The global and European emissions contribute more strongly than the Asian emissions towards the low cloud enhancement in the Arctic (also see Supplementary Figure S3). In all three experiments, during winter, cloud fraction anomalies are positive in the lower stratosphere region in the Arctic, indicating high clouds. The cloud anomalies are mostly negative in the lower and mid-troposphere (except near 80–85°N for Asian emissions), indicating low-mid cloud’s absence. Thus, during winter, European, Asian, and global emissions result in the formation of high clouds in the Arctic. The high cloud amounts are found to be higher in magnitude for Asian and global emissions than for European emissions. Vertically integrated cloud fractions show a maximum over parts of Greenland, Canadian Arctic, and the Russian Arctic regions (Supplementary Figure S3).
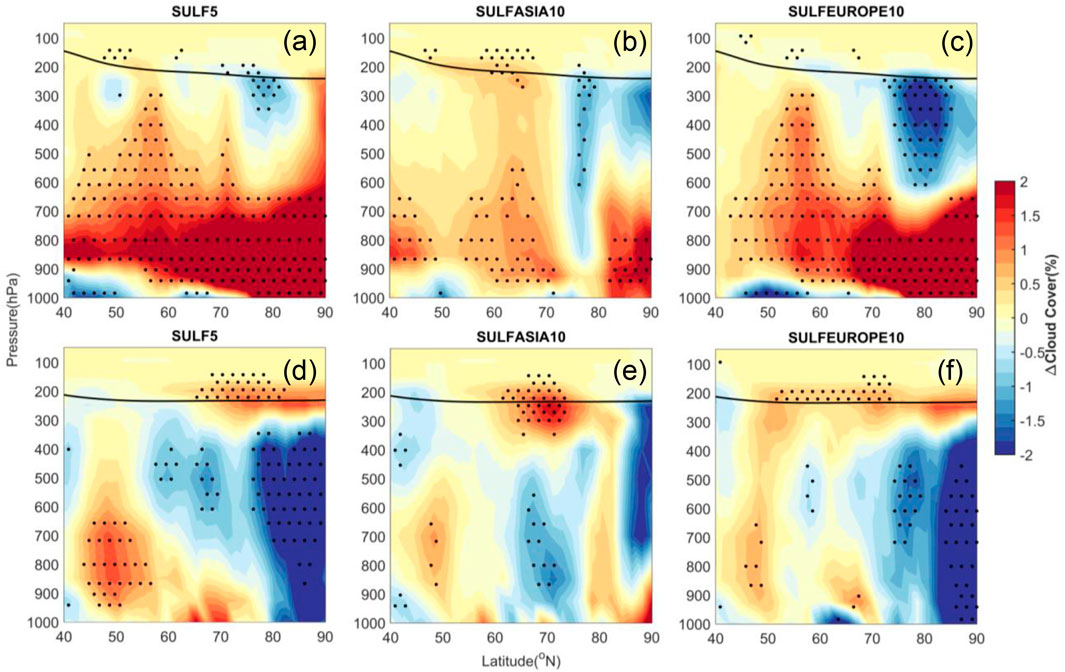
FIGURE 5. Zonal mean latitude-height plot of cloud fraction for summer (A–C) and winter (D–F) for SULF5, SULFASIA10, SULFEUROPE10 experiments. Stippling indicates statistical significance at 90% confidence level determined using student’s t-test for the difference of the mean. The black line indicates the climatological tropopause (CTRL) for corresponding seasons.
The enhancement on low/high clouds in summer/winter seen in Figure 5 is linked with the layer of the atmosphere through which transport of sulfate aerosols to the Arctic occurs. Higher amounts of low clouds in summer for European and global emission enhancements are associated with the transport of sulfate aerosols through the lower-mid troposphere (Shindell et al., 2008). The prevailing meteorological conditions in summer, i.e. increase in solar radiation, melting of ice, warm-air advection from adjacent open water or land over the melting ice, increase in cloud liquid water path and surface evaporation rate, upward heat fluxes, together further enhance the low-mid cloud formation (Sotiropoulou et al., 2016; Yu et al., 2019). High clouds in winters for Asian and global emission enhancement are associated with the transport of sulfate aerosols through the UTLS (Shindell et al., 2008; Ren et al., 2020). Sulfate aerosols are known to play an important role in the formation of high clouds (Aloyan et al., 2016). Previous studies have also reported high cloud formation in the lower stratosphere (between 50 and 200 hPa) in the Arctic both during the winter and summer seasons (Fadnavis et al., 2019; Cairo and Colavitto 2020). Arctic clouds in the stratosphere in winter (polar stratospheric clouds) occur because of low stratospheric temperatures (e.g., Grooß and Müller, 2021; Tritscher et al., 2021). During summer, the negative anomalies in the high cloud in the upper troposphere (300–150 hPa) may be associated with the transport of sulfate aerosols mostly occurring above the tropopause (Fadnavis et al., 2019). However, detailed analysis in this regard is warranted.
Clouds interact with radiation depending on their height and optical properties. In general, low clouds have a net cooling effect on the Earth’s surface and atmosphere due to their large reflection in the shortwave (overcompensating their absorption in the long-wave). On the other hand, high clouds which are much colder than the low clouds, warm the Earth’s surface and atmosphere by trapping and re-emitting the outgoing infrared radiation (Shupe and Intrieri, 2004). Hence, clouds and the associated radiative effects induced by sulfate emission enhancements will affect the Arctic temperature. Figures 4, 5 together show a strong association between seasonal change in temperature and low/high clouds. To quantify the effects of clouds on radiation and energy balance, we compute cloud radiative forcing, which largely depends on cloudiness. We have quantified the change in cloud radiative forcing for summer and winter corresponding to each forcing experiment in the subsequent sections.
Impact of Sulfate Forcing on Cloud Radiative Forcing
Cloud radiative forcing (CRF hereafter) is defined as the difference between the net radiation flux with and without all/cloud and clear sky (Bennartz et al., 2013; Cox et al., 2016).
The LW and SW represent the shortwave and long-wave radiation flux, respectively. The up/down arrows correspond to the direction (outgoing/incoming) of radiation. The total CRF can hence be written as
The CRF can further be decomposed into Top of the atmosphere (TOACRF) and Surface/Bottom of the atmosphere (BOACRF). We have demonstrated the change at CRF for the top/bottom of the atmosphere for the summer and winter seasons to evaluate the response of emission enhancements to radiation through clouds. During the summer season, top of the atmosphere cloud radiative forcing anomalies (Figures 6A–C, top panel) show a widespread cooling for global and European emission enhancements. Most of the polar region exhibits a negative CRF (<−5 Wm−2) for these emission scenarios. On the other hand, for the Asian emission experiments, there is a mixed response observed for TOACRF. In this case, there is both cooling and warming, with the warming effect (positive CRF) mostly at higher latitudes. The ∼10–15% reduction in TOACRF (when averaged over the polar region) is seen in the summer season for European emission and global emission enhancements (also see Figure 7). The overall effect of Asian emissions to TOACRF is negative when averaged over the area 60–80°N (see Figure 7). Additionally, the CRF anomalies in BOACRF are negative irrespective of emission sources (Figure 6G–I). Though there is varying spatial distribution, the area-averaged values show a maximum reduction of radiative forcing for European emissions. During summer, low cloud enhancement (Impacts of Sulfate Forcing on Clouds) could be the reason behind these anomalous negative TOACRF and BOACRE values caused by the cloud induced higher reflection of shortwave insolation to space compared to the reflection in CTRL. During winter, TOACRF and BOACRF anomalies show positive radiative forcing values (i.e., long-wave absorption). Interestingly, the magnitude of the TOACRF is more distinct than that of BOACRF, which could be due to the enhancement of high clouds (Figure 5D–F). Please note that negative cloud radiative forcing during summer and positive during winter at Arctic sites are also reported (Dong et al., 2010; Ebell et al., 2020) in the past which is in agreement with our study. Long-term satellite observation revealed that in general, Arctic ocean clouds warm the surface and cool the TOA with a tendency of shortwave TOA cooling and longwave TOA warming (Kay and L’Ecuyer 2013). Recently, the negative cloud radiative effect during northern summer and warming during winter was also reported over the Arctic from the Clouds and the Earth’s Radiant Energy System (CERES) Energy Balanced and Filled (EBAF) observations by L’Ecuyer et al. (2019) in line with our findings.
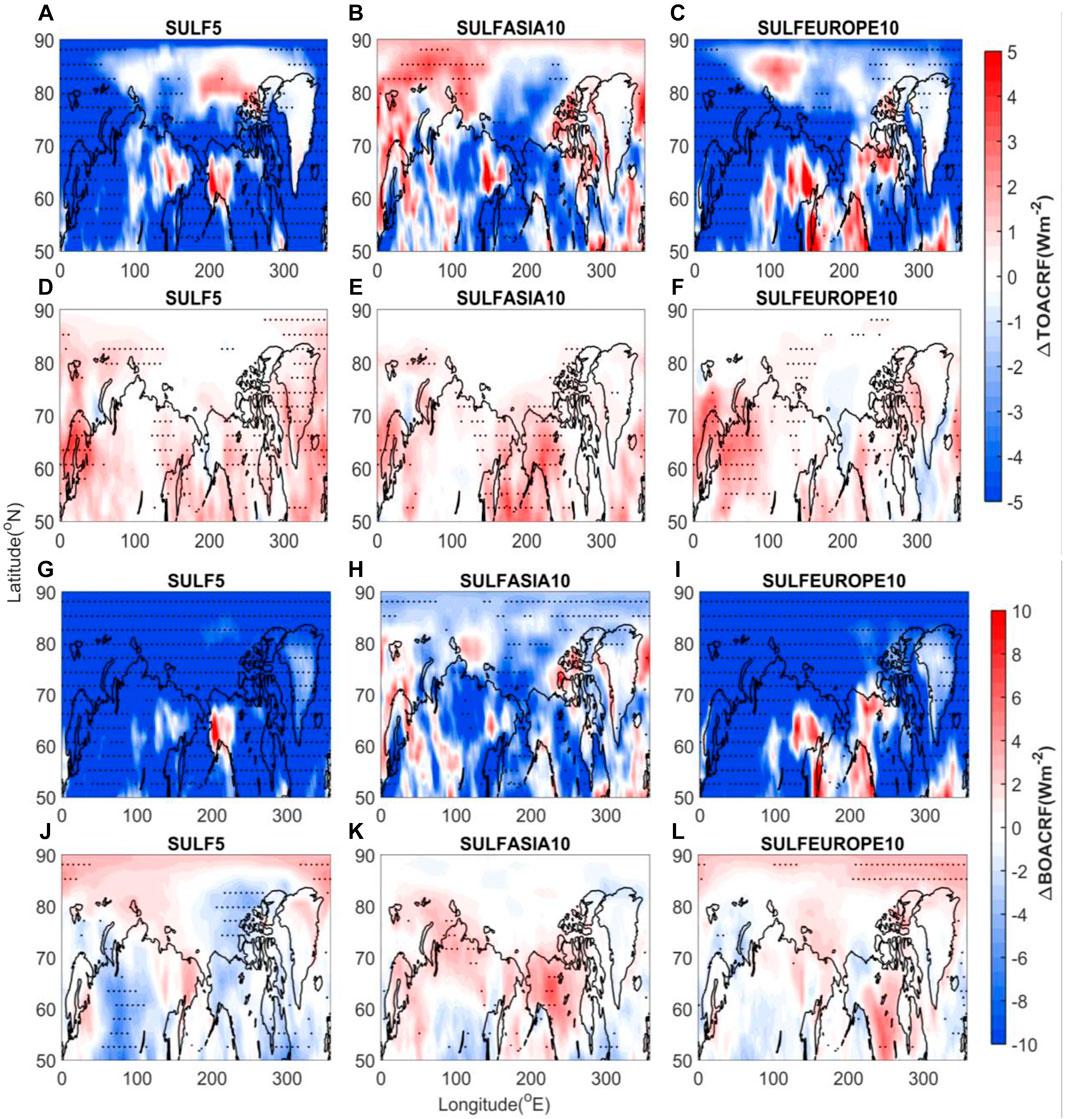
FIGURE 6. Cloud radiative forcing anomalies (EXPT-CTRL) at top of the atmosphere for (A–C) summer season and (D–F) winter, (G–I) same as (A–C) but for the bottom of the atmosphere, (J–L) same as (D–F) but for the winter season. Stippling indicates statistical significance at 90% confidence level determined using student’s t-test for the difference of the mean.
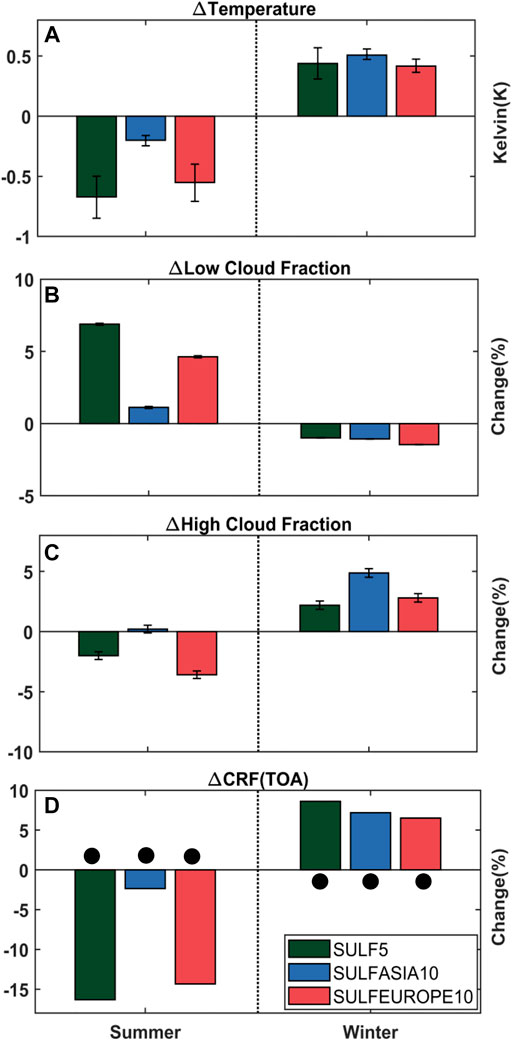
FIGURE 7. Area averaged (60–80°N, all longitudes) for key parameters. Panel (A) shows surface temperature anomalies for summer and winter. Panel (B–C) shows cloud fraction changes for low and high clouds (in percentage) where error bars represent the standard error of the percentage change. The bottom panel (D) depicts the cloud radiative forcing (SW + LW) anomalies for the top of the atmosphere. The black dots are assigned where the mean differences are statistically significant (p < 0.1) determined using the student’s t-test for the difference of the mean.
It is important to note that there is no shortwave insolation in the Arctic region during winter, and thus the terrestrial radiation is the dominant component of the energy budget (Ebell et al., 2020). The positive CRF warming anomalies at the top and bottom are due to the LW radiation trap in the atmospheric column. Further, during winter, there is a significant increase in the high cloud fractions over the polar latitudes, which is seen in all emission experiments (Figure 5). The high clouds absorb the terrestrial radiation that would otherwise escape to space and re-radiate back, while the absorption and the re-radiation are not independent. This further enhances the warming in the atmosphere (Figure 4).
Linkages Between Surface Temperature, Cloud Fraction, and Radiative Forcing
Here, we show linkages of the fast response of clouds and Arctic surface temperature due to regional and global enhancement of sulfate emissions. Figures 7A,B depicts the seasonal mean area-averaged values (60–80°N, zonal mean) for surface temperature anomalies and low cloud fractions. It shows that cooling in summer is associated with an enhancement in low cloud fractions and a reduction in high cloud fractions for all emission scenarios. In the summer season, the maximum enhancement in low cloud fraction (∼7%) has been found for global sulfate emission enhancements followed by enhancements of European emissions (>5%). The winter warming shows association with a reduction in low could fraction and enhancement in high cloud fraction for all emission scenarios (Figures 7B–C). During winter, the impact of Asian and European emission enhancements is higher than the global emissions in enhancing the high clouds.
During the summer season, an increase (decrease) in low (high) clouds is favourable to the solar dimming effect that reduces the downwelling radiation to the surface. Further, these conditions help to allow more terrestrial long-wave radiation to escape to space, which accelerates the surface and atmospheric cooling. On the other hand, during the winter season, the Arctic energy balance is dominated by long-wave radiation (due to the absence of sunlight). The presence of anomalous high clouds cover for all emission enhancements will result in absorbing and reradiating the outgoing long-wave radiation back to the surface.
To find the association of seasonal mean cloud change with radiation, we calculated the area-averaged top of the atmosphere cloud radiative forcing anomalies for summer and winter (Figure 7D). There is a negative cloud radiative forcing at the top of the atmosphere for the summer season. It is 10 times higher than clear sky (aerosols) radiative forcing at the top of the atmosphere for the summer season (Supplementary Figure S4). The negative radiative forcing is an indication of net cooling. Though our findings are in phase with the change in high and low clouds and associated changes in surface temperature, this generalization may not always be true in the Polar Regions. The warming or cooling caused by the low clouds depends on the cloud phase, water path, and the albedo of the underlying surface (Kravitz et al., 2014). A few studies reported that low clouds over bright surfaces induce warming even in the summer months (Bennartz et al., 2013; Van Tricht et al., 2016). However, a detailed analysis of the cloud phase, water path, and surface albedo is beyond the scope of the present study.
Additionally, there exists an anomalous positive CRF during winter; however, the net percentage change in TOACRF exceeds BOACRF in both seasons (Figure 6). This cloud-radiation change is consistent with the simulated surface temperature changes as a response to sulfate emission enhancements. Figure 7 also shows that the seasonal mean cloud fraction and CRF are more sensitive to European emissions and global emissions than Asian emissions in summer. In winter, Asian and global emissions show higher impacts on CRF than European emissions. This is consistent with summer (winter) surface temperature cooling (warming) showing a dominant impact by global and European (Asian and global) emission changes (also see Figure 1). Note that there is a slight increase in summertime high clouds for the Asian emission enhancement scenario (Figure 7C, blue). Additionally, the low cloud enhancement for the Asian emission scenario is comparatively smaller than the rest of the cases (Figure 7B, blue). This might be one of the reasons for the comparative smaller Arctic summer temperature response to the Asian emissions experiment. Cloud phase and, specifically, the presence of super-cooled water play a significant role in the net radiative effects of clouds at the surface. It is to be noted that there are substantial biases in liquid holding clouds over the Arctic in the CESM1 (Cesana et al., 2012) and the associated cloud microphysical processes (Tan and Storelvmo 2016) that might affect the downwelling longwave radiation and, in turn to the surface temperature (McIlhattan et al., 2017). In addition, it is worth mentioning that Arctic cloud characteristics and representation have substantially improved from CESM1 to CESM2 that has impacted their effects on the surface radiation budget (McIlhattan et al., 2020).
Summary
Despite various observational and modelling studies, the underlying mechanisms of Arctic amplification are still unclear. In particular, the impact of aerosols compared to the GHGs is yet to be accounted for precisely. Using an atmospheric global climate model, we estimate the impact of global and regional sulfate emissions on the temperature response over the Arctic region. We found different Arctic temperature changes for summer (colder summers) and winter (warmer winters). Our analysis shows that sulfate emission enhancements, both regionally and globally, produce a clear seasonal shift in the temperature from colder summer to warmer winter. The anomalous cooling/warming in summer/winter induced by the sulfate aerosol extends from the surface to the lower stratosphere. The warming in winter is pronounced due to Asian and global emissions on the contrary cooling in summer is due to European and global emissions. The European emissions show a higher impact on cooling in the summer season (with a low of ∼ –0.7 K in July), while Asian emissions show the strongest impact on warming in the winter season (with a peak of ∼0.6 K in January).
Further, our analysis shows that in summer, in all emission (sulfate aerosol) enhancement scenarios, there is an increase in low clouds causing a solar dimming effect that reduces the downwelling shortwave radiation to the surface. Additionally, as the low clouds are near the surface, they do not significantly affect the terrestrial radiation emitted to space (https://earthobservatory.nasa.gov/features/Clouds/clouds4.php). On the contrary, during the winter, anomalous high clouds induced by sulfate aerosols (in all emission enhancement scenarios) absorb and re-radiate the outgoing long-wave radiation back to the surface, producing warming over the surface and in the troposphere.
The enhancement on low/high clouds in summer/winter (Figure 5) is associated with the layer of the atmosphere through which transport of sulfate aerosols to the Arctic occurs. In summer, the transport of sulfate aerosol from Europe and the globe occurs through the low-mid troposphere. These sulfate aerosols increase low clouds in the Arctic. The prevailing meteorological condition in summer, e.g., increase in solar radiation, melting of surface ice, warm-air advection from adjacent open water or land over the melting ice, increase in cloud liquid water path and surface evaporation rate, upward heat fluxes, further enhances the low-mid cloud formation (Sotiropoulou et al., 2016; Yu et al., 2019). During winter, the transport of European and Asian sulfate aerosols are dominant in the upper troposphere in the Arctic (Shindell et al., 2008; Fadnavis et al., 2019; Ren et al., 2020). The enhanced aerosols in the UTLS are associated with an increase in high clouds.
During summer, low cloud enhancement produces a negative TOACRF and BOACRE due to a cloud induced higher reflection of solar insolation to space compared to that of the CTRL. During winter, TOACRF and BOACRF anomalies show positive values (more absorption by clouds). CRF is more sensitive to European emissions and global emissions than to Asian emissions in summer. In winter, Asian and global emission enhancements show a higher impact than European emission enhancements on CRF. This result is consistent with summer (winter) surface temperature cooling (warming) that indicates a dominant influence of global and European (European and Asian) emission enhancements.
Thus, our analysis shows that during summer, sulfate aerosol transport (dominated by global emissions and from Europe) occurs through the lower-mid troposphere, thus increasing low clouds, which produce a negative cloud radiative forcing and an anomalous cooling at the surface. In contrast, in the winter season, the transport of sulfate aerosols occurs through the upper troposphere that increases high cloud occurrence, leading to a positive radiative forcing and warming at the surface over the Arctic region. It is noteworthy that there are uncertainties in aerosol direct radiative effect due to relative placement of aerosols above the cloud and bright surface that might influence the results presented here. For example, recent findings (Matus et al., 2019) show that the aerosol direct radiative forcing is very sensitive to the albedo of the underlying surface or cloud cover. Additionally, CESM1 produced larger than observed aerosol radiative forcing over both the Poles which may lead to significant regional biases (Matus et al., 2015). Also, there are substantial biases in liquid holding clouds over the Arctic in the CESM1 (Cesana et al., 2012) and the associated cloud microphysical processes (Tan and Storelvmo 2016) that might affect the downwelling longwave radiation and, in turn to the surface temperature (McIlhattan et al., 2017). However, biases are the same in CTRL and sensitivity simulations; hence they are almost nullified in the estimated anomalies/changes.
It is known that clouds play an important role in controlling the Earth’s atmospheric radiation balance and thereby produce a measurable impact in regulating regional climate. While summer cooling and winter warming is an intrinsic nature of polar clouds (Ebell et al., 2020), our study highlights that sulfate aerosols from Europe and Asia play an important role in modulating seasonal temperature via cloud radiative forcing. Since climate mitigation policies suggest different sulfate emission projections in Representative Concentration Pathways and Shared Socioeconomic Pathways (RCPs/SSPs), it is necessary to quantify the effects of regionally resolved sulfate emission changes to polar climate. It would help to design sustainable policies for the Arctic region.
Data Availability Statement
The original contributions presented in the study are included in the article/Supplementary Material, further inquiries can be directed to the corresponding author.
Author Contributions
AA and SF formulated the work, AA analysed the data. AA and SF wrote the article. MN, RM, ST, and MR contributed to the analysis and writing. This article is the combined efforts of all the co-authors.
Conflict of Interest
The authors declare that the research was conducted in the absence of any commercial or financial relationships that could be construed as a potential conflict of interest.
Publisher’s Note
All claims expressed in this article are solely those of the authors and do not necessarily represent those of their affiliated organizations, or those of the publisher, the editors and the reviewers. Any product that may be evaluated in this article, or claim that may be made by its manufacturer, is not guaranteed or endorsed by the publisher.
Acknowledgments
AA is thankful to Dr Bjørn Samset for providing access to the PDRMIP model output (for data access, please visit http://www.cicero.uio.no/en/PDRMIP/PDRMIP-data-access). The authors are also grateful to the developers from Max-Planck-Institut für Meteorologie and National Center for Atmospheric Research (NCAR) for providing open-source software like CDO and NCL. The authors are thankful to Director NCPOR for constant encouragement and support. The authors are also thankful to the staff of the High-Power Computing Centre (HPC) in IITM, Pune, India, for providing computer resources.
Supplementary Material
The Supplementary Material for this article can be found online at: https://www.frontiersin.org/articles/10.3389/fenvs.2021.766538/full#supplementary-material
References
Aas, W., Mortier, A., Bowersox, V., Cherian, R., Faluvegi, G., Fagerli, H., et al. (2019). Global and Regional Trends of Atmospheric Sulfur. Sci. Rep. 9, 1–11. doi:10.1038/s41598-018-37304-0
Acosta Navarro, J. C., Varma, V., Riipinen, I., Seland, Ø., Kirkevåg, A., Struthers, H., et al. (2016). Amplification of Arctic Warming by Past Air Pollution Reductions in Europe. Nat. Geosci 9, 277–281. doi:10.1038/ngeo2673
Aloyan, A. E., Yermakov, A. N., and Arutyunyan, V. O. (2016). The Role of Sulfate Aerosol in the Formation of Cloudiness over the Sea. Izv. Atmos. Ocean. Phys. 52, 353–364. doi:10.1134/S0001433816040022
Bala, G., Caldeira, K., and Nemani, R. (2010). Fast versus Slow Response in Climate Change: Implications for the Global Hydrological Cycle. Clim. Dyn. 35, 423–434. doi:10.1007/s00382-009-0583-y
Bennartz, R., Shupe, M. D., Turner, D. D., Walden, V. P., Steffen, K., Cox, C. J., et al. (2013). July 2012 Greenland Melt Extent Enhanced by Low-Level Liquid Clouds. Nature 496, 83–86. doi:10.1038/nature12002
Breider, T. J., Mickley, L. J., Jacob, D. J., Wang, Q., Fisher, J. A., Chang, R. Y.-W., et al. (2014). Annual Distributions and Sources of Arctic Aerosol Components, Aerosol Optical Depth, and Aerosol Absorption. J. Geophys. Res. Atmos. 119, 4107–4124. doi:10.1002/2013JD020996
Brock, C. A., Cozic, J., Bahreini, R., Froyd, K. D., Middlebrook, A. M., McComiskey, A., et al. (2011). Characteristics, Sources, and Transport of Aerosols Measured in spring 2008 during the Aerosol, Radiation, and Cloud Processes Affecting Arctic Climate (ARCPAC) Project. Atmos. Chem. Phys. 11, 2423–2453. doi:10.5194/acp-11-2423-2011
Caesar, L., Rahmstorf, S., Robinson, A., Feulner, G., and Saba, V. (2018). Observed Fingerprint of a Weakening Atlantic Ocean Overturning Circulation. Nature 556, 191–196. doi:10.1038/s41586-018-0006-5
Cairo, F., and Colavitto, T. (2020). Polar Stratospheric Clouds in the Arctic. New York, United States: Springer, Cham, 415–467. doi:10.1007/978-3-030-33566-3_7
Cesana, G., Kay, J. E., Chepfer, H., English, J. M., and Boer, G. (2012). Ubiquitous Low‐level Liquid‐containing Arctic Clouds: New Observations and Climate Model Constraints from CALIPSO‐GOCCP. Geophys. Res. Lett. 39, 20804. doi:10.1029/2012GL053385
Cohen, J., Zhang, X., Francis, J., Jung, T., Kwok, R., OverlandJ., , et al. (2018). Arctic Change and Possible Influence on Mid-latitude Climate and Weather. US CLIVAR Rep. 45, 1–41. doi:10.5065/D6TH8KGW.CONTRIBUTORS
Cohen, J., Screen, J. A., Furtado, J. C., Barlow, M., Whittleston, D., Coumou, D., et al. (2014). Recent Arctic Amplification and Extreme Mid-latitude Weather. Nat. Geosci 7, 627–637. doi:10.1038/ngeo2234
Cox, C. J., Uttal, T., Long, C. N., Shupe, M. D., Stone, R. S., and Starkweather, S. (2016). The Role of Springtime Arctic Clouds in Determining Autumn Sea Ice Extent. J. Clim. 29, 6581–6596. doi:10.1175/JCLI-D-16-0136.1
Dong, X., Xi, B., Crosby, K., Long, C. N., Stone, R. S., and Shupe, M. D. (2010). A 10 Year Climatology of Arctic Cloud Fraction and Radiative Forcing at Barrow, Alaska. J. Geophys. Res. 115, 1–14. doi:10.1029/2009JD013489
Ebell, K., Nomokonova, T., Maturilli, M., and Ritter, C. (2020). Radiative Effect of Clouds at Ny-Ålesund, Svalbard, as Inferred from Ground-Based Remote Sensing Observations. J. Appl. Meteorol. Climatol 59, 3–22. doi:10.1175/JAMC-D-19-0080.1
Fadnavis, S., Müller, R., Kalita, G., Rowlinson, M., Rap, A., Li, J.-L. F., et al. (2019). The Impact of Recent Changes in Asian Anthropogenic Emissions of SO2 on Sulfate Loading in the Upper Troposphere and Lower Stratosphere and the Associated Radiative Changes. Atmos. Chem. Phys. 19, 9989–10008. doi:10.5194/acp-19-9989-2019
Fisher, J. A., Jacob, D. J., Wang, Q., Bahreini, R., Carouge, C. C., Cubison, M. J., et al. (2011). Sources, Distribution, and Acidity of Sulfate-Ammonium Aerosol in the Arctic in winter-spring. Atmos. Environ. 45, 7301–7318. doi:10.1016/j.atmosenv.2011.08.030
Ganguly, D., Rasch, P. J., Wang, H., and Yoon, J.-h. (2012). Fast and Slow Responses of the South Asian Monsoon System to Anthropogenic Aerosols. Geophys. Res. Lett. 39, 1–5. doi:10.1029/2012GL053043
Gillett, N. P., Stone, D. A., Stott, P. A., Nozawa, T., Karpechko, A. Y., Hegerl, G. C., et al. (2008). Attribution of Polar Warming to Human Influence. Nat. Geosci 1, 750–754. doi:10.1038/ngeo338
Gong, D.-Y., Wang, S.-W., and Zhu, J.-H. (2001). East Asian winter Monsoon and Arctic Oscillation. Geophys. Res. Lett. 28, 2073–2076. doi:10.1029/2000GL012311
Grooß, J. U., and Müller, R. (2021). Simulation of Record Arctic Stratospheric Ozone Depletion in 2020. Geophys. Res. Atmos. 126, e2020JD033339. doi:10.1029/2020JD033339
Hansen, J. (2005). Efficacy of Climate Forcings. J. Geophys. Res. 110, D18104. doi:10.1029/2005JD005776
Hao, M., Luo, Y., Lin, Y., Zhao, Z., Wang, L., and Huang, J. (2019). Contribution of Atmospheric Moisture Transport to winter Arctic Warming. Int. J. Climatol 39, 2697–2710. doi:10.1002/joc.5982
Hinzman, L. D., Deal, C. J., McGuire, A. D., Mernild, S. H., Polyakov, I. V., and Walsh, J. E. (2013). Trajectory of the Arctic as an Integrated System. Ecol. Appl. 23, 1837–1868. doi:10.1890/11-1498.1
Kay, J. E., Deser, C., Phillips, A., Mai, A., Hannay, C., Strand, G., et al. (2015). The Community Earth System Model (CESM) Large Ensemble Project: A Community Resource for Studying Climate Change in the Presence of Internal Climate Variability. Bull. Am. Meteorol. Soc. 96, 1333–1349. doi:10.1175/BAMS-D-13-00255.1
Kay, J. E., and Gettelman, A. (2009). Cloud Influence on and Response to Seasonal Arctic Sea Ice Loss. J. Geophys. Res. 114, 1–18. doi:10.1029/2009JD011773
Kay, J. E., Hillman, B. R., Klein, S. A., Zhang, Y., Medeiros, B., Pincus, R., et al. (2012). Exposing Global Cloud Biases in the Community Atmosphere Model (CAM) Using Satellite Observations and Their Corresponding Instrument Simulators. J. Clim. 25, 5190–5207. doi:10.1175/JCLI-D-11-00469.1
Kay, J. E., and L'Ecuyer, T. (2013). Observational Constraints on Arctic Ocean Clouds and Radiative Fluxes during the Early 21st century. J. Geophys. Res. Atmos. 118, 7219–7236. doi:10.1002/JGRD.50489
Kiehl, J. T., Schneider, T. L., Rasch, P. J., Barth, M. C., and Wong, J. (2000). Radiative Forcing Due to Sulfate Aerosols from Simulations with the National Center for Atmospheric Research Community Climate Model, Version 3. J. Geophys. Res. 105, 1441–1457. doi:10.1029/1999JD900495
Kravitz, B., Wang, H., Rasch, P. J., Morrison, H., and Solomon, A. B. (2014). Process-model Simulations of Cloud Albedo Enhancement by Aerosols in the Arctic. Phil. Trans. R. Soc. A. 372, 20140052. doi:10.1098/rsta.2014.0052
Lamarque, J.-F., Bond, T. C., Eyring, V., Granier, C., Heil, A., Klimont, Z., et al. (2010). Historical (1850-2000) Gridded Anthropogenic and Biomass Burning Emissions of Reactive Gases and Aerosols: Methodology and Application. Atmos. Chem. Phys. 10, 7017–7039. doi:10.5194/acp-10-7017-2010
L’Ecuyer, T. S., Hang, Y., Matus, A. V., and Wang, Z. (2019). Reassessing the Effect of Cloud Type on Earth's Energy Balance in the Age of Active Spaceborne Observations. Part I: Top of Atmosphere and Surface. J. Clim. 32, 6197–6217. doi:10.1175/JCLI-D-18-0753.1
Liu, L., Shawki, D., Voulgarakis, A., Kasoar, M., Samset, B. H., Myhre, G., et al. (2018). A PDRMIP Multimodel Study on the Impacts of Regional Aerosol Forcings on Global and Regional Precipitation. J. Clim. 31, 4429–4447. doi:10.1175/JCLI-D-17-0439.1
Lohmann, U., Feichter, J., Penner, J., and Leaitch, R. (2000). Indirect Effect of Sulfate and Carbonaceous Aerosols: A Mechanistic Treatment. J. Geophys. Res. 105, 12193–12206. doi:10.1029/1999JD901199
Manktelow, P. T., Mann, G. W., Carslaw, K. S., Spracklen, D. V., and Chipperfield, M. P. (2007). Regional and Global Trends in Sulfate Aerosol since the 1980s. Geophys. Res. Lett. 34, L14803. doi:10.1029/2006GL028668
Matus, A. V., L'Ecuyer, T. S., and Henderson, D. S. (2019). New Estimates of Aerosol Direct Radiative Effects and Forcing from A‐Train Satellite Observations. Geophys. Res. Lett. 46, 8338–8346. doi:10.1029/2019GL083656
Matus, A. V., L’Ecuyer, T. S., Kay, J. E., Hannay, C., and Lamarque, J.-F. (2015). The Role of Clouds in Modulating Global Aerosol Direct Radiative Effects in Spaceborne Active Observations and the Community Earth System Model. J. Clim. 28, 2986–3003. doi:10.1175/JCLI-D-14-00426.1
McIlhattan, E. A., Kay, J. E., and L'Ecuyer, T. S. (2020). Arctic Clouds and Precipitation in the Community Earth System Model Version 2. J. Geophys. Res. Atmos. 125, e2020JD032521. doi:10.1029/2020JD032521
McIlhattan, E. A., L’Ecuyer, T. S., and Miller, N. B. (2017). Observational Evidence Linking Arctic Supercooled Liquid Cloud Biases in CESM to Snowfall Processes. J. Clim. 30, 4477–4495. doi:10.1175/JCLI-D-16-0666.1
Myhre, G., Forster, P. M., Samset, B. H., Hodnebrog, Ø., Sillmann, J., Aalbergsjø, S. G., et al. (2017). PDRMIP: A Precipitation Driver and Response Model Intercomparison Project-Protocol and Preliminary Results. Bull. Am. Meteorol. Soc. 98, 1185–1198. doi:10.1175/BAMS-D-16-0019.1
Myhre, G., Samset, B. H., Hodnebrog, Ø., Andrews, T., Boucher, O., Faluvegi, G., et al. (2018). Sensible Heat Has Significantly Affected the Global Hydrological Cycle over the Historical Period. Nat. Commun. 9, 1922. doi:10.1038/s41467-018-04307-4
Notz, D., and Stroeve, J. (2016). Observed Arctic Sea-Ice Loss Directly Follows Anthropogenic CO2emission. Science 80354, 747–750. doi:10.1126/science.aag2345
Nygård, T., Naakka, T., and Vihma, T. (2020). Horizontal Moisture Transport Dominates the Regional Moistening Patterns in the Arctic. J. Clim. 33, 6793–6807. doi:10.1175/JCLI-D-19-0891.1
Quinn, P. K., Bates, T. S., Baum, E., Doubleday, N., Fiore, A. M., Flanner, M., et al. (2008). Short-lived Pollutants in the Arctic: Their Climate Impact and Possible Mitigation Strategies. Atmos. Chem. Phys. 8, 1723–1735. doi:10.5194/acp-8-1723-2008
Ren, L., Yang, Y., Wang, H., Zhang, R., Wang, P., and Liao, H. (2020). Source Attribution of Arctic Aerosols and Associated Arctic Warming Trend during 1980-2018. Atmos. Chem. Phys. Discuss. 20, 9067–9085. doi:10.5194/acp-2020-3
Samset, B. H., Myhre, G., Forster, P. M., Hodnebrog, Ø., Andrews, T., Faluvegi, G., et al. (2016). Fast and Slow Precipitation Responses to Individual Climate Forcers: A PDRMIP Multimodel Study. Geophys. Res. Lett. 43, 2782–2791. doi:10.1002/2016GL068064
Schmale, J., Zieger, P., and Ekman, A. M. L. (2021). Aerosols in Current and Future Arctic Climate. Nat. Clim. Chang. 11, 95–105. doi:10.1038/s41558-020-00969-5
Screen, J. A., and Simmonds, I. (2010). The central Role of Diminishing Sea Ice in Recent Arctic Temperature Amplification. Nature 464, 1334–1337. doi:10.1038/nature09051
Serreze, M. C., and Barry, R. G. (2011). Processes and Impacts of Arctic Amplification: A Research Synthesis. Glob. Planet. Change 77, 85–96. doi:10.1016/j.gloplacha.2011.03.004
Serreze, M. C., and Francis, J. A. (2006). The Arctic Amplification Debate. Climatic Change 76, 241–264. doi:10.1007/s10584-005-9017-y
Shindell, D., and Faluvegi, G. (2009). Climate Response to Regional Radiative Forcing during the Twentieth century. Nat. Geosci 2, 294–300. doi:10.1038/ngeo473
Shindell, D. T., Chin, M., Dentener, F., Doherty, R. M., Faluvegi, G., Fiore, A. M., et al. (2008). A Multi-Model Assessment of Pollution Transport to the Arctic. Atmos. Chem. Phys. 8, 5353–5372. doi:10.5194/acp-8-5353-2008
Shupe, M. D., and Intrieri, J. M. (2004). Cloud Radiative Forcing of the Arctic Surface: The Influence of Cloud Properties, Surface Albedo, and Solar Zenith Angle. J. Clim. 17, 616–628. doi:10.1175/1520-0442(2004)017<0616:crfota>2.0.co;2
Smith, C. J., Kramer, R. J., Myhre, G., Forster, P. M., Soden, B. J., Andrews, T., et al. (2018). Understanding Rapid Adjustments to Diverse Forcing Agents. Geophys. Res. Lett. 45 (12), 12023–12031. doi:10.1029/2018GL079826
Sotiropoulou, G., Tjernström, M., Sedlar, J., Achtert, P., Brooks, B. J., Brooks, I. M., et al. (2016). Atmospheric Conditions during the Arctic Clouds in Summer experiment (ACSE): Contrasting Open Water and Sea Ice Surfaces during Melt and Freeze-Up Seasons. J. Clim. 29, 8721–8744. doi:10.1175/JCLI-D-16-0211.1
Stjern, C. W., Lund, M. T., Samset, B. H., Myhre, G., Forster, P. M., Andrews, T., et al. (2019). Arctic Amplification Response to Individual Climate Drivers. J. Geophys. Res. Atmos. 124, 6698–6717. doi:10.1029/2018JD029726
Stroeve, J., Holland, M. M., Meier, W., Scambos, T., and Serreze, M. (2007). Arctic Sea Ice Decline: Faster Than Forecast. Geophys. Res. Lett. 34, 15. doi:10.1029/2007GL029703
Tan, I., and Storelvmo, T. (2016). Sensitivity Study on the Influence of Cloud Microphysical Parameters on Mixed-phase Cloud Thermodynamic Phase Partitioning in CAM5. J. Atmos. Sci. 73, 709–728. doi:10.1175/JAS-D-15-0152.1
T. F. Stocker, D. Qin, G.-K. Plattner, M. Tignor, S. K. Allen, J. Boschunget al. (2013). Climate Change 2013 the Physical Science Basis Summary for Policymakers Technical Summary Frequently Asked Questions Part of the Working Group I Contribution to the Fifth Assessment Report of the Intergovernmental Panel on Climate Change (Cambridge, United Kingdom: Cambridge University Press).
Tritscher, I., Pitts, M. C., Poole, L. R., Alexander, S. P., Cairo, F., Chipperfield, M. P., et al. (2021). Polar Stratospheric Clouds: Satellite Observations, Processes, and Role in Ozone Depletion. Rev. Geophys. 59, e2020RG000702. doi:10.1029/2020rg000702
Van Tricht, K., Lhermitte, S., Lenaerts, J. T. M., Gorodetskaya, I. V., L’Ecuyer, T. S., Noël, B., et al. (20162016). Clouds Enhance Greenland Ice Sheet Meltwater Runoff. Nat. Commun. 7 (7), 1–9. doi:10.1038/ncomms10266
Willis, M. D., Leaitch, W. R., and Abbatt, J. P. D. (2018). Processes Controlling the Composition and Abundance of Arctic Aerosol. Rev. Geophys. 56, 621–671. doi:10.1029/2018rg000602
Wobus, C., Flanner, M., Sarofim, M. C., Moura, M. C. P., and Smith, S. J. (2016). Future Arctic Temperature Change Resulting from a Range of Aerosol Emissions Scenarios. Earth's Future 4, 270–281. doi:10.1002/2016EF000361
Yang, Y., Wang, H., Smith, S. J., Easter, R. C., and Rasch, P. J. (2018). Sulfate Aerosol in the Arctic: Source Attribution and Radiative Forcing. J. Geophys. Res. Atmos. 123, 1899–1918. doi:10.1002/2017JD027298
Yu, Y., Taylor, P. C., and Cai, M. (2019). Seasonal Variations of Arctic Low‐Level Clouds and its Linkage to Sea Ice Seasonal Variations. J. Geophys. Res. Atmos. 124, 12206–12226. doi:10.1029/2019JD031014
Zhang, R., Wang, H., Fu, Q., Pendergrass, A. G., Wang, M., Yang, Y., et al. (2018). Local Radiative Feedbacks over the Arctic Based on Observed Short‐Term Climate Variations. Geophys. Res. Lett. 45, 5761–5770. doi:10.1029/2018GL077852
Zhang, R., Wang, H., Fu, Q., and Rasch, P. J. (2020). Assessing Global and Local Radiative Feedbacks Based on AGCM Simulations for 1980-2014/2017. Geophys. Res. Lett. 47, e2020GL088063. doi:10.1029/2020GL088063
Zheng, B., Tong, D., Li, M., Liu, F., Hong, C., Geng, G., et al. (2018). Trends in China's Anthropogenic Emissions since 2010 as the Consequence of Clean Air Actions. Atmos. Chem. Phys. 18, 14095–14111. doi:10.5194/acp-18-14095-2018
Keywords: arctic temperature, transport of sulfate aerosols, cloud radiative forcing, climate change, arctic summer cooling and winter warming
Citation: Asutosh A, Fadnavis S, Nuncio M, Müller R and Tripathy SC (2021) The Arctic Temperature Response to Global and Regional Anthropogenic Sulfate Aerosols. Front. Environ. Sci. 9:766538. doi: 10.3389/fenvs.2021.766538
Received: 29 August 2021; Accepted: 20 October 2021;
Published: 08 November 2021.
Edited by:
Rajesh Kumar, University Corporation for Atmospheric Research (UCAR), United StatesReviewed by:
Tristan L'Ecuyer, University of Wisconsin-Madison, United StatesMD Wahiduzzaman, University of Tasmania, Australia
Copyright © 2021 Asutosh, Fadnavis, Nuncio, Müller and Tripathy. This is an open-access article distributed under the terms of the Creative Commons Attribution License (CC BY). The use, distribution or reproduction in other forums is permitted, provided the original author(s) and the copyright owner(s) are credited and that the original publication in this journal is cited, in accordance with accepted academic practice. No use, distribution or reproduction is permitted which does not comply with these terms.
*Correspondence: Suvarna Fadnavis, c3V2YXJuYUB0cm9wbWV0LnJlcy5pbg==