 Ryan Peek
 Katie Irving
 Sarah M. Yarnell
 Rob Lusardi1,3
 Eric D. Stein
 Raphael Mazor
- 1Center for Watershed Sciences, University of California, Davis, Davis, CA, United States
- 2Southern California Coastal Water Research Project, Costa Mesa, CA, United States
- 3Department of Wildlife, Fish, and Conservation Biology, University of California, Davis, Davis, CA, United States
Large state or regional environmental flow programs, such as the one based on the California Environmental Flows Framework, rely on broadly applicable relationships between flow and ecology to inform management decisions. California, despite having high flow and bioassessment data density, has not established relationships between specific elements of the annual hydrograph and biological stream condition. To address this, we spatially and temporally linked USGS gage stations and biological assessment sites in California to identify suitable paired sites for comparisons of streamflow alteration with biological condition at a statewide scale. Flows were assessed using a set of functional flow metrics that provide a comprehensive way to compare alteration and seasonal variation in streamflow across different locations. Biological response was evaluated using the California Stream Condition Index (CSCI) and Algal Stream Condition Index (ASCI), which quantify biological conditions by translating benthic invertebrate or algal resources and watershed-scale environmental data into an overall measure of stream health. These indices provide a consistent statewide standard for interpreting bioassessment data, and thus, a means of quantitatively comparing stream conditions throughout the state. The results indicate that indices of biological stream condition were most closely associated with flow alteration in seasonality and timing metrics, such as fall pulse timing, dry-season timing, and wet season timing. Magnitude metrics such as dry-season baseflow, wet season baseflow, and the fall pulse magnitude were also important in influencing biological stream conditions. Development of ecological flow needs in large-scale environmental programs should consider that alteration to any of the seasonal flow components (e.g., dry-season baseflow, fall pulse flow, wet-season baseflow, spring recession flow) may be important in restructuring biological communities.
1 Introduction
Flow alteration is a pervasive and significant issue globally and in California, where over 95% of California’s gaged streams have altered flow (Poff et al., 2007; Grantham et al., 2014; Zimmerman et al., 2017). Hydrologic alteration of flow by dams, diversions, and urbanization impacts seasonal and inter-annual flow variability, population connectivity, gene flow, biodiversity, and ecological processes (Dudgeon et al., 2006; Yarnell et al., 2010; Carlisle et al., 2011; Peek et al., 2021). While the causes and related impacts of flow alteration are well documented (Poff et al., 2007), significant gaps remain in linking flow management with ecological responses to track current stream conditions, evaluate restoration efficacy, and provide future flow recommendations (Poff and Zimmerman, 2010).
A critical component of developing ecological flow needs for management is to identify relationships between specific flow metrics that represent distinct characteristics of the annual hydrograph and measures of biological stream conditions at broad spatial scales (Poff and Zimmerman, 2010). A variety of datasets and approaches have been used for assessing stream conditions, with benthic invertebrates and algae as the most common indicators of stream health in a wide range of flow alteration studies across the United States (Stevenson and Smol, 2003; Lawrence et al., 2010; Stevenson et al., 2010; Lunde et al., 2013; Stevenson, 2014; Mazor et al., 2016; Steel et al., 2018). For example, hydrologic alteration or impairment has been shown to strongly influence aquatic benthic invertebrate communities (Poff et al., 2007; Rehn, 2009), and benthic invertebrates have been used to link metrics of hydrologic variability to biological community response (Poff and Zimmerman, 2010; Steel et al., 2018). Studies of the direct relationships between algae and flow are limited (Kirkwood et al., 2009; Miller et al., 2009; Schneider et al., 2016), with some exceptions involving algal blooms in large rivers (Cheng et al., 2019; Xia et al., 2020) and directly following a flood (Schneider et al., 2016). However, impacts of flow alteration on water quality (Nilsson and Renöfält, 2008) can also indirectly influence the composition of algal communities (Allan, 2004; Lange et al., 2016). Yet, evaluation of direct relationships between individual flow metrics and biologic response across broad spatial scales and assessment of whether such relationships provide a means of quantitatively comparing stream conditions across large regions remains limited.
Unified assessment tools have been developed to compare biologic stream conditions across large heterogeneous landscapes, such as California (see (Mazor et al., 2016; Beck et al., 2019b; Theroux et al., 2020); however, quantitative comparison of biologic metrics with flow metrics to assess ecological response to flow alteration at these large spatial scales has not been completed. Two key datasets in California provide the opportunity to explore quantitative flow-ecology relationships across a diversity of climate, geology, hydrology, and land use impacts. For streamflow data, the US Geological Survey (USGS) National Water Information System (NWIS) is a comprehensive and distributed application that provides a wide range of water data, including daily stream flows from over 28,000 stations across the United States, including over 700 stations in California. To describe and quantify the different flow components and characteristics of California’s seasonal hydrograph, a functional flows approach provides a standardized hydrologic method to evaluate the role of the flow regime in structuring stream ecosystems (Yarnell et al., 2020). Twenty-four functional flow metrics were developed for California by Yarnell et al. (2020) that quantify five key flow components (fall pulse flow, wet-season baseflow, peak flow, spring recession flow, and dry-season baseflow) of the flow regime, with individual metrics describing the magnitude, timing, frequency, duration and rate of change of each functional flow component (Supplementary Appendix S1). The functional flow metrics are not directly linked to individual/specific organisms/groups, but are associated with specific biological and ecosystem processes (Yarnell et al., 2020). Calculated from existing daily flow data, functional flow metrics provide a comprehensive way to compare alteration and seasonal variation in streamflow across different locations.
For biological and biophysical data, the Surface Water Ambient Monitoring Program (SWAMP) is tasked with assessing surface water quality throughout California. The program coordinates water quality monitoring across the state and collects data to support water resource management by the State Water Board. The data collected by SWAMP’s probabilistic Perennial Stream Assessment survey is used to characterize in-stream biological conditions and make estimates about the extent of healthy streams in different regions of the state. These data include two standardized bioassessment indices, the California Stream Condition Index (CSCI) based on benthic macroinvertebrate data and the Algal Stream Condition Index (ASCI), that provide quantitative measures of biologic stream conditions across broad spatial scales (Mazor et al., 2016; Theroux et al., 2020). CSCI and ASCI are predictive multimetric indices developed for California streams (Mazor et al., 2016; Theroux et al., 2020) and include many stream and landscape components that describe biological sensitivities or tolerances to disturbance. The indices allow for the evaluation of biotic response without specificity to one individual metric (e.g., taxa richness), enabling coverage of a broader range of characteristics and stressors associated with individual watersheds. These indices are intended to aid stream management (e.g., condition assessment, prioritization, and flow target development; see (Stein et al., 2017; Mazor et al., 2018; Beck et al., 2019a)) and have been integrated into unified assessments of stream health (Beck et al., 2019b). With low regional bias and consideration of natural variation, CSCI and ASCI can distinguish between reference and biologically degraded sites, can be applied at multiple scales, and are appropriate to apply to the diverse landscapes of California (Mazor et al., 2018). Leveraging these statewide biological datasets in conjunction with methods for quantifying hydrologic variability via functional flow metrics across California (Grantham et al., 2021. this issue; Stein et al., 2021 this issue; Yarnell et al., 2020) provides a unique opportunity to assess biological response to hydrologic alteration across the large-scale diversity of California.
Here, we aim to address the need for broadly applicable quantitative relationships between flow and ecology that inform management decisions across large diverse regions, such as California. Our objectives were to: 1) identify functional flow and biological condition metrics that explain the greatest variation in statewide and regional data, and 2) assess relationship trends between functional flow metrics and biological condition. This research has important implications for environmental flow management, particularly where practitioners seek to link biological response to functional flows, assess restoration efficacy, and track change in managed freshwater systems.
2 Materials and Methods
2.1 General Approach
To assess relationships between streamflow condition and stream health, all ASCI and CSCI sites were spatially and temporally paired with proximal USGS gages across California. In some cases where ASCI and CSCI sites were associated with more than one USGS gage, all site pairs were retained for the analysis. Using these paired sites, we calculated 24 functional flow metrics defined by Yarnell et al. (2020), using a minimum of 10 years of continuous flow data at each selected USGS gage site. We calculated hydrologic alteration (delta hydrology) using a normalized difference between the observed median value and predicted median value of each functional flow metric. Statistical models were then developed to identify which of the functional flow metrics were most closely associated with biological index scores, and the directionality of those relationships.
2.2 Pairing of Biological Stream Condition (California Stream Condition Index and Algal Stream Condition Index) Sites With US Geological Survey Gage Sites
We identified all bioassessment sites (n = 2,935) in the SWAMP dataset with available ASCI and CSCI scores from data sampled between 1994–2018 during late spring and summer months (May to September, when sampling typically occurs). To pair bioassessment sites with USGS gage sites, we filtered locations to include only bioassessment sites occurring in the same Hydrologic Unit Code (HUC) catchment as USGS gages with at least 10 years of contiguous daily flow data (Figure 1). We filtered bioassessment sites from the previous step to include only sites on the same National Hydrography Dataset (NHD) mainstem stream or river as the USGS gage (in the same HUC12 catchment)—provided each site was within 10 km downstream of the gage—using the nhdplusTools, dplyr, and sf packages in R version 4.1.1 (Blodgett, 2018; Pebesma, 2018; Wickham et al., 2018, 2019; R Core Team, 2021). Using this list of biological-gage site pairs, we removed sites that did not contain flow data after 1994 to ensure temporal overlap with the biological assessment sampling events (i.e., all ASCI and CSCI data was collected and calculated after 1994). Data from final site pairs were used in all subsequent analyses. For bioassessment sampling events and resulting ASCI or CSCI scores that occurred in the same water year at the same location, we calculated the median value of these replicate scores to use in the statistical modeling.
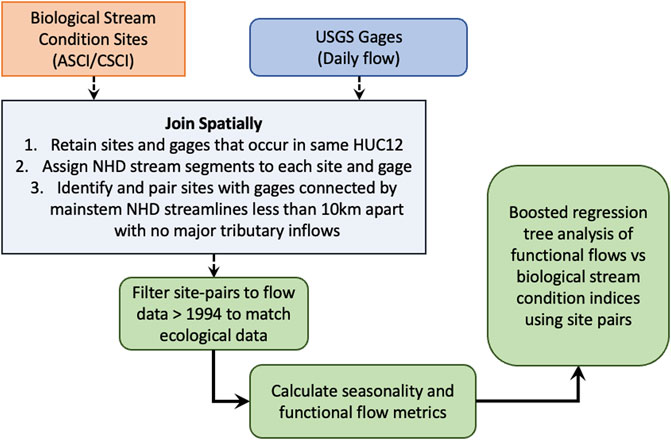
FIGURE 1. Workflow diagram of steps used to pair biological stream condition sites with USGS gage locations.
2.3 Calculating Delta Hydrology Using Functional Flow Metrics
Once the selected ASCI and CSCI sites were paired with proximal USGS sites, we calculated functional flow metrics (FFM) over the longest contiguous period of record for each USGS gage using the using the Functional Flows Calculator API client package in R (version 0.9.7.2)1, which uses hydrologic feature detection algorithms developed by Patterson et al. (2020) and the Python functional flows calculator2. We calculated a normalized hydrologic alteration metric based on the departure from the predicted reference flow (difference between the observed FFM and the predicted [unimpaired reference condition] FFM) associated with the stream segment at the USGS gage (see Grantham et al. this issue for additional details on how predicted reference-based functional flow metrics were modeled). This measure of delta hydrology was calculated as:
In some cases, the FFM value for a single water year at a gage could not be calculated, resulting in an “NA” value. This could occur for several reasons, such as the data record was incomplete or the annual hydrograph was extremely different compared with the predicted reference condition. These instances would often lack a seasonal flow pattern that the flow calculator relies on to derive subsequent metrics (Patterson et al., 2020). If more than 70% of the annual values for a metric across the period of record at a gage were NA, then the flow alteration for that metric at that gage was not included in the dataset. One additional metric, seasonality, was calculated for each gage using the same period of record; seasonality is based on Colwell’s metrics, which measure the seasonal predictability of environmental phenomena (Colwell, 1974). These metrics are defined in terms of Predictability (P), Constancy (C), and Contingency (M)—where M represents temporal variability and P is the reliable recurrence of seasonal patterns across multiple cycles. Importantly, Colwell’s P is maximized when environmental phenomenon is constant throughout the year, if the seasonal fluctuation is consistent across all years, or a combination of both (Tonkin et al., 2017). Following Tonkin et al. (2017), we calculated seasonality as Colwell’s M/P, as it can be applied in a wide range of ecological studies (Tonkin et al., 2017; Radecki-Pawlik et al., 2020; Peek et al., 2021) and provides a measure ranging from 0 to 1, with 1 being highly seasonal, of how the environment or daily flow varies within a single year.
2.4 Statistical Analysis of Stream Condition Indices vs. Functional Flow Metrics
To determine which FFMs had the strongest association with streamflow alteration, we modeled estimates of delta hydrology (departure from the predicted reference flow) for each FFM against biological condition scores (i.e., ASCI and CSCI) using boosted regression tree analysis, following methods from Steel et al. (2018).
Each model was run with CSCI or ASCI as the response and the delta hydrology statistic for each FFM and seasonality as the covariates. Boosted regression trees, a method from the decision tree family of statistics, are well suited for large and complex ecological datasets; they do not assume normality nor linear relationships between predictor and response variables, they ignore non-informative predictor variables, and they can accept predictors that are numeric, categorical, or binary (Elith et al., 2008; Brown et al., 2012). Boosted regression trees are also unaffected by outliers and effectively handle both missing data and collinearity between predictors (De’ath, 2007; Dormann et al., 2013). Importantly, such methods are becoming more common in ecological analyses and have been shown to outperform many traditional statistical methods such as linear regression, generalized linear models, and generalized additive models (Guisan et al., 2007). Boosted regression tree models were run with grid iteration and tuning across parameters (shrinkage [0.001–0.005], interaction depth [3–5], number of minimum observations in a node [3–10], and bag fraction [0.75–0.8]) in model validation, following guidelines from Elith et al. (2008). To assess the relative influence of each FFM in the model, we used the mean-square error method (Ridgeway, 2015).
The most influential FFMs were further examined by plotting the delta hydrology metric values against biological condition scores. To better understand regional patterns and assess relationships across different scales, we also analyzed ASCI and CSCI scores and delta hydrology for FFMs across three stream classifications—snowmelt, rain, and mixed (combination of rain, snow, or groundwater)—based on Patterson et al. (2020) and (Lane et al., 2017). Thus, each model was also run using only sites associated with one of these stream classes.
3 Results
3.1 Pairing of Biological Stream Condition Sites With US Geological Survey Gage Sites
We mapped a total of 2,935 unique locations with CSCI values, 2,320 unique locations with ASCI values, and 736 USGS gage sites (Figures 2–3) across California. Despite a relatively large pool of sites to work with, after filtering and pairing, we identified 233 ASCI and 231 CSCI sites associated with 222 USGS gages across the state. Thus, approximately 10% of the total bioindicator sites exist in close spatial proximity (<10 river kilometers) to USGS gage sites with long-term flow data (>10 years). Eight metrics were dropped (Supplementary Appendix S1) from the FFM calculations due to incomplete data, thus, for every site pair, data included a single biologic condition score, and 16 flow alteration metric scores, one for each of the remaining functional flow metrics. The functional flow calculator returned a wide range of values that indicate the broad array of regional hydrologic conditions across California, including a small percentage (<2) of extreme outliers that occurred in the 98th percentile or greater of all data (Figure 4).
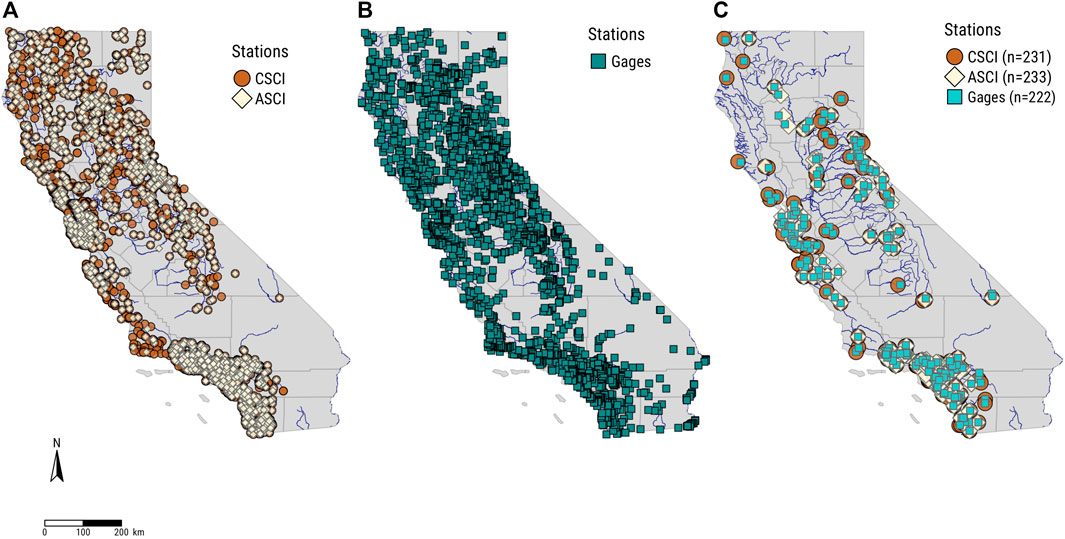
FIGURE 2. Maps of California showing (A) CSCI (n = 2,935) and ASCI (n = 2,320) sites, (B) USGS gages (n = 736), and (C) CSCI-USGS (n = 231) and ASCI-USGS (n = 233) site pairs with >10 years of flow data. Note, some ASCI and CSCI sites paired with more than one USGS gage site.
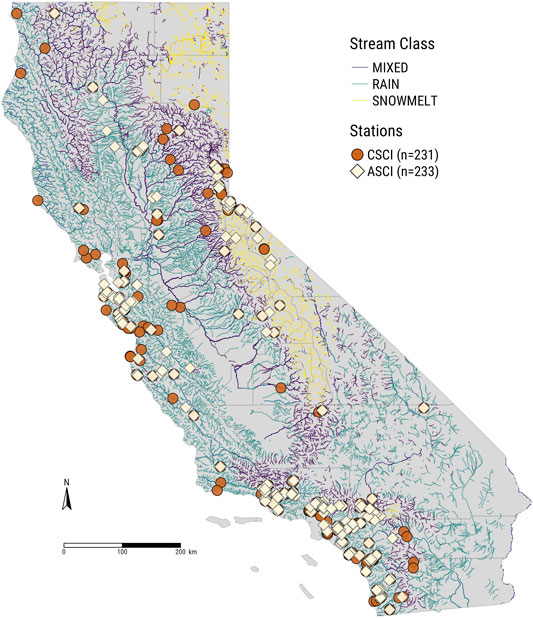
FIGURE 3. Map of California showing selected biological sampling sites for CSCI (circles, n = 231) and ASCI (diamonds, n = 233) data overlaying stream classifications from Patterson et al. (2020).
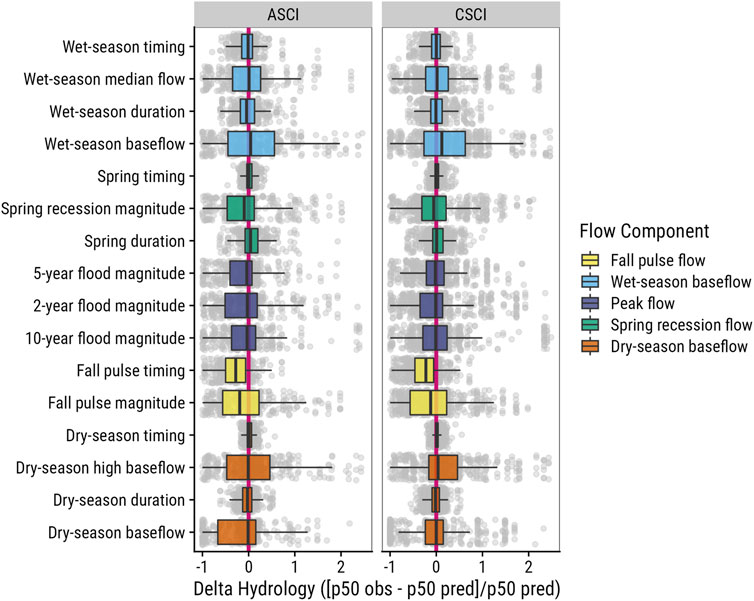
FIGURE 4. Boxplots of delta hydrology for functional flow metrics used in the modeling analysis for paired sites across California. The solid pink line in the background indicates no difference between the observed 50th percentile and the predicted reference 50th percentile metric value. Values to the left of the line are reduced or early, and values to the right are inflated or late, relative to the expected reference value. Extreme outliers (>98 percentile) have been removed from the boxplot.
3.2 Statistical Analysis for Statewide Site Pair Dataset
Boosted regression tree models with delta hydrology and seasonality metrics explained 46% of the deviance in CSCI data, with a cross-validation correlation of 0.678 (se = 0.019) and 31% in ASCI with a cross-validation correlation of 0.552 (se = 0.041). Of the 16 functional flow metrics included in the model, eight had relative importance values greater than 5%, and Colwell’s seasonality metric was consistently one of the top three variables in all models (Figure 5, Table 1). The two most influential FFMs in the statewide model were fall pulse timing (CSCI = 13.6, ASCI = 12.3% relative influence) and seasonality (CSCI = 15.5%, ASCI = 7.6%) (Figure 5). Dry season timing was one of the most important variables in the CSCI model, but it was not influential in the ASCI model (Table 1). Three of the top metrics for CSCI related to timing (fall pulse timing, Coldwell’s seasonality, and dry-season timing), while the remaining significant metrics were associated with flow magnitudes (wet-season baseflow and fall pulse magnitude) (Table 1, Figure 5). For ASCI, the top metrics were also primarily associated with timing (fall pulse timing, Colwell’s seasonality, wet season timing, and spring timing), while other influential metrics were largely associated with flow magnitude (dry-season baseflow, wet-season baseflow, and fall pulse magnitude). When comparing both ASCI and CSCI cumulatively, the strongest metrics were fall-pulse timing and Colwell’s seasonality, followed by dry-season baseflow and wet-season timing. Interestingly, the smallest difference in relative importance occurred in the fall pulse magnitude metric (Figure 5, Table 1).
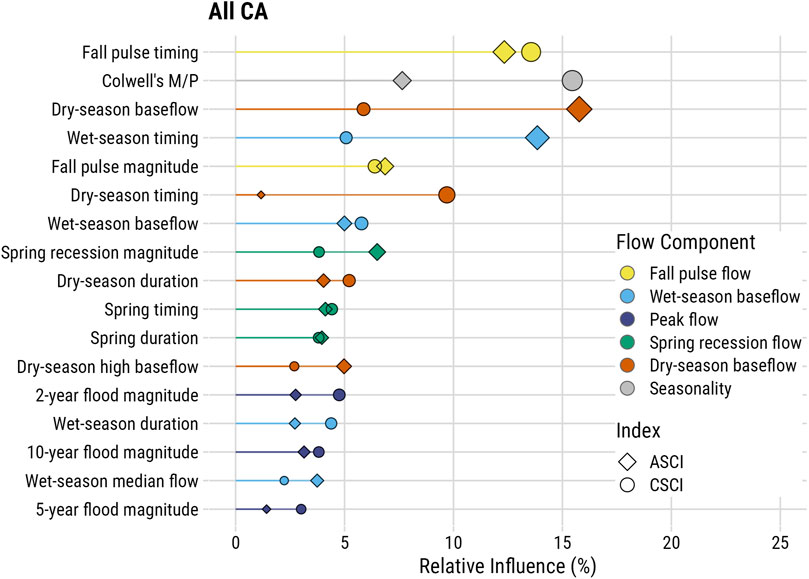
FIGURE 5. Relative importance of functional flow metrics in boosted regression tree models assessing flow alteration relative to ASCI and CSCI scores for paired sites across California. Relative influence values were calculated using a mean-square error (MSE) approach, which determines those variables with the largest average reduction in MSE. Functional flow metrics are described in Supplementary Appendix S1.
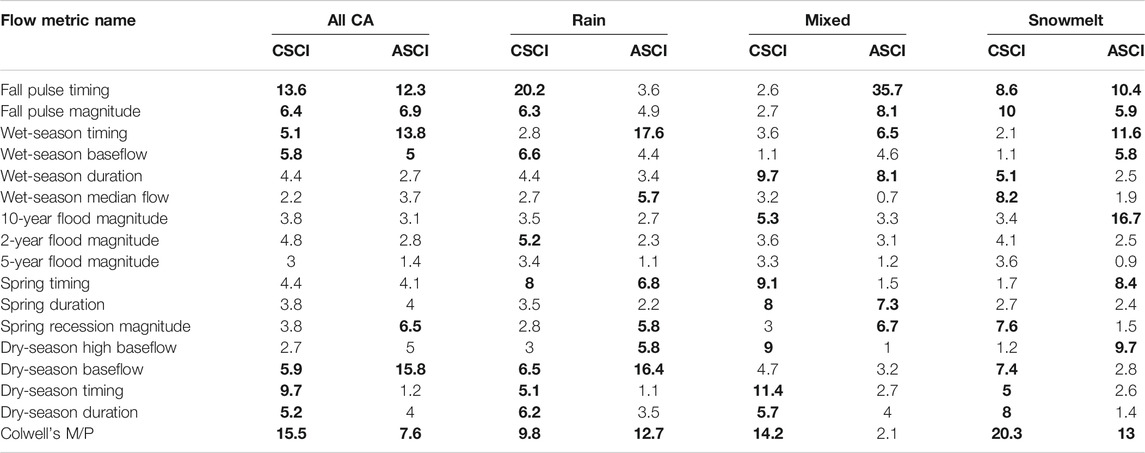
TABLE 1. Mean relative influence values for functional flow metrics included in four models (with data from all California and three regions based on stream class) that assessed flow alteration in relation to ASCI and CSCI scores. Bolded values were most influential (>5%).
Normalized delta hydrology (departure from reference value) for three of the top FFMs was plotted against the ASCI and CSCI scores, grouped by the degree of stream alteration based on bioassessment stream condition thresholds defined by Mazor et al. (2016) and Theroux et al. (2020). Values that fall below zero indicate flow values that are earlier (timing) or decreased (magnitude) from the expected reference condition (Figure 6). Based on the delta hydrology, fall pulse timing occurred earlier than the expected reference condition across all bioassessment threshold categories—though the lowest values typically corresponded with the most altered category—for both ASCI and CSCI. For magnitude metrics, the pattern was more distinct in the fall pulse magnitude metric for ASCI, which showed all but the “Likely intact” scores were reduced from the expected reference condition, and for CSCI, all the “very likely altered” and “likely altered” categories had distributions that were reduced compared to the expected reference conditions (Figure 6). Interestingly, for Colwell’s measure of seasonality, there was a consistent positive trend towards higher CSCI and ASCI scores with more predictable and consistent seasonality (recurring intra-annual patterns of temporal variability, e.g., summer low flow periods and winter floods occurring each year) (Figure 7).
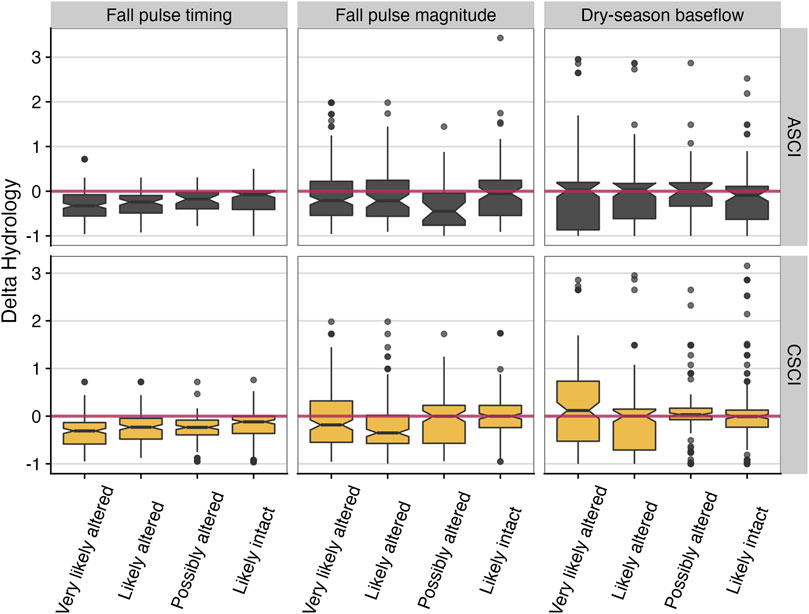
FIGURE 6. Influential functional flow metric values (normalized as delta hydrology) versus binned ASCI and CSCI values (based on thresholds from Mazor et al. (2016) and Theroux et al. (2020) for all paired sites across California. The red zero line delineates departure from expected reference flow metric, where values <0 are reduced or early, and values >0 are inflated or late, relative to the expected reference value. Notches indicate an approximate 95% confidence interval to compare medians, where if notches of two boxplots do not overlap, this suggests the medians are significantly different (see McGill et al. (1978).
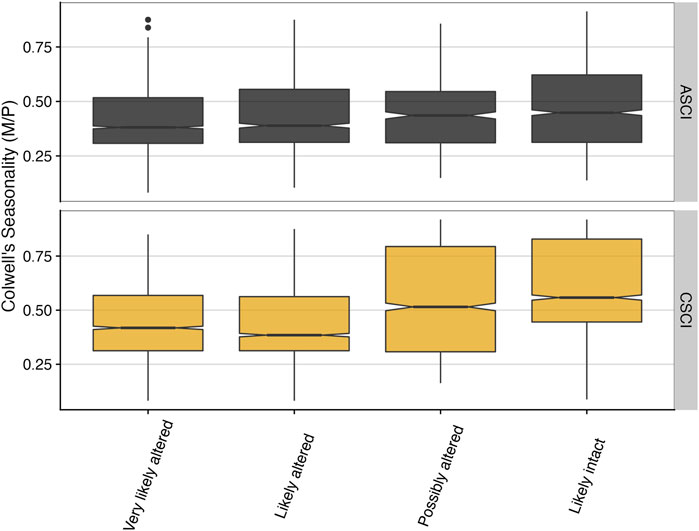
FIGURE 7. Colwell’s seasonality versus binned ASCI and CSCI values (based on thresholds from Mazor et al. (2016) and Theroux et al. (2020) for all paired sites across California. Notches indicate an approximate 95% confidence interval to compare medians, where if notches of two boxplots do not overlap, this suggests the medians are significantly different (see McGill et al. (1978).
3.3 Statistical Analysis by Stream Class
Using the paired sites, we split sites based on stream class (Patterson et al., 2020), with the largest number of sites occurring in stream segments classified as Rain (Snowmelt: ASCI = 37, CSCI = 55; Mixed: ASCI = 88, CSCI = 83; and Rain: ASCI = 231, CSCI = 226). Because ASCI and CSCI sites paired with multiple proximal USGS gages, sample sizes differed from the total number of unique stations (Figures 2–3). Stream class models of delta hydrology showed seasonality, fall pulse, dry season, and wet season flow components were consistently important in all regional models, while spring recession flow was important primarily in the rain and mixed stream class models (Table 1, Figure 8). The only regional model that included a peak flow component was the ASCI-snowmelt class model. In the snowmelt class models, the 10-years flood magnitude had the highest relative influence score for ASCI, while seasonality and fall pulse timing had the highest influence for CSCI, respectively (Table 1). The fall pulse timing was also the most influential metric for CSCI in the rain class model and for ASCI in the model of mixed stream class sites (Table 1, Figure 9).
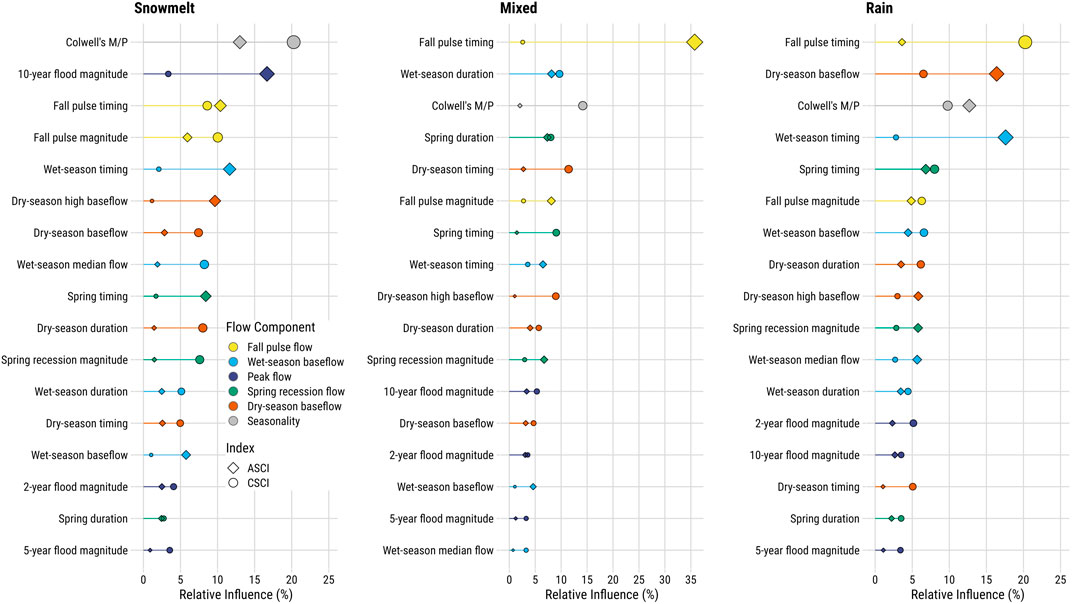
FIGURE 8. Relative importance of functional flow metrics in boosted regression tree models assessing flow alteration relative to ASCI and CSCI scores by stream classification (Patterson et al., 2020). Relative influence values were calculated using a mean-square error (MSE) approach, which determines those variables with the largest average reduction in MSE. Functional flow metrics are described in Table 1.
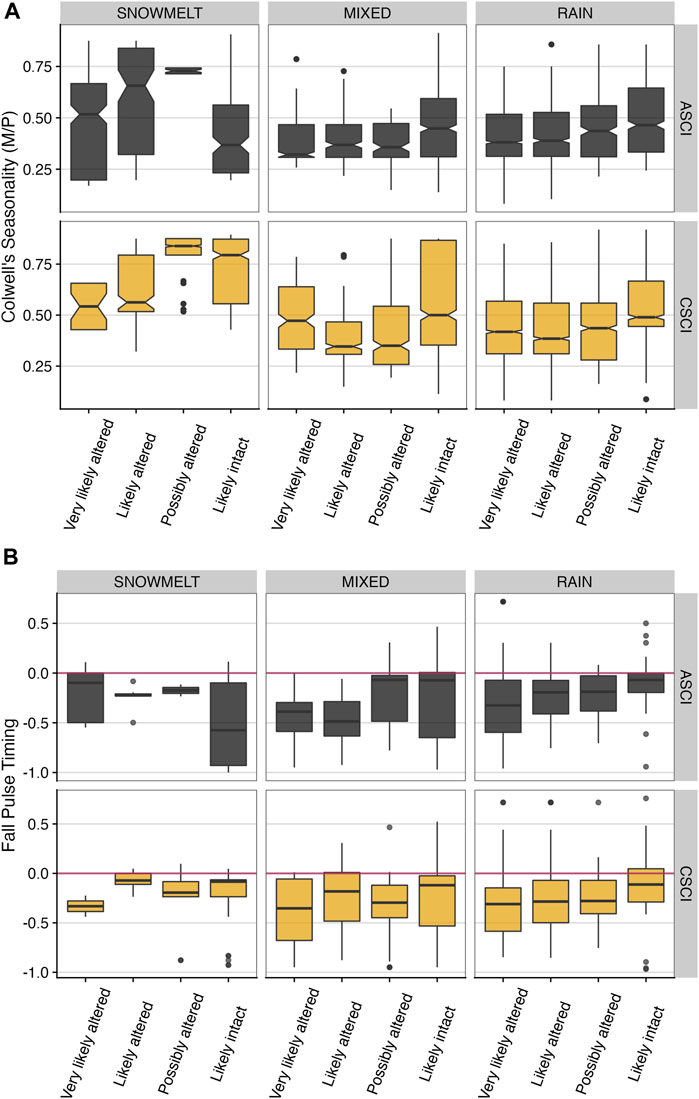
FIGURE 9. (A) Colwell’s seasonality versus binned ASCI and CSCI values (based on thresholds from Mazor et al. (2016) and Theroux et al. (2020) for all paired site by stream class. Notches indicate an approximate 95% confidence interval to compare medians, where if notches of two boxplots do not overlap, this suggests the medians are significantly different (see McGill et al. (1978). (B) Fall pulse timing values (normalized as delta hydrology) versus binned ASCI and CSCI values (based on thresholds from Mazor et al. (2016) and Theroux et al. (2020) for all paired site by stream class. The red zero line delineates departure from expected reference flow metric, where values <0 are reduced or early, and values >0 are inflated or late, relative to the expected reference value.
Several metrics with the highest relative influences in the regional stream class models were further examined by plotting the delta hydrology values for each FFM against the paired bioindicator scores by the thresholds identified in each bioassessment index. Figure 9 shows the highly variable nature of data inherent to the wide diversity of climate and topography across California. However, trends in the data indicated potential underlying relationships that should be explored further. In particular, the data indicated that as seasonality increases, stream condition (ASCI or CSCI) index also generally increased, with this pattern most pronounced in the mixed and snowmelt stream classes (Figure 9A). For fall pulse timing, the data indicated sites with much earlier fall flow pulses than the expected reference condition generally corresponded with the more altered flow categories for both ASCI and CSCI (Figure 9B).
4 Discussion
Quantitatively linking flow and bioassessment data across large diverse regions, such as California, sheds light on which types of relationships are important to consider when establishing ecological flow needs. Our results support previous findings that flow seasonality and alterations to seasonal flow components are closely related to stream health and are likely important in restructuring biological communities (Tonkin et al., 2017, 2021). Specifically, we found that metrics associated with flow timing (including seasonality) were the most influential in linking functional flow metrics with biologic stream condition. Interestingly, while altered seasonality and timing were the most influential flow metrics for CSCI, altered dry season baseflow and timing were most informative for ASCI, indicating at large spatial scales (e.g., California), there may be differences in how exactly seasonal flow changes invertebrate and algal communities. In developing environmental flow recommendations, managers should look to retaining the natural seasonal timing of higher and lower magnitude flows in order to support native aquatic assemblages.
4.1 Timing Metrics had the Strongest Link to Biological Stream Condition
In both statewide and regional stream class models, timing metrics were the most important, often comprising three or more of the top five influential metrics. Of the timing metrics, fall pulse timing was the most influential in describing biological differences in the statewide CSCI and ASCI models. The timing of the fall pulse flow in California typically occurs in November (Ahearn et al., 2004) but varies widely between 1st October and 15th December (Patterson et al., 2020). It represents the first precipitation event following the dry season baseflow period, and thus is important in determining the biological condition of streams (Yarnell et al., 2015). During the prior dry season low flow period, filamentous algal mats typically become more prevalent and are associated with increases in stream temperature, reduced streamflow velocity, and nutrient enrichment (McIntire, 1966; Poff et al., 1990; Suren et al., 2003). Changes in stream velocity associated with the arrival of the fall pulse flow may scour and effectively remove algal mats, ultimately flushing organic material downstream. The fall pulse flow is also known to flush organic matter and nutrient subsidies from adjacent riparian habitats to streams, enhancing food resources and detrital carbon for foraging invertebrates (Ahearn et al., 2004; Blanckaert et al., 2013). During the dry season low flow period, invertebrates commonly use the hyporheic zone as a refuge from potentially unsuitable environmental conditions (e.g., temperature) (Wood et al., 2010; Stubbington, 2012). Fall pulse flows reconnect streams with their hyporheic zone and decrease water temperature (Yarnell et al., 2015) providing a cue for fall or winter invertebrate emergence (Ward and Stanford, 1982), the timing of which may help synchronize life history events or behavioral adaptations that increase reproductive success (Lytle, 2001; Lytle and Poff, 2004). As a result, fall pulse flows not only increase invertebrate habitat availability and heterogeneity (Blanckaert et al., 2013; Naman et al., 2016), but reconnect invertebrate communities and population gene flow through dispersal (Townsend and Hildrew, 1976; Mackay, 1992), providing a vital food resource for resident fishes and other higher order consumers. Thus, fall pulse flow timing may be a key factor in re-establishing food web and community connectivity (Elliott, 1973; Nislow et al., 1998; Romaniszyn et al., 2007).
While timing was highly influential in the statewide ASCI model, dry season baseflow was the most influential metric, such that flows both above and below reference condition may impact algal condition (Table 1, Figures 5–6). Dry season baseflow supports algal growth and primary producers by maintaining water temperature and dissolved oxygen (Yarnell et al., 2020). As a result, low flows can increase algal biomass and cover (Biggs, 1985; Biggs et al., 2005; Schneider and Petrin, 2017), and due to lower velocities and higher water temperature, algal communities change from a diatom dominated assemblage to a filamentous algae dominated system (Dewson et al., 2007). However, once the fall pulse flow begins, the benthic communities shift again in response to changing flow and temperature conditions, thus helping to explain the combined influence of dry season baseflow and fall timing metrics on algal communities.
4.2 Seasonality and Climate Change
Our results indicated that timing was the most important factor to consider when linking biological stream condition with flow, especially for invertebrates that have evolved in river systems with consistent hydrologic seasonality and predictability. Timing metrics such as wet season timing, dry season timing, spring timing, and seasonality were all influential in the statewide and regional models. While California’s Mediterranean climate integrates a significant amount of interannual variation (Persad et al., 2020), flow regulation has altered patterns of hydrologic seasonality and predictability in many watersheds (Kupferberg et al., 2012; Peek et al., 2021). Climate change is expected to exacerbate these patterns such that earlier peak flow and snowmelt timing will occur (Kapnick and Hall, 2010) and seasonal predictability will decrease as more extreme wet and dry events take place (Swain et al., 2018; Persad et al., 2020). Therefore, environmental flow recommendations should incorporate the ecological flow needs of benthic invertebrate and algal communities with consideration for both current and future conditions, particularly if existing communities are mismatched to current environmental conditions (Botero et al., 2015).
4.3 Modeling Limitations
There are many potential factors that cannot be accounted for within modeling frameworks focused solely on the impacts of flow modification on biologic conditions. Interactions with stream temperature, ecological dynamics associated with population density and predation, as well as water chemistry and nutrient loads can all play important roles in influencing biological stream condition (Nilsson and Renöfält, 2008; Miller et al., 2009; Lange et al., 2016; Schneider et al., 2016). However, the benefit of linking biological indices like CSCI or ASCI with flow is the ability to quantify and assess stream conditions across broad spatial areas, often with very different underlying geography, geology, and watersheds. The biologic indices are designed to be regionally stable and are standardized so they can be compared across large spatial scales (Mazor et al., 2016). BRTs do not explicitly account for spatial autocorrelation, thus models may have under or overestimated the strength of the relationships we identified based on systematic similarities associated with spatial clumping of sites. However in the context of our study, we do not believe this is an issue because the sampling design selected both ASCI and CSCI sites independently, and by using stream class, we were able to compare samples across very different geographic space (i.e., “mixed” stream class can occur in the northern coast of California or in the Sierra Nevada or in the Southern Coast). Nonetheless, patterns we identified across stream class and statewide scales showed similarities that are unlikely to be influenced by spatial autocorrelation. It is also important to use caution when interpreting regional stream class models for ecological meaning because CSCI and ASCI produce locally relevant reference expectations. For example, landscape heterogeneity and local climate variability could contribute to variation in the data within models from the same stream class. Future approaches to assessing flow alteration and biologic stream condition at finer scales may benefit from more specific models that account for important local variables or use individual functional feeding groups or taxa as the biologic response. Nonetheless, identifying key functional flow metrics that influence stream health, as shown here, will help inform the development of ecological flow needs across broad regions, such as California.
5 Conclusion
We paired bioassessment sites and hydrologic gaging sites across the broad diversity of California’s landscape to evaluate links between flow alteration and stream health conditions. Despite a significant limitation in the number of available sites with paired biologic and hydrologic data, we identified relationships between functional flow metrics and biologic condition indices and found that alterations in seasonality, fall pulse and wet season timing, and dry season baseflow were the most influential in shaping stream communities. These results can help to inform flow management both in terms of developing ecological flow needs that explicitly mimic natural seasonal timing and monitoring changing stream conditions with restoration activities or future climate changes.
Future analyses may leverage this information and approach to focus on more discrete flow-ecology relationships, with particular attention to temporal lags associated with drought impacts or the sensitivity of biological metrics. More specific hydrologically sensitive biological metrics (e.g., more distinct functional feeding groups in benthic invertebrate data, hydrologically sensitive taxonomic groups, etc.) may provide additional detail for assessment of the impacts of flow alteration on a given stream reach. Furthermore, this approach provides a method to assess such metrics and relationships through time, so adaptive approaches to flow management can be implemented, monitored, and revised.
This analysis highlights that despite the information-rich spatial datasets that span much of California, there remains a significant gap in leveraging and layering these datasets in an effective manner. Pairing biological and flow sites spatiotemporally was challenging, and sites were limited across all stream classes, but particularly in snowmelt dominated systems. When data from biological or hydrological time series are limited, alternative approaches can be implemented using modeled streamflow or modeled stream condition indices to predict whether or not flow alteration deviates from reference expectations (Stein et al., 2017; Mazor et al., 2018; Irving et al., 2021; Maloney et al., 2021). Furthermore, ongoing monitoring may benefit from more discrete and targeted sampling to link biological data more accurately with surface flow data. Nonetheless, this current approach provides a novel integration of disparate spatiotemporal datasets and indicates broad relationships can be identified between functional flow metrics and indices of biological stream condition.
Data Availability Statement
Publicly available datasets were analyzed in this study. This data can be found here: Functional Flow Metrics: Natural functional flow metrics for California: rivers.codefornature.org Bioassessment Data: https://www.waterboards.ca.gov/water_issues/programs/swamp/bioassessment/csci_scores_map. html USGS Gage Flow Data: https://waterdata.usgs.gov/nwis/rt. ASCI scores can be calculated using code from: https://sccwrp.github.io/ASCI/index.html and data from: https://smc.sccwrp.org.
Author Contributions
RP led the preparation of this manuscript, data analysis, coding, and project design. KI contributed to data analysis and coding. RP, ES, KI, RM, SY, and RL contributed to the conceptualization and project design. All authors contributed to writing this manuscript.
Funding
Funding for this work was provided by the California Wildlife Conservation Board (Agreement WC-1849AB). Open access publication fees were provided by the Library and Center for Watershed Sciences at the University of California, Davis, CA.
Conflict of Interest
The authors declare that the research was conducted in the absence of any commercial or financial relationships that could be construed as a potential conflict of interest.
Publisher’s Note
All claims expressed in this article are solely those of the authors and do not necessarily represent those of their affiliated organizations, or those of the publisher, the editors and the reviewers. Any product that may be evaluated in this article, or claim that may be made by its manufacturer, is not guaranteed or endorsed by the publisher.
Acknowledgments
We would like to thank members of the California Environmental Flows Framework technical team for providing input and review of this manuscript.
Supplementary Material
The Supplementary Material for this article can be found online at: https://www.frontiersin.org/articles/10.3389/fenvs.2021.790667/full#supplementary-material
Footnotes
1https://github.com/ceff-tech/ffc_api_client.
2https://github.com/NoellePatterson/ffc-readme.
References
Ahearn, D. S., Sheibley, R. W., Dahlgren, R. A., and Keller, K. E. (2004). Temporal Dynamics of Stream Water Chemistry in the Last Free-Flowing River Draining the Western Sierra Nevada, California. J. Hydrol. 295, 47–63. doi:10.1016/j.jhydrol.2004.02.016
Allan, J. D. (2004). Landscapes and Riverscapes: The Influence of Land Use on Stream Ecosystems. Annu. Rev. Ecol. Evol. Syst. 35, 257–284. doi:10.1146/annurev.ecolsys.35.120202.110122
Beck, M. W., Mazor, R. D., Johnson, S., Wisenbaker, K., Westfall, J., Ode, P. R., et al. (2019a). Prioritizing Management Goals for Stream Biological Integrity within the Developed Landscape Context. Freshw. Sci. 38, 883–898. doi:10.1086/705996
Beck, M. W., Mazor, R. D., Theroux, S., and Schiff, K. C. (2019b). The Stream Quality Index: A Multi-Indicator Tool for Enhancing Environmental Management. Environ. Sustainability Indicators 1-2, 100004. doi:10.1016/j.indic.2019.100004
Biggs, B. J. F., Nikora, V. I., and Snelder, T. H. (2005). Linking Scales of Flow Variability to Lotic Ecosystem Structure and Function. River Res. Applic. 21, 283–298. doi:10.1002/rra.847
Blanckaert, K., Garcia, X.-F., Ricardo, A.-M., Chen, Q., and Pusch, M. T. (2013). The Role of Turbulence in the Hydraulic Environment of Benthic Invertebrates. Ecohydrol. 6, 700–712. doi:10.1002/eco.1301
Blodgett, D. (2018). nhdplusTools: Tools for Accessing and Working with the NHDPlus. Reston, VA. U.S. Geological Survey Available at: https://code.usgs.gov/water/nhdplusTools.
Botero, C. A., Weissing, F. J., Wright, J., and Rubenstein, D. R. (2015). Evolutionary Tipping Points in the Capacity to Adapt to Environmental Change. Proc. Natl. Acad. Sci. USA 112, 184–189. doi:10.1073/pnas.1408589111
Brown, L. R., May, J. T., Rehn, A. C., Ode, P. R., Waite, I. R., and Kennen, J. G. (2012). Predicting Biological Condition in Southern California Streams. Landscape Urban Plann. 108, 17–27. doi:10.1016/j.landurbplan.2012.07.009
Carlisle, D. M., Wolock, D. M., and Meador, M. R. (2011). Alteration of Streamflow Magnitudes and Potential Ecological Consequences: a Multiregional Assessment. Front. Ecol. Environ. 9, 264–270. doi:10.1890/100053
Cheng, B., Xia, R., Zhang, Y., Yang, Z., Hu, S., Guo, F., et al. (2019). Characterization and Causes Analysis for Algae Blooms in Large River System. Sust. Cities Soc. 51, 101707. doi:10.1016/j.scs.2019.101707
Colwell, R. K. (1974). Predictability, Constancy, and Contingency of Periodic Phenomena. Ecology 55, 1148–1153. doi:10.2307/1940366
Dewson, Z. S., James, A. B. W., and Death, R. G. (2007). Stream Ecosystem Functioning under Reduced Flow Conditions. Ecol. Appl. 17, 1797–1808. doi:10.1890/06-1901.1
Dormann, C. F., Elith, J., Bacher, S., Buchmann, C., Carl, G., Carré, G., et al. (2013). Collinearity: a Review of Methods to deal with it and a Simulation Study Evaluating Their Performance. Ecography 36, 27–46. doi:10.1111/j.1600-0587.2012.07348.x
Dudgeon, D., Arthington, A. H., Gessner, M. O., Kawabata, Z.-I., Knowler, D. J., Lévêque, C., et al. (2006). Freshwater Biodiversity: Importance, Threats, Status and Conservation Challenges. Biol. Rev. 81, 163–182. doi:10.1017/s1464793105006950
Elith, J., Leathwick, J. R., and Hastie, T. (2008). A Working Guide to Boosted Regression Trees. J. Anim. Ecol. 77, 802–813. doi:10.1111/j.1365-2656.2008.01390.x
Elliott, J. M. (1973). The Food of Brown and Rainbow trout (Salmo trutta and S. Gairdneri) in Relation to the Abundance of Drifting Invertebrates in a Mountain Stream. Oecologia 12, 329–347. doi:10.1007/bf00345047
Grantham, T. E., Carlisle, D. M., Howard, J., Lane, B., Lusardi, R., Obester, A., et al. (2021). Modeling Functional Flows in California’s Rivers. Frontiers in Environmental Science-Freshwater Science.
Grantham, T. E., Viers, J. H., and Moyle, P. B. (2014). Systematic Screening of Dams for Environmental Flow Assessment and Implementation. Bioscience 64, 1006–1018. doi:10.1093/biosci/biu159
Guisan, A., Zimmermann, N. E., Elith, J., Graham, C. H., Phillips, S., and Peterson, A. T. (2007). What Matters for Predicting the Occurrences of Trees: Techniques, Data, or Species' Characteristics. Ecol. Monogr. 77, 615–630. doi:10.1890/06-1060.1
Irving, K., Taniguchi-Quan, K. T., Poresky, A., Wildman, R., Aprahamian, A., River, C., et al. (2021). A Process for Applying Effective Flow Ecology Analysis to Aid Management Decision Making. Frontiers in Environmental Science-Freshwater Science.
Kapnick, S., and Hall, A. (2010). Observed Climate-Snowpack Relationships in California and Their Implications for the Future. J. Clim. 23, 3446–3456. doi:10.1175/2010jcli2903.1
Kirkwood, A. E., Jackson, L. J., and McCAULEY, E. (2009). Are Dams Hotspots forDidymosphenia Geminatablooms. Freshw. Biol. 54, 1856–1863. doi:10.1111/j.1365-2427.2009.02231.x
Kupferberg, S. J., Palen, W. J., Lind, A. J., Bobzien, S., Catenazzi, A., Drennan, J., et al. (2012). Effects of Flow Regimes Altered by Dams on Survival, Population Declines, and Range-wide Losses of California River-Breeding Frogs. Conserv. Biol. 26, 513–524. doi:10.1111/j.1523-1739.2012.01837.x
Lane, B. A., Dahlke, H. E., Pasternack, G. B., and Sandoval‐Solis, S. (2017). Revealing the Diversity of Natural Hydrologic Regimes in California with Relevance for Environmental Flows Applications. J. Am. Water Resour. Assoc. 53, 411–430. doi:10.1111/1752-1688.12504
Lange, K., Townsend, C. R., and Matthaei, C. D. (2016). A Trait‐based Framework for Stream Algal Communities. Ecol. Evol. 6, 23–36. doi:10.1002/ece3.1822
Lawrence, J. E., Lunde, K. B., Mazor, R. D., Bêche, L. A., McElravy, E. P., and Resh, V. H. (2010). Long-term Macroinvertebrate Responses to Climate Change: Implications for Biological Assessment in Mediterranean-Climate Streams. J. North Am. Benthological Soc. 29, 1424–1440. doi:10.1899/09-178.1
Lunde, K. B., Cover, M. R., Mazor, R. D., Sommers, C. A., and Resh, V. H. (2013). Identifying Reference Conditions and Quantifying Biological Variability within Benthic Macroinvertebrate Communities in Perennial and Non-perennial Northern California Streams. Environ. Manage. 51, 1262–1273. doi:10.1007/s00267-013-0057-1
Lytle, D. A. (2001). Disturbance Regimes and Life‐History Evolution. The Am. Naturalist 157, 525–536. doi:10.1086/319930
Lytle, D. A., and Poff, N. L. (2004). Adaptation to Natural Flow Regimes. Trends Ecol. Evol. 19, 94–100. doi:10.1016/j.tree.2003.10.002
Mackay, R. J. (1992). Colonization by Lotic Macroinvertebrates: A Review of Processes and Patterns. Can. J. Fish. Aquat. Sci. 49, 617–628. doi:10.1139/f92-071
Maloney, K. O., Carlisle, D. M., Buchanan, C., Rapp, J. L., Austin, S. H., Cashman, M. J., et al. (2021). Linking Altered Flow Regimes to Biological Condition: an Example Using Benthic Macroinvertebrates in Small Streams of the Chesapeake Bay Watershed. Environ. Manage. 67, 1171–1185. doi:10.1007/s00267-021-01450-5
Mazor, R. D., May, J. T., Sengupta, A., McCune, K. S., Bledsoe, B. P., and Stein, E. D. (2018). Tools for Managing Hydrologic Alteration on a Regional Scale: Setting Targets to Protect Stream Health. Freshw. Biol. 63, 786–803. doi:10.1111/fwb.13062
Mazor, R. D., Rehn, A. C., Ode, P. R., Engeln, M., Schiff, K. C., Stein, E. D., et al. (2016). Bioassessment in Complex Environments: Designing an index for Consistent Meaning in Different Settings. Freshw. Sci. 35, 249–271. doi:10.1086/684130
McGill, R., Tukey, J. W., and Larsen, W. A. (1978). Variations of Box Plots. The Am. Statistician 32, 12–16. doi:10.1080/00031305.1978.10479236
McIntire, C. D. (1966). Some Effects of Current Velocity on Periphyton Communities in Laboratory Streams. Hydrobiologia 27, 559–570. doi:10.1007/bf00042713
Miller, M. P., McKnight, D. M., Cullis, J. D., Greene, A., Vietti, K., and Liptzin, D. (2009). Factors Controlling Streambed Coverage of Didymosphenia Geminata in Two Regulated Streams in the Colorado Front Range. Hydrobiologia 630, 207–218. doi:10.1007/s10750-009-9793-x
Naman, S. M., Rosenfeld, J. S., and Richardson, J. S. (2016). Causes and Consequences of Invertebrate Drift in Running Waters: from Individuals to Populations and Trophic Fluxes. Can. J. Fish. Aquat. Sci. 73, 1292–1305. doi:10.1139/cjfas-2015-0363
Nilsson, C., and Renöfält, B. M. (2008). Linking Flow Regime and Water Quality in Rivers: a Challenge to Adaptive Catchment Management. E&S 13. doi:10.5751/ES-02588-130218
Nislow, K. H., Folt, C., and Seandel, M. (1998). Food and Foraging Behavior in Relation to Microhabitat Use and Survival of Age-0 Atlantic salmon. Can. J. Fish. Aquat. Sci. 55, 116–127. doi:10.1139/f97-222
Patterson, N. K., Lane, B. A., Sandoval-Solis, S., Pasternack, G. B., Yarnell, S. M., and Qiu, Y. (2020). A Hydrologic Feature Detection Algorithm to Quantify Seasonal Components of Flow Regimes. J. Hydrol. 585, 124787. doi:10.1016/j.jhydrol.2020.124787
Pebesma, E. (2018). Simple Features for R: Standardized Support for Spatial Vector Data. R. J. 10, 439. doi:10.32614/rj-2018-009
Peek, R. A., O'Rourke, S. M., and Miller, M. R. (2021). Flow Modification Associated with Reduced Genetic Health of a River‐breeding Frog, Rana Boylii. Ecosphere 12. doi:10.1002/ecs2.3496
Persad, G. G., Swain, D. L., Kouba, C., and Ortiz-Partida, J. P. (2020). Inter-model Agreement on Projected Shifts in California Hydroclimate Characteristics Critical to Water Management. Climatic Change 162, 1493–1513. doi:10.1007/s10584-020-02882-4
Poff, N. L., Olden, J. D., Merritt, D. M., and Pepin, D. M. (2007). Homogenization of Regional River Dynamics by Dams and Global Biodiversity Implications. Proc. Natl. Acad. Sci. 104, 5732–5737. doi:10.1073/pnas.0609812104
Poff, N. L., Voelz, N. J., Ward, J. V., and Lee, R. E. (1990). Algal Colonization under Four Experimentally-Controlled Current Regimes in High Mountain Stream. J. North Am. Benthological Soc. 9, 303–318. doi:10.2307/1467898
Poff, N. L., and Zimmerman, J. K. H. (2010). Ecological Responses to Altered Flow Regimes: a Literature Review to Inform the Science and Management of Environmental Flows. Freshw. Biol. 55, 194–205. doi:10.1111/j.1365-2427.2009.02272.x
R Core Team (2021). R: A Language and Environment for Statistical Computing. Vienna, Austria: R Foundation for Statistical Computing. Available at: https://www.R-project.org/.
Radecki-Pawlik, A., Wałęga, A., Młyński, D., Młocek, W., Kokoszka, R., Tokarczyk, T., et al. (2020). Seasonality of Mean Flows as a Potential Tool for the Assessment of Ecological Processes: Mountain Rivers, Polish Carpathians. Sci. Total Environ. 716, 136988. doi:10.1016/j.scitotenv.2020.136988
Rehn, A. C. (2009). Benthic Macroinvertebrates as Indicators of Biological Condition below Hydropower Dams on West Slope Sierra Nevada Streams, California, USA. River Res. Applic. 25, 208–228. doi:10.1002/rra.1121
Ridgeway, G. (2015). Gbm: Generalized Boosted Regression Models. Available at: http://CRAN.R-project.org/package-gbm.
Romaniszyn, E. D., Hutchens, J. J., and Bruce Wallace, J. (2007). Aquatic and Terrestrial Invertebrate Drift in Southern Appalachian Mountain Streams: Implications for trout Food Resources. Freshw. Biol 52, 1–11. doi:10.1111/j.1365-2427.2006.01657.x
Schneider, S. C., Hilt, S., Vermaat, J. E., and Kelly, M. (2016). “The ‘Forgotten’ Ecology behind Ecological Status Evaluation: Re-assessing the Roles of Aquatic Plants and Benthic Algae in Ecosystem Functioning” in Progress In Botany. Springer International Publishing.
Schneider, S. C., and Petrin, Z. (2017). Effects of Flow Regime on Benthic Algae and Macroinvertebrates - A Comparison between Regulated and Unregulated Rivers. Sci. Total Environ. 579, 1059–1072. doi:10.1016/j.scitotenv.2016.11.060
Steel, A. E., Peek, R. A., Lusardi, R. A., and Yarnell, S. M. (2018). Associating Metrics of Hydrologic Variability with Benthic Macroinvertebrate Communities in Regulated and Unregulated Snowmelt-Dominated Rivers. Freshw. Biol. 63, 844–858. doi:10.1111/fwb.12994
Stein, E. D., Sengupta, A., Mazor, R. D., McCune, K., Bledsoe, B. P., and Adams, S. (2017). Application of Regional Flow-Ecology Relationships to Inform Watershed Management Decisions: Application of the ELOHA Framework in the San Diego River Watershed, California, USA. Ecohydrology 10, e1869. doi:10.1002/eco.1869
Stein, E. D., Zimmerman, J., Yarnell, S., Stanford, B., Lane, B., Taniguchi-Quan, K. T., et al. (2021). The California Environmental Flows Framework: Meeting the Challenges of Developing a Large-Scale Environmental Flows Program. Frontiers in Environmental Science-Freshwater Science.
Stevenson, J. (2014). Ecological Assessments with Algae: a Review and Synthesis. J. Phycol. 50, 437–461. doi:10.1111/jpy.12189
Stevenson, R. J., Pan, Y., and van Dam, H. (2010). “Assessing Environmental Conditions in Rivers and Streams with Diatoms,” in The Diatoms: Applications to the Environmental and Earth Sciences. Editors E. F. Stoermer, and J. P. Smol (Cambridge: Cambridge University Press), 57–85.
Stevenson, R. J., and Smol, J. P. (2003). “Use of Algae in Environmental Assessments,” in “Use of Algae in Environmental Assessments,” in Freshwater Algae In North America: Classification and Ecology. Editors J. D. Wehr, and R. G. Sheath (San Diego, CaliforniaSan Diego, California): Academic Press), 775–804. doi:10.1016/b978-012741550-5/50024-6
Stubbington, R. (2012). The Hyporheic Zone as an Invertebrate Refuge: A Review of Variability in Space, Time, Taxa and Behaviour. Mar. Freshw. Res. 63, 293–311. doi:10.1071/mf11196
Suren, A. M., Biggs, B. J. F., Kilroy, C., and Bergey, L. (2003). Benthic Community Dynamics during Summer Low‐flows in two rivers of Contrasting Enrichment 1. Periphyton. New Zealand J. Mar. Freshw. Res. 37, 53–70. doi:10.1080/00288330.2003.9517146
Swain, D. L., Langenbrunner, B., Neelin, J. D., and Hall, A. (2018). Increasing Precipitation Volatility in Twenty-First-century California. Nat. Clim Change 8, 427–433. doi:10.1038/s41558-018-0140-y
Theroux, S., Mazor, R. D., Beck, M. W., Ode, P. R., Stein, E. D., and Sutula, M. (2020). Predictive Biological Indices for Algae Populations in Diverse Stream Environments. Ecol. Indicators 119, 106421. doi:10.1016/j.ecolind.2020.106421
Tonkin, J. D., Bogan, M. T., Bonada, N., Rios‐Touma, B., and Lytle, D. A. (2017). Seasonality and Predictability Shape Temporal Species Diversity. Ecology 98, 1201–1216. doi:10.1002/ecy.1761
Tonkin, J. D., Olden, J. D., Merritt, D. M., Reynolds, L. V., Rogosch, J. S., and Lytle, D. A. (2021). Designing Flow Regimes to Support Entire River Ecosystems. Front. Ecol. Environ. 19, 326–333. doi:10.1002/fee.2348
Townsend, C. R., and Hildrew, A. G. (1976). Field Experiments on the Drifting, Colonization and Continuous Redistribution of Stream Benthos. J. Anim. Ecol. 45, 759–772. doi:10.2307/3579
Ward, J. V., and Stanford, J. A. (1982). Thermal Responses in the Evolutionary Ecology of Aquatic Insects. Annu. Rev. Entomol. 27, 97–117. doi:10.1146/annurev.en.27.010182.000525
Wickham, H., Averick, M., Bryan, J., Chang, W., McGowan, L., François, R., et al. (2019). Welcome to the Tidyverse. Joss 4, 1686. doi:10.21105/joss.01686
Wickham, H., François, R., Henry, L., and Müller, K. (2018). Dplyr: A Grammar of Data Manipulation. Available at: https://CRAN.R-project.org/package=dplyr.
Wood, P. J. B., Boulton, A. J., Little, S., and Stubbington, R. (2010). Is the Hyporheic Zone a Refugium for Aquatic Macroinvertebrates during Severe Low Flow Conditions. fal 176, 377–390. doi:10.1127/1863-9135/2010/0176-0377
Xia, R., Wang, G., Zhang, Y., Yang, P., Yang, Z., Ding, S., et al. (2020). River Algal Blooms Are Well Predicted by Antecedent Environmental Conditions. Water Res. 185, 116221. doi:10.1016/j.watres.2020.116221
Yarnell, S. M., Petts, G. E., Schmidt, J. C., Whipple, A. A., Beller, E. E., Dahm, C. N., et al. (2015). Functional Flows in Modified Riverscapes: Hydrographs, Habitats and Opportunities. Bioscience 65, 963–972. doi:10.1093/biosci/biv102
Yarnell, S. M., Stein, E. D., Webb, J. A., Grantham, T., Lusardi, R. A., Zimmerman, J., et al. (2020). A Functional Flows Approach to Selecting Ecologically Relevant Flow Metrics for Environmental Flow Applications. River Res. Applic 36, 318–324. doi:10.1002/rra.3575
Yarnell, S. M., Viers, J. H., and Mount, J. F. (2010). Ecology and Management of the Spring Snowmelt Recession. Bioscience 60, 114–127. doi:10.1525/bio.2010.60.2.6
Keywords: bioassessment, flow modification, ecological flow management, seasonality, flow-ecology relationship, California environmental flows framework
Citation: Peek R, Irving K, Yarnell SM, Lusardi R, Stein ED and Mazor R (2022) Identifying Functional Flow Linkages Between Stream Alteration and Biological Stream Condition Indices Across California. Front. Environ. Sci. 9:790667. doi: 10.3389/fenvs.2021.790667
Received: 07 October 2021; Accepted: 29 November 2021;
Published: 04 January 2022.
Edited by:
Carlo Camporeale, Politecnico di Torino, ItalyReviewed by:
Ben Stewart-Koster, Griffith University, AustraliaRui Manuel Vitor Cortes, University of Trás-os-Montes and Alto Douro, Portugal
Copyright © 2022 Peek, Irving, Yarnell, Lusardi, Stein and Mazor. This is an open-access article distributed under the terms of the Creative Commons Attribution License (CC BY). The use, distribution or reproduction in other forums is permitted, provided the original author(s) and the copyright owner(s) are credited and that the original publication in this journal is cited, in accordance with accepted academic practice. No use, distribution or reproduction is permitted which does not comply with these terms.
*Correspondence: Ryan Peek, cmFwZWVrQHVjZGF2aXMuZWR1