 Allison M. Young
 Elizabeth F. van Mantgem
 Alexis Garretson
 Christine Noel5
- 1Department of Integrative Biology, Michigan State University, East Lansing, MI, United States
- 2Ecology, Evolution, and Behavior Program, Michigan State University, East Lansing, MI, United States
- 3Sequoia Park Zoo, Eureka, CA, United States
- 4Department of Biology, George Mason University, Fairfax, VA, United States
- 5Guest Services and Education Curator, Sequoia Park Zoo, Eureka, CA, United States
- 6U.S. Geological Survey, Northeast Climate Adaptation Science Center, Amherst, MA, United States
Guided by the six elements of Translational Ecology (TE; i.e., decision-framing, collaboration, engagement, commitment, process, and communication), we showcase the first explicit example of a Translational Science Education (TSE) effort in the coastal redwood ecosystem of Humboldt County, CA. Using iNaturalist, a flexible and free citizen science/crowdsourcing app, we worked with students from grade school through college, and their teachers and community, to generate species lists for comparison among 19 school and non-profit locations spanning a range of urbanization. Importantly, this TSE effort resulted in both learning and data generation, highlighting the ability of a TSE framework to connect and benefit both students and researchers. Our data showed that, regardless of the age of the observers, holding organized BioBlitzes added substantially more species to local biodiversity lists than would have been generated without them. In support of current ecological theory, these data showed an urbanization gradient among sites, with rural sites containing fewer non-native species than urban ones. On the education side, qualitative assessments revealed students and educators remained engaged throughout the project. Future projects would also benefit by establishing quantifiable metrics for assessing student learning from project conception. Throughout the project, the fundamentals of TE were followed with repeated interactions and shared objectives developed over time within trusted community relationships. Such positive human interactions can lead new naturalists to think of themselves as champions of their local biodiversity (i.e., as land stewards). We anticipate that such newly empowered and locally expert naturalists will remain committed to land stewardship in perpetuity and that other scientists and educators are inspired to conduct similar work.
Introduction
Resource managers have long known that the conservation of natural resources is not sustainable without the inclusion of the local human community (Shafer 1997; Primack 2012). In addition, educators know that the next generation of scientists require hands-on, place-based experiential learning to develop a more in-depth understanding of core scientific concepts (Bransford et al., 2000; DeBoer 2000; Michael and Modell 2003; Lombardi 2007; Darling-Hammond et al., 2020). To address these complementary needs of resource management and hands on opportunities for students, we look to Translational Science Education (TSE, Sutherland et al., 2019), a recent outgrowth of the new field of Translational Ecology (TE) that was developed to provide a framework for improving coordination and collaboration between researchers and practitioners in order to produce actionable science (Brunson and Baker 2016; Enquist et al., 2017; Lawson et al., 2017). TE makes it possible to better address the enormous problems of the Anthropocene (e.g., climate change, habitat loss, invasive species, and pollution) while taking into account regionally specific ecological and social challenges and perspectives. It focuses limited resources on producing meaningful results through knowledge coproduction (Enquist et al., 2017; Hallett et al., 2017; Lawson et al., 2017). Taking TE one step farther, TSE “develops mutually beneficial partnerships between scientists and educators to help students” (Sutherland et al., 2019: 83) while also improving scientific knowledge.
This paper lays out the first explicit example of TSE, bringing the principles of TE together with the latest technology and the power of citizen science. Scientists are increasingly enlisting the public in providing information to advance scientific knowledge given limited resources (Bhattacharjee 2005; Bonney et al., 2009; Silvertown 2009; Wilson et al., 2017). With the proliferation of online platforms and applications supported by universities and other institutions (e.g., Project FeederWatch at Cornell University, iNaturalist at California Academy of Science), scientists and educators can simultaneously generate reliable scientific data and nurture public awareness and biophilia (Bonney et al., 2009; Dickinson et al., 2012; Theobald et al., 2015; Wilson et al., 2017). However, the process of establishing a citizen science project by an individual scientist, or a small group of public volunteers, remains daunting. Many scientists and educators have expressed concerns about the methods, technology, or data quality and the time-intensive nature of citizen science projects (Brewer 2002; Au 2007; McDonald and Songer 2008; Bell 2010; Bodmer 2010). For ecologists in particular, there is often a general distrust in the non-traditional generation of data, despite increasing evidence that citizen science can generate high quality ecological data with planning, effective citizen scientist training and guidance, and thorough data validation practices (Hunter et al., 2013; Callaghan and Gawlik 2015; van der Velde et al., 2017; Hochmair et al., 2020).
By including the community both physically and virtually to generate bigger, better, and more meaningful scientific data, this project models a TSE framework that can simultaneously benefit both students and educators. In this aspirational effort, students (i.e., the local citizen scientists) are the generators of knowledge. In doing so, students receive a more genuine and engaging educational experience that simultaneously generates knowledge necessary for solving an increasingly dire global conservation crisis. Meanwhile, the on-the-ground, proximate, active participation by local students can encourage budding naturalists and may even encourage conservation action and pro-environmental behavior (Crall et al., 2013; Toomey and Domroese 2013; McKinley et al., 2017).
Bringing educators, researchers, and students together into a mutually beneficial scientific relationship, the Tiny North Coast Places project provides a TSE case study focused on student groups surveying the biodiversity of species in a local ecosystem, in this case the Coastal Redwood ecosystem of California. The Tiny North Coast Places project employed the free crowdsourcing application iNaturalist, a citizen science platform hosted by the California Academy of Sciences that has nurtured a growing online naturalist community since 2011 (Bonney et al., 2016; Nugent 2018; O'Keeffe 2019). Using iNaturalist, students recorded organisms that they observed in their local community, mostly during organized BioBlitz surveys. A BioBlitz is a temporally bounded event during which individuals attempt to rapidly document as many species as possible in a particular geographic area to catalog biodiversity and species richness (Lundmark 2003; Baker et al., 2014). The data collected through iNaturalist can then be used to draw conclusions about the ability of citizen science to contribute to biodiversity knowledge and inform scientific questions. Through the Tiny North Coast Places project, we test the major principles of TE/TSE and show how a focus on these principles can improve the experience, the results, and the sustainability of experiential science education, while simultaneously generating high-quality, valuable data for science. Specifically, this case study is based on TSE principles.
Decision Framing
TSE aims to fulfill the goals of both scientific and educational participants through a citizen science project that is developed collaboratively. In this project, the desired outcomes of researchers and educators were complimentary, but not the same. As in many ecosystems around the world (Aronson et al., 2014; Elmqvist et al., 2016; Piano et al., 2020), there is likely a steep decline in native species diversity in the coastal redwood ecosystem with increasing urbanization, though to date this has been only sporadically documented (Noss 1999; Kalinowski and Johnson 2010; Welsh and Hodgson, 2013). A primary goal of the researchers participating in this project was to analyze how urbanization has impacted species diversity in coastal redwood systems. In this context, the researchers predicted that an urbanization gradient would be found in the coastal redwood system, with fewer introduced species in less populated and more forested survey sites. The researchers also aimed to investigate how the structure of our project would affect the data generated. In particular, they predicted that this project would contribute new species to the Humboldt County species lists, and that the use of short-term BioBlitzes would lead to significantly more observations and species being recorded above those generated by the one-year surveys for locations that did not utilize BioBlitzes.
On the education side, teachers in the Tiny North Coast Places project had the goal of engaging students in collecting scientifically-useful data as a way of meeting age-appropriate Next Generation Science Standards (National Research Council, 2012). Teachers framed the project within the NGSS framework in a manner suitable to the age of their students, with performance expectations set within each grade level. They then led students through separating and analyzing Tiny North Coast Places data using crosscutting concepts to illustrate core ideas in the life sciences that were appropriate to the grade level, with the goal of linking the scientific practice of data collection to educational outcomes (e.g., NGSS standard 2-LS4-1: Make observations of plants and animals to compare the diversity of life in different habitats). Educators at a partnering organization, the Sequoia Park Zoo, aimed to provide unique and fun experiences where participants could develop a closer connection to animals and the environment. In addition, they aimed to create programs that address cognitive, affective, and behavioral decision making, and to integrate local and global conservation topics into their educational programming. The zoo aimed to reach these goals in collaboration with local agencies, institutions, and organizations to collaborate on programs and activities, such as through participating in the Tiny North Coast Places project. Educators at the Sequoia Park Zoo organized BioBlitzes when school field trips visited the zoo, and worked with visiting students to safely explore the zoo and forest and discuss the impact non-native species can have on ecosystems.
Collaboration
As stated by Sutherland et al. (2019), TSE projects provide authentic learning experiences while furthering scientific knowledge. To accomplish this goal, the Tiny North Coast Places project was developed by one private citizen science champion (conservation biologist and Sequoia Park Zoo volunteer Elizabeth van Mantgem; see acknowledgements for a complete set of champions) in collaboration with the Humboldt County Office of Education staff, teachers, and volunteer parents, with support from the Sequoia Park Zoo (Guest Services and Education Curator Christine Noel, Zoo Director Gretchen Ziegler) and funding from the locally-based Save the Redwoods League (Deborah Zierten, Education & Interpretation Manager). While the private citizen science champion developed the original idea for the project, educators took the idea for the project into their classrooms and made it their own, integrating it into their established lesson plans to help reach NGSS curriculum standards. The use of iNaturalist maintained consistency in the project by ensuring that all collaborators were connected and all data were collated, despite the variance in the frequency with which data were collected and differences in the lessons taught by teachers.
Engagement
TSE calls for educators to be genuinely engaged in research, and for researchers to be genuinely engaged in education. This project helped the students and staff in the Humboldt County School community engage with nature and scientific research by learning how to find, photo-observe, and appreciate plants and animals as modern-day hunter-gatherers. Students collected valuable biodiversity data as they learned about the species found commonly at their schools and connected with nature. Throughout the process, students were engaged in learning not just scientific concepts, but also how to be scientists in accordance with NGSS curriculum. These standards focus on three-dimensional learning by integrating practices used in scientific inquiry (e.g. behaviors, methods), crosscutting concepts that can be applied across scientific discipline (e.g., identifying patterns, energy), and core disciplinary ideas (e.g., ecosystems, heredity in the life sciences; National Research Council, 2012; Bybee 2013). Teachers ensured that students were engaged with and learning through the Tiny North Coast Places project by outlining the project within the NGSS framework and presenting the iNaturalist photo-observations as a game. Student teams within classes were encouraged to “compete” against other teams at their own and other schools to see who could find the most species as a way to increase engagement. A primary objective was to give participants a deep appreciation for local biodiversity and conservation and a deeper understanding of how to be scientists.
Commitment
Much like commitment from researchers is key to a successful translational ecology process, TSE requires a sense of responsibility and commitment to continued engagement from educators, researchers, and students toward building and maintaining productive citizen science relationships. Educators and students pledged to participate in the Tiny North Coast Places project throughout the year, while researchers were responsible for analyzing and publishing the collected data so the results could be known by all participants. Key champions within the Humboldt County school system were enlisted to ensure continued commitment to the Tiny North Coast Places project. The project aimed to help give students and staff the confidence to make scientific observations elsewhere, after taking the time to become engaged with the process of citizen science in this project. This confidence might encourage them to try deeper, more complicated citizen science projects (i.e. projects with effort data and protocols, like Project Feederwatch or CA Phenology Project) after they become competent with the introductory, iNaturalist observation data collection methodology.
Process
This project aimed to practice TSE effectively through frequent interaction and knowledge exchange, with methods updated as the project moved forward to be responsive to the needs of all participants. As previously mentioned, this project used the iNaturalist platform as a simple method for collecting observations that allowed all participants to contribute and look at the collected data. It leaned on the formal relationship of teachers to students and zoo groups to increase the chances of obtaining high-quality photo observations collected at regular intervals, and to ensure continued student engagement throughout the project.
Communication
Authenticity is the difference between traditional experiential learning and TSE. The integration of researchers into the curriculum facilitates better dialogue and more effective learning experiences (Sutherland et al., 2019). In the case of a citizen science project, iNaturalist provides a versatile and accessible platform by allowing the community of naturalists to directly question and inform the experts among them of any new, local wildlife eccentricities and changes. These observations can then be immediately weighed against more familiar natural histories of the organisms they are observing. Ideally, the newer naturalists in the community actually see some of the impact of their contributions to science through supportive dialogue, updated phenology graphs, and altered range maps. Communication between the initiator of the project, citizen science champion Elizabeth van Mantgem, educators, and students was maintained throughout the project to encourage student citizen scientists to remain engaged. Ms. van Mantgem worked with students on a regular basis to present the Tiny North Coast Places project as a game, where they were competing to find the most species. Teachers regularly encouraged their students to participate, and remained in contact with Ms. van Mantgem throughout the project.
Here we present results highlighting the ability to answer scientific research questions using data generated in a TSE framework, and show how the structure of a project can shape the results generated. These analyses can then be used by other researchers to better plan and structure their own TSE projects.
Methods
Location
The Tiny North Coast Places project was conducted primarily in Humboldt County, California, United States (40.7450ºN, 123.8695ºW), which is situated both inside and outside of the current Coastal Redwood (Sequoia sempervirens [(Lamb. Ex D. Don) Endl.]) range boundary (Noss 1999). Humboldt County is a densely forested but sparsely populated (approximately 132,000 people), 1.5 million acre California county with a predominantly Mediterranean climate of cool wet winters and warmer, drier summers.
Population and Partners
This project involved the partnership of the Humboldt County Office of Education, Humboldt State University, College of the Redwoods, Sequoia Park Zoo, Freshwater Farms Reserve, and Humboldt Coastal Nature Center, with funding from the Save the Redwoods League. The Humboldt County Office of Education supports over 18,000 students of diverse ethnicities on 31 different school district properties (80+ school parcels) totaling about 4,052 square miles of land. These properties are distributed across the entire county and include important plant and animal populations outside, but not excluded from, protected Coastal Redwood land boundaries. A total of 14 K-12 schools participated in the Tiny North Coast Places project with participants ranging from elementary to high school aged. Humboldt State University is a public university of over 6,000 students situated in a rural area at the edge of coastal redwood forest, while the College of the Redwoods is a public community college similarly located in a rural area near coastal redwood forest. The Sequoia Park Zoo, Freshwater Farms Reserve (a restored wetland reserve), and the Humboldt Coastal Nature Center are all non-profit or city-run organizations. After data collection, four research scientists joined the project to analyze the data and write up the results.
Program Description
The program was carried out during the 2017–2018 academic year using the iNaturalist app, an online platform to which users upload observations of organisms in their surroundings. These observations can be photographs of organisms, tracks, nests, etc, with information about the time and georeference of the photograph also uploaded if it is available. Observations are then available for other fellow naturalists to view and identify, with observations deemed either “Needs ID” or “Research Grade” to provide information about the reliability of the data. Observations with a photograph or audio record and at least two independent agreeing verifications are considered Research Grade (RG). Data on the iNaturalist app can then be used in scientific research to draw conclusions about species distributions, diversity, and more. iNaturalist allows users to create “Projects”, in which observations for specific efforts such as citizen science projects can be collated in one directory; multiple projects can even be linked together under the heading of an overall “Umbrella Project”. Similarly, the “Places” feature of iNaturalist allows users to specify geographic regions in which data will be collected for a project.
For the Tiny North Coast Places project, we created a one-year Collection Project on iNaturalist for each participating school or nonprofit to which participants could upload their species observations. All of these Collection Projects were linked under the Tiny North Coast Places Umbrella Project, which allowed for species comparisons between groups. To mimic plot-based quadrat sampling, we used the iNaturalist Places feature to create tiny virtual ‘plots’ in Humboldt County in which to monitor species diversity and changes over time. We created one virtual plot encompassing the school grounds for each of the 14 participating Humboldt County schools, as well as for each of the two participating universities and three non-profit land organizations, giving us a total of 19 plots. The data collected in each plot could therefore be assigned to its corresponding Collection Project, and analyzed within the context of the entire Tiny North Coast Places dataset.
During the project year(s), a group of staff, students, and other community members for each location was encouraged and coached to try photo-collecting plants, fungi, insects, animals, and signs (e.g., tracks, scat, burrows, etc.) using the iNaturalist platform. Where there was interest, shorter-term site-tailored iNaturalist BioBlitz events were created to enhance both the fun and the abundance of data collection (see Table 1, column 5). Most of these BioBlitzes were one-to three-hour-long events with the exception of the semester-long BioBlitz conducted by Humboldt State University.
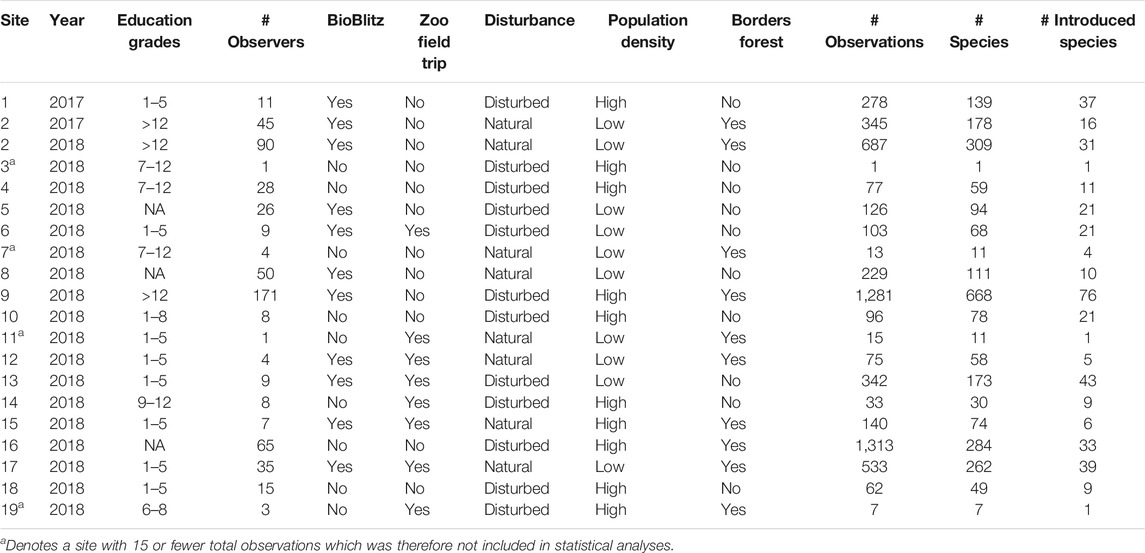
TABLE 1. Summary information for each site involved in the Tiny North Coast Places project. Information on the observer characteristics, land use characteristics, and summary data are shown.
Finally, to encourage participation, schools that agreed to facilitate BioBlitzes at their own school sites were offered a free field trip to the zoo for up to 60 students, during which they could help monitor the Sequoia Park’s biodiversity via an iNaturalist BioBlitz Collection Project, then picnic and visit the ex situ animal collections on the zoo grounds.
Data Retrieval and Analysis
The complete set of observations and identifications was retrieved for each virtual plot on May 12, 2019—excluding the combined Sequoia Park Zoo site which was retrieved on July 1, 2019—as a static snapshot of the dataset, to control for the ongoing updating of species identifications on iNaturalist (Ueda 2021; Young et al., 2021). For each site, summaries of the full dataset were extracted for analysis, including the number of observers, the number of observations, the number of species, and the number of species categorized as ‘introduced’ by iNaturalist (Table 1). Information about observer characteristics were recorded for each site, including the educational level of the observing group, if a site conducted an official BioBlitz, if the group took a field trip to the zoo, and the year observations took place. Land use within each location was also recorded at each site by the project organizer (EFvM) using binary variables for level of disturbance (high or low, corresponding to developed urban or undeveloped rural areas respectively), population density (high or low, again corresponding to urban or rural locations), and proximity to forest (overlapping or not overlapping with redwood forests, with one or more miles separating location and redwood forest). Sites with 15 or fewer total observations were excluded from further analyses due to the small sample size.
To determine the effects of urbanization on species diversity and the number of introduced species, we analyzed the impact of land use characteristics on four metrics of taxonomic diversity. The Shannon diversity index, Shannon evenness index, number of species observed, and number of introduced species observed were calculated for each of the sites using only research grade observations to ensure data trustworthiness. We used each diversity measure as the response variable in a separate generalized linear model using a Gaussian distribution for both Shannon indices and a negative binomial distribution for both species models. We used a Gaussian distribution for the models of Shannon diversity and evenness as Shapiro-Wilk tests indicated that neither of the metrics derived from the research-grade dataset nor the total dataset deviated significantly from a normal distribution (Shannon diversity: p = 0.62 total, p = 0.36 Research Grade; Evenness: p = 0.06 total, p = 0.17 Research Grade). We used a negative binomial distribution for both species models as they consisted of overdispersed count data. The binary land use variables of disturbance, forest relationship, and population density were considered as fixed factors in each model. Model selection for each response variable was performed by starting from a null model and adding fixed factors to increase complexity; the null model contained no fixed factors. The final selected model for each response variable was chosen based on having the lowest Akaike Information Criterion (AICc), and was then analyzed using ANOVA.
To determine the effects of observer characteristics on the amount of data collected, we used generalized linear models to analyze the response variables of: number of total observations, number of research grade observations, total number of species observed, number of research grade species observed, number of total observations of introduced species, number of research grade observations of introduced species, total number of introduced species observed, and number of research grade introduced species observed. As these response variables were composed of overdispersed counts, we used a negative binomial distribution in the generalized linear models. The observer characteristics of education level, BioBlitz participation, zoo trip participation, and number of observers were used as fixed factors in each model. Similarly, to determine the effects of observer characteristics on the type of data collected, we used generalized linear models to analyze the response variables of: percentage of observations that were plants, percentage of observation that were birds, and percentage of observations that were not in one of those two groups. As our response variables consisted of percentages, we used a binomial distribution with a logit link function in our generalized linear models. The observer characteristics of education level, BioBlitz participation, zoo trip participation, and number of observers were considered as fixed factors in each model. Model selection based on AICc was used to select all final models as previously described, after which final models were analyzed using ANOVA.
Because we were specifically interested in the usefulness of performing a BioBlitz on the ability to detect biodiversity and increase observations, we conducted t-tests analyzing the effect of participating in a BioBlitz on the subsequent Shannon diversity index, number of research grade observations collected, and number of research grade species detected.
Finally, we fitted species accumulation curves on the full dataset to assess whether the asymptote for species detection was approached for the project. We fit separate accumulation curves based on the number of observers, number of sampling days, and number of sites.
All analyses were conducted in R (version 4.0.2; R Core Team 2016) with RStudio (version 1.3.959; RStudio Team 2020) using the packages vegan (version 2.5–6; Oksanen et al., 2019), MASS (version 7.3–51.6; Venables and Ripley 2002), and lubridate (version 1.7.9; Grolemund and Wickham 2011), and figures were generated using ggplot2 (version 3.3.2; Wickham 2016).
Results
Qualitative Findings
Both common and uncommon Redwood Coast species were photo-observed and mapped by new citizen scientists of all ages and levels of expertise throughout the year. ]Because the iNaturalist platform requires standardized metadata (e.g. location, date, and photo) in order to be included in the potential research data set, all included data were collected in a consistent format regardless of participant age or location.
Across all sites, a total of 5,306 observations were collected; 2,177 (41.02%) of these were Research Grade (RG). These RG observations represented 529 unique species (Figure 1; Supplementary Table S1). Of the total number of species (2,550) that have been observed and recorded as RG in Humboldt County on iNaturalist, 21.25% of those species were observed in this project. Our observations also added new species to the iNaturalist dataset for the study area, such as the common shiny woodlouse (Oniscus asellus [Linnaeus]; RG), the granulated ground beetle (Carabus granulatus [Linnaeus]; RG), the collared false darkling beetle (Phryganophilus collaris [LeConte]; RG), and the variegated yellow archangel (Lamium galeobdolon argentatum [(Smejkal) J Duvign.]; RG), an invasive wildflower.
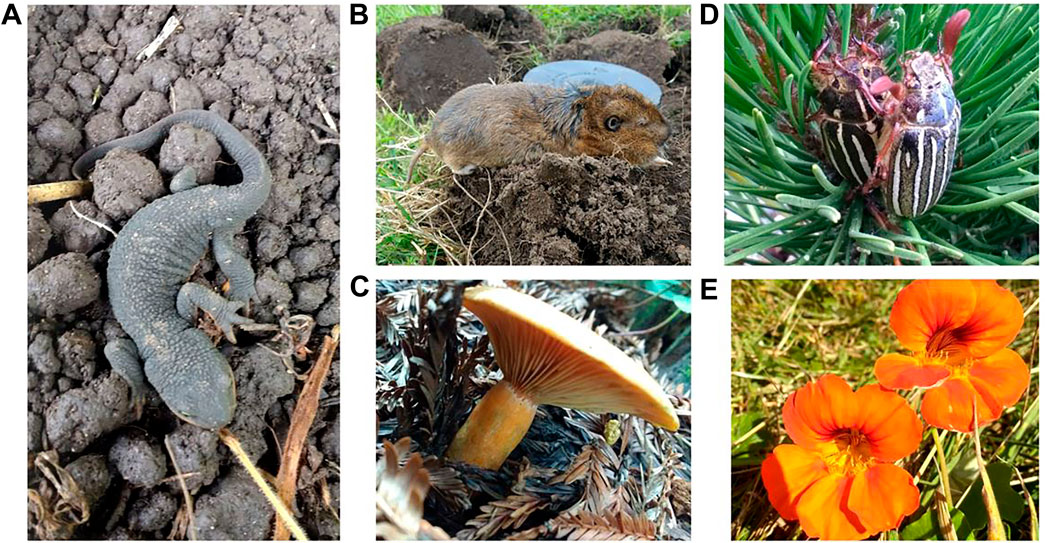
FIGURE 1. Representative observations from the Tiny North Coast Places project on iNaturalist. (A): rough-skinned newt (Taricha granulosa); (B): Botta’s pocket gopher (Thomomys bottae); (C): saffron milkcap (Lactarius deliciosus); (D): ten-lined June beetle (Polyphylla decemlineata); (E): Nasturtium (Tropaeolum majus). Images taken by E. F. van Mantgem.
Observations were collected during every month of the year, with a high of 1,089 observations collected in May and a low of 156 observations collected in January. Additionally, new users submitted observations to iNaturalist each month, indicating growing participation over time. Observations were collected on 375 days across 2017 and 2018, with an average of 15.35 observations collected on observation days. When excluding sites with unusually low participation (15 or fewer total observations recorded), the mean number of observations by site was 357.5
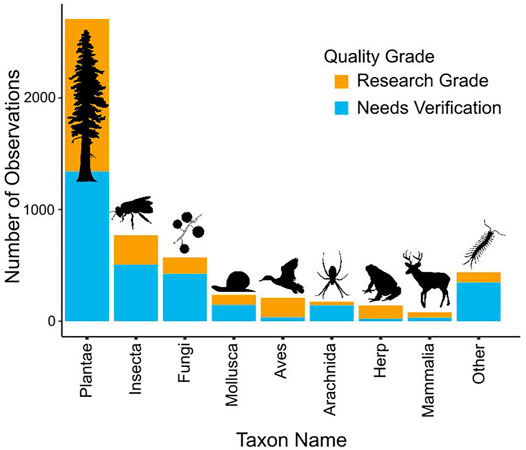
FIGURE 2. Observations (Research Grade in brown) by taxa recorded over the course of the Tiny North Coast Places project.
TSE Citizen Science as a Research Tool
As a representative example of how citizen science data can be used in the TSE context to answer scientific research questions, we investigated how urbanization affected species diversity and the number of introduced species within Humboldt County. After model selection, the most predictive generalized linear models for the effect of binary land use characteristics on Shannon diversity index and Shannon evenness contained only the fixed factor of relationship to forest. Sites that overlapped with redwood forests had significantly higher Shannon diversity indexes (
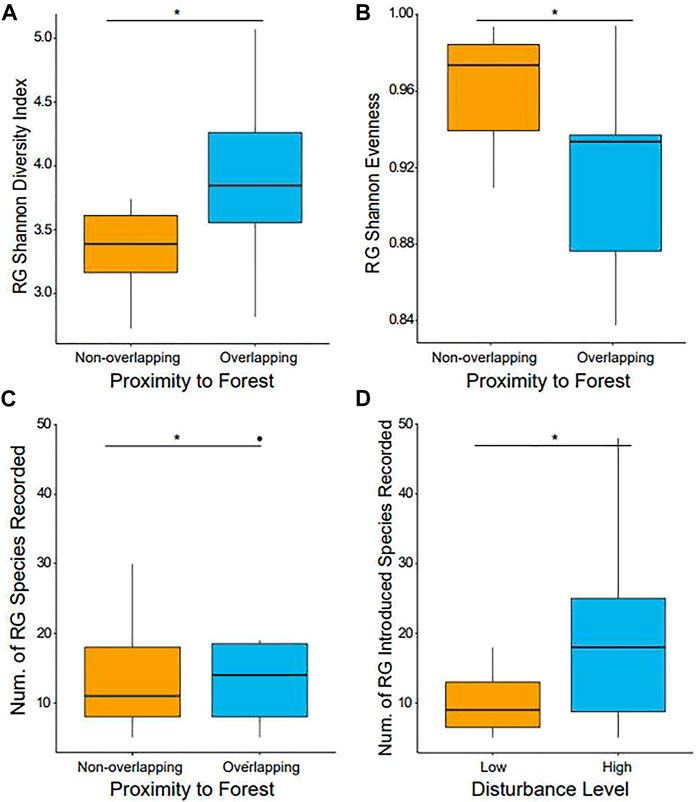
FIGURE 3. Comparison of diversity measures for sites with different land use characteristics. (A) Shannon diversity index of research grade observations, (B) evenness of research graph observations, (C) number of research grade species, and (D) number of research grade introduced species are shown.
The most predictive model for the number of species recorded as RG included only the relationship to forest, with more species seen in sites that included redwood forests (
Observer Effects on Project Outputs
To provide insight into how the structure of a project can shape the resulting data collection, we first present results on the effect of observer characteristics on the amount and type of data collected. Next, we present findings on the specific impact of conducting a BioBlitz on diversity detection and observations. Finally, we present results on the accumulation of species detection over sampling effort.
Education level alone was the best predictor for amounts of all types of data collected, excluding the number of introduced species recorded as RG, for which the number of observations alone was the best predictor. As education level increased, the number of total (
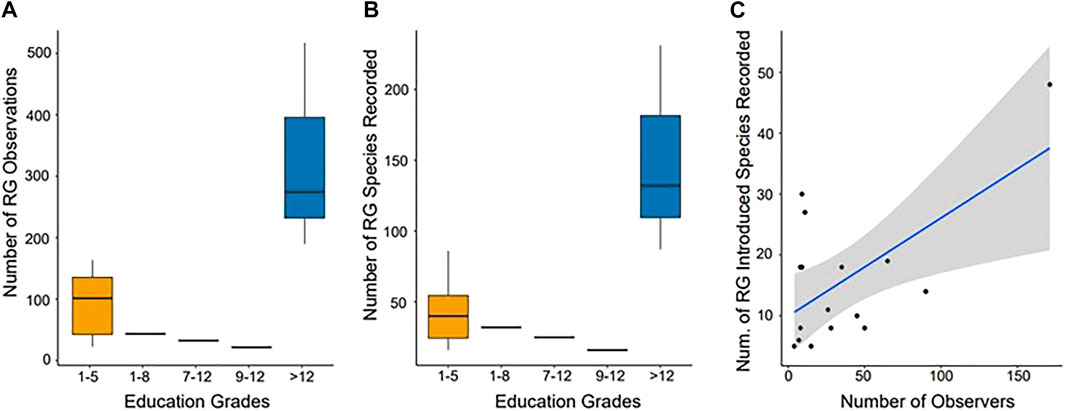
FIGURE 4. Observer characteristics influencing the amount of research grade data collected. The number of (A) observations and (B) species recorded as research grade were influenced by education level. The large contributions of college-level students (>12 education grades) were the primary driver of this relationship. (C) The number of introduced species recorded as research grade increased with the number of observers.
The effect of observer characteristics differed by taxa. We found that the percentage of RG observations that were of plants was significantly influenced by observer education level (
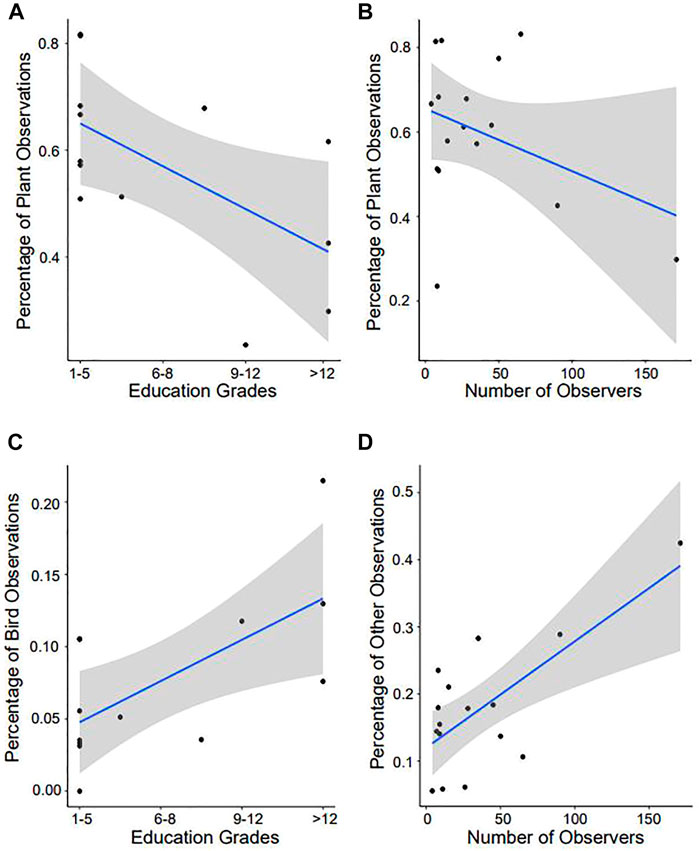
FIGURE 5. Observer characteristics shaping type of taxa data collected. Figures representing observer characteristics that significantly influenced the percentage of plants, birds, or other taxa are shown. The percentage of plant observations was significantly influenced by (A) increasing education level and (B) increasing numbers of observers. (C) Percentage of bird observations increased with education level, and (D) percentage of other observations increased with increasing numbers of observers. Regression lines show linear regressions with 95% confidence intervals.
A BioBlitz was performed at 55% of the sites. After removing outlier sites that had unusually high numbers of observations (one that did and one that did not perform a BioBlitz), we found that sites that performed a BioBlitz collected on average 285.8
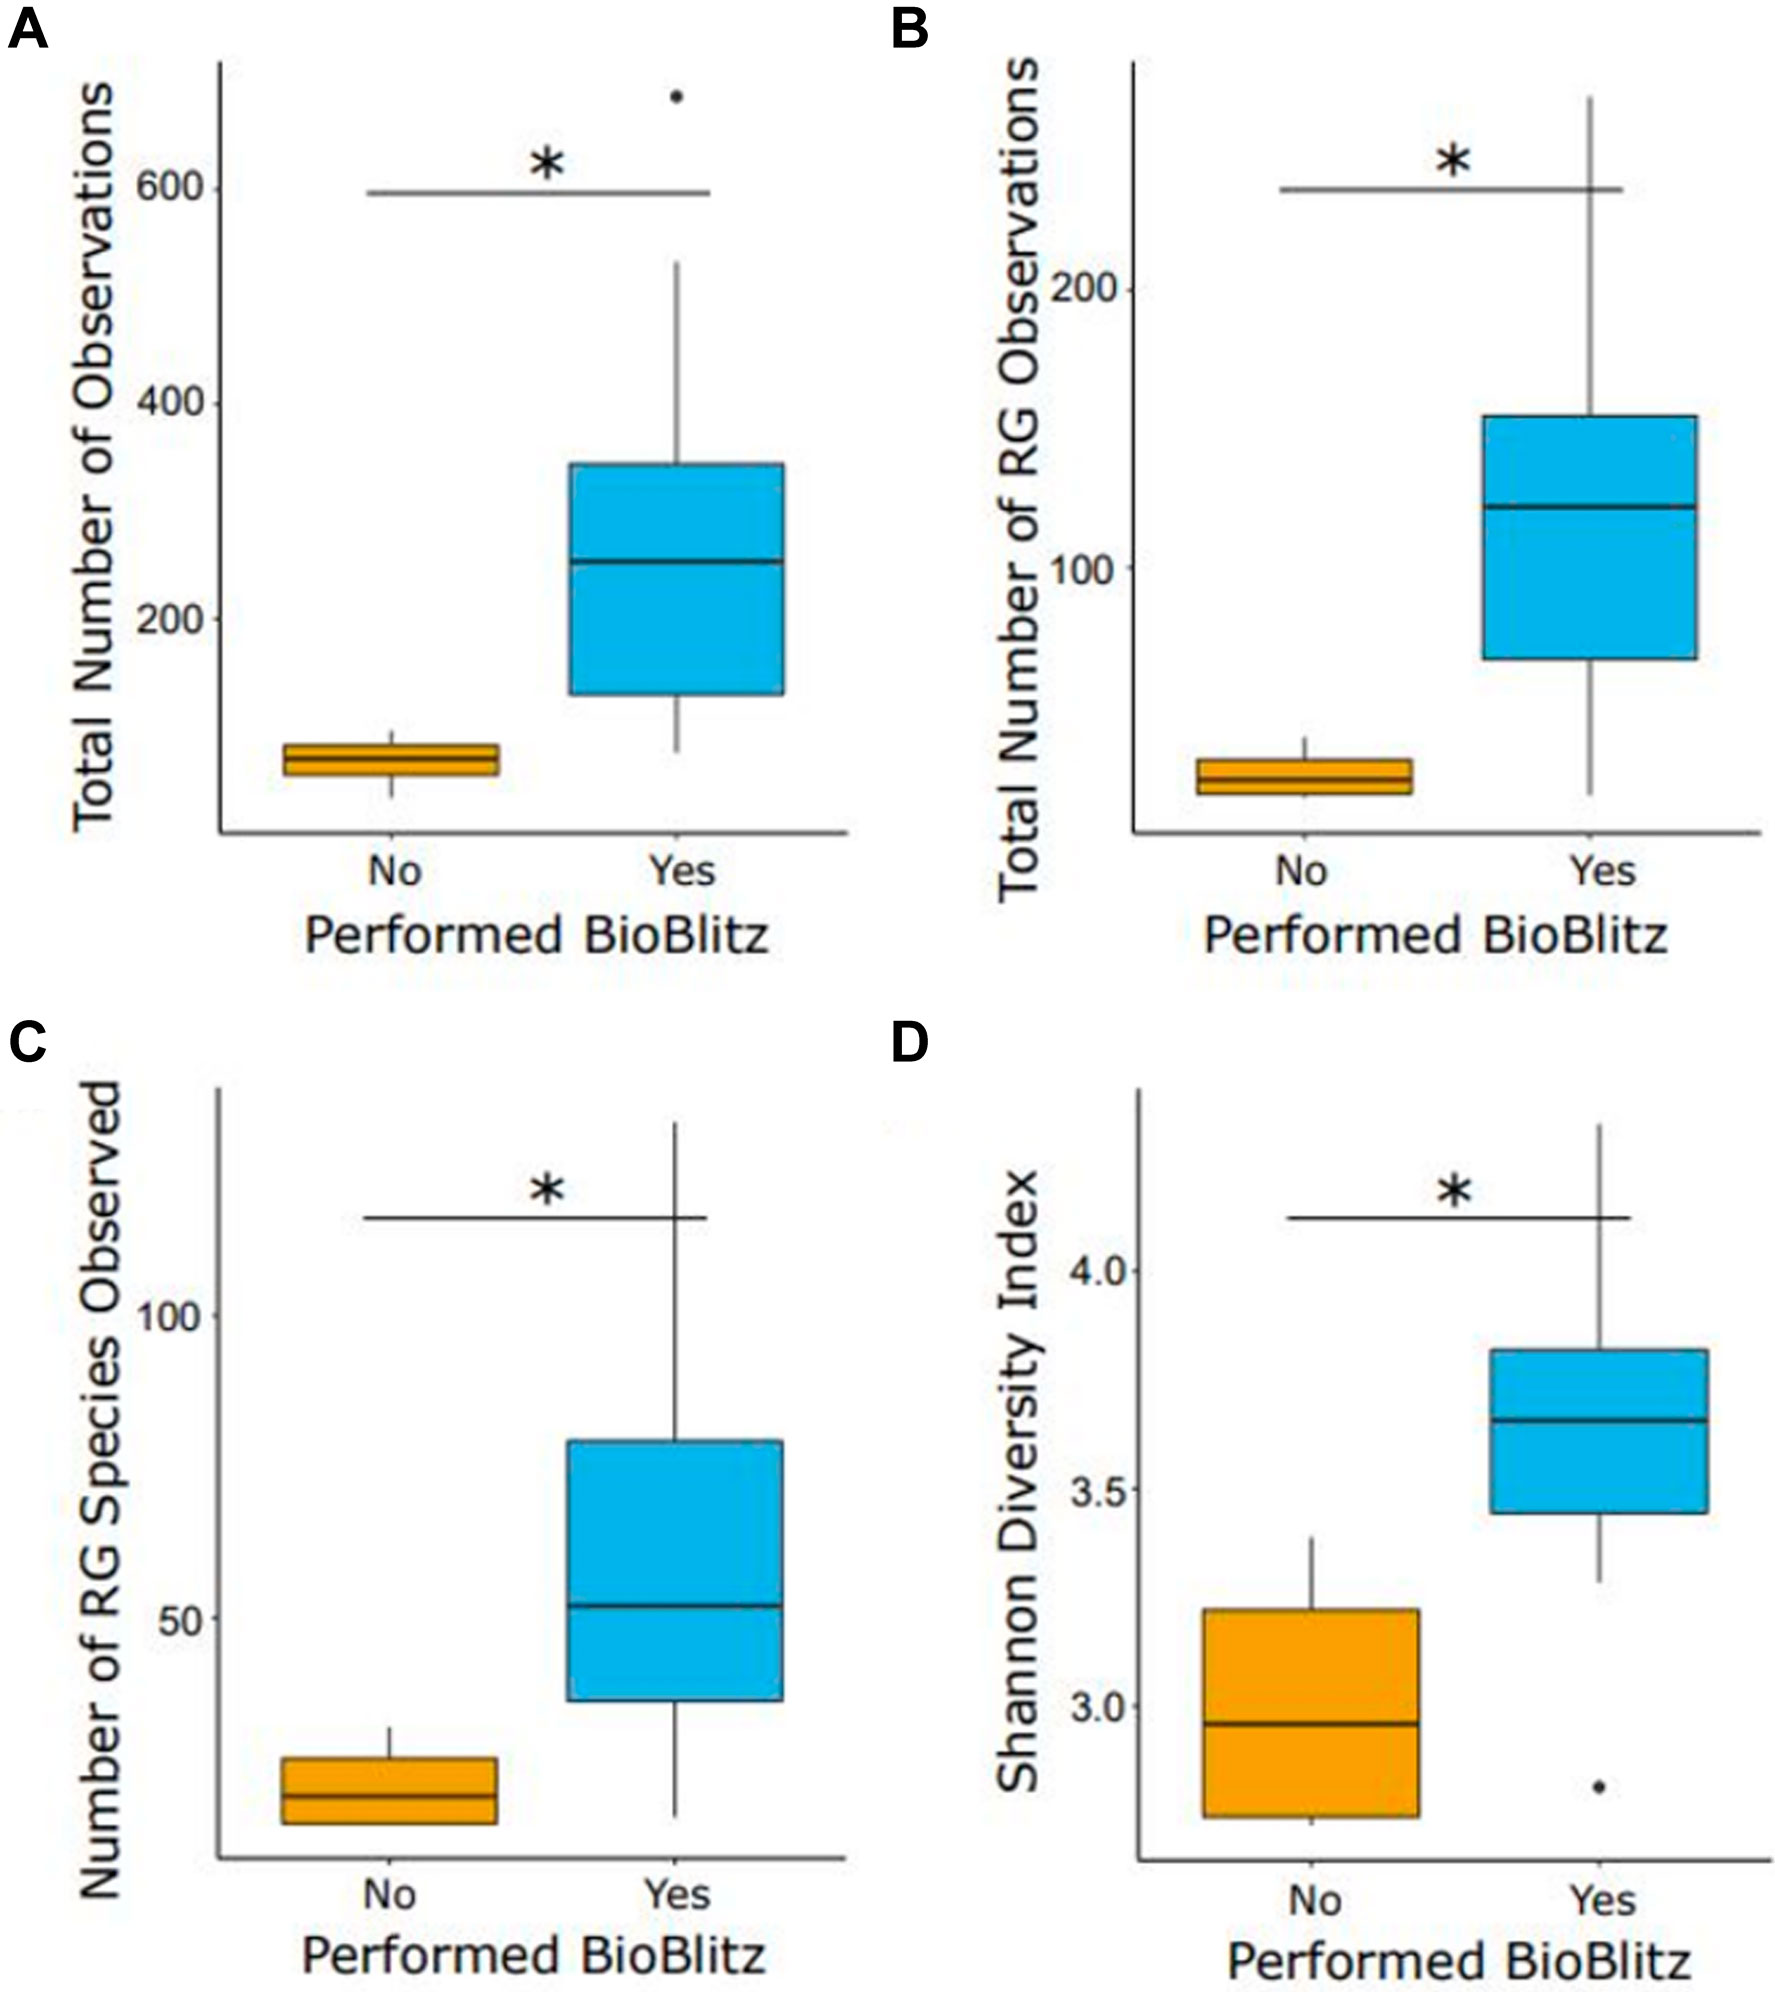
FIGURE 6. Effect of BioBlitz on amount of data and diversity recorded. Boxplots showing the (A) total number of observations, (B) number of Research Grade (RG) observations, (C) number of RG species detected, and (D) Shannon diversity index for sites that did or did not perform a BioBlitz are shown. Performing a BioBlitz increased the Shannon diversity recorded at sites. Significant differences are shown with an * representing p < 0.05.
Finally, our species accumulation curves suggest that the asymptote for the number of species detected was not reached in our study. When considering the continuous addition of more observers, sampling sites, or sampling months, the cumulative number of species detected continued to increase without clear signs of leveling off (Figure 7). Our data do not seem to indicate a duplication of effort among our sites and observers, and suggest additional observers, sites, and time are needed to identify all species present in Humboldt County.
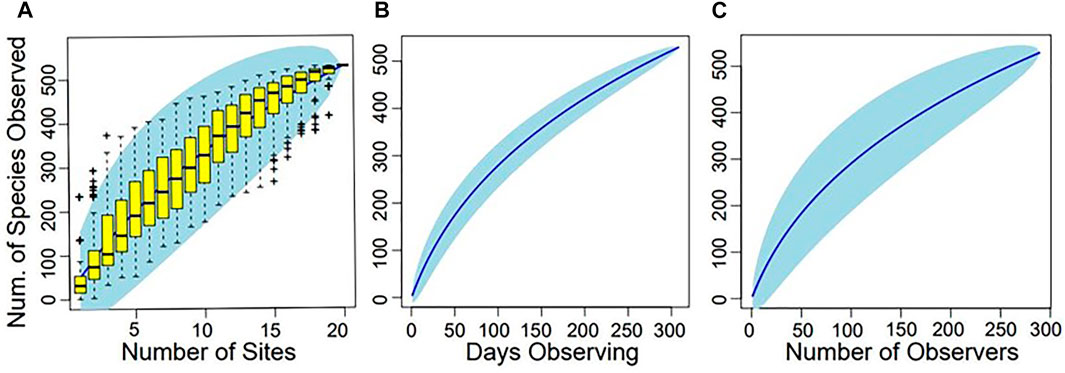
FIGURE 7. Species accumulation curves over increasing numbers of (A) sites, (B) observation days, and (C) observers. None of the curves appear to have reached an asymptote, indicating sampling efforts were not duplications and further effort is needed to capture the full number of species present in the Humboldt County area.
Discussion
The field of Translational Science Education (TSE) was recently proposed (Sutherland et al., 2019) to formalize the need for a legitimate experiential learning (in accordance with Next Generation Science Standards) that simultaneously benefits students and the scientific knowledge base by building on iterative, trusted two-way relationships between researchers and educators and thus “enhance scientific literacy and discovery alike”. Here we provide the first formal example of conducting TSE, focused on biodiversity surveys recorded in iNaturalist by students and teachers. Below we describe how this work applies to the six elements of TSE: decision-framing, collaboration, engagement, commitment, process, and communication.
Decision-Framing
Across the globe, environmental shifts are happening faster than they can be tracked by researchers, especially given limited science funding. This means that citizen science efforts are increasingly important for monitoring strategies. One of the primary goals of this TSE effort on the side of the researchers was to understand the effects of urbanization on species diversity in the coastal redwoods system. Specifically, the Tiny North Coast Places project tested predictions related to the coast redwood study design while also suggesting areas for future research. Our project generated more than enough high-quality information to reach this goal and test the predictions. As expected, student observations showed higher native species diversity at sites near large forests and fewer introduced species in less disturbed areas (Figure 3). However, they also indicated more introduced species and lower evenness near large forests (Figure 3), suggesting future citizen science efforts could be conducted to investigate the complicated relationships between land use and species diversity in Humboldt County.
We also were able to reach our goal of understanding how the structure of our project would affect the amount and type of data generated. We found that the education level of the participants had a significant effect on the amount of data they collected (Figure 4), as well as the taxa they tended to photo-observe (Figure 5). In addition, sites which performed BioBlitzes collected significantly more data (Figure 6), suggesting that gamifying photo collection can lead to larger amounts of data. As the number of participants did not significantly differ between sites that did and did not hold a BioBlitz, these results suggest that BioBlitzes can generate a larger number of observations per participant. While we can only speculate, it is possible that this increase might be due to increased excitement or competition among participants, or because students had more time to take photo-observations than during a typical day. Regardless of whether a BioBlitz was performed, it is clear that species continued to accrue throughout 2018 for each location (Figure 7). Modeled estimates of how many more observations would be required to record all species in a year could help motivate participants to want to do more. Finally, some diligent observers in the community even expanded the iNaturalist range map for a few species when they collected “first” photo-observations for Humboldt County, before, during, and after 2018 (e.g.,Common Shiny Woodlouse (Oniscus asellus; RG), Granulated Ground Beetle (Carabus granulatus; RG), Collared False Darkling Beetle (Phryganophilus collaris; RG)). While it is too early to know whether these previously unknown range occurrences are a result of climate change or something else, it is certainly true that they would not have been formally documented without the participation of our newly established TSE naturalists.
In terms of project impact on learning, we did not collect quantitative information on how well educator goals were met. While educators were active participants in this project, no quantitative metrics by which they could measure student engagement or learning throughout the project were collaboratively established. Qualitatively, educators at the Sequoia Park Zoo reported observing enthusiasm in student participants during organized BioBlitzes, as well as increased practices of environmental stewardship over the course of the day for students visiting on field trips (e.g. returning animals to where they were found after photo-observing them, keeping flowers attached to the living plant to minimize impact while taking photo-observations).
Collaboration
Starting with one small group in 2017 (Kindergarten through 5th grade students ranging in age from 4 to 11 years old) at Arcata Elementary School, this project quickly developed into a large collaboration of over 700 observers and 438 identifiers in 3 years among 19 different North Coast locations (Table 1). By coordinating directly with teachers and staff to create gamified BioBlitzes within this large community, this project was able to generate even more valuable data on species diversity than if the BioBlitzes were never implemented (Figure 6). In addition, all educators had access to the community-wide umbrella project on iNaturalist, allowing them to show students the results of their classes’ contributions in the context of the entire project. Throughout the project, we observed that the relationships between the researchers, the educators, and the parent volunteers were key to sparking enthusiasm and reinforcing participation, especially when the observations were identified quickly and the students were allowed to review their observations online. We anticipate that this interactive TSE effort will continue to reinforce itself and grow as the word spreads that citizen science is an effective way to monitor, and therefore conserve, our coastal redwood ecosystem species.
Engagement
This project engaged TSE participants by trying to show them the fun in finding and photo-observing the living creatures in their own environments, gamifying biodiversity surveying much like a Pokemon Go game but with real conservation implications (Dorward et al., 2016). Armed with smartphone technology, these citizen scientists practiced connecting with, learning about, and sharing the nature around them, which seemed to make them feel included in the scientific process. As anyone with access to a smartphone can take photo-observations while out in nature, TSE presents opportunities to engage communities and students that are historically disengaged from nature as well as opportunities to connect with nature regardless of where one lives. The result was the enthusiastic collection of 5,306 research grade observations representing over 529 species, monitoring roughly 21% of the known (and some unknown) species ever observed in Humboldt County (Figure 7). Students were shown the results of their engagement throughout the project, with teachers sharing which teams had found the most species and which species were observed the most throughout the project. On days when a BioBlitz was conducted, students got to see the results of their friendly competition on the same day.
Commitment
Finding the champions from each school and non-profit location to commit to the project was one of the great successes of the Tiny North Coast Places project (see acknowledgements). Now, because of this work, there is a small, activated, Humboldt County TSE effort that is available to help plan, coordinate, and curate future iNaturalist based BioBlitz and Collection Projects. There are already signs of further community commitment to the project, including requests by schools for more iNaturalist adventures (e.g., Jacoby Creek School, Fuente Nueva School, Humboldt State University) and well-attended presentations that took place in the summer and fall of 2019 (SHIFT teachers’ workshop July 2019, zoo conservation lecture November 2019).
Process
Starting this TSE effort took time and dedication as the participants slowly became aware of the potential of the iNaturalist platform. Over time, they gradually realized how effective a tool it could be for linking education, science, and community. Teachers were initially introduced to iNaturalist during a January 2018 STEAM conference presentation. By showing them how using the platform was essentially an enjoyable shortcut toward fulfilling grade level appropriate NGSS/STEAM and physical fitness standards, that presentation generated the interest and participation of teachers and students from over 16 schools across Humboldt and Siskiyou Counties. The successful evolution of this process meant that, in the end, there was more buy-in from participants and with enough data to show scientific results, we now have a small TSE effort that could potentially lead to a tipping-point toward a truly integrated culture of conservation-oriented citizen scientists in Humboldt County.
Communication
Communication was a challenge but also a strength of the Tiny North Coast Places project. The use of a well-established, 10-year-old citizen science platform to share data and ask questions of each other greatly supported outcomes. Within the iNaturalist platform, not only do the observers contribute to science and inform the community of what would otherwise be unknown to science, but there is also a social media element allowing educators and supervised students to question scientists, naturalists, and other collaborators about the species and data that they are photo-collecting.
One of the challenges was in successfully communicating the strength and value of this particular platform to new users who were unfamiliar with both natural history and citizen science, especially in a technology-saturated learning environment. Further, it will be both interesting and challenging to assess whether the 700+ newly recruited iNaturalist participants have enjoyed this particular citizen science process enough to remain engaged for the future. With this in mind and for broader outreach in Humboldt County, the results of this project were presented to 10 educators at a local Humboldt County educational conference in 2019 to further communicate the scientific and educational potential of networking through the iNaturalist platform.
Another challenge on the part of the researchers was communicating the goals of the project to students in an age-appropriate manner, and helping students draw connections between their photo-observations and the curriculum they were meant to learn. However, teachers involved in the Tiny North Coast Places project framed the data collection and analysis within the NGSS standards according to students’ grade levels. They were able to use crosscutting concepts to illustrate core ideas in the life sciences, linking the scientific practice of data collection to educational outcomes (e.g. NGSS standard 2-LS4-1: Make observations of plants and animals to compare the diversity of life in different habitats). They were also able to share the project results with their students in real time while the project was conducted as well as after the project finished, as all participating teachers have continued access to the entire Tiny North Coast Places umbrella project and its associated data on iNaturalist. The results shared here will also be provided to all of the participating educators, allowing them to show their students the scientific outcomes of their data collection efforts. The data and findings generated in this project could also be simplified and summarized into interactive lesson plans such as Data Nuggets, free classroom activities that give students practice using the scientific method with authentic datasets (Schultheis and Kjelvik 2015).
Conclusion and Next Steps
Throughout this 3-years TSE process, we gained some on-the-ground perspective on how to ensure success in future TSE citizen science efforts and on ways in which the structure of TSE efforts can shape the type of research data collected. We believe the general TSE building tips summarized in Box 1 will help.
Box 1 | Translational Science Education Tips.
• Engage early and often—From the beginning, it is vital to provide training to teachers who will be the primary people responsible for ensuring student engagement and success. Taking the time at the initiation of the project to explain how citizen science effort can fulfill NGSS science standards and how to collect high-quality data, as well as regular check-ins about the project, will ensure teacher buy-in and set up successful collaborations that can be maintained long-term.
• Make it fun—Utilizing gamified BioBlitz surveys can ensure student participation and highlight the fun that can be had with observing nature. Keeping the focus on the organisms, with technology only a useful tool, can ensure citizen science efforts are educational as well as fun.
• Have a goal—Setting individual goals for the project for all participants can ensure continued participation. Student-centric goals could be centered around identifying and learning about the life history of commonly photographed organisms, while researcher-centric goals could focus on collecting enough data to approach the asymptote in species accumulation curves such that almost all species in an area have been recorded.
• Use flexible and functional social media—Engaging with social media opportunities on iNaturalist and similar platforms provides another way for students and scientists to engage and share knowledge.
• Find a champion(s)—Finding an interested contact person at each location is vital to ensure citizen science efforts are sustainable and long-lasting. While this is made challenging due to staff and student turnover, finding even one champion can ensure projects continue multiple years.
• Target the data collection to the participants—Students of all ages were capable of photo-collecting research grade observations of a diverse range of species (Figure 5), but the age of the participants can determine the type of organisms that are photo-collected. In particular, younger students readily collected photos of plants and insects, but older students (high school and college-aged) were much more likely to record birds and other observations (Figure 6). Strategically choosing research questions and learning goals that take into account student age can ensure a successful collaboration.
In this TSE project it was outside the scope of our study to quantify the effects of the TSE framework on student learning. However, we encourage future researchers using a TSE framework to work collaboratively with educators to develop metrics to measure student learning and educators’ success from the beginning of the project. In addition, future studies could examine how relationships between scientists, educators, and students impact the participation and enthusiasm of those involved in TSE project. Another promising future direction resulting from this project is to investigate how gamifying citizen science, as we did here, shapes both long- and short-term appreciation of local biodiversity and conservation. Finally, we encourage future TSE efforts to put greater emphasis on studying not just the efficacy of TSE on student learning, but also how seeing the results of their efforts impacts student learning and interest in future citizen science efforts.
The Tiny North Coast Places project demonstrates one way to build on all the elements of TE (i.e., decision-framing, collaboration, engagement, commitment, process, and communication) to create a TSE effort with an extremely flexible, interactive and user-friendly, citizen science/crowdsourcing platform: iNaturalist. By creating gamified BioBlitz projects and one-year Collection Projects to generate baseline species lists for each Tiny North Coast Places polygon, this project shows that citizen scientists of all ages can have fun learning as they simultaneously generate scientifically sound phenological and range data for Coastal Redwood ecosystem species. Significantly, the data generated in the first 2 years showed some evidence of an urbanization gradient while also suggesting avenues of future research. Even more significantly, the citizen scientists who generated these data enjoyed being the experts in their own ecosystems, whether in a schoolyard or at the zoo. The Tiny North Coast Places project successfully encouraged budding naturalists to be the heroes in our ongoing, global conservation efforts by seeking those meaningful, one-on-one relationships with the in-situ organisms living around them. By continuing to optimize and broaden data collection by citizen scientists, the community can continue to generate observations valuable and informative to effective conservation actions.
Data Availability Statement
The datasets presented in this study can be found in online repositories. The names of the repository/repositories and accession number(s) can be found below: The data and code that support the findings of this study are openly available in Environmental Data Initiative at https://doi.org/10.6073/pasta/ead637f72df3efc6300d508840bdef7b. In addition, data deemed research-grade by iNaturalist that were used in this project can be found in GBIF form at https://doi.org/10.15468/ab3s5x.
Author Contributions
EV developed the project and led the data collection. CN served as an organizer and champion of the project at the Sequoia Park Zoo. TM and AG retrieved data from iNaturalist, while AG and AY analyzed the data. All authors contributed to the writing of the manuscript.
Funding
Funding for this project was provided by the Save the Redwoods League. AY was supported by a National Science Foundation Graduate Research Intership Program grant (DGE-1848739).
Author Disclaimer
Frontiers Media SA remains neutral with regard to jurisdictional claims in published maps and institutional affiliations. Any use of trade, firm, or product names is for descriptive purposes only and does not imply endorsement by the U.S. Government.
Conflict of Interest
The authors declare that the research was conducted in the absence of any commercial or financial relationships that could be construed as a potential conflict of interest.
Publisher’s Note
All claims expressed in this article are solely those of the authors and do not necessarily represent those of their affiliated organizations, or those of the publisher, the editors and the reviewers. Any product that may be evaluated in this article, or claim that may be made by its manufacturer, is not guaranteed or endorsed by the publisher.
Acknowledgments
Special thanks go to the dedicated citizen science champion and friend, the late David Schumaker. Other champions of this project include: Karlee Jewell, Maureen Jules, August Deshais, David Sloane, and Sue Moore. Thanks also to the Sequoia Park Zoo and Humboldt County schools and colleges for hosting this project, to the Save the Redwoods League for funding the project, and to iNaturalist for providing the digital platform and tech support that inspired the project. Thank you all for helping us develop a TSE iNaturalist community! Any use of trade, firm, or product names is for descriptive purposes only and does not imply endorsement by the U.S. Government.
Supplementary Material
The Supplementary Material for this article can be found online at: https://www.frontiersin.org/articles/10.3389/fenvs.2021.800433/full#supplementary-material
References
Aronson, M. F. J., La Sorte, F. A., Nilon, C. H., Katti, M., Goddard, M. A., Lepczyk, C. A., et al. (2014). A Global Analysis of the Impacts of Urbanization on Bird and Plant Diversity Reveals Key Anthropogenic Drivers. Proc. R. Soc. B. 281, 20133330. doi:10.1098/rspb.2013.3330
Au, W. (2007). High-stakes Testing and Curricular Control: A Qualitative Metasynthesis. Educ. Res. 36, 258–267. doi:10.3102/0013189x07306523
Baker, G. M., Duncan, N., Gostomski, T., Horner, M. A., and Manski, D. (2014). The Bioblitz: Good Science, Good Outreach, Good Fun. Park Sci. 31, 39–45.
Bell, S. (2010). Project-based Learning for the 21st century: Skills for the Future. The Clearing House: A J. Educ. Strateg. Issues Ideas 83, 39–43. doi:10.1080/00098650903505415
Bhattacharjee, Y. (2005). Citizen Scientists Supplement Work of Cornell Researchers. Science 308, 1402–1403. doi:10.1126/science.308.5727.1402
Bodmer, W. (2010). Public Understanding of Science: The BA, the Royal Society and COPUSNotes and Records. R. Soc. 64 (Suppl. l_1), S151–S161. doi:10.1098/rsnr.2010.0035
Bonney, R., Cooper, C. B., Dickinson, J., Kelling, S., Phillips, T., Rosenberg, K. V., et al. (2009). Citizen Science: a Developing Tool for Expanding Science Knowledge and Scientific Literacy. BioScience 59, 977–984. doi:10.1525/bio.2009.59.11.9
Bonney, R., Phillips, T. B., Ballard, H. L., and Enck, J. W. (2016). Can Citizen Science Enhance Public Understanding of Science? Public Underst Sci. 25, 2–16. doi:10.1177/0963662515607406
Bransford, J. D., Brown, A. L., and Cocking, R. R. (2000). How People Learn. Washington, DC, USA: National Academy Press.
Brewer, C. (2002). Outreach and Partnership Programs for Conservation Education where Endangered Species Conservation and Research Occur. Conservation Biol. 16, 4–6. doi:10.1046/j.1523-1739.2002.01613.x
Brunson, M. W., and Baker, M. A. (2016). Translational Training for Tomorrow's Environmental Scientists. J. Environ. Stud. Sci. 6, 295–299. doi:10.1007/s13412-015-0333-x
Bybee, R. W. (2013). The Next Generation Science Standards and the Life Sciences. Sci. Child. 50, 7.
Callaghan, C. T., and Gawlik, D. E. (2015). Efficacy of eBird Data as an Aid in Conservation Planning and Monitoring. J. Field Ornithol. 86, 298–304. doi:10.1111/jofo.12121
Crall, A. W., Jordan, R., Holfelder, K., Newman, G. J., Graham, J., and Waller, D. M. (2013). The Impacts of an Invasive Species Citizen Science Training Program on Participant Attitudes, Behavior, and Science Literacy. Public Underst Sci. 22, 745–764. doi:10.1177/0963662511434894
Darling-Hammond, L., Flook, L., Cook-Harvey, C., Barron, B., and Osher, D. (2020). Implications for Educational Practice of the Science of Learning and Development. Appl. Dev. Sci. 24, 97–140. doi:10.1080/10888691.2018.1537791
DeBoer, G. E. (2000). Scientific Literacy: Another Look at its Historical and Contemporary Meanings and its Relationship to Science Education Reform. J. Res. Sci. Teach. 37, 582–601. doi:10.1002/1098-2736(200008)37:6<582:aid-tea5>3.0.co;2-l
Dickinson, J. L., Shirk, J., Bonter, D., Bonney, R., Crain, R. L., Martin, J., et al. (2012). The Current State of Citizen Science as a Tool for Ecological Research and Public Engagement. Front. Ecol. Environ. 10, 291–297. doi:10.1890/110236
Dorward, L. J., Mittermeier, J. C., Sandbrook, C., and Spooner, F. (2016). Pokémon Go: Benefits, Costs, and Lessons for the Conservation Movement. Conservation Lett. 10, 160–165. doi:10.1111/conl.12326
Elmqvist, T., Zipperer, W., and Güneralp, B. (20162016). “Urbanization, Habitat Loss, Biodiversity Decline: Solution Pathways to Break the Cycle,” in Routledge Handbook of Urbanization and Global Environmental Change. Editors Karen Seta, William D. Solecki, and Corrie A. Griffith (London and New York: Routledge.), 139–151.
Enquist, C. A., Jackson, S. T., Garfin, G. M., Davis, F. W., Gerber, L. R., Littell, J. A., et al. (2017). Foundations of Translational Ecology. Front. Ecol. Environ. 15, 541–550. doi:10.1002/fee.1733
Grolemund, G., and Wickham, H. (2011). Dates and Times Made Easy with Lubridate. J. Stat. Softw. 40, 1–25. Available at: : https://www.jstatsoft.org/v40/i03/.doi:10.18637/jss.v040.i03
Hallett, L. M., Morelli, T. L., Gerber, L. R., Moritz, M. A., Schwartz, M. W., Stephenson, N. L., et al. (2017). Navigating Translational Ecology: Creating Opportunities for Scientist Participation. Front. Ecol. Environ. 15, 578–586. doi:10.1002/fee.1734
Hochmair, H. H., Scheffrahn, R. H., Basille, M., and Boone, M. (2020). Evaluating the Data Quality of iNaturalist Termite Records. Plos one 15, e0226534. doi:10.1371/journal.pone.0226534
Hunter, J., Alabri, A., and Ingen, C. (2013). Assessing the Quality and Trustworthiness of Citizen Science Data. Concurrency Computat.: Pract. Exper. 25, 454–466. doi:10.1002/cpe.2923
Kalinowski, R. S., and Johnson, M. D. (2010). Influence of Suburban Habitat on a Wintering Bird Community in Coastal Northern California. Condor 112, 274–282. doi:10.1525/cond.2010.090037
Lawson, D. M., Hall, K. R., Yung, L., and Enquist, C. A. (2017). Building Translational Ecology Communities of Practice: Insights from the Field. Front. Ecol. Environ. 15, 569–577. doi:10.1002/fee.1736
Lombardi, M. M. (2007). Authentic Learning for the 21st century: An Overview. Educause Learn. Init. 1, 1–12.
Lundmark, C. (2003). BioBlitz: Getting into Backyard Biodiversity. BioScience 53, 329. doi:10.1641/0006-3568(2003)053[0329:bgibb]2.0.co;2
McDonald, S., and Songer, N. B. (2008). Enacting Classroom Inquiry: Theorizing Teachers' Conceptions of Science Teaching. Sci. Ed. 92, 973–993. doi:10.1002/sce.20293
McKinley, D. C., Miller-Rushing, A. J., Ballard, H. L., Bonney, R., Brown, H., Cook-Patton, S. C., et al. (2017). Citizen Science Can Improve Conservation Science, Natural Resource Management, and Environmental protection. Biol. Conservation 208, 15–28. doi:10.1016/j.biocon.2016.05.015
Michael, J. A., and Modell, H. I. (2003). Active Learning in Secondary and College Science Classrooms: A Working Model for Helping the Learner to Learn. New York: Routledge.
National Research Council (NRC). (2012). A Framework for K-12 Science Education: Practices, Crosscutting Concepts, and Core Ideas. Washington, DC: National Academies Press.
Noss, R. F. (1999). The Redwood forest: History, Ecology, and Conservation of the Coast Redwoods. Washington, DC: Island Press.
O'Keeffe, L. (2019). Power of Observation: iNaturalist Creator Ken-Ichi Ueda on the Realities of Digital Science. Flora 2, 12–15.
Oksanen, J., Blanchet, F. G., Friendly, M., Kindt, R., Legendre, P., McGlinn, D., et al. (2019). Vegan: Community Ecology Package. R Package Version 2.5-6. Available at: https://CRAN.R-project.org/package=vegan.
Piano, E., Souffreau, C., Merckx, T., Baardsen, L. F., Backeljau, T., Bonte, D., et al. (2020). Urbanization Drives Cross‐taxon Declines in Abundance and Diversity at Multiple Spatial Scales. Glob. Change Biol. 26, 1196–1211. doi:10.1111/gcb.14934
R Core Team (2016). R: A Language and Environment for Statistical Computing. Vienna, Austria: R Foundation for Statistical Computing.
Schultheis, E. H., and Kjelvik, M. K. (2015). Data Nuggets. Am. Biol. Teach. 77, 19–29. doi:10.1525/abt.2015.77.1.4
Shafer, C. L. (1997). Conservation in Highly Fragmented Landscapes. New York: Springer Science and Business Media.
Silvertown, J. (2009). A New Dawn for Citizen Science. Trends Ecol. Evol. 24, 467–471. doi:10.1016/j.tree.2009.03.017
Sutherland, C., Padilla, B., and Grant, E. (2019). Principles of Translational Science Education. Front. Ecol. Environ. 17, 82–84. doi:10.1002/fee.2007
Theobald, E. J., Ettinger, A. K., Burgess, H. K., DeBey, L. B., Schmidt, N. R., Froehlich, H. E., et al. (2015). Global Change and Local Solutions: Tapping the Unrealized Potential of Citizen Science for Biodiversity Research. Biol. Conservation 181, 236–244. doi:10.1016/j.biocon.2014.10.021
Toomey, A. H., and Domroese, M. C. (2013). Can Citizen Science lead to Positive Conservation Attitudes and Behaviors? Hum. Ecol. Rev. 20, 50–62.
Ueda, K. (2021). iNaturalist Research-Grade Observations. iNaturalist.org. Occurrence Dataset. doi:10.15468/ab3s5x
van der Velde, T., Milton, D. A., Lawson, T. J., Wilcox, C., Lansdell, M., Davis, G., et al. (2017). Comparison of marine Debris Data Collected by Researchers and Citizen Scientists: Is Citizen Science Data worth the Effort? Biol. Conservation 208, 127–138. doi:10.1016/j.biocon.2016.05.025
Venables, W. N., and Ripley, B. D. (2002). Modern Applied Statistics with S. Fourth Edition. New York: Springer.
Welsh, H. H., and Hodgson, G. R. (2013). Woodland Salamanders as Metrics of forest Ecosystem Recovery: a Case Study from California's Redwoods. Ecosphere 4, 1–25. doi:10.1890/es12-00400.1
Wilson, A., Bacher, K., Breckheimer, I., Lundquist, J., Rochefort, R., Theobald, E., et al. (2017). Monitoring Wildflower Phenology Using Traditional Science, Citizen Science, and Crowd Sourcing. Park Sci. 33, 17–26.
Keywords: Translational ecology, biodiversity, urbanization, citizen science, invasive species
Citation: Young AM, van Mantgem EF, Garretson A, Noel C and Morelli TL (2021) Translational Science Education Through Citizen Science. Front. Environ. Sci. 9:800433. doi: 10.3389/fenvs.2021.800433
Received: 23 October 2021; Accepted: 19 November 2021;
Published: 14 December 2021.
Edited by:
Reuven Yosef, Ben-Gurion University of the Negev, IsraelReviewed by:
Piotr Zduniak, Adam Mickiewicz University, PolandJakub Kosicki, Adam Mickiewicz University, Poland
Copyright © 2021 Young, van Mantgem, Garretson, Noel and Morelli. This is an open-access article distributed under the terms of the Creative Commons Attribution License (CC BY). The use, distribution or reproduction in other forums is permitted, provided the original author(s) and the copyright owner(s) are credited and that the original publication in this journal is cited, in accordance with accepted academic practice. No use, distribution or reproduction is permitted which does not comply with these terms.
*Correspondence: Allison M. Young, eW91bmdhNDZAbXN1LmVkdQ==