 Tianyun Xiao1
 Akhtar Malik Muhammad
 Zhonghua Tang
- 1School of Environmental Studies, China University of Geosciences, Wuhan, Hubei, China
- 2Department of Environmental Science, Faculty of Life Sciences and Informatics, Balochistan University of Information Technology, Engineering and Management Sciences, Quetta, Pakistan
- 3Wuhan Center, China Geological Survey, Wuhan, Hubei, China
Arsenic is considered a poison because of its seriously toxic effects on the human body; elevated concentrations of arsenic in drinking water have been reported in different parts of the world. Investigating the arsenic distributions in soil, surface water (SW), and groundwater (GW) is an interesting topic of research, along with probing its correlations with local factors of the ecosystem and other hydrogeochemical parameters. This study mainly aims to investigate the impacts of various factors on elevated arsenic concentrations in water and soil. The following factors are assessed for their relationship to the propagation of arsenic in Jianghan Plain, which is the study area: population density, pumping rate, rain, land use, surface elevation, water level, and heavy metal contamination. The arsenic contamination potential prediction map and categories were developed using GIS-based techniques, such as ordinary kriging and quantile methods. Then, the “raster calculator” tool was applied to verify the impacts of the abovementioned factors on arsenic concentration. Eighty-four single-factor, bi-factor, and multi-factor models were established to investigate the effective combinations among the factors. Land use and pumping rate were identified from the soil through an equal frequency tool, whereas water population density and pumping rate were obtained with high matching percentages. The arsenic concentrations varied in the ranges of 0.0001–0.1582 mg/L in GW, 0.0003–0.05926 mg/L in SW, and 1.820–46.620 mg/kg in soil sediment. The single factors showed the best equal frequency of arsenic concentration in water for population density (68.62%) and in soil for land use (65.57%) and pumping (63.66%). Statistical calculations with percentage frequency factors also depicted a positive trend. Arsenic was reported to have high correlations with Fe in GW (r2 = 0.4193), with EC in SW (r2 = 0.4817), and with Cu in soil (r2 = 0.623). It is observed that the alkaline behaviors of water bodies are associated with arsenic mobility. Elevated arsenic values were observed in grids along surface flows with high anthropogenic activities and urbanization. Additionally, low concentrations of Fe depicted reduced activities in aquifer systems. Filtering drinking water as well as controlling the suspected sources and factors affecting concentrations of arsenic in the three phases are options for reducing the health risks of the local populations.
1 Introduction
Natural and anthropogenic factors are potential sources of propagation and elevation of various pollutants in water (Singh et al., 2020) and soil (Akhtar et al., 2021). Globally, the water quality has declined rapidly, particularly in developing countries, owing to natural and anthropogenic processes (Muhammad. and Zhonghua, 2014; Akhter et al., 2021). The geochemical characteristics of groundwater (GW) are a result of the combined action of different factors. GW quality is linked to the local geological environment and hydro-meteorological conditions of an area, its GW recharge, flow and discharge, and human activities (Zhou et al., 2013). Arsenic and other pollutants have been reported to have high concentrations in soil in agricultural land in the last three decades (Gong et al., 2020).
Owing to rapid urbanization and industrialization, China is now facing great challenges with regard to heavy metal contamination, including Arsenic pollution in water and soil (China Environmental Monitoring Center 1990; Zhang et al., 2009; Cao et al., 2022). High arsenic concentrations have been reported in GW worldwide, including Bangladesh, India, Cambodia, Vietnam, Argentina, the United States, Chile, Pakistan, and China (Smedley and Kinniburgh 2002; Fendorf et al., 2010; Muhammad et al., 2016), and the most serious waterborne endemic arsenic poisonings were reported in Bangladesh, India, and China. Two major geoenvironmental factors favor the arsenic enrichment of GW: inland or enclosed basins with arid or semi-arid climates and strongly reducing alluvial aquifers. Both factors are associated with geologically young sediments in flat and low-lying areas where the GW flows are sluggish (Smedley and Kinniburgh, 2002; Muhammad et al., 2015). Consequently, high concentrations of arsenic are observed in regions near surface water (SW) bodies, such as rivers and lakes, in China (Wei et al., 2022).
The first case of arsenic poisoning in Jianghan Plain was reported from Shahu village in 2005. In May 2006, the Center for Endemic Disease Control of Xiantao and Hubei Province investigated 19 towns in Xiantao to assess the distribution of endemic arsenic poisoning, where about 60% of the 2538 km2 farmlands have fertile alluvial–lacustrine sediments deposited by rivers and lakes. The popular local crops are rice, rapeseed, cotton, and vegetables, and about 24% of the land is in the form of ponds for aquaculture (Duan et al., 2015). Investigations showed that 863 wells in 12 towns (179 villages) had arsenic levels exceeding the National Drinking Water Standard of 10 μg/L (Gan et al., 2014). Moreover, arsenic concentrations in some wells were 50 times higher than the standard. Such elevated arsenic levels in the GW, SW, and soil of Jianghan Plain deteriorate the drinking water, food supplies, and wetland ecosystems (Wang et al., 2021).
The distribution and accumulation mechanisms of high arsenic levels in the GW, SW, and soil in Jianghan Plain are still unknown, and the sources of arsenic are not well understood. Differences in the climate, geological background, and anthropogenic activities affect the investigation of high arsenic levels in the GW in Jianghan Plain compared to that in northern China (Yu et al., 2022). Jianghan Plain is composed of Quaternary sediments deposited by the Yangtze River from the Himalayan Mountains. Accordingly, the occurrence of arsenic in the alluvial aquifer may be related to similar cases of arsenic contamination in Bangladesh, Pakistan, India, Cambodia, and Vietnam (Deng et al., 2009; Muhammad et al., 2016).
The present work is a comprehensive study in the Jianghan Plain of China, which investigates various factors (GW level, population density, heavy metal contamination, pumping rate, land use, rain, and elevation) related to GW, SW, and soil contamination to assess the impacts of elevated arsenic concentrations. This study aims to identify the most influential factors for enhanced arsenic concentrations in water and soil in the Jianghan Plain of China through GIS applications and statistical methods. The findings of this work are expected to be useful for mitigating and controlling arsenic distribution as well as protecting the health of the local communities.
2 Study area
2.1 Location, climate, geology, and hydrogeology
Jianghan Plain is an alluvial plain formed by the Yangtze and Han rivers located in the Middle Reaches of the Yangtze River, which includes the central and southern regions of Hubei Province (Figure 1). The study area has a subtropical monsoonal climate, and the annual temperature ranges between 15 and 17 °C. The general climate is regarded to be warm and humid, with a high intensity of precipitation at Jianghan Plain. The average annual precipitation in the region is 1269 mm, and about 30%–50% of the precipitation occurs in summer. The value of the average annual evaporation is estimated to be 1200 mm. The nonfrost season is 200–290 days (Duan et al., 2015).
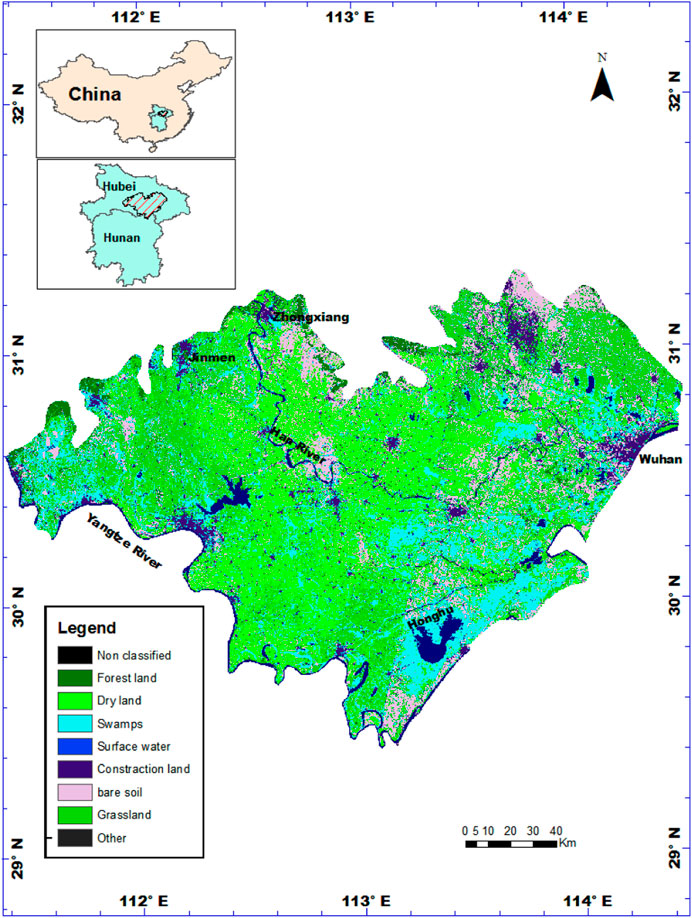
FIGURE 1. Location of the selected study area in Hubei province (Jianghan Plain).
Jianghan Plain is famous for its large farming areas of fish and rice in central China and has low and flat topographic characteristics owing to plenty of SW resources. The major area of the plain is between the Yangtze and Han rivers, so alluvial sediments constitute a large part of the plain (Li et al., 2009). The thickness of the layer of alluvial sediments varies by region; the average depth of this layer is 100–200 m at the center and 20–100 m in the outlying areas. Additionally, the local topography and hydrogeological characteristics are highly favorable for GW recharge. However, the surface elevation (SE) varies between 20 and 40 m (Gan et al., 2014).
2.2 Regional hydrogeological conditions
The lithology of Jianghan Plain is mainly Quaternary deposits. The hilly areas primarily consist of aquitard, while the center consists of unconsolidated water-bearing sediment layers. The shallower unconsolidated sediments (10–35 m thick) are mainly made of clayey silt, sandy silt, sandy clay, and interlaced clay lenses. The soil texture in the depth direction is mainly composed of sand and gravel. These aquitard and unconsolidated layers constitute a complete hydrogeological unit in this plain. The Quaternary unconsolidated sediments form porous media, while Pliocene clasolite forms the porous-fissure media for GW. The hydrogeological conditions differ owing to the varying aquifer distributions and water-bearing formations (Zhao et al., 2007; Muhammad et al., 2015).
The aquifer system can be subdivided into unconfined and confined aquifers based on the burial conditions. An unconfined aquifer is distributed in the shallower areas of the flat plain; its main composition includes clayey silt, sandy silt, sandy clay, and interlaced clay lenses from the Holocene and upper Pleistocene of the Quaternary. The thickness of the aquifer is 3–10 m, with a recharge rate of 43–302 m3/dm. The depth of the GW level is about 0.5–2.0 m (Gan et al., 2014; Duan et al., 2015). Jianghan Plain has two kinds of confined aquifers: confined aquifers in the Quaternary sediments as well as porous-fissured media of the Pliocene and lower Pleistocene sediments. The former is mainly distributed in the lower plain and anterior borders of the hilly areas, which consist of sand and sandy gravel. The thickness varies greatly at different regions, from about 100 m at the thickest and 30–50 m on average. The overlain clay is 5–25 m thick, creating the aquifuge. The hydraulic head is 16–40 m at sea level, and the recharge rate varies from 60 to 454 m3/dm. Confined aquifers in porous-fissured media of the Pliocene and lower Pleistocene sediments occur in the hilly areas; such aquifers are composed of sandy gravel, sandstone, conglomerate, and mudstone, with a recharge rate of 26–156 m3/dm. The hydraulic head is much higher than that of the formerly confined aquifer and may be higher than ground level during the monsoon period. The results of sediment boring core samples collected in the central region of Jianghan Plain (112°59′E, 30°02′N) indicate that the main heavy minerals of the upper sediments (0–100 m) are enriched with Fe and Mn, such as epidote, hornblende, pyroxene, garnet, hematite, limonite, ilmenite, magnetite, and iron-stained rock debris (Kang et al., 2009). The highest Mn concentration observed in the Jianghan Plain sediments was 914 mg/kg (Tang et al., 2020). In addition, many organic materials have been reported in the sediments (Zheng et al., 2004).
3 Data collection and methodology
3.1 Groundwater, surface water, and soil sampling
For a recent project, 300 samples of GW (from hand-pumped and motor-pumped wells), 125 samples of SW (from rivers and lakes), and 75 samples of soil from Changde, Yiyang, Yueyang, Changsha, and Jingzhou were collected. The sampling points covered the entire study area. The samplings were conducted from 2016 to 2018. Four 50-mL high-density polyethylene bottles were used for each water sample that was filtered onsite (using 0.45-μm membrane filters). The GW samples were collected after 5–10 min of pumping until the physical parameters were stable. For the total dissolved As analysis, hydrochloric acid was used to acidify one bottle wrapped with tinfoil; a second bottle was acidified using ultrapure HNO3 (pH ≤ 2) for chemical analysis of the dissolved ions and trace elements, and the remaining two bottles were used as is for analysis of anions and H/O isotopes. All samples were stored at 4 °C immediately after collection till the analyses were conducted. The soil samples were collected from a depth of 20 cm from a boring core and capped with polytetrafluoroethylene lids, following which they were stored at 4 °C in an opaque anerobic box.
3.2 Analytical methods for the waters
The temperature, dissolved oxygen (DO), pH, and electrical conductivity (EC) were measured at the sampling sites using a portable device (HQ40D Field Case, cat. No: 58258-00, HACH, Colorado, United States). The portable gel-filled ORP probe (MTC10103, HACH) was used to measure the activity of electrons. The total concentrations of dissolved ions (Mg and Fe) were determined using an inductively coupled plasma atomic emission spectrometer (ICP-AES) (Thermo Electron ICP-OES spectrometer IRIS Intrepid II XSP, United States). Inductively coupled plasma mass spectrometry (ICP-MS) (Perkin Elmer, ELAN 9000/DRC-e) was used to examine the trace elements. Verifications of the major elements analyzed by ICP-AES and ICP-MS were found to have accuracies within 4% and 5%, respectively. Anions (NO3− and SO42−) were measured using an ion chromatograph (Dionex 2500, United States), with an analytical precision within 5%. The total organic carbon analyzer (multi N/C 3100, Germany) was used to measure dissolved organic carbon (DOC), whose detected value was 0.004 mg/L with a precision of ±8%. The total amounts of GW and SW were measured using a hydride generation atomic fluorescence spectrometer (HG-AFS, 930, Titan, China).
3.3 Soil analysis method
To measure the mineralogical compositions of the soil samples, an automated powder X-ray diffractometer (Cu–Kα radiation with a graphite monochromator; X’Pert PRO DY2198, PANalytical) was used with a detection limit of 2%. The chemical components were determined by X-ray fluorescence spectroscopy (XFS; Spectro Xepos HE XRF Spectrometer), and the remaining chemical analyses were conducted at the State Key Laboratory of Biogeology and Environmental Geology and State Key Laboratory of Geological Processes and Mineral Resources, China University of Geosciences, Wuhan, China.
3.4 GIS model development
The topographical map of the study area (1:50,000) was used to create a thematic map containing comprehensive information about the boundaries and land use, as shown in Figure 1. The simple kriging method was used with the ArcGIS10.3 Geostatistical Analyst toolbar to develop arsenic distribution zones in the GW, SW, and soil. To design the distribution map, the 2016 arsenic concentrations were categorized into five levels using the quantile method, as shown in Figure 2. The quantile method estimates the data of different factors, such as rain (Ringard et al., 2017), contamination parameters, and elevation. Then, six different factors were tested to examine their influences on the arsenic concentration levels in the GW, SW, and soil.
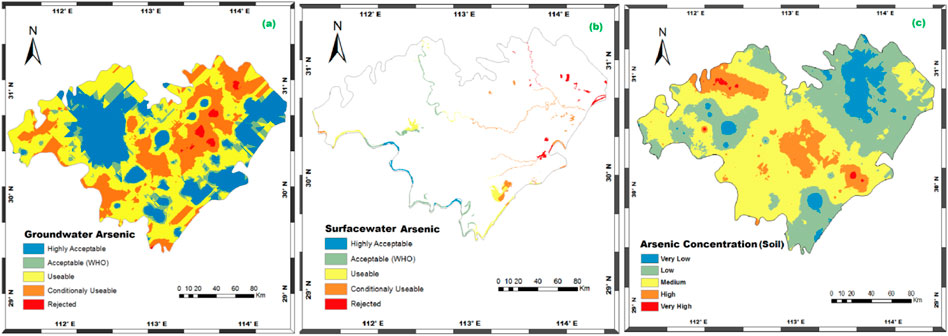
FIGURE 2. Arsenic distributions in the (A) groundwater (GW), (B) surface water (SW), and (C) soil in Jianghan Plain.
The simple kriging method was used to create the GW level, pumping rate, population density, heavy metal contamination, and rain zones for the study area. The rainfall data of 90 meteorological stations (for the year 2016) were downloaded from the Hydrology and Water Resources Survey website of Hunan Province. A heavy metal concentration distribution map was developed based on the data available in a report titled “the ecological geochemical assessment report of Dongting Lake in Hunan Province” published by the Geological Research Institute of Hunan Province (Fang et al., 2021). Landsat 8 images were used to create the supervised land use classifications for the study area in the Environment for Visualizing Images (ENVI) software environment developed by L3Harris Geospatial, United States. Seven major categories (woodland, dryland, paddy field, SW, construction area, bare land, and green land) were used to understand the real local land use. The SE often controls water flow and affects the probability of water infiltration. The ASTER digital elevation model (DEM) was used to create a contour map of the study area using 3D analyst tools in ArcGIS.
The final maps of the factors were classified into five groups according to the quantile method using the reclassify tool included in the spatial analysis toolset. The “raster calculator” tool was then used to evaluate the factors affecting the intensities of arsenic distribution in the water and soil. All digitalized maps of the employed factors were converted to shape files and layers in ArcGIS. Raster calculator is designed to execute single-line algebraic expressions, while simple and complex algebraic maps are employed using the button-like calculator tool interface. Eighty-four different models were developed using the raster calculator; these models were built by combining different factors to determine the most effective combination. Single-factor and multifactor models were carefully established by assigning coefficients 1 to 6 as the rank because each model contains unique values. Then, the quantile method included in the reclassify tool was repeated for each model to categorize the results into the five groups. The “equal to frequency” tool was used to evaluate the models based on cell-by-cell matching with the arsenic concentration model to select the best frequency match models. Additionally, the “band collection statistic” tool was applied to compute the frequency range to obtain statistical results from a multivariate analysis of a set of raster bands. Finally, the frequency range was counted for the matched and unmatched cases.
4 Results and discussion
4.1 Arsenic levels in soil, surface water, and groundwater
Chemical analyses of the GW samples showed arsenic concentrations in the range of 0.0001–0.1582 mg/L. Figure 2A shows the spatial arsenic distribution in GW and indicates the mix in the entire study area; however, the east–west and northwest areas contained low levels while the central region in the northeast showed the most elevated levels of As (according to WHO and Chinese standards). Elevated arsenic in the GW has been observed in the northwest region of China (He et al., 2020). A study of shallow GW in Jianghan showed arsenic concentrations in the range of 0.02–0.13 mg/L. Gan et al. (2014) conducted a study to investigate arsenic levels in GW and reported that 87% of the samples exceeded the WHO and Chinese standards, with values ranging from 0.01 to 2.330 mg/L. Additionally, statistical tools showed a standard deviation of 0.0159, while Zhou et al. (2013) calculated a standard deviation of 0.02 in another study in the Jianghan Plain.
SW samples were collected from the rivers and lakes of Jianghan Plain, and chemical analysis showed both low (0.0003 mg/L) and high (0.5926 mg/L) concentrations of As. The major sources of SW pollution in China are untreated municipal, industrial, and agricultural effluents. The map developed for SW arsenic concentration depicted spatial variations; the eastern part of the study area showed elevated concentrations over 0.02 mg/L, whereas the water quality in the Yangtze River and lakes (Honghu and Changhu) were observed to be satisfactory (within the range of WHO and Chinese prescribed standards). Shao et al. (2006) observed that domestic sewage was the main cause of polluted lakes in China, while Gao and Mucci (2003) identified agricultural activities as the cause of watershed pollution. Previously, researchers have identified that the water quality of many SW resources in the form of lakes, rivers, and open water bodies in China are not good (Zhang, 2022). Figures 2A,B show similar arsenic concentrations for SW and GW, except along the southeast boundary. This significant resemblance in the spatial arsenic distribution was used to identify the SW impact on GW at Jianghan Plain. The higher concentrations of various pollutants in unsealed wells may be linked to anthropogenic pollution, oxidization in shallow aquifers, and interactions of the SW and GW (Gan et al., 2014; Yu et al., 2022).
Chemical analysis results of the soil samples showed significant variations in concentration between 1.820 and 46.620 mg/kg. Increasing human activities are regarded as the major causes of different air and soil pollutants, such as fossil-fuel combustion, agriculture, and industrialization. The observed values were much higher than the range measured in the present study. A suggested baseline of As concentration in soil is 5–10 mg/kg (Smedley and Kinniburgh, 2000), but Wang and Shpeyzer (2000) measured As range between 2.5 and 33.5 mg/kg in Chinese soil, where mountain soil (16 mg/kg) had a comparatively higher value than siallitic soil (4 mg/kg). Various types of soil in China were examined, where regosol and mountain soils had higher arsenic concentrations than unsaturated siallitic soils (He and Charlet, 2013). Contaminated soils affect the natural resources and human health, so this problem had garnered attention from researchers (Zhang et al., 2015). Elevated atmospheric arsenic levels slightly increased the soil content of arsenic (Gan et al., 2014; Yu et al., 2022) as China consumed an estimated 3.92 billion tons of coal in 2020 (Mengshu et al., 2021). Zhong et al. (2014) identified high As content in soil from agricultural activities, industrial SW flow (Guo et al., 2012), and urbanization (Zhao et al., 2007) in Jianghan Plain.
Relationships between arsenic distribution can be examined under three categories: spatial variance of the arsenic distribution has significant relationships in some parts of the study area. Inhomogeneities between the SW, GW, and soil may be attributed to variations in the compositions of the sediments, hydrogeological parameters, anthropogenic activities, and other factors. The interactions may have clear and complex pollutant transport concepts among the soil, SW, and aquifer interfaces. Comparing SW (Figure 2B) and soil (Figure 2C), a weak affiliation was detected in the eastern areas, whereas the western region showed the best correlation for low arsenic values. Owing to the direct interactions of the SW and soil particles, contaminant particle exchange is convenient between these phases. Normally, solid wastes and effluents are deposited in the soil or SW resources globally. Over 80% of China’s rivers have different levels of contamination (Deng et al., 2022), which directly impact the soil and sediments as well as indirectly impact the local GW systems. In addition, local anthropogenic factors affect the soil compositions in different parts of China.
The relationship between arsenic in water and soil showed a strong association in the central and some western parts, while several other wide regions showed negative relationships, the actual reasons being water level (WL) and recharge intensity, which are major interaction mechanisms. In Figure 3, the population classes show significant relationships with SW and GW, and the arsenic contamination levels in soil generally tend to increase with population density. In the fourth group, where the population density is in the range of 1051–5000, high arsenic values were observed in the soil (14.6717 mg/kg) and GW (0.207 mg/L), whereas the SW had a value of 0.0203 mg/L in the most populated area. The statistical analysis showed increasing pumping rates with elevated arsenic concentrations in the three media. Pumping rates over 0.7251 m3/s highly affected the soil and GW qualities, but the highest arsenic concentration of 0.0243 mg/L was observed when the pumping rate was between 0.5251 and 0.7250 m3/s. GW exploitation factors can also modify the recharge patterns, and rapid recharge is associated with soil and GW contamination in Jianghan Plain.
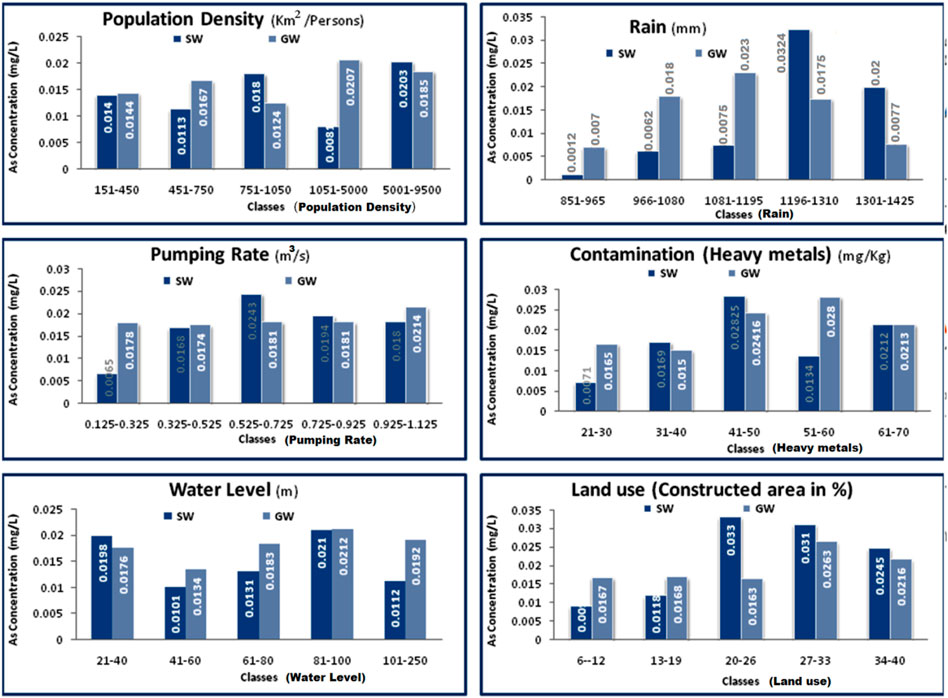
FIGURE 3. Factor classifications and average arsenic concentration of each class in water.
Among the five groups of WLs, high impacts of arsenic were observed for WLs that were 81–100 m from the surface in soil (16.2550 mg/kg), SW (0.0210 mg/L), and GW (0.0212 mg/L) (Figures 3, 4). The arsenic level in soil was affected by the WL depth, but both water media showed values in a mixed range. The highest correlation was observed between heavy metal contamination and GW quality. Figures 3, 4 show the heavy metal contamination to be in the range of 41–60 mg/kg, with the arsenic content in soil, GW, and SW having values of 14.83 mg/kg, 0.0280 mg/L, and 0.02825 mg/L, respectively. The arsenic concentrations in the five SE groups had mixed values; however, an elevation of over 81 m impacts GW (value range <0.0217 mg/L) and SW (value range <0.0210 mg/L) significantly. The main reason for this may be the soil structure composition may as well as GW flow.
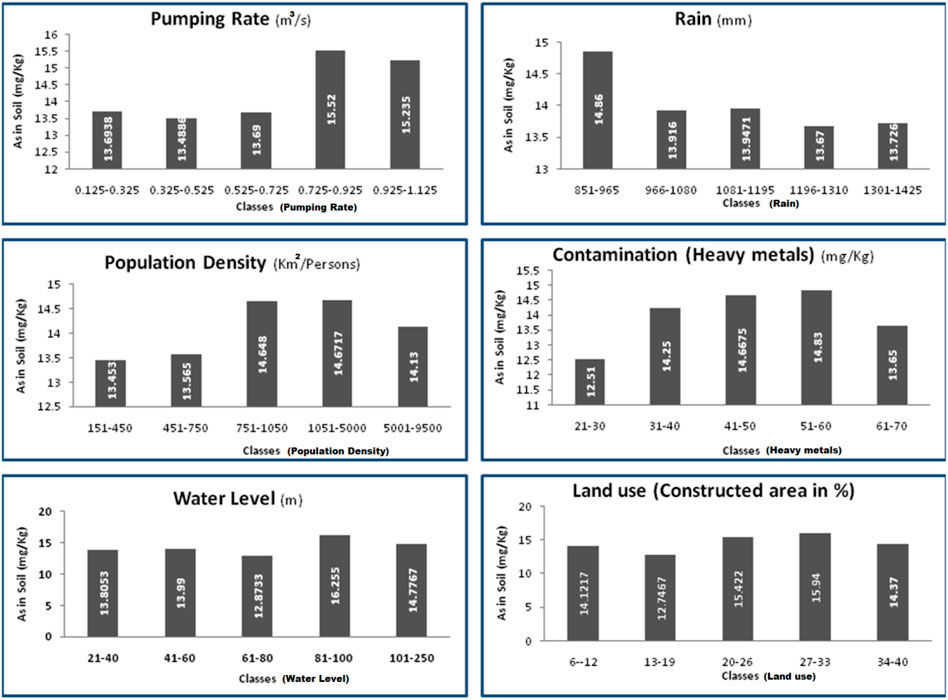
FIGURE 4. Factor classifications and average arsenic concentration of each class in soil.
Figure 4 shows the percentages of two land-use factors, which indicate that more land use activities enhance arsenic levels in the soil. The constructed and green land areas had low or high impact on different classes, but low effects were detected in the low percentage range for these classes. Counties with constructed areas over 20% show gradually increasing arsenic concentrations in the soil (<15.3700 mg/kg) and GW (<0.0163 mg/L), while arsenic levels between 0.0245 and 0.0330 mg/L are observed in SW. Green land with coverage over 45% and large-scale agriculture activities were observed to have major levels of contaminants in the soil and SW, which indirectly affected the GW quality. Thus, it can be concluded that arsenic is present in all three examined media in Jianghan Plain. Naturally, these media have interaction systems that transport pollutants from one medium to another based on various parameters. However, other factors can also enhance arsenic mobility, which pose risks for local communities.
4.2 Results of GIS-based factor analysis models
4.2.1 Arsenic level in soil
Eighty-four single-factor and multifactor models were developed and verified by their correlations with the arsenic model based on the equal frequency tool in GIS. The highest equal frequency multifactor model was used to develop gradually lower factor models; the single-, two-, and three-factor models with the highest equal frequencies are presented in Table 1. The results of these models and their correlations with elevated arsenic in soil are presented in this section. It is extremely important to explore the impacts of local factors that elevate arsenic values, their causes, and their relationships. The soil arsenic distribution model was compared with the single-factor and multifactor models. Table 1 presents the seven single models for equal frequencies of land use (Model_152) and pumping rate (Model_154), whose equal frequencies are 65.57% and 63.66%, respectively. In contrast, the lowest similar frequency was seen for rainfall as the factor (Model_156; 18.1%).
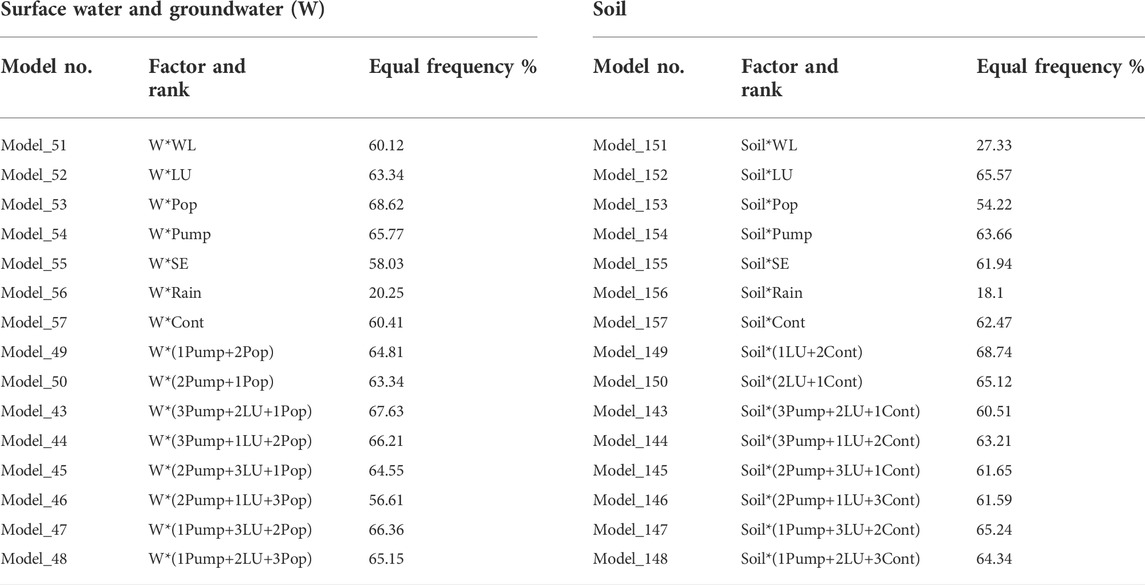
TABLE 1. Model frequencies of factor correlations with arsenic concentrations in the water and soil.
The results of the GW pumping and land use models show high equal frequencies with the soil arsenic concentration in Jianghan Plain. The highest and lowest equal frequency values among the developed models were for Model-149 (1LU*2Pump) and Model-156 (Rain), whose values are 68.74% and 18.1% similar with that of arsenic, respectively (Table 1). These model results indicate that the local anthropological activities have negative impacts on the soil, which are transmitted to the GW system over time. The best frequency matching maps are displayed in Figure 3. The raster calculator tool in GIS was used to develop the multifactor models, and ranking techniques were applied to verify the highest and lowest impact factors. For example, the single-factor and multifactor raster models and arsenic concentration were reclassified and assigned similar color schemes to indicate the same frequency. Table 1 shows the best model results and the most effective factors, which are the pumping rate and land use.
4.2.2 Arsenic concentrations in the waters
This study investigated the relationships of seven major factors with high arsenic concentration and distribution in aquifer and soil in Jianghan Plain. The stress intensities of each factor were evaluated for water and soil. Thus, the permissible levels of arsenic in drinking water in China are 0.05 mg/L (50 ppb) for GW and SW as well as 40 mg/kg for soil, which are safe for human health. The following sections present the results of the developed models for each factor, arsenic concentration correlations with the single-factor and multifactor models, and effects of various factors on the arsenic concentrations to explore the causes of high arsenic concentrations and their relationships with the examined factors.
Here, the arsenic concentration distributions were compared using similar frequency values for a single factor, two factors, and multiple factors included in the raster models. The highest similarity frequency factors were then used to develop multiple models. The results of the estimated frequency values according to the models are displayed in Table 1. Table 1 shows that the best frequency percentage decreases with increasing number of factors. Among the single-factor models, the population density (Model 53 with 68.62%) and pumping rate (Model 54 with 65.77%) had values higher than the remaining single-factor and multifactor model frequencies. The model results showed that close matching frequencies for the population density and WL greatly affect the arsenic concentrations in Jianghan Plain. Furthermore, among the single models, population density showed the highest matching frequency with arsenic, while rainfall (Model 56 with 20.25%) showed the lowest matching frequency. Therefore, the anthropological activities in the study area were unsafe for the local GW system and negatively impacted its water resources. However, the single-factor model frequencies were lower than those of the multifactor models.
The multifactor raster models were developed using the raster calculator tool and ranking technique. The results in Table 1 also exhibit the relationships between the combined factors and arsenic concentrations. The best matching frequencies among the multifactor models were observed for W*(3Pump+2LU+1Pop) (Model 43 with an equal frequency of 67.63%) and W*(1Pump+2LU+3Pop) (Model 48 with an equal frequency of 65.15%). Close matching frequency percentages were observed among the two-factor models (65.49%) and three-factor models (63.61%), while the four- and five-factor model values ranged from 10.9% to 55.66%. The most effective factors were population density and pumping rate, which had the two highest matching frequencies among all models. These results were also confirmed by the frequency maps of the four best models shown in Figure 6. Analysis with the equal frequency tool explored the various factors contributing to decreasing water quality in Jianghan Plain. These results can help identify the impacts of single factors as well as different combinations of factors. Human activities based on water demand that impact WL through pumping were diagnosed as the major factors that enriched arsenic levels in the water resources.
4.3 High equal frequency factor relationships and their impacts on the three media
4.3.1 High equal frequency factors in soil
First Factor F1: This section describes the land use and arsenic concentration impact on soil; the general factors with regard to anthropogenic activities include different waste materials and pollutants directly in soil. The seven major land use classes are presented in Figure 7A. The land use map (Figure 5A) exhibits high values for green land, dryland, SW, and urbanization (domestic and commercial areas), followed by agricultural land use and industrial activities. Almost 13.7% of the study area comprises urban settlements and other constructions, as shown in Figure 7A. Human activities are regarded as important, which result in elevating the levels of different pollutants in the topsoil of Jianghan Plain. Industrialization, rapid population growth, and agricultural activities affect the soil quality in Jianghan Plain, China (Gan et al., 2014). Increasing amounts of agrochemical use and rapid industrialization have subjected the soil to stresses owing to increasing pollution (Zhong et al., 2014).
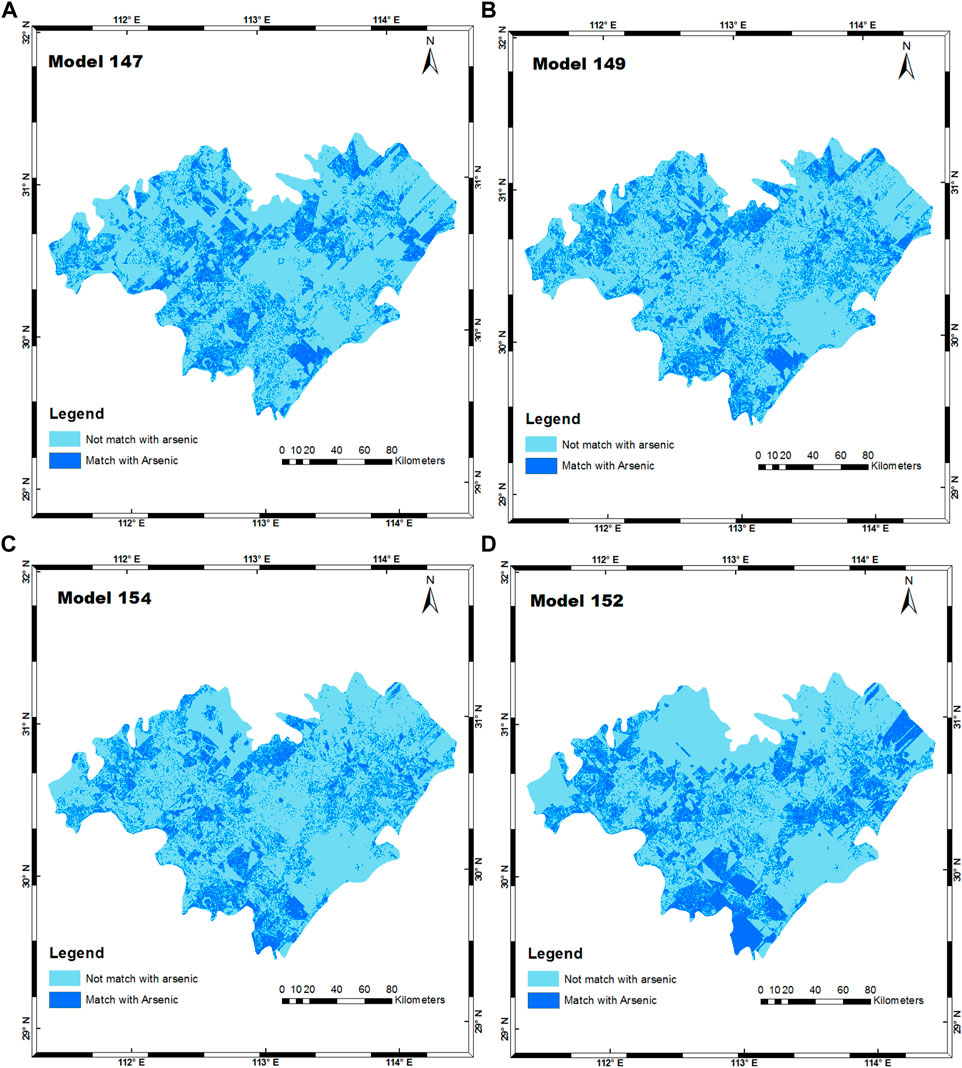
FIGURE 5. The best matching frequencies maps models for soil arsenic concentration among the multifactor models were observed for Soil*(1Pump+3LU+2Cont) in panel (A), soil*(1LU+2Cont) in panel (B), soil*Pump in panel (C) and soil*LU in panel (D) with an equal frequency of 65.24%, 68.74%, 63.66% and 65.57% (Table 1), respectively.
The calculated correlation value (r2 = 0.543) between human activities and arsenic levels shows a close relationship in Jianghan Plain. The two major land use factors are construction and green land area, as shown in Table 2 which generally show high land use intensity affecting arsenic concentrations in soil. Counties with construction areas below 19% show average arsenic concentrations between 12.7467 and 14.1217 mg/kg, while the highest arsenic level was observed in the fourth class (27–33%), with a value of 15.9400 mg/kg. Green land areas that are linked to agricultural activities, as shown in Figure 4, showed that areas with over 57% agricultural land had the highest arsenic concentration of 16.0240%. Over time, land use generally affects soil composition, which can also affect the arsenic concentration in the aquifer; this result indicates that each category of land use contributes differently to the increasing arsenic contamination in the study area (Figure 4). Thus, soil characteristics are affected by various land use activities in the Jianghan Plain. The hydrogeological characteristics of Jianghan Plain are hence strongly associated with high-arsenic GW systems (Yu et al., 2022).
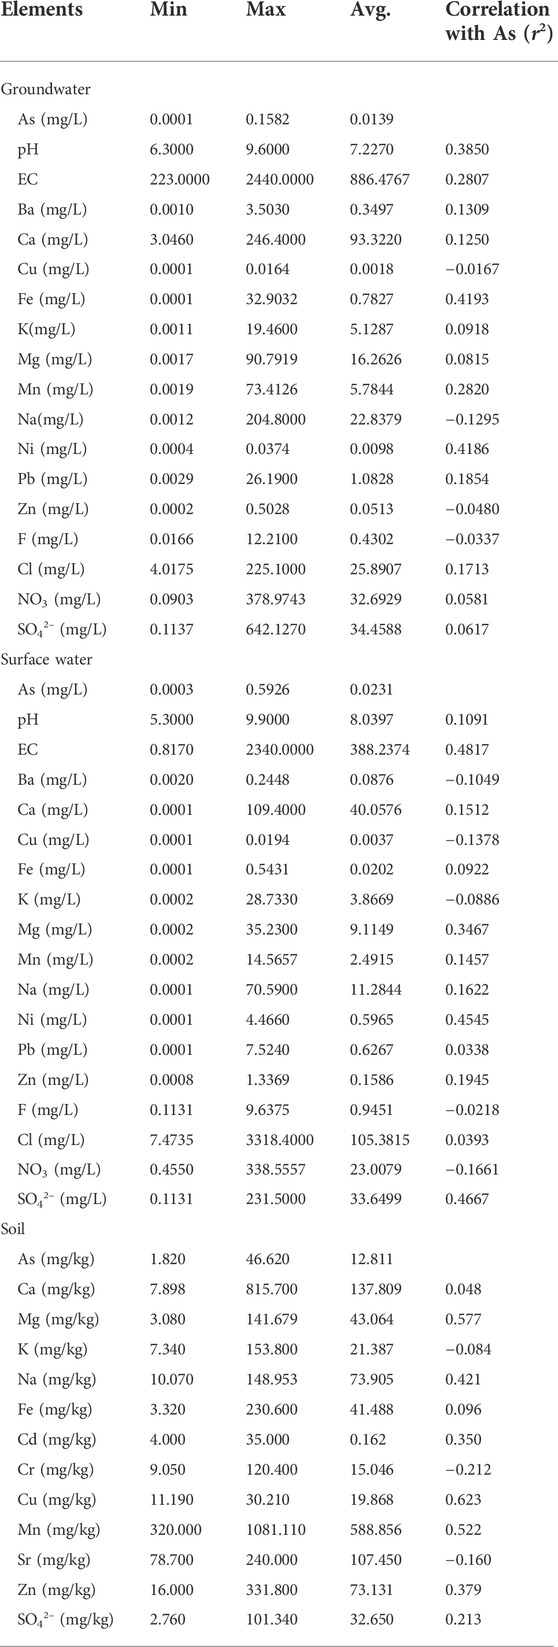
TABLE 2. Statistical data representations of the hydro and geochemical data and correlations with arsenic concentrations in the GW, SW, and soil.
First Factor F2: In Jianghan Plain, GW is the principal source of drinking water, and the demands vary with season and number of activities. Among the seven factors, pumping rate was identified through GIS modeling as the major source of increased arsenic contamination in the soil. The excessive pumping of GW to satisfy the increasing public demands can rapidly decline the water table levels, thereby affecting soil and GW quality adversely. The chemistry of soil, SW, and GW is affected by the changing recharge patterns. Many researchers have agreed that indiscriminate pumping may have facilitated the spread of arsenic within the GW layer (Harvey et al., 2005; Rosencranz et al., 2021). The estimated total GW exploitation for the purposes of different counties were noted to be between 0.1251 and 1.1250 m3/s. Ravenscroft et al. showed that the operational age of a well and the period of pumping are linked to GW quality and can elevate its arsenic concentration (Cuthbert et al., 2002). At the same time, the Honghu and Dangyang counties having high pumping rates of over 1.1 m3/s showed low GW exploitation compared to other areas (Figure 7D). The soil arsenic distribution map shows a close relationship to GW exploitation, and the central and southern parts show elevated arsenic levels (Figure 2C), with similar areas having high pumping intensities (Figure 7D). The vulnerability of water supply wells to natural and anthropogenic contaminants depends on the pumping stress levels of the GW system (Van Geen et al., 2002).
Regarding the relationship between arsenic concentration and pumping quantity, the total GW exploitation can be divided into five classes to verify soil arsenic concentration variation with increasing pumping quantity. The statistical results show a general trend of positive correlations between the two factors (r2 = +0.4532). Elevated arsenic values of 15.5200 mg/kg in soil were observed within the 0.7251–0.9250 m3/s class, while the lowest arsenic concentration of 13.4886 mg/kg was noted in the second class where the pumping rate limit was between 0.3251 and 0.5250 m3/s. A previous study of Jianghan Plain reported that the average arsenic measured in sediments was 14.5 mg/kg (Gan et al., 2014). Therefore, infiltration of high-arsenic-induced water and increasing discharge rate into aquifers indicate the possible risks of arsenic contamination in GW.
4.3.2 High equal frequency factors in water bodies
First Factor F1: Population density was estimated based on each county’s collected data available in the China Statistical Yearbook (2014). The population strength was between 294 km2/persons to 9422 km2 as displayed in the population distribution results in Table 2. According to the National Bureau of Statistics, the annual national population growth rate was 0.49% between 2012 and 2013 and 0.35% for Hubei Province over the past 3 years. The population distribution map (Figure 7C) also showed wide spatial dispersion in the study area. The central area had medium density compared to the other parts of Jianghan Plain. Additionally, high spatial distribution was noted for the eastern areas in CaiDian, Wuhan, and AnLu counties, while counties in the western areas such as YiLing and XiLing showed the highest population intensities. Less than 500 km2/persons population density was observed in the southwest region along the Yangtze River. However, medium-population densities were located in the central parts of the study area (Figure 7C). The population pressures could result in increased solid waste production, urban nonpoint runoff, and declining water quality. In the case study of Dongting basin, the population distribution showed a low relationship with arsenic concentration.
The statistical results based on each county’s average arsenic concentration and population density in the study area had significant impacts on the average arsenic levels. The population density in the study area significantly impacted the average arsenic level of each county, with a calculated correlation coefficient of +0.532. This implies that the pollution risk due to inhabitant ratio is high in the study area. However, the average arsenic concentrations in the counties were divided into five classes, where the lowest population class (151–450 km2/persons) showed an arsenic concentration of 0.0144 mg/L in the GW, which is 0.0140 mg/L under the limit permissible by Chinese standards but higher than that prescribed by the WHO. The average arsenic concentrations observed in Jianghan Plain were within the limits imposed by the Chinese standard (0.05 mg/L) but over that prescribed by the WHO (0.01 mg/L) (Table 2). The highest average arsenic concentration (0.0207 mg/L) was measured in the region where the population density was between 1051 and 5000 km2/persons, and the results indicated that human activities impacted GW resources. It has been reported that the GW resources in highly populated areas have elevated arsenic concentrations (Van Geen et al., 2002), and similar results were observed in Jianghan Plain. In recent decades, rapid population growth in the Jianghan Plain has degraded the local water resources (Yu et al., 2022). A high correlation was observed between arsenic concentration and dense population in large areas of Dhaka (Sarker, 2022). China accounts for only 7% of total landmass of the Earth but feeds about 25% of the global population. Therefore, water scarcity and quality are significant issues for the large population (Impending Water Crisis in China, Nina Brooks).
Table 2 depicts that the arsenic concentration in SW resources are significantly high, where the 0.5251–0.7250 m3/s class shows an average concentration of 0.0243 mg/L. However, a low average value was observed in the first class (0.0065 mg/L). Mixed correlations between arsenic range and population strength were observed with regard to the classes. Therefore, it can be concluded that the broad range of human activities influence the pollution concentrations in SW resources. A comprehensive study was conducted to explore the population under arsenic risk, which showed that highly populated areas in China with a greater percentage of inhabitants are affected by arsenic toxicity (Xu et al., 2022).
First Factor F2: The pumping rate distribution in Jianghan Plain is shown in Figure 6A. It is observed that mixed pumping rate distribution can be seen over the entire area; however, Honghu and Dangyang counties show high GW exploitation of over 1.1 m3/s and Jingshan, Yiling, and Shishou counties have exploitation rates below 0.2 m3/s. The results in Table 2 present the average arsenic concentrations; high values are observed for the middle pumping rate class of 0.5251–0.7250 m3/s (0.0243 mg/L in SW and GW) and fifth class of 0.9251–1.1250 m3/s (0.214 mg/L). The general trends observed in the SW and GW are that the arsenic concentrations increased with increasing pumping quantity in the Jianghan Plain. Comparing Figure 7B, Figure 2A, it is seen that many parts of the study area have close relationships between the pumping rates and arsenic concentration levels in the GW.
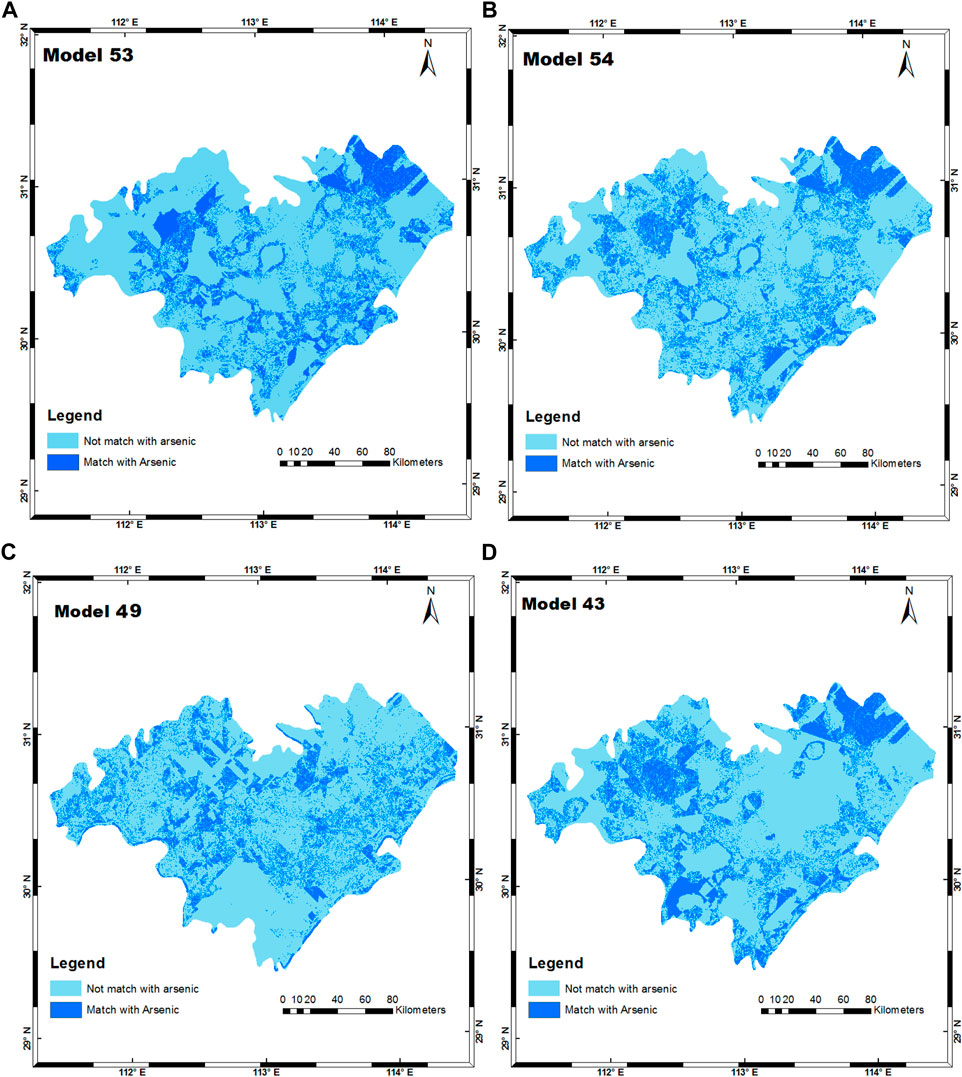
FIGURE 6. Final equal frequency maps of the best models for GW and SW arsenic concentrations: (A) W*Pop, (B) W*Pump, (C) W*(1Pump+2Pop), and (D) W*(3Pump+2LU+1Pop).
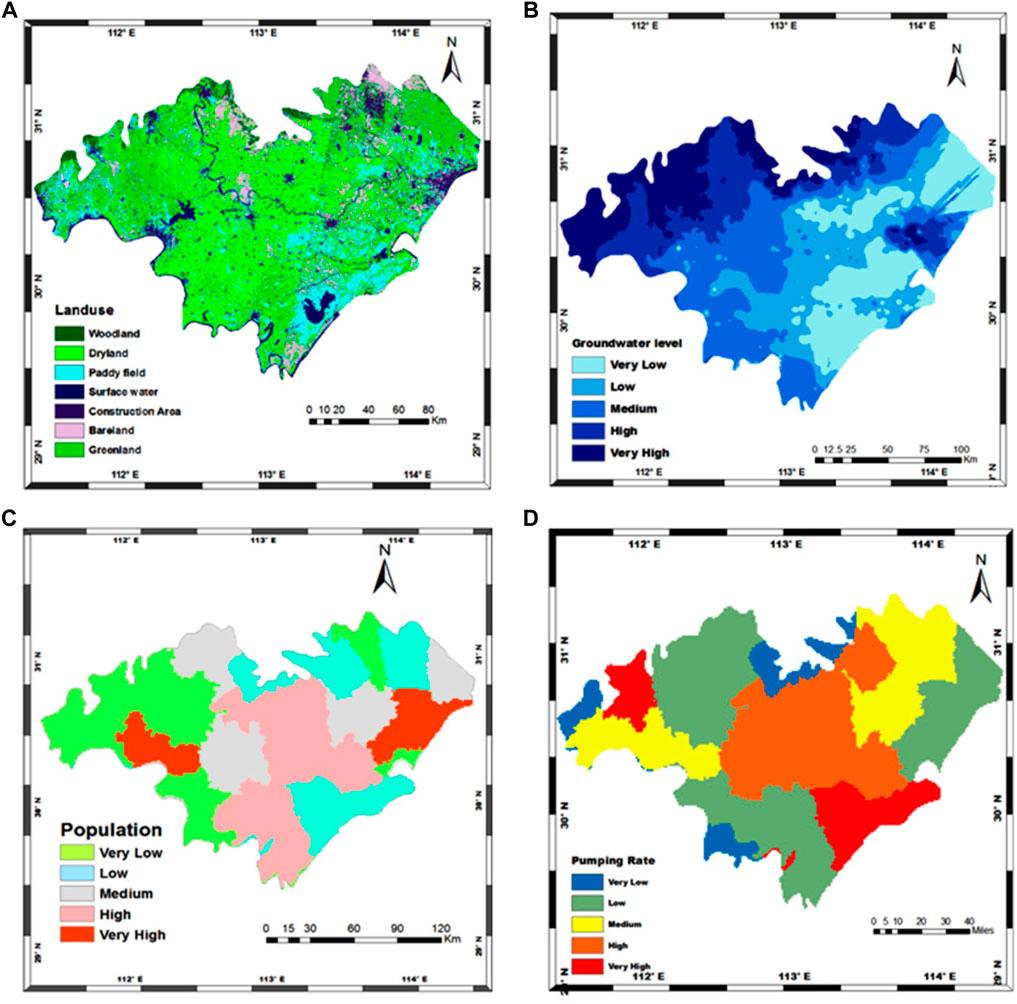
FIGURE 7. (A) Land use, (B) GW table, (C) population density, and (D) pumping rate for Jianghan Plain.
Similarly, the pumping rate and SW show strong correlations in almost all parts of the study area except for the eastern region. Owing to the major farming activities in southern China, large amounts of unpolluted water need to be pumped for irrigation purposes each year in Jianghan Plain, which affects the GW quality. Gan et al. (2014) observed that the SW quality was degraded by various anthropogenic factors, such as industry, agriculture, and high population growth rate. The lowest water quality observed in shallow aquifers was attributed to SW, urban water and sanitation systems, high urban density, poor solid waste disposal, and agricultural activities, while the high arsenic levels in deep aquifers was related to the high pumping rates for different sectors, such as the urban and industrial sectors (Farooqi et al., 2003). Various studies on different water supply sources have concluded that deep aquifers can be protected against arsenic percolation by shallow pumping (Hossain and Piantanakulchai, 2013; Akhtar et al., 2015). Our findings show that GW overexploitation results in higher arsenic concentrations owing to contaminated recharge, while the high arsenic concentrations in deep GW may be from high pumping rates over the years.
4.4 Arsenic spatial variation along surface water resources
This section explains the changes in arsenic concentration in SW resources and spatial variations in arsenic levels in urban and semi-urban areas. Figure 8 shows the gridded map of the study area, and each grid covers an area of 400 km2. The SW flows north from the east–west part, so we were interested in investigating the spatial changes in arsenic levels to determine the relationships among SW, GW, and soil. Grids having SW were numbered, and graphs were developed based on the average arsenic value in each grid area. The average As values vary in different grids, and their concentration may be affected by different factors. Figure 9 shows that the average As values in SW, GW, and soil are less than those of other parts (from grids 1 to 6). In the first six grids, the arsenic ranges in GW (0.0027–0.008 mg/L) and SW (0.012–0.034 mg/L) depict good water quality, while the other grids show higher values. The As values indicate that grids with high anthropogenic activities show elevated values and that the upstream regions contain low arsenic concentrations compared to the downstream. Honghu and Dongting lakes are located in the southern part, and the water quality of Honghu lake is much better than that of Dongting lake because the latter is located near Wuhan, Zhengxiang, Shayang, Qianjiang, Xiantao, Hanchuan, Honghu, and Jingzhou, which are major cities in the study area. Comparisons of the arsenic situations in major cities and rural areas showed significant differences. The most elevated average arsenic value in soil was observed near Xiantao (18.71 mg/kg) in grid 12, and the second highest value (18.41 mg/kg) was noted in grid 8 at Qianjiang city. A similar trend was observed for arsenic in soil near highly populated regions, such as Wuhan, Shayang, and Jingzhou, whose average values were 13.68, 14.34, and 18.16 mg/kg, respectively. However, semi-urban and rural areas showed comparatively lower arsenic risk. Elevated arsenic concentration in the SW was found near Wuhan city (0.52 mg/L), while poor quality GW was detected between Shayang and Xiantao (grids 6–12) with values in the range of 0.43–0.21 mg/L. These results clearly show that anthropogenic activities are major sources of pollution in the study area, which may be from the high population, pumping rate, waste management, or other factors.
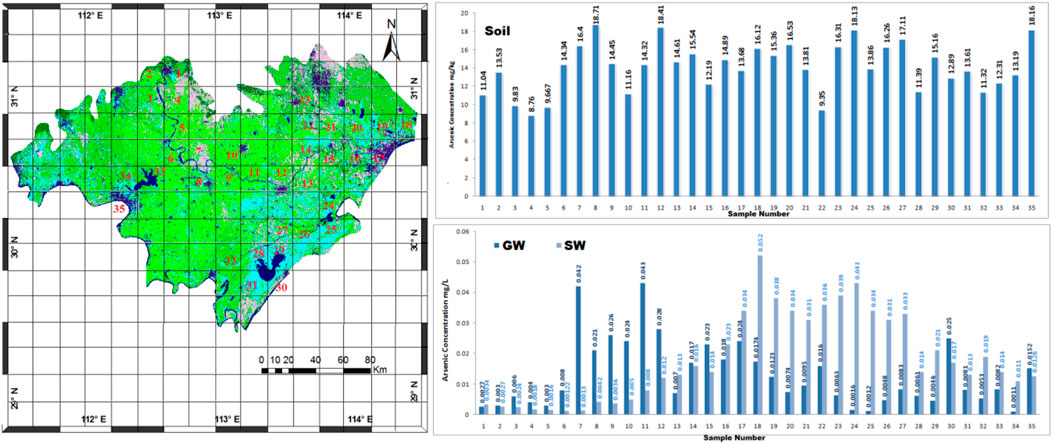
FIGURE 8. Spatial variations in arsenic concentrations in the GW, SW, and soil in Jianghan Plain.
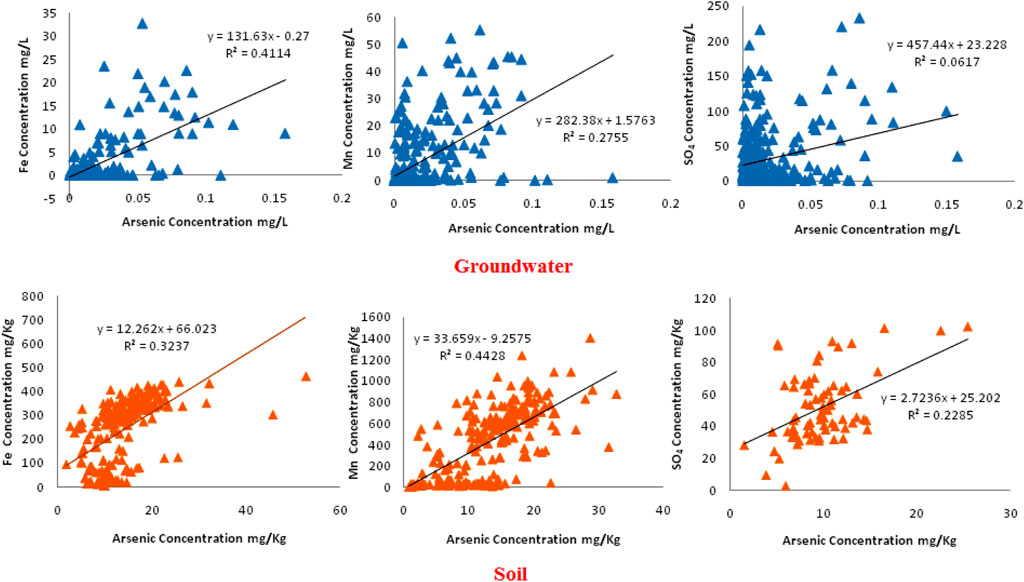
FIGURE 9. Arsenic correlations with elements in the GW and soil.
The GIS model results are closely matched in Table 1 and Figure 9. Previous studies did not indicate clear arsenic sources in the Jianghan Plain, so it was expected that geogenic and anthropogenic causes were responsible for the elevated arsenic levels. Variations in the climate, geological characteristics, and anthropogenic activities were investigated for the elevated arsenic levels in GW in the Jianghan Plain (Gan et al., 2014). The GW system and topsoil chemistry depend on different hydrogeological parameters and factors that affect their movement and pollutant flow direction. Previous studies have observed that anthropogenic factors, such as sewage discharge, industrial wastewater discharge, and agricultural fertilizer leaching, are major sources of sediment contamination (Akhtar et al., 2014; Wang et al., 2022). Heavy metals naturally sink to the bottom of the lake and river sediments and eventually become a part of the GW system (Segura et al., 2006; Yu et al., 2008).
4.5 Arsenic correlation with hydrogeochemical parameters
Table 2 presents the statistical analysis results of hydrogeochemical data and their correlations with the arsenic concentrations in soil, SW, and GW from Jianghan Plain. The highest values of arsenic were measured in soil (46.62 mg/kg) and GW (0.1582 mg/L), which were over the WHO and Chinese standards, while a value of 0.0231 mg/L was detected in the SW, which is the below Chinese standard (>0.05 mg/L). The overall average arsenic concentrations detected in the three media were within the range of both standards. The chemical analysis results of trace elements (Cr, Fe, Cu, Co, Mg, F, Cu, Mn, and Pb) and their correlations with arsenic are presented (Table 2). High relationship between arsenic in soil and Cu (r2 = 0.6228), SW and pH (r2 = 0.48173), and GW and Fe (r2 = 0.4114) were observed. At the same time, the other hydrogeochemical parameters showed significant variations in the concentration and correlation values.
The pH values varied from acidic to alkaline in the GW, with values in the range of 6.3–9.6 and an average value of 7.227. A similar trend was observed for the SW, where the average value (7.974) indicated a general alkaline behavior. Often, high pH values indicate the presence of anions, which encourage reduction processes to control arsenic mobility (Source: USGS). High arsenic levels were detected in waters where the pH values were over 8. Lower pH (<8) values may be attributed to arsenic desorption due to surface oxidation (Smedley and Kinniburgh, 2006). Elevated Pb concentrations were detected in the GW (average value: 1.0828 mg/L) and SW (average value: 0.6267), which show relationships with pH. Owing to the redox-sensitive element, pH conditions can enhance Pb mobility (Mapoma and Xie, 2014). Arsenic correlation with Fe (r2 = 0.3237) in soil indicates that arsenic has low association with minerals (Xie et al., 2008). The correlations of Fe with arsenic were computed to be 0.4114 and 0.0922108 for GW and SW, respectively. Significant correlations were observed between arsenic and Ca, Na, Cd, Cu, Mn, and Zn based on the geochemical analyses of collected soil samples and from statistical calculations. The correlations of other geochemical parameters were higher than those of iron, indicating that As had no strong associations with iron-based minerals. The relationship between arsenic and SO4 is consistent with the reduction dissolution of iron oxides/oxyhydroxides, as has been shown in other case studies (Welch et al., 2000; McArthur et al., 2004). Under oxidizing conditions, the correlation between Fe and As is common. Interestingly, high concentrations of SO4 (GW: max = 194.063 mg/L; SW: max = 81.85 mg/L) indicated the slow occurrence of reduction processes in the system for the production of sulfide mineral precipitates (Xie et al., 2008). The arsenic correlations with SO4 in the three media showed significant trends.
The low concentration of average Fe value is linked to the reduction of the primary source of GW arsenic rather than the Fe/SO4 cycle in Jianghan Plain. Fe and alkalinity correlations with GW and SW show the strong impact of redox processes on the elevated arsenic concentrations. Many studies have shown that the elevated Fe concentrations could be due to the reduction process in water (Cummings et al., 1999). Suboxic to anoxic conditions of the chemical reactions and correlations of NO3 and SO4 with arsenic do not support the reduction mechanism of dissolution of Fe in soil. Therefore, Fe concentration levels in the sediments and GW are used to predict arsenic mobility and sources.
Nominal arsenic concentration correlations with iron (r2 = 0.4114) and Mn (r2 = 0.2755) were detected in GW, while low correlations were observed with Fe (r2 = 0.0922108) and Mn (r2 = 0.14568) in SW. The positive correlation between Fe and As indicates reductive dissolution of arsenic links with Fe oxides under reductive conditions. Reductive dissolution of As correlated with Fe oxides/hydroxides is regarded as a major process controlling arsenic mobility in the GW (Nickson et al., 2000; Smedley and Kinniburgh, 2006). It was observed that Fe and Mn oxides/hydroxides under reducing conditions are supported mechanisms for arsenic release in Jianghan Plain (Gan et al., 2014). The values of r2 for arsenic in SW and GW also show the low mobility of arsenic. Thus, a combination of mechanisms such as reductive dissolution and pH-dependent desorption influence the mineralization of As in the aquifer systems of Jianghan Plain.
Gan et al. (2014) investigated the arsenic concentrations in GW at Jianghan Plain and concluded that the hydrochemical and hydrogeological characteristics have significant similarities with other high-arsenic GW areas, such as Bangladesh; Bihar and West Bengal in India; and Pakistan (Muhammad et al., 2016; Lanjwani et al., 2022). The statistical results of the hydrogeochemical data and their relationships helped identify that geogenic, hydrogeological, and anthropogenic factors were involved in the elevated levels and mobility of arsenic in Jianghan Plain. However, oxidation/reduction mechanisms were also observed; therefore, other factors are important for investigating the real causes of increased arsenic levels in the study area.
5 Conclusion
The present study is concerned with arsenic concentrations in the soil, SW, and GW as well as their relationships with seven factors in Jianghan Plain. The arsenic levels were identified in three media of the water cycle; however, the concentrations changed with the locations. Thus, direct GW use is not recommended for drinking because the shallow water is highly contaminated. Among the single-, two-, and three-factor models, the major factors related to elevated arsenic levels in GW and SW were population density and pumping rate, while land use and GW pumping rate induced higher arsenic levels in soil. In addition, arsenic concentrations along the SW flow were investigated. Arsenic values in GW, SW, and soil were elevated near main cities and areas with high anthropogenic activities.
The average pH value (below 8 in SW and GW) indicates a slow reduction process, and an As–Fe correlation of r2 = 0.419343 in GW depicts the association of soil with mineralization. The relationship between arsenic and SO4 is consistent with the reduction dissolution of iron oxides/oxyhydroxides; arsenic relationship with other hydrochemical parameters shows that geogenic sources are slightly linked to increased arsenic concentrations in GW; however, the hydrogeochemical data depict a positive relationship.
For drinking and domestic use, treated water or alternative water sources are considered to be good options. Therefore, the local water resource managers and planners should develop strategies for Jianghan Plain to control the high arsenic concentrations in potable water. The concerned departments, such as environmental, urban planning, industrial, and water management, can solve the GW, SW, and soil contamination problems by sharing information, improving future planning, as well as introducing and implementing suitable pollution control laws.
Data availability statement
The original contributions presented in the study are included in the article/Supplementary Material; further inquiries can be directed to the corresponding authors.
Author contributions
All authors listed have made substantial, direct, and intellectual contributions to the work and approved it for publication.
Funding
This research was financially supported by the Geology Survey Bureau of China through the “Survey and envaluation of groundwater resource and environmental problems in JianghanDongting Plain” project(No.1212011121142) and the “Comprehen sive study tomonitor landuse and geological environment at centr al reaches of the Yangtze River in Jianghan Dongting Plain” pro ject (ProjectNo. 1212011120084)
Conflict of interest
The authors declare that the research was conducted in the absence of any commercial or financial relationships that could be construed as a potential conflict of interest.
Publisher’s note
All claims expressed in this article are solely those of the authors and do not necessarily represent those of their affiliated organizations, or those of the publisher, the editors, and the reviewers. Any product that may be evaluated in this article or claim that may be made by its manufacturer is not guaranteed or endorsed by the publisher.
References
Akhtar, M. M., Tang, Z., and Mohamadi, B. (2014). Contamination potential assessment of potable groundwater in Lahore, Pakistan. Pol. J. Environ. Stud. 23 (6), 1905–1916.
Akhtar, M. M., Zhonghua, T., Sissou, Z., and Mohamadi, B. (2015). Assess arsenic distribution in groundwater applying GIS in capital of Punjab, Pakistan. Nat. Hazards Earth Syst. Sci. Discuss. 3, 2119–2147. https://doi.org/10.5194/nhessd-3-2119-2015
Akhtar, N., Syakir Ishak, M. I., Bhawani, S. A., and Umar, K. (2021). Various natural and anthropogenic factors responsible for water quality degradation: A review. Water 13 (19), 2660. doi:10.3390/w13192660
Cao, X., Li, W., Song, S., Wang, C., and Khan, K. (2022). Source apportionment and risk assessment of soil heavy metals around a key drinking water source area in northern China: multivariate statistical analysis approach. Environ. Geochem. Health, 1–15. doi:10.1007/s10653-022-01251-7
China Environmental Monitoring Center (1990). Chinese soil element background content. Beijing: Chinese Environment Science Press. (in Chinese).
Cummings, D. E., Caccavo, F., Fendorf, S., and Rosenzweig, R. F. (1999). Arsenic mobilization by the dissimilatory Fe (III)-reducing bacterium Shewanella alga BrY. Environ. Sci. Technol. 33, 723–729. doi:10.1021/es980541c
Cuthbert, M. O., Burgess, W. G., and Connell, L. (2002). Constraints on sustainable development of arsenic-bearing aquifers in southern Bangladesh. Part 2: Preliminary models of arsenic variability in pumped groundwater. Geol. Soc. 193, 165–179. doi:10.1144/gsl.sp.2002.193.01.13
Deng, X., Mao, L., Wu, Y., Tan, Z., Feng, W., and Zhang, Y. (2022). Pollution, risks, and sources of heavy metals in sediments from the urban rivers flowing into Haizhou Bay, China. Environ. Sci. Pollut. Res. 29, 38054–38065. doi:10.1007/s11356-021-18151-5
Deng, Y., Wang, Y., and Ma, T. (2009). Isotope and minor element geochemistry of high arsenic groundwater from Hangjinhouqi, the Hetao Plain, Inner Mongolia. Appl. Geochem. 24, 587–599. doi:10.1016/j.apgeochem.2008.12.018
Duan, Y., Gan, Y., Wang, Y., Deng, Y., Guo, X., and Dong, C. (2015). Temporal variation of groundwater level and arsenic concentration at Jianghan Plain, central China. J. Geochem. Explor. 149, 106–119. doi:10.1016/j.gexplo.2014.12.001
Fang, X., Peng, B., Song, Z., Wu, S., Chen, D., Zhao, Y., et al. (2021). Geochemistry of heavy metal-contaminated sediments from the Four River inlets of Dongting lake, China. Environ. Sci. Pollut. Res. 28 (22), 27593–27613. doi:10.1007/s11356-021-12635-0
Farooqi, A., Firdous, N., Masuda, H., and Haider, N. (2003). Fluoride and arsenic poisoning in ground water of Kalalanwala Area near Lahore, Pakistan. Geochimica Cosmochimica Acta Suppl. 67, 90.
Fendorf, S., Michael, H. A., and van Geen, A. (2010). Spatial and temporal variations of groundwater arsenic in South and Southeast Asia. Science 328, 1123–1127. doi:10.1126/science.1172974
Gan, Y., Wang, Y., Duan, Y., Deng, Y., Guo, X., and Ding, X. (2014). Hydrogeochemistry and arsenic contamination of groundwater in the Jianghan Plain, central China. J. Geochem. Explor. 138, 81–93. doi:10.1016/j.gexplo.2013.12.013
Gao, Y., and Mucci, A. (2003). Individual and competitive adsorption of phosphate and arsenate on goethite in artificial seawater. Chem. Geol. 199, 91–109. doi:10.1016/s0009-2541(03)00119-0
Gong, Y., Qu, Y., Yang, S., Tao, S., Shi, T., Liu, Q., et al. (2020). Status of arsenic accumulation in agricultural soils across China (1985–2016). Environ. Res. 186, 109525. doi:10.1016/j.envres.2020.109525
Guo, H., Zhang, Y., Xing, L., and Jia, Y. (2012). Spatial variation in arsenic and fluoride concentrations of shallow groundwater from the town of Shahai in the Hetao basin, Inner Mongolia. Appl. Geochem. 27 (11), 2187–2196.
Harvey, C. F., Swartz, C. H., Badruzzaman, A. B. M., Keon-Blute, N., Yu, W., Ali, M. A., et al. (2005). Groundwater arsenic contamination on the ganges delta: biogeochemistry, hydrology, human perturbations, and human suffering on a large scale. Comptes Rendus Geosci. 337, 285–296. doi:10.1016/j.crte.2004.10.015
He, J., and Charlet, L. (2013). A review of arsenic presence in China drinking water. J. Hydrol. 492, 79–88.
He, X., Li, P., Ji, Y., Wang, Y., Su, Z., and Elumalai, V. (2020). Groundwater arsenic and fluoride and associated arsenicosis and fluorosis in China: occurrence, distribution and management. Expo. Health 12, 355–368. doi:10.1007/s12403-020-00347-8
Hossain, M. M., and Piantanakulchai, M. (2013). Groundwater arsenic contamination risk prediction using GIS and classification tree method. Eng. Geol. 156, 37–45. doi:10.1016/j.enggeo.2013.01.007
Kang, C. G., Li, C. A., Wang, J. T., and Shao, L. (2009). Heavy minerals characteristics of sediments in Jianghan Plain and its indication to the forming of the Three Gorge. Earth Sci.-J. China Univ. Geosci. 34 (3), 419–427.
Lanjwani, M. F., Khuhawar, M. Y., Lanjwani, A. H., Khuahwar, T. M. J., Samtio, M. S., Rind, I. K., et al. (2022). Spatial variability and risk assessment of metals in groundwater of district Kamber-Shahdadkot, Sindh, Pakistan. Groundw. Sustain. Dev. 18, 100784. doi:10.1016/j.gsd.2022.100784
Li, R. Y., Ago, Y., Liu, W. J., Mitani, N., Feldmann, J., McGrath, S. P., et al. (2009). The rice aquaporin Lsi1 mediates uptake of methylated arsenic species. Plant Physiol. 150, 2071–2080. doi:10.1104/pp.109.140350
Mapoma, H. W., and Xie, X. (2014). Basement and alluvial aquifers of Malawi: An overview of groundwater quality and policies. Afr. J. Environ. Sci. Tech. 8, 190–202. doi:10.5897/ajest2013.1639
McArthur, J. M., Banerjee, D. M., Hudson-Edwards, K. A., Mishra, R., Purohit, R., Ravenscroft, P., et al. (2004). Natural organic matter in sedimentary basins and its relation to arsenic in anoxic ground water: the example of West Bengal and its worldwide implications. Appl. Geochem. 19, 1255–1293. doi:10.1016/j.apgeochem.2004.02.001
Mengshu, S., Yuansheng, H., Xiaofeng, X., and Dunnan, L. (2021). China's coal consumption forecasting using adaptive differential evolution algorithm and support vector machine. Resour. Policy 74, 102287. doi:10.1016/j.resourpol.2021.102287
Muhammad, A. M., Zhonghua, T., Dawood, A. S., and Earl, B. (2015). Evaluation of local groundwater vulnerability based on DRASTIC index method in Lahore, Pakistan. Geofísica Int. 54, 67–81. doi:10.1016/j.gi.2015.04.003
Muhammad, A. M., and Zhonghua, T. (2014). Municipal solid waste and its relation with groundwater contamination in Lahore, Pakistan. Res. J. Appl. Sci. Eng. Technol. 7, 1551–1560. doi:10.19026/rjaset.7.431
Muhammad, A. M., Zhonghua, T., Sissou, Z., Mohamadi, B., and Ehsan, M. (2016). Analysis of geological structure and anthropological factors affecting arsenic distribution in the Lahore aquifer, Pakistan. Hydrogeol. J. 24, 1891–1904. doi:10.1007/s10040-016-1453-4
Nickson, R. T., McArthur, J. M., Ravenscroft, P., Burgess, W. G., and Ahmed, K. M. (2000). Mechanism of arsenic release to groundwater, Bangladesh and West Bengal. Appl. Geochem. 15, 403–413. doi:10.1016/s0883-2927(99)00086-4
Ringard, J., Seyler, F., and Linguet, L. (2017). A quantile mapping bias correction method based on hydroclimatic classification of the Guiana shield. Sensors 17 (6), 1413. doi:10.3390/s17061413
Rosencranz, A., Puthucherril, T. G., Tripathi, S., and Gupta, S. (2021). Groundwater management in India's Punjab and Haryana: a case of too little and too late. J. Energy & Nat. Resour. Law 40, 225–250. doi:10.1080/02646811.2021.1956181
Sarker, M. S. H. (2022). Assessing levels of migrant-friendliness in the context of vulnerability to climate variability, change and environmental hazard: A comparison of two different-sized cities. Int. J. Disaster Risk Reduct. 68, 102525. doi:10.1016/j.ijdrr.2021.102525
Segura, R., Arancibia, V., Zúñiga, M. C., and Pastén, P. (2006). Distribution of copper, zinc, lead and cadmium concentrations in stream sediments from the Mapocho River in Santiago, Chile. J. Geochem. Explor. 91, 71–80. doi:10.1016/j.gexplo.2006.03.003
Shao, M., Tang, X., Zhang, Y., and Li, W. (2006). City clusters in China: air and surface water pollution. Front. Ecol. Environ. 4, 353–361. doi:10.1890/1540-9295(2006)004[0353:ccicaa]2.0.co;2
Singh, J., Yadav, P., Pal, A. K., and Mishra, V. (2020). “Water pollutants: Origin and status,” in Sensors in water pollutants monitoring: Role of material (Singapore: Springer), 5–20.
Smedley, P. L., and Kinniburgh, D. G. (2002). A review of the source, behaviour and distribution of arsenic in natural waters. Appl. Geochem. 17, 517–568. doi:10.1016/s0883-2927(02)00018-5
Tang, X., Li, R., Han, D., and Scholz, M. (2020). Response of eutrophication development to variations in nutrients and hydrological regime: a case study in the changjiang river (Yangtze) basin. Water 12, 1634. doi:10.3390/w12061634
Van Geen, A., Ahsan, H., Horneman, A. H., Dhar, R. K., Zheng, Y., Hussain, I., et al. (2002). Promotion of well-switching to mitigate the current arsenic crisis in Bangladesh. Bull. World Health Organ. 80, 732–737. doi:10.1590/S0042-96862002000900010
Wang, J., Zhang, C., Liao, X., Teng, Y., Zhai, Y., and Yue, W. (2021). Influence of surface-water irrigation on the distribution of organophosphorus pesticides in soil-water systems, Jianghan Plain, central China. J. Environ. Manag. 281, 111874. doi:10.1016/j.jenvman.2020.111874
Wang, X., Xu, Y. J., and Zhang, L. (2022). Watershed scale spatiotemporal nitrogen transport and source tracing using dual isotopes among surface water, sediments and groundwater in the Yiluo River Watershed, Middle of China. Sci. Total Environ. 833, 155180–80. doi:10.1016/j.scitotenv.2022.155180
Wang, Y. X., and Shpeyzer, G. (2000). Hydrogeochemistry of mineral waters from rift systems on the east asia continent case studies in shanxi and baikal, China. Beijing: Environmental Science Press. (in Chinese with English abstract).
Wei, M., Wu, J., Li, W., Zhang, Q., Su, F., and Wang, Y. (2022). Groundwater geochemistry and its impacts on groundwater arsenic enrichment, variation, and health risks in Yongning County, Yinchuan Plain of northwest China. Expo. Health 14 (2), 219–238. doi:10.1007/s12403-021-00391-y
Welch, A. H., Westjohn, D. B., Helsel, D. R., and Wanty, R. B. (2000). Arsenic in ground water of the United States: occurrence and geochemistry. Ground Water 38, 589–604. doi:10.1111/j.1745-6584.2000.tb00251.x
Xie, X., Wang, Y., Su, C., Liu, H., Duan, M., and Xie, Z. (2008). Arsenic mobilization in shallow aquifers of Datong Basin: Hydrochemical and mineralogical evidences. J. Geochem. Explor. 98, 107–115. doi:10.1016/j.gexplo.2008.01.002
Xu, N., Gong, J., Tao, X., and Liu, L. (2022). Hydrogeochemical processes and potential exposure risk of arsenic-rich groundwater from huaihe river plain, China. Water 14, 693. doi:10.3390/w14050693
Yu, H., Ma, T., Du, Y., Shen, S., and Han, Z. (2022). Distribution, bioavailability, and human health risk assessment of arsenic in groundwater-soil-rice system in the Jianghan Plain, Central China. Environ. Sci. Pollut. Res. 29, 16193–16202. doi:10.1007/s11356-021-16497-4
Yu, L., Xin, G., Gang, W., Zhang, Q., Qiong, S., and Guoju, X. (2008). Heavy metal contamination and source in arid agricultural soil in central Gansu Province, China. J. Environ. Sci. 20, 607–612. doi:10.1016/s1001-0742(08)62101-4
Zhang, X. Y., Lin, F. F., Wong, M. T., Feng, X. L., and Wang, K. (2009). Identification of soil heavy metal sources from anthropogenic activities and pollution assessment of Fuyang County, China. Environ. Monit. Assess. 154 (1), 439–449.
Zhang, X., Ren, B. H., Wu, S. L., Sun, Y. Q., Lin, G., and Chen, B. D. (2015). Arbuscular mycorrhizal symbiosis influences arsenic accumulation and speciation in Medicago truncatula L. in arsenic-contaminated soil. Chemosphere 119, 224–230. doi:10.1016/j.chemosphere.2014.06.042
Zhao, F. J., Lopez-Bellido, F. J., Gray, C. W., Whalley, W. R., Clark, L. J., and McGrath, S. P. (2007). Effects of soil compaction and irrigation on the concentrations of selenium and arsenic in wheat grains. Sci. Total Environ. 372, 433–439. doi:10.1016/j.scitotenv.2006.09.028
Zheng, Y., Stute, M., Van Geen, A., Gavrieli, I., Dhar, R., Simpson, H. J., et al. (2004). Redox control of arsenic mobilization in Bangladesh groundwater. Appl. Geochem. 19, 201–214. doi:10.1016/j.apgeochem.2003.09.007
Zhong, L., Wang, Y., Li, W., Gu, J., Li, X., Wang, X., et al. (2014). Heme oxygenase-1 silencing increases the sensitivity of human osteosarcoma MG63 cells to arsenic trioxide. Mol. Cell. Biochem. 392 (1), 135–144.
Keywords: Arsenic, Geographic Information System (GIS), groundwater, Jianghan Plain, soil, surface water
Citation: Xiao T, Muhammad AM, Pan X, Wang Y, Guangming H and Tang Z (2022) Spatial distribution and risk identification of arsenic contamination in water and soil through GIS-based interpolation techniques in Jianghan Plain, Central China. Front. Environ. Sci. 10:1001862. doi: 10.3389/fenvs.2022.1001862
Received: 24 July 2022; Accepted: 16 August 2022;
Published: 04 October 2022.
Edited by:
Muhammad Tayyab Sohail, Xiangtan University, ChinaReviewed by:
Rabail Urooj, Sardar Bahadur Khan Women’s University, PakistanNnanake-Abasi Offiong, Topfaith University, Nigeria
Copyright © 2022 Xiao, Muhammad, Pan, Wang, Guangming and Tang. This is an open-access article distributed under the terms of the Creative Commons Attribution License (CC BY). The use, distribution or reproduction in other forums is permitted, provided the original author(s) and the copyright owner(s) are credited and that the original publication in this journal is cited, in accordance with accepted academic practice. No use, distribution or reproduction is permitted which does not comply with these terms.
*Correspondence: Akhtar Malik Muhammad, ZHJtYWxpa21hMjFAZ21haWwuY29t; ZhonghuaTang, emhodGFuZ0BjdWcuZWR1LmNu