 Changrui Xiong1
 Jing Li
- 1Department of Atmospheric and Oceanic Sciences, School of Physics, Peking University, Beijing, China
- 2School of Environmental Science and Engineering, Nanjing University of Information Science and Technology, Nanjing, China
Interactions between aerosols and meteorology have received increasing attention in recent decades. Through interactions with radiation, aerosols involve in thermodynamic processes and cause cloud adjustment, referred to as the direct and semi-direct effects respectively. They also involve in cloud microphysical processes by severing as cloud condensation nuclei or ice nuclei, referred to as indirect effect. Aerosol direct effect is found to potentially exacerbate air quality by stabilizing the planetary boundary layer (PBL). However, their impacts through the interaction with clouds, including semi-direct and indirect effect remain unclear. In this study, we conducted model simulations to evaluate the direct, semi-direct and indirect effects of aerosols in PBL structure and surface PM2.5 concentration during three heavy haze events under overcast conditions. Overall, the aerosol-PBL feedback results in a 22%–36% decrease of PBL height and 5%–28% increase of PM2.5 concentration. The indirect effect always has the largest impact on PBL and PM2.5 pollution, accounting for 59%–84% of the changes. The semi-direct effect is the weakest on average, although it can exceed the direct effect at certain times and locations. Black carbon aerosols play the vital role in both the direct and semi-direct effects. Our findings promote the understanding of heavy haze formation, and highlight the dominant role of aerosol-cloud interaction in the feedback process of aerosols to PBL structure and air quality.
Introduction
Rapid industrialization and urbanization in China have been accompanied by frequent occurrence of heavy haze in the past decade (Chandran Govindaraju and Tang, 2013; Li et al., 2016). High intensity of anthropogenic emissions (Chan and Yao 2008; Huang et al., 2014a), fast formation of secondary aerosols (Huang et al., 2014b; Huang et al., 2021), as well as unfavorable meteorological conditions are identified as the main causes of aerosol pollution (Wu et al., 2013; Miao et al., 2017; Shu et al., 2017; Zhang et a., 2018a; Ning et al., 2018). Specifically, as air pollutants emitted from the ground are generally located within the planetary boundary layer, the structure and process of the PBL are critical in the formation of pollution events (Li et al., 2017; Miao and Liu, 2019; Miao et al., 2021).
Aerosol pollutions, on the other hand, interact with the atmosphere via complex mechanisms, which include the direct, semi-direct and indirect effect (IPCC, 2013). These interactions could in turn alter PBL height and structure, and thus inducing feedbacks to the surface pollutions. By scattering and/or absorbing radiation, aerosol direct effect may lead to cooling at surface and warming aloft in the daytime, which suppresses the development of PBL (Ding et al., 2013; Wilcox et al., 2016; Zhong et al., 2019; Su et al., 2020). This further induces a positive feedback to air pollution through the accumulation of primary pollutants as well as the acceleration of secondary aerosols formation (Petäjä et al., 2016; Tie et al., 2017; Liu et al., 2018a; Miao et al., 2019). More specifically, black carbon (BC) has been identified as the key component in exacerbation of air quality, due to its strong light absorption and radiative heating effect (Bond et al., 2013; Wang et al., 2013; Ding et al., 2016; Wang et al., 2018; Liu et al., 2019). Previous studies have estimated that magnitude of surface PM2.5 concentration enhancement through aerosol direct effect vary from a few percent to around 30% throughout severe haze events over Northern China (Wang et al., 2014a; Wang et al., 2014b; Wang et al., 2015; Wu et al., 2019; Li et al., 2020; Wang et al., 2021). However, these studies mainly focus on the direct effect under clear sky conditions. There is still lack of investigation of the semi-direct and indirect effect when there are clouds.
Over Southern China, heavy pollution and clouds frequently coexist during the winter season (King et al., 2013; Song et al., 2017; Ye et al., 2018), which involves active interaction between aerosols and clouds. It is therefore crucial to evaluate the feedbacks of aerosols to PBL and surface pollution under cloudy conditions. Previous studies have revealed that BC may heat the cloud layer and promote cloud evaporation (semi-direct effect; Hansen et al., 1997; Ackerman et al., 2000; Koch and Del Genio, 2010). The reduction of cloud cover can increase the shortwave flux reaching the surface, which may offset or even dominate over the direct effect (Forkel et al., 2012; Liu et al., 2018b). Given its opposite impact through direct and semi-direct effect, it is intriguing to know whether BC will enhance or reduce pollution under cloudy conditions. In addition, Zhao et al. (2017) also pointed out the critical role of indirect effect in aerosol-PBL feedback, which increases cloud droplet number concentration (CDNC) and liquid water path (LWP), decreases net shortwave flux at surface and suppresses the development of PBL, therefore resulting in an up to 25% enhancement of aerosol concentration.
Although considerable efforts have been made to quantify aerosol feedbacks, the relative effect of aerosol-cloud interaction to the direct effect remain uncertain as previous studies give different estimates (Zhang et al., 2015; Gao et al., 2015; Gao et al., 2016; Zhang et al., 2017; Zhang et al., 2018b; Gao et al., 2020). Moreover, few studies have investigated the mechanism of aerosol semi-direct effect on PBL and surface pollution, or quantified its contribution. However, it is necessary to isolate the direct and semi-direct effect as their impact on PBL become much more complex when they coexist. In light of the above discussion, here we aim to evaluate the individual contribution of aerosol direct, semi-direct as well as indirect effects to PBL structure and surface pollution during haze events under cloudy conditions, and to identify the dominant effect.
Methods
Model configurations
In this study, we use Weather Research and Forecasting model coupled to Chemistry (WRF-Chem) (Grell et al., 2005) to investigate aerosol effects during the typical haze events in three megacities in China characterized with high cloud fraction. This model fully couples meteorology with chemistry, which simulates aerosol radiative effect (including direct and semi-direct effect) as well as indirect effect. We conduct the simulation with three nested domains. The horizontal resolutions are 30 km, 6 km, and 3 km for domain 1 (outmost), domain 2 (middle), and domain 3 (innermost), respectively. The outermost domain 1 covers most parts of China. While the innermost nested domain 3 covers the studied city, including Shanghai, Wuhan and Zhengzhou respectively, with 130 × 130 grid cells (Figure 1). The vertical grids include 47 layers from the surface to 100 hPa with denser layers within the PBL. Meteorological initial and lateral boundary conditions are obtained from the National Centers for Environmental Prediction’s Final Analysis data at 1-degree horizontal resolution and 6-h temporal intervals. Four dimensional data assimilation (FDDA) is utilized during the model spin up period, which lasted for 3 days. Surface and radiosondes observational weather data are also assimilated in the simulations using WRF OBSGRID program, which significantly improves the simulated cloud properties. Note that all the assimilation is turned off in the innermost domain throughout the experiment to allow full aerosol-cloud-radiation interactions. Anthropogenic emissions in China are obtained from the Multi-resolution Emission Inventory for China (MEIC) (Liu et al., 2016). Daily biomass burning emissions in 2016 at spatial resolution of 1 km are obtained from the Fire Inventory from NCAR version-1.5 (FINNV1.5) (Wiedinmyer et al., 2011). Biogenic emissions are calculated online in WRF-Chem using the MEGAN algorithm version 2 (Guenther et al., 2006). Dust emissions follows Shao. (2001).
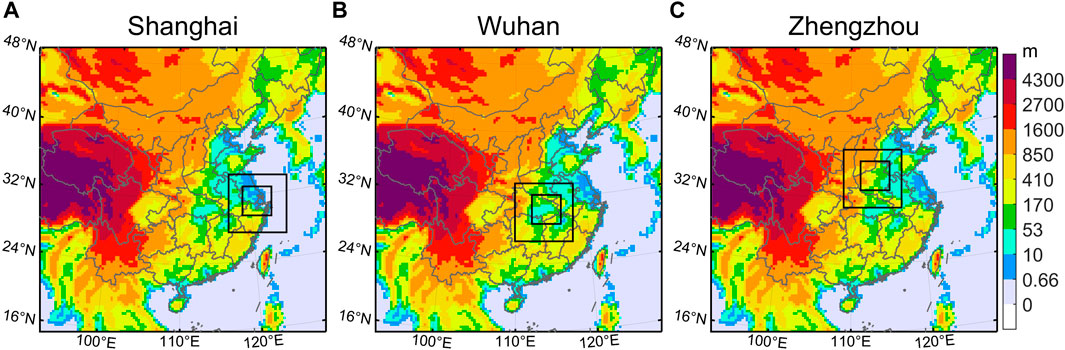
FIGURE 1. The WRF-Chem modeling domain for the case of (A) Shanghai, (B) Wuhan, and (C) Zhengzhou. The outmost region represents domain 1, while the black rectangle in the middle represents domain 2, and the innermost black rectangle represents domain 3.
The Carbon-Bond Mechanism version Z (CBM-Z) gas-phase chemistry mechanism (Zaveri and Peters, 1999) as well as the Model for Simulating Aerosol Interactions and Chemistry (MOSAIC 4-bins) aerosol module (Zaveri et al., 2008) are employed in the model. For aerosol radiative effect, aerosol optical properties are calculated based on the Mie theory assuming internally mixing of chemical compositions (Barnard et al., 2010), and passed to RRTMG radiation scheme (Iacono et al., 2008). For aerosol indirect effect, aerosol activations are parameterized with the scheme of Abdul-Razzak and Ghan (2002). CDNC derived according to the aerosol activations is passed to the RRTMG radiation and Lin microphysics scheme (Lin et al., 1983), to affect the optical properties of cloud and the collision and coalescence rates of cloud droplets to form raindrops, respectively. In addition, we increase the lower limit of the PBL mixing coefficient for aerosols and gases in order to improve model representation of vertical distribution as well as diurnal variation of PM2.5 concentration, following Du et al. (2020). Main physical and chemical parametrizations adopted in this study are as summarized in Supplementary Table S1.
To achieve better representativeness, we adopt an ensemble approach in our simulation of Shanghai case. The initial ensemble is generated with the three-dimensional variational data assimilation system of the WRF (WRF-3DVAR) (Barker et al., 2004) using cv5 option. Perturbation standard deviations generated based on model error covariance are approximately 1 K for the potential temperature, 1 g/kg for the water vapor mixing ratio, 0.5 m/s for the horizontal wind components and 0.2 hPa for the pressure. Perturbations are added to the initial field of the base simulation (first member) in the innermost domain to form a total of 10 ensemble members in our study. Our method in generating ensemble initials using WRF-3DVAR follows Barker (2005) and Meng and Zhang. (2008).
Isolating the direct and semi-direct effect
In particular, we develop a novel scheme, as shown in Figure 2, to separate the direct and semi-direct effect of aerosols. A set of three model experiments are designed: without aerosol radiative feedback (ExpA), with aerosols radiative feedback (ExpC), and an intermediate experiment (ExpB). Among them, the differences between ExpA and ExpC represent total aerosol radiative effect. While in ExpB, cloud properties are imported from ExpA and aerosol optical properties are imported from ExpC, which are the key procedures to isolate the direct and semi-direct effect. As can be seen, the only differences between ExpA and ExpB are the aerosol optical properties, which represent direct effect. The only differences between ExpB and ExpC are the cloud properties, which represent semi-direct effect. Similar framework in isolating direct effect and cloud response has been adopted in previous studies, in which aerosol optical properties and clouds are imported into multiple diagnostic radiation routines, in order to separate the radiative forcing by these effects (Liu et al., 2018b; Ghan et al., 2012). In our study, aerosol optical properties and clouds are imported into the meteorology chemistry model WRF-Chem to force the simulation, so that we can not only evaluate changes of radiative flux from radiation module, such as net shortwave flux at surface shown in this study, but also evaluate changes of PBL structure and surface PM2.5 concentration due to direct or semi-direct effect.
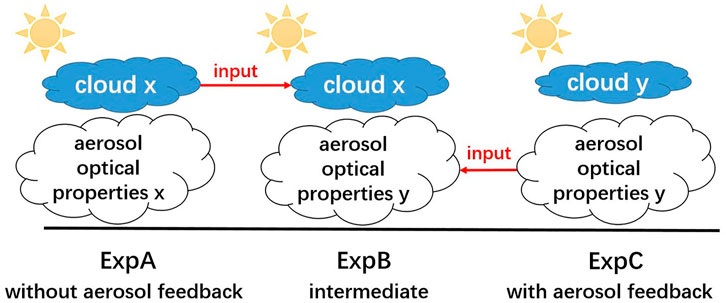
FIGURE 2. Schematic illustration of the experiment design in isolating aerosol direct and semi-direct effect using WRF-Chem. ExpA is conducted without aerosol feedback, ExpC is conducted with aerosol feedback. While in ExpB, cloud properties are imported from ExpA and aerosol optical properties are imported from ExpC. Therefore, the only differences between ExpA and ExpB are the aerosol optical properties, which represent the direct effect. The only differences between ExpB and ExpC are the cloud properties, which represent the semi-direct effect.
More specifically, our experiments are conducted in two steps. In step one, ExpA and ExpC are conducted without and with aerosol radiative feedback, respectively, during which aerosol optical properties and cloud properties are exported and saved. In step two, we perform ExpB with cloud properties imported from ExpA and aerosol optical properties imported from ExpC. We also re-run ExpA and ExpC with cloud and aerosol optical properties imported from their respective output from step one. All model settings are the same in three experiments except for the imported variables during step two.
Our imported variables of aerosol optical properties include shortwave aerosol optical depth, single-scattering albedo, and asymmetry factor at all four wavelengths, as well as longwave aerosol optical depth at all sixteen wavelengths in WRF-Chem. Our imported variables of cloud properties consist of number concentrations of cloud droplet as well as mixing ratios of water vapor and five hydrometeors, including cloud droplets, cloud ice, rain, snow and graupel. Note that microphysics latent heat is also imported, since it is entirely dependent on cloud properties (neglecting the influence of temperature change on specific heat of vaporization, which is about 0.1% per degree centigrade at 10°C). Three-dimensional cloud properties are imported at an interval of 36 s, which is three times the integration time step, and aerosol optical properties are imported at an interval of 5 min, shorter than the interval between radiation module calls. To reduce the error induced by the time interval of data input, temporal resolutions of the imported data are set sufficiently high, as described above. These data require large computer storage. Therefore, our experiment runs are shorter than 1 day due to the limited storage.
Scenario design
Table 1 shows the scenarios in our study, and their corresponding experiments in the above framework are shown in Figure 2. For isolating the direct and semi-direct effects by all aerosols, ExpC represents the BASE300 scenario where all aerosols radiative feedback is turned on. ExpA represents the AeroRadoff scenario, in which aerosol radiative effect is turned off (i.e., aerosol optical depth are set to zero), and the intermediate ExpB represents the AeroRadoff_int scenario. Therefore, direct and semi-direct effect by all aerosol species can be calculated as AeroRadoff_int minus AeroRadoff and BASE300 minus AeroRadoff_int, respectively. For isolating the direct and semi-direct effects by BC, ExpC also represents the BASE300 scenario, while ExpA represents the AeroRadexBC scenario, in which only BC radiative effect is turned off (i.e., mass, volume and number concentrations of BC are set to zero in the Mie-scattering module), and the intermediate ExpB represents the AeroRadexBC_int scenario. Therefore, direct and semi-direct effect by BC can be calculated as AeroRadexBC_int minus AeroRadexBC and BASE300 minus AeroRadexBC_int, respectively. Note that CDNC is fixed at 300 cm−3 in all five scenarios for the evaluation of aerosol radiative effect, including BASE300, AeroRadoff, AeroRadexBC, AeroRadoff_int and AeroRadexBC_int, in order to fix the indirect effect.
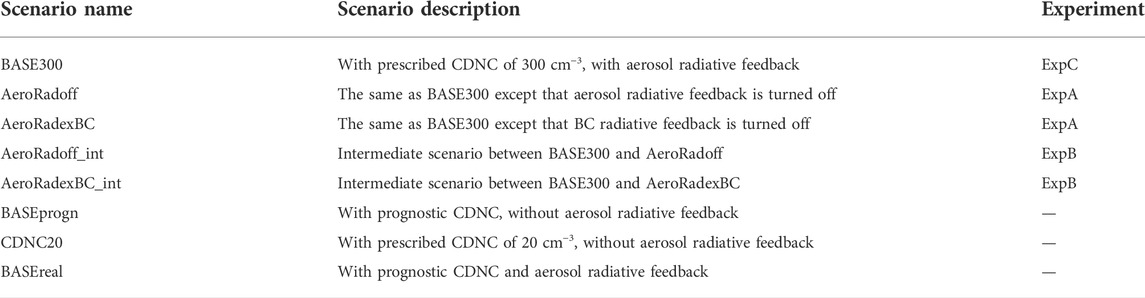
TABLE 1. Scenarios for modeling aerosol effects, and their corresponding experiment in the framework of isolating aerosol direct and semi-direct effect illustrated in Figure 2. The first five scenarios, including BASE300, AeroRadoff, AeroRadexBC, AeroRadoff_int, and AeroRadexBC_int, are designed to evaluate the direct and semi-direct effect. BASEprogn and CDNC20 scenarios are designed to evaluate the indirect effect. Total aerosol effect is calculated based on the difference between BASEreal and CDNC20 scenarios.
Indirect effect is calculated based on BASEprogn and CDNC20 scenarios in which different settings of cloud droplet number concentration (CDNC) are adopted, following Zhao et al. (2017) and Zhang et al. (2018b). The first one is conducted with prognostic CDNC, which represents indirect effect in actual polluted conditions. While the second one is conducted with prescribed spatially uniform CDNC of 20 cm−3, which represents indirect effect in clean conditions. Aerosol radiative feedback is turned off (aerosol optical depth are set to zero) in the above two scenarios in order to fix aerosol radiative effect. Total aerosol effect (including direct, semi-direct and indirect effect) is calculated based on the difference between BASEreal and CDNC20 scenarios. The BASEreal scenario is conducted with prognostic CDNC and aerosol radiative feedback.
Process analysis scheme
From the original WRF-Chem model output variables, it is difficult to quantify the contribution of each detailed physical process. This brings obstacles to the analysis of how aerosols affect changes of temperature and water vapor. Therefore in our process analysis scheme, the temperature or water vapor change is decomposed into contributions of individual physical process. To be more specific, we first decouple the air masses and map factors from the tendencies of each physical process in the original Runge-Kutta 3rd order scheme, and then integrate these tendencies over time separately, so that they can be directly compared with the total change of variables, including temperature and water vapor. Since during each integration time step in the original WRF-Chem, the change of temperature or water vapor mixing ratio is calculated as the sum of each individual physical process, therefore total change of model temperature or water vapor integrated over time is equal to the sum of our integrated tendencies from each physical process. Note that interaction between different processes may be possible but is not considered in the model. Detailed analysis are given in Section 3.3
Results
Model evaluations
We selected three cases in this study, including the case of Shanghai on 19 Nov 2016, case of Wuhan on 4 Jan 2016 and case of Zhengzhou on 12 Feb 2016. All three cases are characterized by high cloud cover and heavy pollution. The model performances are evaluated against the Level 2 Cloud product from the Moderate Resolution Imaging Spectroradiometer (MODIS) on the Aqua satellite, radiosondes as well as in-situ observations of meteorological factors and PM2.5 concentration (Figure 3; Supplementary Figures S1−S3). Note that for the case of Shanghai, observations are compared to model simulation of the first ensemble member, since all other ensemble members are perturbed based on it. We can see from Supplementary Figure S1 that all three cases are characterized with heavy pollution and high cloud fraction, yet with different amounts of LWP. From 7:00 to 17:00 LT, mean LWP in the base simulation (BASEreal) over the box region of Figures 3D–F are 128.1, 186.4 and 304.0 g/m2, respectively. Simulated mean PM2.5 concentrations corresponding to in-situ sites are 120.3, 186.9 and 197.8 μg/m3, respectively (Figures 3G–I). It can be seen that the model simulations capture the mean PM2.5 concentration as well as the spatial distribution of clouds very well. Note that most previous model experiments of aerosol effects have substantially underestimated the cloud fraction and LWP over China in winter, by more than 30 and 50%, respectively. This has been a common problem in chemical transport models (Chen et al., 2015; Cai et al., 2016; Liu et al., 2016; Zhao et al., 2017), which can result in considerable underestimation of semi-direct and indirect effects in aerosol-PBL feedbacks. To address this problem, we assimilated the radiosonde observational dataset in the simulations (see Section 2.1), which significantly improves the simulated cloud properties.
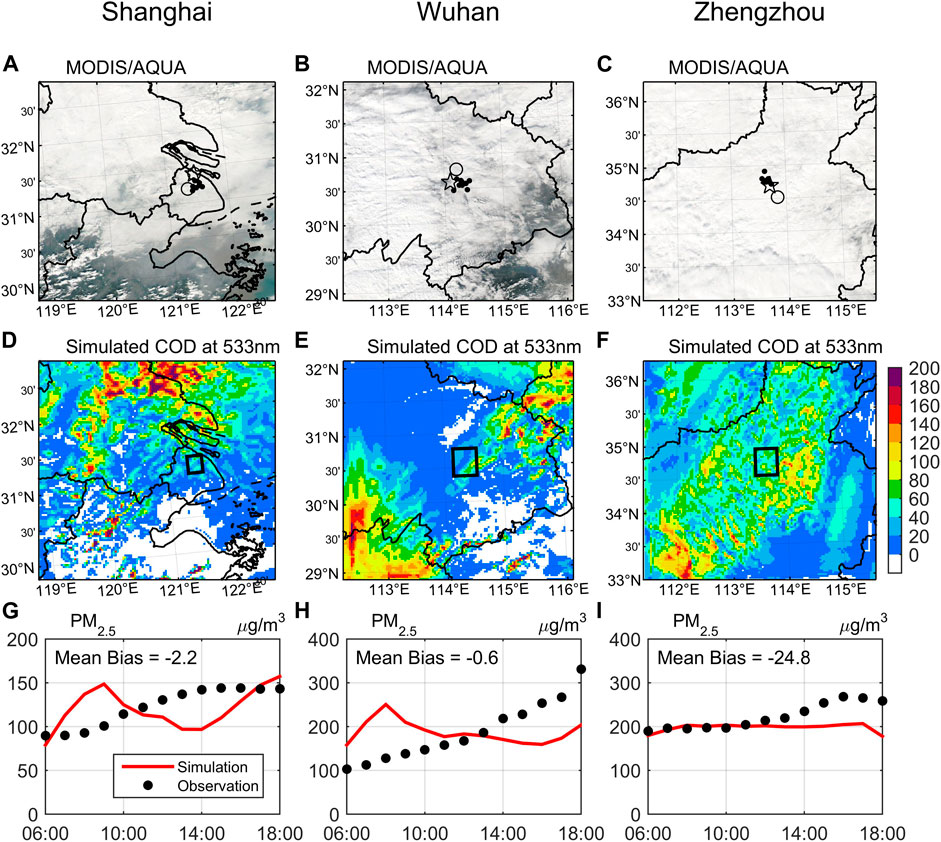
FIGURE 3. Evaluation of model performance. Left, middle and right column represents the cases of Shanghai (2016.11.19), Wuhan (2016.01.04) and Zhengzhou (2016.02.12), respectively. (A–C) Spatial distribution of corrected reflectance (true color) of MODIS/AQUA projected onto the simulation domain. Black dots, circles as well as pentagrams mark the locations of the in-situ measurements for PM2.5 concentrations and meteorological factors, as well as radiosondes observations, respectively. (D–F) Spatial distribution of simulated cloud optical depth (COD) at 14:00LT. (G–I) Time series of simulated and observed PM2.5 concentrations at ground stations.
Quantifying the aerosol effects
In all three cases characterized by heavy pollution and high cloud fraction, aerosol total effect (BASEreal minus CDNC10) results in significant decrease in surface net shortwave flux and PBL height in the daytime (from 7:00 to 17:00 LT), which greatly enhances PM2.5 pollution. Over the box regions of Shanghai, Wuhan and Zhengzhou (Figures 3D–F), decrease of net shortwave flux due to aerosol total effect are −106.9 ± 25.7 (−48.4 ± 11.7%), −96.6 (−62.2%) and −49.6 W/m2 (−60.5%), respectively. Decreases of PBL height due to aerosol total effect are −187.1 ± 53.0 (−30.3 ± 8.6%), −129.4 (−35.8%) and −78.3 m (−21.5%), which increase surface PM2.5 concentration by +24.3 ± 10.4 (+27.0 ± 11.6%), +12.0 (+7.9%) and +8.5 μg/m3 (+4.5%), respectively (Figures 4A–C, Supplementary Figures S4A−C, S7A−C). This considerable enhancement of PM2.5 pollution highlights the importance of aerosol-PBL feedback under cloudy conditions.
We mainly discuss the case of Shanghai in the following main body part, while the detailed results of the other two cases are shown in the Supplementary Material (Supplementary Figures S4−S9). To be more specific, the direct effect is evaluated from the AeroRadoff_int and AeroRadoff scenarios (Figures 4D–F). This effect reduces net shortwave flux at surface and PBL height by −31.0 ± 12.6 W/m2 (−14.0 ± 5.7%) and −61.1 ± 27.0 m (−9.9 ± 4.4%), respectively, leading to an increase of PM2.5 concentration by 5.9 ± 2.1 μg/m3 (+6.6 ± 2.3%), averaged over the box region in Shanghai. The aerosol semi-direct effect is determined based on the BASE300 and AeroRadoff_int scenarios, which is generally opposite to and weaker than the direct effect on average according to Figures 4G–I. Over the box region in Shanghai, aerosol semi-direct effect changes surface net shortwave flux, PBL height and PM2.5 concentration by +0.7 ± 5.7 W/m2 (+0.3 ± 2.7%), +10.4 ± 9.3 m (+1.7 ± 1.5%) and −0.14 ± 1.1 μg/m3 (−0.15 ± 1.2%), respectively. However, note from Supplementary Figures S7F,I that magnitude of semi-direct effect exceed the direct effect locally in the case of Wuhan at 34.0°N, 112.4°E. Furthermore, it can be seen from Figures 4J–L that the indirect effect (BASEprogn minus CDNC20) dramatically alters net shortwave flux at surface and PBL height by −82.5 ± 32.9 W/m2 (−37.3 ± 14.9%) and −140.8 ± 69.1 m (−22.8 ± 11.2%), respectively, thereby increasing PM2.5 concentration by 18.5 ± 9.9 μg/m3 (+20.6 ± 11.1%) over the box region of Shanghai, largely exceeding the changes induced by the direct and semi-direct effect. It is also noted that the spatial pattern of aerosol total effect is closely related to that of the indirect effect. Therefore, indirect effect plays the dominant role in decreasing surface net shortwave flux and PBL height, as well as in increasing PM2.5 concentration in the Shanghai Case.
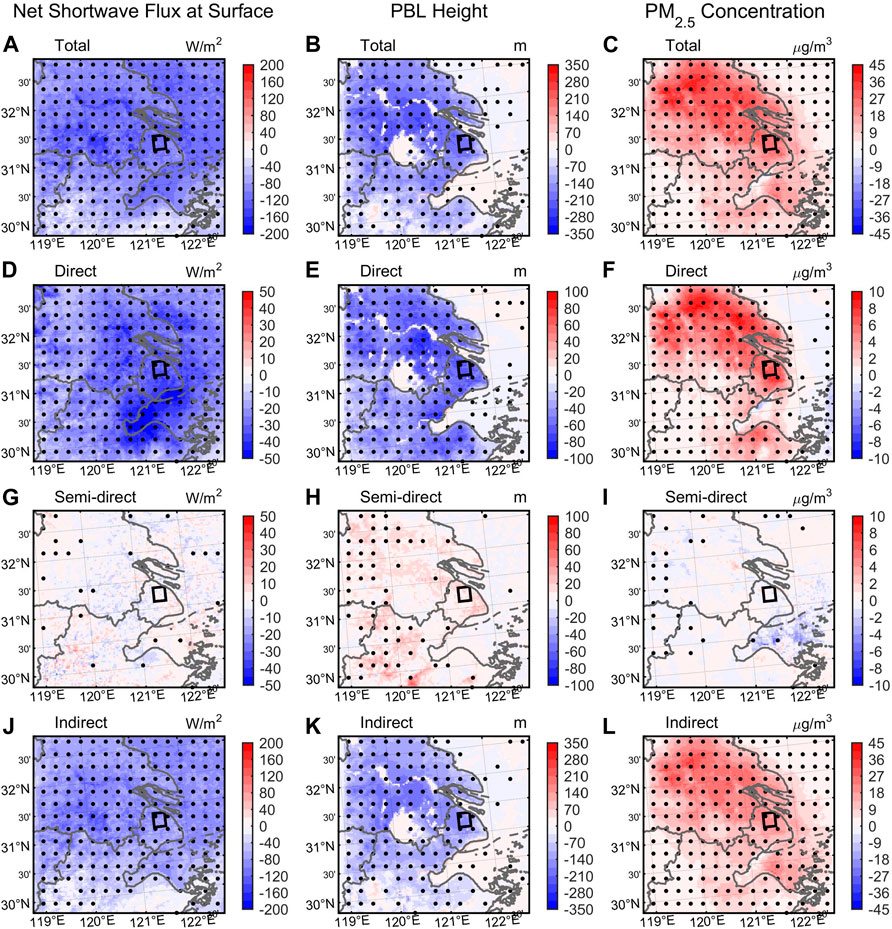
FIGURE 4. Spatial distribution of ensemble mean aerosol effect on net shortwave flux at surface (left column), PBL height, (middle column), PM2.5 concentration (right column) in the Shanghai Case, averaged from 7:00 to 17:00 LT. (A–C) The total effect, calculated as BASEreal minus CDNC20. (D–F) The direct effect, calculated as AeroRadoff_int minus AeroRadoff. (G–I) The semi-direct effect, calculated as BASE300 minus AeroRadoff_int. (J–L) The indirect effect, calculated as BASEprogn minus CDNC20. Stilted grids indicate significant differences at the 5% significance level. The box regions in the city center are used for calculating mean values in the horizontal direction.
Figure 5 compares the time series of ensemble mean and standard deviation of aerosol effects over the box region of Shanghai. The indirect effect, scaled by a factor of 0.5 in this figure, again turns out to be the dominant effect on surface shortwave flux, PBL height and PM2.5 concentration, which also has the largest spread. Direct effect by all aerosol species has greater impact and uncertainty than the semi-direct effect on the whole, and their signs are generally opposite. Still, magnitude of semi-direct effect can exceed direct effect at certain times. For example, magnitude of PM2.5 concentration change due to semi-direct effect (−3.6 μg/m3; −3.9%) exceeded the direct effect (+3.2 μg/m3; +3.5%) at 10:00 LT in ensemble member 10 (figure not shown).
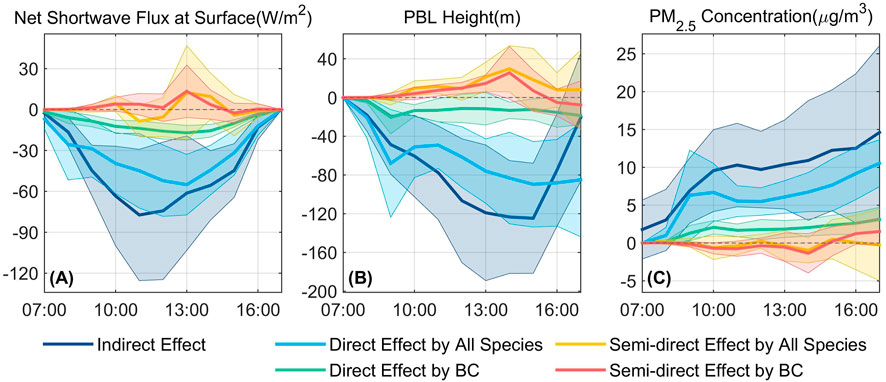
FIGURE 5. Time series of ensemble mean aerosol effect on (A) net shortwave flux at surface, (B) PBL height and (C) PM2.5 concentration in the Shanghai case, averaged over the box region marked in Figure 3D. Shaded areas represent ensemble standard deviations. Note that indirect effect is scaled by a factor of 0.5 in this figure.
Because BC is previously indicated as an important contributor of aerosol radiative effect (e.g., Bond et al., 2013; Wang et al., 2013; Ding et al., 2016), we separately examine the radiative effect of BC by switching its radiative feedback on and off in BASE300 and AeroRadexBC scenarios, respectively. Similarly, the differences between AeroRadexBC_int and AeroRadexBC scenarios represent BC’s direct effect, and the differences between the BASE300 and AeroRadexBC_int scenarios represent its semi-direct effect. Although mass concentration of BC only accounts for about 5% of PM2.5, its direct effect on net shortwave flux at surface, PBL height and PM2.5 concentration reaches ∼30% of all aerosol species (Figure 5). Its semi-direct effect is also roughly equal to that of all aerosol species, indicating that BC played the dominant role in semi-direct effect, which is in accordance with Fan et al. (2008). We also notice that semi-direct effect by BC is generally opposite to its direct effect. It is noted that although semi-direct by BC is weaker than its direct effect on surface net shortwave flux, PBL height as well as PM2.5 concentration on average, the spreads of its semi-direct effect are greater than its direct effect. Ensemble mean magnitude of increase of PBL height by BC semi-direct effect (+25.6 m; +2.6%) even exceeded the decrease by its direct effect (−13.2 m; −1.3%) at 14:00 LT. The reduction of PM2.5 concentration due to BC semi-direct exceeded its direct effect at 14:00 LT in ensembles 1, 2 and 6 (figure not shown).
The time for the maximum ensemble mean reduction of PM2.5 concentration due to the semi-direct effect is 14:00 LT for BC (−1.4 μg/m3; −2.0%) as well as all aerosol species (−1.0 μg/m3; −1.4%), which roughly correspond to the time for the maximum increase of PBL height, but is an hour after the maximum increase of surface shortwave flux. The cause of this delay is that surface shortwave flux largely determines the growth rate of PBL (Stull, 1988), while the height of PBL is determined by its integral.
The direct and semi-direct effect of BC as well as all aerosol species, together with the indirect effect in all three cases, are compared in Figure 6. The indirect effect, scaled by a factor of 0.5, has the largest impact on average among all aerosol effects, highlighting its dominant role under cloudy scenes (increasing PM2.5 concentration by +3% ∼ +21%). Direct effect exhibits the second largest impact on average, increasing PM2.5 concentration by +1% ∼ +7% (+1% ∼ +2%) due to all aerosol species (only BC). Both direct and indirect effects reduce surface shortwave flux, suppress the development of the PBL and enhance PM2.5 pollution. The semi-direct effect shows the least impact in these cases, which either decreases or slightly increases PM2.5 concentration by −0.2% ∼ +0.02% (−0.3% ∼ −0.07%) for all aerosol species (BC only), caused by the complex responses of clouds with either decreased or slightly increased LWP.
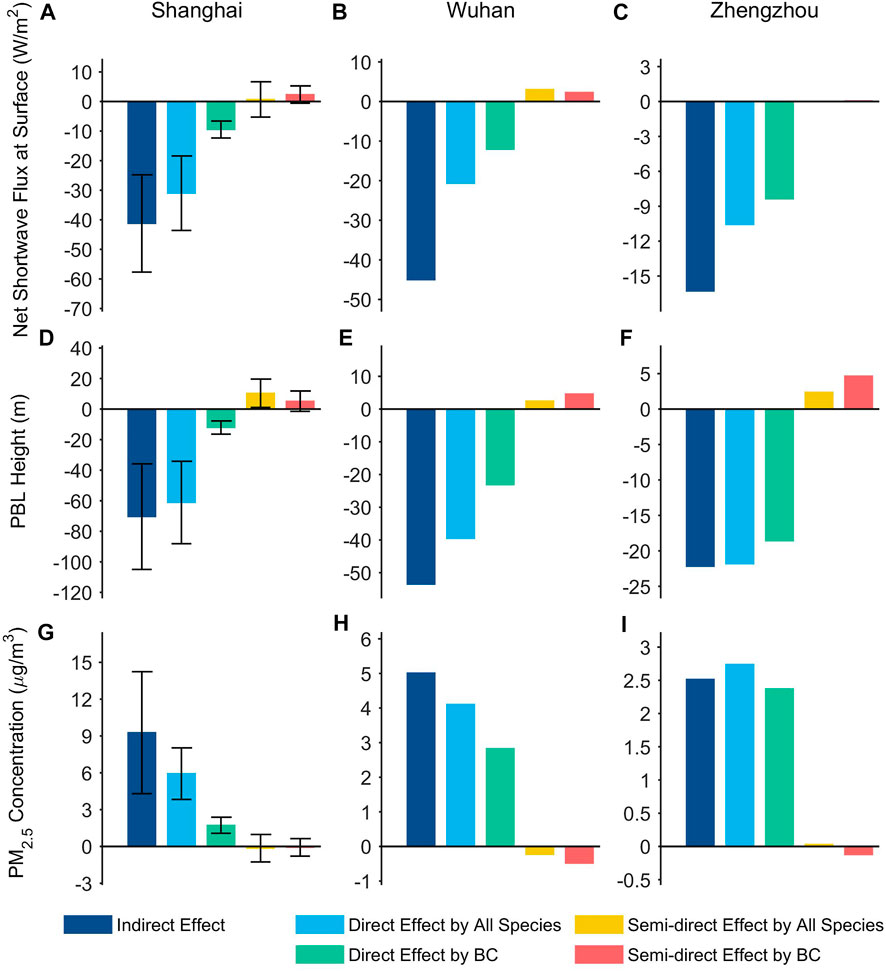
FIGURE 6. Bar plot of aerosol effect in cases of Shanghai (left column), Wuhan (middle column) and Zhengzhou (right column). (A–C) Aerosol effect on net shortwave flux at surface. (D–F) Aerosol effect on PBL height. (G–I) Aerosol effect on surface PM2.5 concentration. All variables are averaged from 7:00 to 17:00 LT over the box regions marked in Figure 3. For the case of Shanghai, bars and error bars represent ensemble means and standard deviations, respectively. Note that the indirect effect is scaled by a factor of 0.5 in this figure.
Analyzing aerosol-PBL feedback through semi-direct effect
Next, we examine detailed changes of the physical processes caused by the semi-direct effect, which refers to the impact of cloud response to aerosol-radiation interactions on PBL structure and PM2.5 concentration. Two key questions are: 1) How aerosol-radiation interactions affect the cloud? 2) How cloud response affects PBL structure and PM2.5 concentration? We give a special emphasize on BC, since in the last section we have demonstrated that BC dominates in the semi-direct effect. The time-height cross section of the variables related to BC and cloud in Shanghai case are analyzed in Figure 7. For the base simulation (BASE300), clouds reside below 1,000 m near the PBL top in the morning and extend to about 2,000 m in the afternoon (Figure 7A). On the other hand, BC aerosols are mostly located within the PBL, with only a small portion above its top (Figure 7D). Due to the radiative effect of BC, cloud fraction reduced in the morning (before 13:00 LT) but increased in the afternoon (after 14:00 LT) (Figure 7B). This pattern corresponds to the change of RH, caused by the rise of temperature in the morning and increase of water vapor in the afternoon (Figures 7C,E,F).
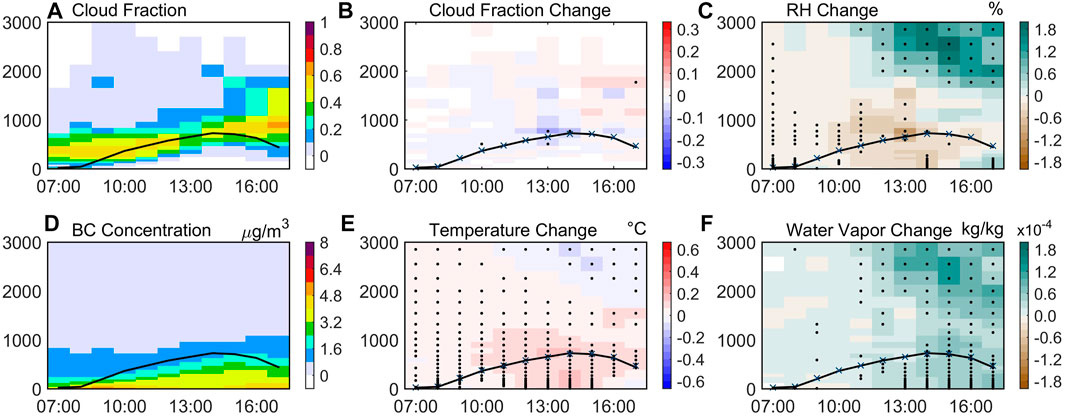
FIGURE 7. Time series of ensemble mean vertical distributions (time-height section) of variables in the Shanghai case, averaged over the box region shown in Figure 3D. (A) Simulated cloud fraction. (D) Simulated BC concentration. (B,C,E,F) Change of simulated cloud fraction, relative humidity, temperature and water vapor mixing ratio caused by BC radiative effect, respectively. Black solid lines represent PBL height in the simulation with BC radiative feedback (BASE300). Blue crosses represent PBL height in the simulation with aerosol radiative feedback except BC. (AeroRadexBC). Stilted grids indicate significant differences at the 5% significance level.
We further use the process analysis scheme described in Section 2.4 to investigate the underlying causes of temperature and water vapor change. Figure 8A shows the temperature change due to the radiative effect of BC. Figures 8B–F shows the contribution of each detailed physical process, the sum of which is equal to the total temperature change. We can see that the increase in temperature above the PBL is mainly caused by shortwave heating of BC, which leads to the reduction of cloud fraction in the morning. On the other hand, change of water vapor mixing ratio is also isolated in Figure 9, showing that the change of advection results in the increase of water vapor above the PBL, which serves to increase cloud fraction in the afternoon.
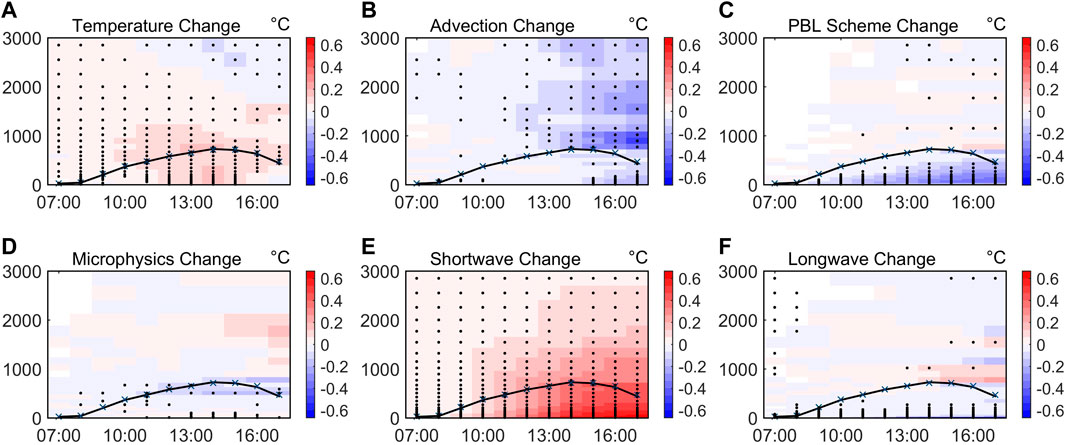
FIGURE 8. Process analysis of ensemble mean temperature change by BC radiative effect in time-height section in the Shanghai case, averaged over the box region shown in Figure 3D. (A) Simulated temperature change. (B–F) Simulated accumulated temperature change due to advection, PBL scheme (including surface heat flux and vertical turbulent mixing), microphysics process, shortwave heating and longwave heating, respectively. The sum of each individual process (B–F) equals to the total temperature change in (A). Black solid lines represent PBL height in the simulation with aerosol radiative feedback (BASE300). Blue crosses represent PBL height in the simulation with aerosol radiative feedback except BC. (AeroRadexBC). Stilted grids indicate significant differences at the 5% significance level.
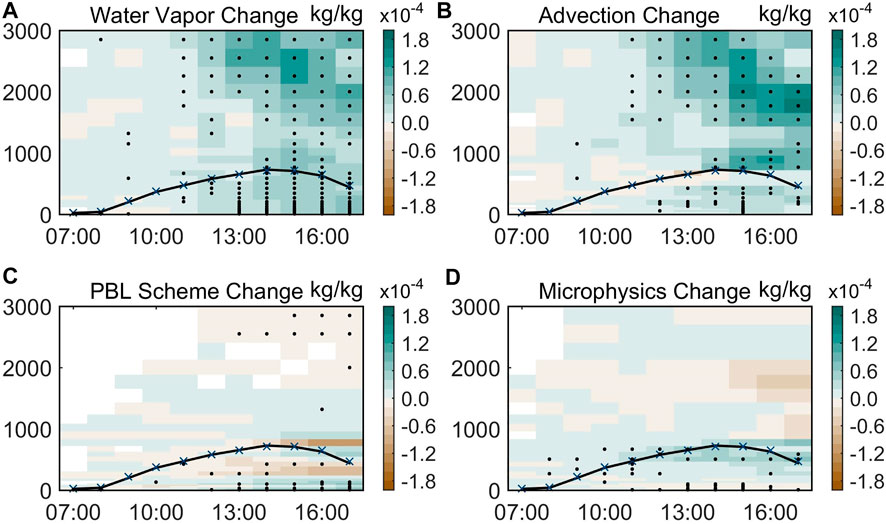
FIGURE 9. Process analysis of ensemble mean water vapor change by BC radiative effect in time-height section in the Shanghai case, averaged over the box region shown in Figure 3D. (A) Simulated water vapor change. (B–D) Simulated accumulated water vapor change due to advection, PBL scheme (including surface evaporation and vertical turbulent mixing) and microphysics process, respectively. The sum of each individual process (B–D) equals to the total temperature change in (A). Black solid lines represent PBL height in the simulation with aerosol radiative feedback (BASE300). Blue crosses represent PBL height in the simulation with aerosol radiative feedback except BC. (AeroRadexBC). Stilted grids indicate significant differences at the 5% significance level.
Cloud responses could further influence PBL structure and PM2.5 concentration. In the morning, the reduction of cloud fraction gives rise to the increase of surface shortwave flux, together with latent heat cooling near PBL top (Figure 5A, Figure 8D), both of which promoted the development of PBL and reduced PM2.5 concentration (Figures 5B,C). However, the increase of cloud fraction in the afternoon induces a decrease of surface shortwave flux, which inhibits the further development of PBL and enhances PM2.5 pollution (Figure 5). The opposite impact of semi-direct effect in the morning and afternoon, as described above, weakens the magnitude of its average impact throughout daytime (from 7:00 LT to 17:00 LT), which also partly explains why influences of semi-direct effect are small on average (Figure 6).
Analyzing aerosol-PBL feedback through the indirect effect
Previous studies showed that the indirect effect could increase CDNC in warm clouds, which subsequently suppresses precipitation and increases LWP (Twomey, 1977; Albrecht, 1989). Both increased CDNC and LWP could result in a dramatic increase of COD, far exceeding the change caused by the aerosol radiative effect (Figure 10). This increased COD decreases net shortwave flux at surface, suppresses the development of the PBL and consequently enhances PM2.5 pollution. Furthermore, increased LWP and reduced precipitation could promote cloud chemistry and weaken wet scavenging of pollutant particles, both contributing to the growth of PM2.5 concentration. To evaluate the effect of these processes, we turn off cloud processing of aerosols (including cloud chemistry and wet scavenging) in the BASEprogn and CDNC20 scenarios and compare the differences. Without cloud processing of aerosols, mean changes of net shortwave flux at surface, PBL height and PM2.5 concentration induced by the indirect effect are −79.7 ± 33.4 W/m2 (−36.1 ± 15.1%), −137.4 ± 71.0 m (−22.2 ± 11.5%) and +9.0 ± 6.0 μg/m3 (+10.1 ± 6.7%), respectively. This increase in PM2.5 is much lower than that with cloud processing of aerosols (Section 3.2), indicating the important role of the latter process. Although large uncertainties in cloud processing of aerosols with model simulations exist (Gong et al., 2011; Lu and Fung, 2018), simulated indirect effect without this process is still larger than direct and semi-direct effect, which further confirmed the dominant role of indirect effect on PBL structure and PM2.5 pollution.
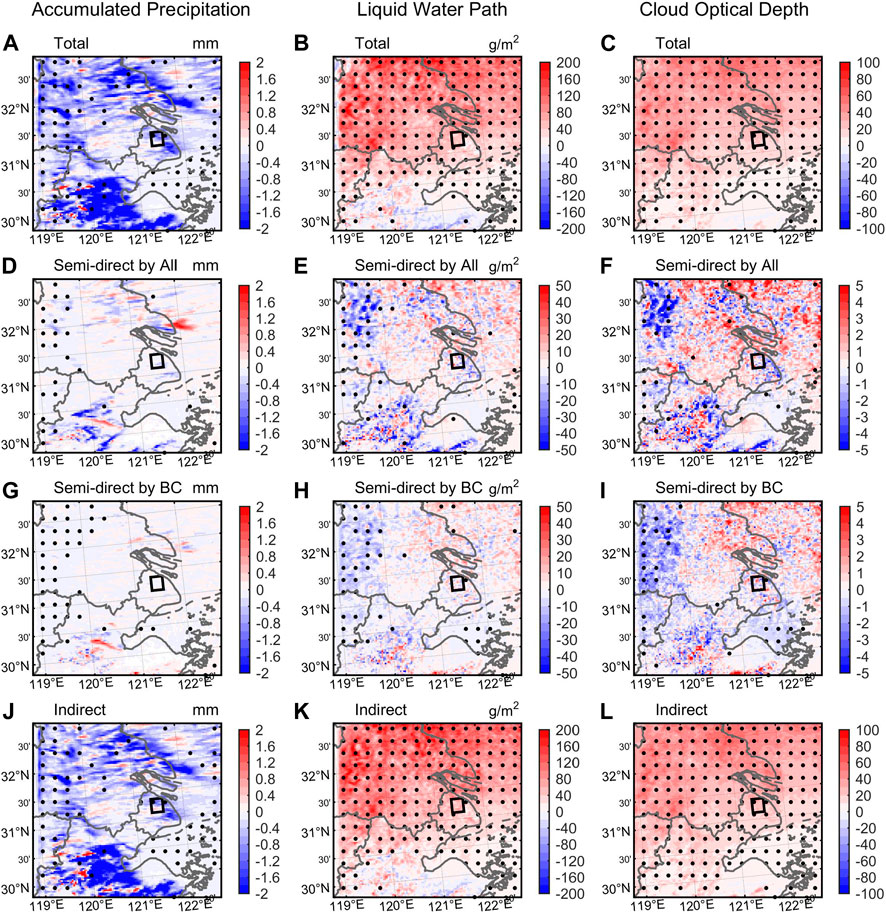
FIGURE 10. Spatial distribution of ensemble mean aerosol effect on accumulated precipitation (left column), liquid water path, (middle column), cloud optical depth (right column) in the Shanghai Case, averaged from 7:00 to 17:00 LT. (A–C) The total effect. (D–F) The semi-direct effect by all aerosol species. (G–I) The semi-direct effect by BC only. (J–L) The indirect effect. Stilted grids indicate significant differences at the 5% significance level. The box regions in the city center are used for calculating mean values in the horizontal direction.
Conclusion and discussions
In this study, we investigate the relative contributions of direct, semi-direct and indirect effects of aerosols in PBL-aerosol interaction under cloudy skies. We develop a new method to isolate the direct and semi-direct effect of aerosols in WRF-Chem, and compare their impacts with the indirect effect. Three haze events characterized with high cloud cover but different amounts of LWP are investigated. Our results show that the indirect effect have the dominant impact, which substantially increases COD, decreases surface net shortwave flux and PBL height and increases PM2.5 concentration by as much as +3% ∼ +21%. Enhanced cloud chemistry and weakened wet scavenging due to the indirect effect also elevate PM2.5 pollution level. Direct effect generally shows the second largest impact, which also decreases surface shortwave flux and PBL height, thereby increasing PM2.5 concentration by +1% ∼ +7%. Semi-direct effect has the least impact on average, but can still exceed direct effect at certain times and locations, which alters PBL structure through changes of COD and latent heat release and changes PM2.5 concentration by −0.2% ∼ +0.02%. In addition, we found that BC’s direct effect is about 30% of all aerosols (changing PM2.5 concentration by +1% ∼ +2%), and its semi-direct effect is roughly equal to that of all aerosols (changing PM2.5 concentration by −0.3% ∼ −0.07%), indicating its unique role in aerosol radiative feedbacks.
Our study suggests that the impacts of aerosols through clouds, especially the indirect effect, play the dominant role in their feedback processes to PBL structure and air quality under cloudy conditions. Note that most previous studies may substantially underestimate the indirect effect due to the underestimation of cloud fraction and LWP (see Section 3.1). Short-term aerosol indirect effect on surface pollution under persistent cloud cover were not compared to direct effect in these studies, so that the dominant role of aerosol-cloud interaction has not been pointed out. Some studies also showed that semi-direct effect could dominate over the indirect effect. However, these studies mainly focused on cloud fraction, convective available potential energy (CAPE) or precipitation (Ackerman et al., 2000; Koren et al., 2008; Rosenfeld et al., 2008; Fan et al., 2015), whereas in terms of the change of PBL structure and PM2.5 pollution, COD should be considered as a more influential factor, because change in COD is directly associated with the surface shortwave flux change which drives the development of PBL. Other studies also showed different results from ours that semi-direct effect may either dominate over or be overtaken by the direct effect through long-term model experiments (Forkel et al., 2012; Zhang et al., 2018b). These discrepancies may be attributed to differences in the temporal and spatial modeling scales, average cloud cover during the experiments, aerosol species and their vertical distributions. Therefore, further research on the sensitivity of PBL-aerosol interaction to different BC fractions, aerosol and cloud vertical distributions, as well as different cloud cover conditions is needed for more generalized conclusions. So far, the interactions between aerosols and clouds still represent the largest uncertainty in climate models. More observational studies are also needed to verify and to evaluate these aerosol feedbacks.
Data availability statement
We acknowledge National Climate Data Center and China National Environmental Monitoring Center for providing in-situ meteorological factors (https://gis.ncdc.noaa.gov/maps/ncei/cdo/hourly) and PM2.5 concentration observational datasets (https://quotsoft.net/air/). We acknowledge University of Wyoming for providing radiosondes observational datasets (http://weather.uwyo.edu/upperair/sounding.html) for model evaluation. Observational datasets of cloud properties for model evaluation are obtained from MODIS data website (https://ladsweb.modaps.eosdis.nasa.gov/search/). As for WRF-Chem model simulations, we thank National Center for Atmospheric Research (NCAR) and University Corporation for Atmospheric Research (UCAR) for providing meteorological initial and lateral boundary conditions (http://rda.ucar.edu/datasets/ds083.2/), surface and radiosondes observational weather data for model assimilation (https://rda.ucar.edu/datasets/ds461.0/; https://rda.ucar.edu/datasets/ds351.0/), chemical initial and boundary conditions, biomass burning emissions, biogenic emissions as well as source codes of WRF-Chem (https://www2.acom.ucar.edu/wrf-chem). Anthropogenic emission are developed by MEIC model group of Tsinghua University (http://www.meicmodel.org/dataset-mix.html).
Author contributions
Conceptualization, formal analysis, writing—original draft, writing—review, and editing: CX and JL; Methodology: CX and ZL; Data curation: CX and ZZ; Supervision, funding acquisition: JL.
Funding
This study is funded by National Natural Science Foundation of China (NSFC) Grant No. 41975023.
Conflict of interest
The authors declare that the research was conducted in the absence of any commercial or financial relationships that could be construed as a potential conflict of interest.
Publisher’s note
All claims expressed in this article are solely those of the authors and do not necessarily represent those of their affiliated organizations, or those of the publisher, the editors and the reviewers. Any product that may be evaluated in this article, or claim that may be made by its manufacturer, is not guaranteed or endorsed by the publisher.
Supplementary material
The Supplementary Material for this article can be found online at: https://www.frontiersin.org/articles/10.3389/fenvs.2022.1002412/full#supplementary-material
References
Abdul-Razzak, H., and Ghan, S. J. (2002). A parameterization of aerosol activation 3. Sectional representation. J. Geophys. Res. 107 (3), 1–6. doi:10.1029/2001jd000483
Ackerman, A. S., Toon, O. B., Stevens, D. E., Heymsfield, A. J., Ramanathan, V., and Welton, E. J. (2000). Reduction of tropical cloudiness by soot. Science 288 (5468), 1042–1047. doi:10.1126/science.288.5468.1042
Albrecht, B. A. (1989). Aerosols, cloud microphysics, and fractional cloudiness. Science 245 (4923), 1227–1230. doi:10.1126/science.245.4923.1227
Barker, D. M., Huang, W., Guo, Y. R., Bourgeois, A. J., and Xiao, Q. N. (2004). A three-dimensional variational data assimilation system for MM5: Implementation and initial results. Mon. Wea. Rev. 132 (4), 897–914. doi:10.1175/1520-0493(2004)132<0897:ATVDAS>2.0.CO;2
Barker, D. M. (2005). Southern high-latitude ensemble data assimilation in the antarctic mesoscale prediction system. Mon. Weather Rev. 133 (12), 3431–3449. doi:10.1175/MWR3042.1
Barnard, J. C., Fast, J. D., Paredes-Miranda, G., Arnott, W. P., and Laskin, A. (2010). Technical note: Evaluation of the WRF-chem “Aerosol chemical to aerosol optical Properties” module using data from the MILAGRO campaign. Atmos. Chem. Phys. 10 (15), 7325–7340. doi:10.5194/acp-10-7325-2010
Bond, T. C., Doherty, S. J., Fahey, D. W., Forster, P. M., Berntsen, T., DeAngelo, B. J., et al. (2013). Bounding the role of black carbon in the climate system: A scientific assessment. J. Geophys. Res. Atmos. 118 (11), 5380–5552. doi:10.1002/jgrd.50171
Cai, C., Zhang, X., Wang, K., Zhang, Y., Wang, L., Zhang, Q., et al. (2016). Incorporation of new particle formation and early growth treatments into WRF / Chem:Model improvement, evaluation, and impacts of anthropogenic aerosols over East Asia. Atmos. Environ. 124, 262–284. doi:10.1016/j.atmosenv.2015.05.046
Chan, C. K., and Yao, X. (2008). Air pollution in mega cities in China. Atmos. Environ. 42 (1), 1–42. doi:10.1016/j.atmosenv.2007.09.003
Chandran Govindaraju, V. G. R., and Tang, C. F. (2013). The dynamic links between CO2 emissions, economic growth and coal consumption in China and India. Appl. Energy 104, 310–318. doi:10.1016/j.apenergy.2012.10.042
Chen, Y., Zhang, Y., Fan, J., Leung, L. R., and Zhang, Q. (2015). Application of an online-coupled regional climate model, WRF-CAM5, over east asia for examination of ice nucleation schemes: Part I. comprehensive model evaluation and trend analysis for 2006 and 2011. Climate 3, 627–667. doi:10.3390/cli3030627
Ding, A. J., Fu, C. B., Yang, X. Q., Sun, J. N., Petäjä, T., Kerminen, V. M., et al. (2013). Intense atmospheric pollution modifies weather: A case of mixed biomass burning with fossil fuel combustion pollution in eastern China. Atmos. Chem. Phys. 13 (20), 10545–10554. doi:10.5194/acp-13-10545-2013
Ding, A. J., Huang, X., Nie, W., Sun, J. N., Kerminen, V. M., Petäjä, T., et al. (2016). Enhanced haze pollution by black carbon in megacities in China. Geophys. Res. Lett. 43 (6), 2873–2879. doi:10.1002/2016GL067745
Du, Q., Zhao, C., Zhang, M., Dong, X., Chen, Y., Liu, Z., et al. (2020). Modeling diurnal variation of surface PM2.5 concentrations over east China with WRF-chem: Impacts from boundary-layer mixing and anthropogenic emission. Atmos. Chem. Phys. 20 (5), 2839–2863. doi:10.5194/acp-20-2839-2020
Fan, J., Rosenfeld, D., Yang, Y., Zhao, C., Leung, L. R., and Li, Z. (2015). Substantial contribution of anthropogenic air pollution to catastrophic floods in Southwest China. Geophys. Res. Lett. 42, 1–10. doi:10.1002/2015GL064479.Received
Fan, J., Zhang, R., Tao, W. K., and Mohr, K. I. (2008). Effects of aerosol optical properties on deep convective clouds and radiative forcing. J. Geophys. Res. 113 (8), 1–16. doi:10.1029/2007JD009257
Forkel, R., Werhahn, J., Hansen, A. B., McKeen, S., Peckham, S., Grell, G., et al. (2012). Effect of aerosol-radiation feedback on regional air quality - a case study with WRF/Chem. Atmos. Environ. 53, 202–211. doi:10.1016/j.atmosenv.2011.10.009
Gao, M., Carmichael, G. R., Wang, Y., Saide, P. E., Yu, M., Xin, J., et al. (2016). Modeling study of the 2010 regional haze event in the North China Plain. Atmos. Chem. Phys. 16 (3), 1673–1691. doi:10.5194/acp-16-1673-2016
Gao, M., Han, Z., Tao, Z., Li, J., Kang, J. E., Huang, K., et al. (2020). Air quality and climate change, topic 3 of the model inter-comparison study for asia phase III (MICS-Asia III) - Part 2: Aerosol radiative effects and aerosol feedbacks. Atmos. Chem. Phys. 20 (2), 1147–1161. doi:10.5194/acp-20-1147-2020
Gao, Y., Zhang, M., Liu, Z., Wang, L., Wang, P., Xia, X., et al. (2015). Modeling the feedback between aerosol and meteorological variables in the atmospheric boundary layer during a severe fog-haze event over the North China Plain. Atmos. Chem. Phys. 15 (8), 4279–4295. doi:10.5194/acp-15-4279-2015
Ghan, S. J., Liu, X., Easter, R. C., Zaveri, R., Rasch, P. J., Yoon, J. H., et al. (2012). Toward a minimal representation of aerosols in climate models: Comparative decomposition of aerosol direct, semidirect, and indirect radiative forcing. J. Clim. 25 (19), 6461–6476. doi:10.1175/JCLI-D-11-00650.1
Gong, W., Stroud, C., and Zhang, L. (2011). Cloud processing of gases and aerosols in air quality modeling. Atmosphere 2 (4), 567–616. doi:10.3390/atmos2040567
Grell, G. A., Peckham, S. E., Schmitz, R., McKeen, S. A., Frost, G., Skamarock, W. C., et al. (2005). Fully coupled “online” chemistry within the WRF model. Atmos. Environ. 39 (37), 6957–6975. doi:10.1016/j.atmosenv.2005.04.027
Guenther, A., Karl, T., Harley, P., Wiedinmyer, C., Palmer, P. I., and Geron, C. (2006). Estimates of global terrestrial isoprene emissions using MEGAN (model of emissions of gases and aerosols from nature). Atmos. Chem. Phys. 6 (11), 3181–3210. doi:10.5194/acp-6-3181-2006
Hansen, J., Sato, M., and Ruedy, R. (1997). Radiative forcing and climate response. J. Geophys. Res. 102, 6831–6864. doi:10.1029/96jd03436
Huang, R. J., Zhang, Y., Bozzetti, C., Ho, K. F., Cao, J. J., Han, Y., et al. (2014b). High secondary aerosol contribution to particulate pollution during haze events in China. Nature 514 (7521), 218–222. doi:10.1038/nature13774
Huang, X., Ding, A., Gao, J., Zheng, B., Zhou, D., Qi, X., et al. (2021). Enhanced secondary pollution offset reduction of primary emissions during COVID-19 lockdown in China. Natl. Sci. Rev. 8 (2), 137. doi:10.1093/nsr/nwaa137
Huang, Y., Shen, H., Chen, H., Wang, R., Zhang, Y., Su, S., et al. (2014a). Quantification of global primary emissions of PM2.5, PM10, and TSP from combustion and industrial process sources. Environ. Sci. Technol. 48 (23), 13834–13843. doi:10.1021/es503696k
Iacono, M. J., Delamere, J. S., Mlawer, E. J., Shephard, M. W., Clough, S. A., and Collins, W. D. (2008). Radiative forcing by long-lived greenhouse gases: Calculations with the AER radiative transfer models. J. Geophys. Res. 113 (13), 2–9. doi:10.1029/2008JD009944
King, M. D., Platnick, S., Menzel, W. P., Ackerman, S. A., and Hubanks, P. A. (2013). Spatial and temporal distribution of clouds observed by MODIS onboard the terra and aqua satellites. IEEE Trans. Geosci. Remote Sens. 51 (7), 3826–3852. doi:10.1109/TGRS.2012.2227333
Koch, D., and Del Genio, A. D. (2010). Black carbon semi-direct effects on cloud cover: Review and synthesis. Atmos. Chem. Phys. 10 (16), 7685–7696. doi:10.5194/acp-10-7685-2010
Koren, I., Martins, J. V., Remer, L. A., and Afargan, H. (2008). Smoke invigoration versus inhibition of clouds over the amazon. Science 321, 946–949. doi:10.1126/science.1159185
Li, J., Han, Z., Wu, Y., Xiong, Z., Xia, X., Li, J., et al. (2020). Aerosol radiative effects and feedbacks on boundary layer meteorology and PM2.5 chemical components during winter haze events over the Beijing-Tianjin-Hebei region. Atmos. Chem. Phys. 20 (14), 8659–8690. doi:10.5194/acp-20-8659-2020
Li, J., Li, C., Zhao, C., and Su, T. (2016). Changes in surface aerosol extinction trends over China during 1980-2013 inferred from quality-controlled visibility data. Geophys. Res. Lett. 43 (16), 8713–8719. doi:10.1002/2016GL070201
Li, Z., Guo, J., Ding, A., Liao, H., Liu, J., Sun, Y., et al. (2017). Aerosol and boundary-layer interactions and impact on air quality. Natl. Sci. Rev. 4 (6), 810–833. doi:10.1093/nsr/nwx117
Lin, Y. L., Farley, R. D., and Orville, H. D. (1983). Bulk parameterization of the snow field in a cloud model. J. Clim. Appl. Meteorology 22, 1065–1092. doi:10.1175/1520-0450(1983)022<1065:BPOTSF>2.0.CO;2
Liu, D., Zhao, D., Xie, Z., Yu, C., Chen, Y., Tian, P., et al. (2019). Enhanced heating rate of black carbon above the planetary boundary layer over megacities in summertime. Environ. Res. Lett. 14 (12), 124003. doi:10.1088/1748-9326/ab4872
Liu, Q., Jia, X., Quan, J., Li, J., Li, X., Wu, Y., et al. (2018a). New positive feedback mechanism between boundary layer meteorology and secondary aerosol formation during severe haze events. Sci. Rep. 8 (1), 1–8. doi:10.1038/s41598-018-24366-3
Liu, X. Y., Zhang, Y., Zhang, Q., and He, K.-B. (2016). Application of online-coupled WRF/Chem-MADRID in East Asia: Model evaluation and climatic effects of anthropogenic aerosols. Atmos. Environ. 124, 321–336. doi:10.1016/j.atmosenv.2015.03.052
Liu, Z., Yim, S. H. L., Wang, C., and Lau, N. C. (2018b). The impact of the aerosol direct radiative forcing on deep convection and air quality in the pearl river delta region. Geophys. Res. Lett. 45 (9), 4410–4418. doi:10.1029/2018GL077517
Lu, X., and Fung, J. C. H. (2018). Sensitivity assessment of PM2.5 simulation to the below-cloud washout schemes in an atmospheric chemical transport model. Tellus B Chem. Phys. Meteorology 70 (1), 1–17. doi:10.1080/16000889.2018.1476435
Meng, Z., and Zhang, F. (2008). Tests of an ensemble Kalman filter for mesoscale and regional-scale data assimilation. Part III: Comparison with 3DVAR in a real-data case study. Mon. Weather Rev. 136 (2), 522–540. doi:10.1175/2007MWR2106.1
Miao, Y., Che, H., Zhang, X., and Liu, S. (2021). Relationship between summertime concurring PM2.5 and O3 pollution and boundary layer height differs between Beijing and Shanghai, China. Environ. Pollut. 268, 115775. doi:10.1016/j.envpol.2020.115775
Miao, Y., Guo, J., Liu, S., Liu, H., Li, Z., Zhang, W., et al. (2017). Classification of summertime synoptic patterns in Beijing and their associations with boundary layer structure affecting aerosol pollution. Atmos. Chem. Phys. 17 (4), 3097–3110. doi:10.5194/acp-17-3097-2017
Miao, Y., Li, J., Miao, S., Che, H., Wang, Y., Zhang, X., et al. (2019). Interaction between planetary boundary layer and PM2.5 pollution in megacities in China: A review. Curr. Pollut. Rep. 5 (4), 261–271. doi:10.1007/s40726-019-00124-5
Miao, Y., and Liu, S. (2019). Linkages between aerosol pollution and planetary boundary layer structure in China. Sci. Total Environ. 650, 288–296. doi:10.1016/j.scitotenv.2018.09.032
Ning, G., Wang, S., Yim, S. H. L., Li, J., Hu, Y., Shang, Z., et al. (2018). Impact of low-pressure systems on winter heavy air pollution in the northwest Sichuan Basin, China. Atmos. Chem. Phys. 18 (18), 13601–13615. doi:10.5194/acp-18-13601-2018
Petäjä, T., Järvi, L., Kerminen, V. M., Ding, A. J., Sun, J. N., Nie, W., et al. (2016). Enhanced air pollution via aerosol-boundary layer feedback in China. Sci. Rep. 6, 1–6. doi:10.1038/srep18998
Rosenfeld, D., Lohmann, U., Raga, G. B., O'Dowd, C. D., Kulmala, M., Fuzzi, S., et al. (2008). Flood or drought: How do aerosols affect precipitation? Science 321 (5894), 1309–1313. doi:10.1126/science.1160606
Shao, Y. (2001). A model for mineral dust emission. J. Geophys. Res. 106 (3), 20239–20254. doi:10.1029/2001jd900171
Shu, L., Xie, M., Gao, D., Wang, T., Fang, D., Liu, Q., et al. (2017). Regional severe particle pollution and its association with synoptic weather patterns in the Yangtze River Delta region, China. Atmos. Chem. Phys. 17 (21), 12871–12891. doi:10.5194/acp-17-12871-2017
Song, C., Wu, L., Xie, Y., He, J., Chen, X., Wang, T., et al. (2017). Air pollution in China: Status and spatiotemporal variations. Environ. Pollut. 227, 334–347. doi:10.1016/j.envpol.2017.04.075
Stocker, T. F., et al. (2013). Climate Change 2013: The Physical Science Basis. Contribution of Working Group I to the Fifth Assessment Report of the Intergovernmental Panel on Climate Change. Cambridge University Press.
Stull, R. B. (1988). An introduction to boundary layer meteorology. Dordrecht: Springer Netherlands. doi:10.1007/978-94-009-3027-8An introduction to boundary layer meteorology
Su, T., Li, Z., Li, C., Li, J., Han, W., Shen, C., et al. (2020). The significant impact of aerosol vertical structure on lower atmosphere stability and its critical role in aerosol-planetary boundary layer (PBL) interactions. Atmos. Chem. Phys. 20 (6), 3713–3724. doi:10.5194/acp-20-3713-2020
Tie, X., Huang, R. J., Cao, J., Zhang, Q., Cheng, Y., Su, H., et al. (2017). Severe pollution in China amplified by atmospheric moisture. Sci. Rep. 7 (1), 1–8. doi:10.1038/s41598-017-15909-1
Twomey, S. (1977). The influence of pollution on the shortwave albedo of clouds. J. Atmos. Sci., 34(1), 1149–1152. doi:10.1175/1520-0469doi:10.1175/1520-0469(1977)034<1149:tiopot>2.0.co;2
Wang, H., Shi, G. Y., Zhang, X. Y., Gong, S. L., Tan, S. C., Chen, B., et al. (2015). Mesoscale modelling study of the interactions between aerosols and PBL meteorology during a haze episode in China Jing-Jin-Ji and its near surrounding region - Part 2: Aerosols' radiative feedback effects. Atmos. Chem. Phys. 15 (6), 3277–3287. doi:10.5194/acp-15-3277-2015
Wang, J., Wang, S., Jiang, J., Ding, A., Zheng, M., Zhao, B., et al. (2014a). Impact of aerosol-meteorology interactions on fine particle pollution during China's severe haze episode in January 2013. Environ. Res. Lett. 9 (9), 094002. doi:10.1088/1748-9326/9/9/094002
Wang, Y., Khalizov, A., Levy, M., and Zhang, R. (2013). New Directions: Light absorbing aerosols and their atmospheric impacts. Atmos. Environ. 81, 713–715. doi:10.1016/j.atmosenv.2013.09.034
Wang, Z. F., Li, J., Wang, Z., Yang, W. Y., Tang, X., Ge, B. Z., et al. (2014b). Modeling study of regional severe hazes over mid-eastern China in January 2013 and its implications on pollution prevention and control. Sci. China Earth Sci. 57 (1), 3–13. doi:10.1007/s11430-013-4793-0
Wang, Z., Huang, X., and Ding, A. (2018). Dome effect of black carbon and its key influencing factors: A one-dimensional modelling study. Atmos. Chem. Phys. 18 (4), 2821–2834. doi:10.5194/acp-18-2821-2018
Wang, Z., Huang, X., Ding, K., Ren, C., Cao, L., Zhou, D., et al. (2021). Weakened aerosol-PBL interaction during COVID-19 lockdown in northern China. Geophys Res. Lett. 48 (3), 1–10. doi:10.1029/2020GL090542
Wiedinmyer, C., Akagi, S. K., Yokelson, R. J., Emmons, L. K., Al-Saadi, J. A., Orlando, J. J., et al. (2011). The Fire INventory from NCAR (FINN): A high resolution global model to estimate the emissions from open burning. Geosci. Model Dev. 4 (3), 625–641. doi:10.5194/gmd-4-625-2011
Wilcox, E. M., Thomas, R. M., Praveen, P. S., Pistone, K., Bender, F. A. M., and Ramanathan, V. (2016). Black carbon solar absorption suppresses turbulence in the atmospheric boundary layer. Proc. Natl. Acad. Sci. U.S.A. 113 (42), 11794–11799. doi:10.1073/pnas.1525746113
Wu, J., Bei, N., Hu, B., Liu, S., Zhou, M., Wang, Q., et al. (2019). Aerosol-radiation feedback deteriorates the wintertime haze in the North China Plain. Atmos. Chem. Phys. 19 (13), 8703–8719. doi:10.5194/acp-19-8703-2019
Wu, M., Wu, D., Fan, Q., Wang, B. M., Li, H. W., and Fan, S. J. (2013). Observational studies of the meteorological characteristics associated with poor air quality over the Pearl River Delta in China. Atmos. Chem. Phys. 13 (21), 10755–10766. doi:10.5194/acp-13-10755-2013
Ye, W. F., Ma, Z. Y., and Ha, X. Z. (2018). Spatial-temporal patterns of PM2.5 concentrations for 338 Chinese cities. Sci. Total Environ. 631-632, 524–533. doi:10.1016/j.scitotenv.2018.03.057
Zaveri, R. A., Easter, R. C., Fast, J. D., and Peters, L. K. (2008). Model for simulating aerosol interactions and chemistry (MOSAIC). J. Geophys. Res. 113 (13), 1–29. doi:10.1029/2007JD008782
Zaveri, R. A., and Peters, L. K. (1999). A new lumped structure photochemical mechanism for large-scale applications. J. Geophys. Res. 104 (D23), 30387–30415. doi:10.1029/1999JD900876
Zhang, B., Wang, Y., and Hao, J. (2015). Simulating aerosol-radiation-cloud feedbacks on meteorology and air quality over eastern China under severe haze conditions in winter. Atmos. Chem. Phys. 15 (5), 2387–2404. doi:10.5194/acp-15-2387-2015
Zhang, X., Zhang, Q., Hong, C., Zheng, Y., Geng, G., Tong, D., et al. (2018b). Enhancement of PM2.5 Concentrations by aerosol-meteorology interactions over China. J. Geophys. Res. Atmos. 123 (2), 1179–1194. doi:10.1002/2017JD027524
Zhang, X., Zhong, J., Wang, J., Wang, Y., and Liu, Y. (2018a). The interdecadal worsening of weather conditions affecting aerosol pollution in the Beijing area in relation to climate warming. Atmos. Chem. Phys. 18 (8), 5991–5999. doi:10.5194/acp-18-5991-2018
Zhang, Y., Wang, K., and He, J. (2017). Multi-year application of WRF-CAM5 over East Asia-Part II: Interannual variability, trend analysis, and aerosol indirect effects. Atmos. Environ. 165, 222–239. doi:10.1016/j.atmosenv.2017.06.029
Zhao, B., Liou, K. N., Gu, Y., Li, Q., Jiang, J. H., Su, H., et al. (2017). Enhanced PM2.5 pollution in China due to aerosol-cloud interactions. Sci. Rep. 7 (1), 1–11. doi:10.1038/s41598-017-04096-8
Keywords: semi-direct effect, aerosol-radiation interactions, aerosol-cloud interactions, black carbon aerosol, planetary boundary layer, WRF-Chem
Citation: Xiong C, Li J, Liu Z and Zhang Z (2022) The dominant role of aerosol-cloud interactions in aerosol-boundary layer feedback: Case studies in three megacities in China. Front. Environ. Sci. 10:1002412. doi: 10.3389/fenvs.2022.1002412
Received: 25 July 2022; Accepted: 31 August 2022;
Published: 10 October 2022.
Edited by:
Gen Zhang, Chinese Academy of Meteorological Sciences, ChinaReviewed by:
Chi Yang, Nanjing University of Information Science and Technology, ChinaChong Shi, Aerospace Information Research Institute (CAS), China
Zirui Liu, Institute of Atmospheric Physics (CAS), China
Copyright © 2022 Xiong, Li, Liu and Zhang. This is an open-access article distributed under the terms of the Creative Commons Attribution License (CC BY). The use, distribution or reproduction in other forums is permitted, provided the original author(s) and the copyright owner(s) are credited and that the original publication in this journal is cited, in accordance with accepted academic practice. No use, distribution or reproduction is permitted which does not comply with these terms.
*Correspondence: Jing Li, amluZy1saUBwa3UuZWR1LmNu