 Fang Fang1,2
 Jun Zhao
 Jie Di
- 1School of Economics and Management, Xinjiang University, Xinjiang, China
- 2Base for Macroeconomic Early Warning Research of Xinjiang, Xinjiang, China
Low-carbon agricultural development in China is a prerequisite for rural revitalization and a key to achieving socio-economic green transformation. This paper used agricultural data from 30 Chinese provinces from 2001 to 2020, considering both carbon emissions from farming and livestock, agricultural low-carbon total factor productivity (ALTFP) was measured using the RSBM-GML index. Based on this, the network characteristics and driving mechanisms of low-carbon synergistic development in agriculture were explored with the help of an improved gravity model and social network analysis, and the dominant provinces in low-carbon synergistic development in agriculture are identified. The study revealed that the spatially linked network of ALTFP in China exhibits multi-threaded characteristics of spillover to non-adjacent provinces, and the whole network has a sparse structure and hierarchy. The eastern regions such as Beijing, Tianjin, Shanghai, Jiangsu, and Zhejiang are at the core of the network, with closer ties to other regions and a stronger role in allocating resources. While the western regions such as Xinjiang, Qinghai, and Gansu are located at the periphery of the network, with weaker access to the resources. Meanwhile, the spatial proximity of provinces, the widening of differences in urbanization levels and differences in financial support for agriculture, and the narrowing of differences in the educational attainment of rural labor have significantly contributed to the formation of provincial spatial linkages. This study reveals that China’s government needs to give full play to the role of core regions as “leaders”, and promote the balanced and coordinated regional development of low-carbon agriculture in China. In addition, policy makers should further optimize the spatial allocation of agricultural resource elements between provinces. The findings of the study provide reference suggestions for the development of regionally differentiated agricultural low-carbon development plans.
1 Introduction
In recent years, the problem of excessive carbon emissions has attracted the attention of the global public, governments, and academia. To reduce carbon emissions, countries are actively taking measures (Yu and Wu, 2018; Zhao et al., 2018). China is currently the largest carbon-emitting country in the world, and the Chinese government has committed to reaching peak carbon emissions around 2030, enacting a series of laws and regulations to break down energy conservation and emission reduction in various regions and industries (Zhou et al., 2020; Yang et al., 2022a).
Agriculture is one of the core sectors in a country to ensure the security of food supply and maintain socioeconomic stability, and its sustainable development is closely related to people’s welfare. China’s total agricultural output value of 139.7 billion RMB increasing to 147013.40 billion RMB in 2021. However, the tremendous achievement has been accompanied by a transition in resource consumption and a surge in agricultural carbon emissions (Xu and Lin, 2017; Zhang L. et al., 2019). Agricultural carbon emissions account for about one-fifth of China’s total carbon emissions (Guan et al., 2008; Liu et al., 2021), as the second largest source of carbon emissions in China, agricultural production activities generate 50% of CH4, 70% of N2O and 28.5% of CO2 (Zhang X. et al., 2019; Yue et al., 2021). Hence, low carbon agricultural development for China and emerging economies like China means adopting a low carbon emission development model while maintaining total economic output and low carbon emissions (Ang and Su, 2016; Wu J. et al., 2020; Hamid and Wang, 2022).
The impact of China’s agroecology deserves high priority (Li and Wu, 2022; Wu et al., 2022). The relevant documents guiding the work of “agriculture, the countryside and farmers” further emphasize the promotion of green transformation of agriculture in 2022. With the development of agricultural mechanization and agricultural intensification, China’s agricultural production activities have become increasingly dependent on the use of chemical materials such as fertilizers, pesticides, and plastic films (Zhen et al., 2017), which are important sources of excessive CO2 emissions (Wang L. et al., 2022). In addition, advances in farming technology and increased demand for meat have led to a significant increase in CH4 and N2O emissions from livestock (Qian et al., 2018). In previous studies, the environmental and social impacts of livestock production patterns have been largely ignored (Escribano et al., 2022). Therefore, integrated consideration of carbon emissions from farming and livestock is important for China to achieve sustainable agricultural development (Paul et al., 2019). This paper examines agricultural carbon emissions based on the broad scope of agriculture. It refers to the greenhouse gas emissions directly or indirectly caused by the agricultural production process, including carbon emissions caused by agricultural land use activities such as fertilizers, pesticides, and CH4 and N2O from enteric fermentation and manure management in livestock.
Uneven regional development is a challenge for many developing countries, and the gap between backward and developed regions is not only an economic issue but also a source of social conflicts. The practice of poverty reduction in China proves that it is particularly important to focus on coordinated regional development. With the improvement of the national market mechanism and the free flow of factors across regions, the spatial connection between regions is getting closer and closer, the process of regional economic integration is advancing (Hao et al., 2021), and the exchange and cooperation of agricultural development between regions are no longer limited to neighboring areas, but presents the characteristics of a complex network, and there is a spatial interaction effect of agricultural carbon emissions between regions (Cui et al., 2021; Liu and Yang, 2021; Wu et al., 2021). In reality, there is extensive communication among farmers, and contacts between farmers or rural neighbors are the main channel to obtain agricultural technology information (Tze Ling et al., 2011; Genius et al., 2014). Social networks promote green technology diffusion by enhancing communication among farmers and are an effective way for agricultural technology to spread (Li et al., 2017; Cai et al., 2022). Agriculture has strong positive inter-regional spillover effects, so expanding inter-regional cooperation in agricultural research can increase efficiency, and in particular, training researchers in less productive areas can increase TFP (Zhan et al., 2017).
The contributions of this study are threefold. First, we incorporate both carbon emissions from farming and livestock into the research framework of green agricultural development and use them as non-expected outputs to accurately examine the spatial network characteristics of low-carbon agricultural development in China and its evolutionary trends. Second, we adopt an alternative research idea different from linear causality analysis-social network analysis, focusing on the two-way interaction between research objects, breaking the gap between micro and macro, and eliminating all kinds of dichotomous problems. The roles and functions of each region in the spatial network structure of agricultural low-carbon development were further screened. It provides a reference basis for promoting the balance and coordination of regional low-carbon development. Third, we further explore the influence of the spatially linked network characteristics of regions on their green development and analyzed the drivers of network formation, we find space for the development of green agriculture in China. As a result, this study examines the inter-regional interactions, aiming to further promote inter-regional spatial linkages and achieve inter-regional complementarities and coordinated development. It not only provides referenceable suggestions to promote the formation of China’s agricultural carbon reduction policy and the construction of a cross-regional green synergistic governance mechanism but also provides experience value to the economic transformation and stable development of other emerging real economies like China.
The rest of the paper is described as follows: Section 2 composes the relevant literature on research progress, and Section 3 includes the methodology and data sources used. In Section 4, we present the main findings and some brief discussions, and Section 5 provides an empirical analysis of the relevant network drivers. In Section 6, we provide the conclusions and policy implications of the study.
2 Literature review
Accurate analysis of ALTFP growth is crucial for designing policies to obtain their effectiveness (Shen et al., 2019), especially for one of the world’s largest food producers and food consumers like China, where production efficiency that takes into account environmental factors is important for achieving sustainable agricultural development (Dakpo et al., 2016; Wang et al., 2018; Liu et al., 2022). In terms of calculation methods for agricultural TFP, most scholars use data envelopment analysis (DEA) (Gong, 2020) and stochastic Frontier analysis (SFA) approaches (Zhang L. et al., 2019). Environmental factors were not considered in earlier studies (Suhariyanto and Thirtle, 2001; Bai et al., 2012). With the increasing environmental constraints in agricultural production, scholars have started to work on agricultural green TFP that takes environmental factors into account (Zhong et al., 2021). In subsequent empirical studies, scholars have identified some limitations of the traditional ML index (Battese et al., 2004); A global measurement technique index that uses all measurement periods as a benchmark for the efficiency Frontier surface was proposed (Pastor and Lovell, 2005; Fukuyama and Weber, 2009). The global measurement technique and the ML measurement technique were combined based on Pastor and Lovell to form the Global Malmquist-Luenberger (GML) index (Oh, 2010), it is gradually used by Frontier researchers in this field (Ren et al., 2022). Compared with the traditional ML index, the GML index can effectively solve the problem of linear programming without feasible solutions. The research process considers group heterogeneity, divides the sample into several groups, and introduces the concept of common Frontier and group Frontier, which is more suitable for regional variance analysis (O'Donnell et al., 2008). In this paper, the Super-efficiency ray slacks-based measure (Super-RSBM) model and the GML index were chosen for further calculations.
At present, research on the assessment of the low carbon development level of Chinese agriculture and its influencing factors has yielded fruitful results. Cheng et al. (2016) and Qin et al. (2022) studied from the perspective of single-factor productivity, and examined the agricultural carbon productivity of 31 provinces and regions in mainland China during the period 1997–2012. Ji and Xia (2020), Guo and Liu (2021) analyzed the spatial and temporal convergence of agricultural green TFP in China from a dynamic perspective. Yang et al. (2019) explored the degree of spatial divergence of agricultural green TFP. The main influencing factors of low carbon development in agriculture are crop insurance (Carter et al., 2016; Fang et al., 2021), digital inclusive finance (Gao et al., 2022), agricultural financial subsidies (Li et al., 2021), industrial agglomeration (Wu J. et al., 2020), farmers’ characteristics, economic development level, farmers’ income level, financial support to agriculture (Adnan et al., 2018), agricultural structure, resource utilization, and environmental pollution control level (Liu et al., 2021), the foreign trade of agricultural products, and foreign direct investment in agriculture and agricultural technology input (Chen Y. et al., 2022), all of which showed that the agricultural green development in China showed a good trend, but the inter-provincial differences widened, and the spatial distribution gradually became uneven, with significant spatial dependence. Hence, it is necessary to pay attention to the spatial interaction effect between regions and gradually reduce the regional disparity in agricultural development (Li et al., 2019).
In the study of spatial linkage in carbon emissions, a portion of scholars has used spatial measures. Spatial measurement only considers the influence of “quantity”, but not the influence of “relationship”. The social network approach can overcome the shortcomings of the spatial measurement approach and is increasingly used in the spatial relationship of carbon emissions. For example, He et al. (2020) constructed a spatially correlated network of carbon emissions from the power sector in each province of China, Bai et al. (2020) examined the structure of the spatially correlated network of carbon emissions from transportation in China and its drivers, Liu and Xiao (2021) studied the spatial correlation of carbon emissions from industry in China, Huo et al. (2022) and Wang Z. et al. (2022) examined the spatially correlated network structure of carbon emissions from buildings in China network structure and its drivers, and Song et al. (2019) explored the spatial structure pattern and correlation effects of carbon emissions in the Chengdu-Chongqing urban agglomeration. However, few studies have applied social network analysis methods to carbon emission relationships in agriculture.
The current research on low-carbon development in agriculture has achieved richer results, but there is still room for further improvement and supplementation. First, in the measurement of ALTFP, most studies have taken farming as the main object and selected six aspects of agricultural production: fertilizer, pesticide, agricultural film, tillage, machinery use, and irrigation as carbon sources to measure agricultural carbon emissions. However, the fact that farming and livestock have long each accounted for half of China’s total agricultural carbon emissions, so carbon emissions from livestock should also be taken seriously. Second, the spatial linkage of ALTFP is mostly based on “attribute data”, which results in local relationships, and the variables need to satisfy the assumption of independent interconnectedness. Third, many research results empirically proved the existence of spatial linkages in low-carbon agricultural development in China but did not further clarify the reasons for the formation of spatial linkages. Therefore, the study firstly measured China’s ALTFP from 2001 to 2020 with the Super-RSB model from the perspective of farming and livestock. Secondly, drawing on the modified gravity model, the spatially linked network structure of green agricultural development in different provinces was analyzed using social network analysis. Finally, using the Quadratic Assignment Procedure (QAP) to explore the driving factors of low-carbon development in agriculture, and analyze the reasons that led to the unbalanced development of regional low-carbon agriculture.
3 Methodology and data allocation
3.1 Calculation of ALTFP
Green/low carbon total factor productivity has become an important basis for judging the sustainability of the economy1(Liu et al., 2021; Hao et al., 2022). While earlier DEA models could measure environmental efficiency with undesired outputs, the weak disposable relationship that exists between undesired and desired outputs was ignored. The introduction of a DEA model with a directional distance function partially corrects this deficiency. However, the designation of direction vectors is subjective, the improvement of each decision-making unit (DMU) may not be unique, and these models do not take into account the weak disposable relationship between desired and undesired outputs, to solve this problem, Song et al. (2018) introduced polarity theory into the SBM model and proposed the RSBM model. In this paper, RGML index is used to measure ALTFP, which was measured by referring to Song et al. (2018). The constructed Super-RSBM model is:
Where
The above equation can calculate the efficiency value of the evaluated unit under certain technical conditions, but technical efficiency at this point is a static analysis that cannot reflect the direct impact of productivity changes on agricultural production and development. For this reason, the GML index is introduced. Compared with the ML index, the GML index can effectively solve the problem of linear programming without feasible solutions. Referring to (Oh, 2010), the RGML index is defined as follows:
If
3.2 Determination of spatial correlation of ALTFP
Determining the spatial linkages of ALTFP is the key to effective analysis, and this paper draws on an improved trade gravity model to determine. Provinces are the points in the association network, and inter-regional linkage relationships are the lines in the network, thus constituting the spatial network of regional development. According to the existing literature, most scholars generally use vector autoregressive (VAR) models, gravity models, and Moran’s I index to determine spatial relationships. However, the VAR model is deficient in providing reasonable economic theoretical explanations, it cannot reflect the simultaneous relationships between variables or portray the evolutionary trends of spatial structures, and it is too sensitive to the choice of lag order, which can seriously degrade the network structure characteristics (Lui et al., 2007). Gravity models can integrate relevant economic geographic factors and reveal the evolutionary characteristics of spatially linked relationships in time series and cross-sections. In our study, the gravity model was introduced into the field of agricultural green development concerning (Chen Z. et al., 2022). To improve the applicability of the model, the model was modified as in Eq. 3:
Where
The spatial correlation matrix of inter-provincial ALTFP is obtained from the modified gravity model, and the average value of each row of the gravity matrix is taken as the threshold value. When greater than the threshold than 1, it indicates a correlation between the provinces in each row and the provinces in this column for ALTFP; otherwise, it takes 0, which means there is no correlation between this row and the provinces in this column.
3.3 Social network analysis
With the gradual deepening of regional coordination strategy and the enhancement of the mobility of market factors, the spatial correlation effect of the regional economy is becoming more and more significant, and there are complex economic links between regions. The same is true of the agricultural economy. Spatially linked networks of low-carbon economies in agriculture are an important part of the economic network, its inner mechanism of formation is a network organization system combining points, lines, and surfaces of capital, resources, labor, low-carbon technologies, and management methods under the guidance of the concept of low-carbon development and the role of several mechanisms, such as factor gathering and dispersal, market regulation, government control, and circular feedback.
Specifically, due to the spatial heterogeneity of geographical location, factor endowments, agricultural development patterns, and agricultural low-carbon technologies in each region, the agricultural economy does not develop in a balanced manner, which leads to a certain “potential energy difference” in the development of agricultural low-carbon economy in each region, providing a “source of power” for the flow of various factors between regions. In this process, the market regulation mechanism guides the flow of agricultural low-carbon development factors to regions with high marginal benefits through supply and demand and prices, forming the core and peripheral areas of a low-carbon economy. The government’s macro-control mechanism is mainly through financial transfer payments, a performance appraisal system, and a regional coordinated development strategy to guide the “reverse gradient” flow of factors, promote regional advantages to complement each other, and achieve balanced and coordinated regional development (Yang et al., 2022b). Therefore, the factors of agricultural low-carbon development are constantly flowing and reconfiguring in space with human, logistics, and information technology flows as carriers, conducting and radiating to neighboring and other regions, it forms a complex spatially linked network of inter-regional agricultural low-carbon economic development. At the same time, under the role of the circular feedback mechanism, the low-carbon economy linkage network will also have an impact on the efficiency of agricultural green development in each region and the “potential energy difference” of inter-regional factor flow, which will eventually promote the accumulation of low-carbon agricultural economy cycle and gradual evolution.
The social network approach is unique in that the unit of analysis is not primarily the actors (e.g., individuals, groups, organizations, etc.), but rather the relationships between the actors. From the “relational” point of view, the object of study can be behavioral, political, social, and economic structures, so this approach is widely used in different fields. The RGML spatially relevant metrics in this paper are relational data, since relational data do not satisfy the “assumption of independence of variables” in the conventional statistical sense, multivariate statistical methods in the general sense do not apply to the analysis of relational data. Social network analysis was used to analyze overall network characteristics, regional network characteristics, and individual network characteristics, and the influence of network structure was tested empirically.
3.3.1 Whole network characteristics
Assessing the whole network characteristics of the spatial association network of ALTFP in Chinese agriculture using network density (D), network connectedness (C), network efficiency (E), and network hierarchy (H). Among them, D reflects the closeness of the connections between individuals in the network. The greater the network density, the greater the network’s influence on the individuals. C reflects the robustness of the network, mainly measuring the reachability of each node, and if C is equal to 1, the network is robust. E reflects the number of redundant lines in the spatial network, the lower the network efficiency, the more stable the network. H reflects the position of each region in the spatial network, and the higher it is, the higher the position of a region in the ALTFP spatial association network. The calculation of network density (D), network connectedness (C), network efficiency (E), and network hierarchy (H) is as presented in Eq. 4:
M is the number of relations existing in the network, N is the total number of network nodes, V is the number of unreachable point pairs in the network, L is the number of redundant lines in the network, and K is the logarithm of symmetric reachable points.
3.3.2 Regional network characteristics
The E-I distribution index is used to analysis of regional development differences of ALTFP spatial association network in Chinese agriculture, it is equal to the ratio of subgroup density to overall density, so the index takes a threshold value in the interval [−1, +1]. The closer the index is to 1, the closer the district subgroups are to each other (external relations) and the less factional forestry. The closer the index is to -1, the less inter-subgroup (external relationships) and the more relationships tend to occur between subgroups, implying a greater degree of factionalism. The closer the index is to 0, the more the number of relationships inside and outside the subgroups is similar, and the relationships tend to be randomly distributed, making it impossible to distinguish between subgroups. The formula for measuring the E-I distribution index is as follows:
EL represents the number of relationships between subgroups and IL represents the number of relationships between subgroups within。
3.3.3 Individual network characteristics
The degree-centrality (Dc), betweenness-centrality (Bc), and closeness-centrality (Cc) are used to analyze the individual network characteristics. Whereas, the degree-centrality reflects the local centrality index of the research subject, and measures the ability of individuals in the network to connect themselves to other individuals, without considering whether they can control others. In a directed network, the degree of each point can be divided into out-degree centrality (Oc) and in-degree centrality (Ic). The in-degree centrality indicates the extent to which the province is influenced by others, the out-degree centrality indicates the ability of the province to influence other provinces, and if the in-degree is greater than the out-degree, it shows a net benefit effect, and vice versa. Is a net spillover effect. Bc measures the actor’s control over resources, in other words, a point is said to have a high Bc if it is on a shortcut to multiple other pairs of points, indicating that this point plays an important mediating role, and is therefore an index of control. Cc is a measure of control by others, if the “distance” between a point in the network and other points " are short, then the point is said to have a high Cc and is stronger in terms of its ability to transmit information. The expressions of degree-centrality (Dc), betweenness-centrality (Bc) and closeness-centrality (Cc) are respectively as follows:
n is the total number of network nodes,
3.3.4 The analysis of QAP
To investigate the influencing factors of Chinese ALTFP spatial association networks with the help of the Quadratic Assignment Procedure. Agricultural carbon emissions and subject to multiple and complex factors, the correlation between independent variables is a key issue affecting the reliability of regression results. QAP is based on the permutation of matrix data, and the similarity analysis of each element in the two matrices is performed to obtain the similarity coefficients, while the coefficients are tested nonparametrically. It does not require the assumption of mutual independence between explanatory variables, thus it can well deal with the endogeneity of relational data. It mainly includes QAP correlation analysis and QAP regression analysis.
In performing QAP correlation analysis, QAP first permutes the rows and columns of a matrix simultaneously and then calculates the correlation coefficient between the permuted matrix and the other matrix, which guarantees that the independent and dependent variable matrices have interdependence in rows and columns, and then calculates the significance and the probability that the magnitude of the correlation coefficient is either smaller or smaller than the actual coefficient. In the QAP regression analysis, the first step is to perform a conventional multiple regression estimation for the long vector elements corresponding to the independent and dependent variable matrices, and the second part is to perform a random permutation of the rows and columns of the dependent variable matrix simultaneously, and then re-estimate and save the estimated coefficient values and R2 values. The procedure is repeated several hundred times to obtain the standard error of the estimated statistic.
3.4 Panel quantile regression model
To further examine the evolutionary process of the change in the coefficient of influence of network structural characteristics on ALTFP, a fixed effects panel quantile regression is used with reference to (Powell, 2020). Five representative quartiles were estimated: 10%, 25%, 50%, 75%, and 90%.
where
3.5 Data allocation
3.5.1 ALTFP
The data description of input and output variables in the calculation of ALTFP is shown in Table 1.
TABLE 1. Description of agricultural production input and output variables.
Among them, the undesired outputs are mainly carbon emissions from farming and livestock, which is calculated by the following formula:
The sources of carbon emissions from livestock are mainly methane (CH4) emissions from ruminant gastrointestinal fermentation and livestock manure management anoxia and nitrous oxide (N2O) emissions from livestock manure collection, storage, and composting processes, calculated as:
TABLE 2. Carbon sources, emission factors and sources of agricultural carbon emissions.
3.5.2 Data sources
The data were obtained from the public data of the China Statistical Yearbook, China Population and Employment Statistical Yearbook, China Agricultural Yearbook, China Rural Statistical Yearbook, China Agricultural Statistics, China Environmental Yearbook, and some provincial and municipal statistical yearbooks from 2001 to 2020. The geographical distances between provincial capitals were calculated with the help of ArcGIS10.8.
4 Results and discussions
4.1 Dynamic distribution of ALTFP in China
The RGML index of ALTFP was measured according to Eqs. 8, 9, and the probability distribution of the RGML index in different regions is plotted in Figure 1. Overall, the RGML index is highest in the east, followed by the west, and lowest in the northeast. In terms of the dispersion of values, there are more discrete values of high loci in the eastern region, while ALTFPs in other regions are not high and are more evenly distributed, especially the smallest and most concentrated values in the northeastern region. In terms of temporal trends, ALTFP gradually increases over time, and in 2001, the RGML indices among the four major regions were all low but with small differences, and in 2005, the RGML indices in the central and western regions tended to converge, while the discrete values of the low loci in the northeast increased. Starting from 2015, the RGML index in the eastern region further increased, accompanied by an increase in the discrete values of the high points. In other regions, the increase of RGML index is smaller than that in the eastern region, but the dispersion value decreases, it indicates that the balanced development of the region has achieved some success.
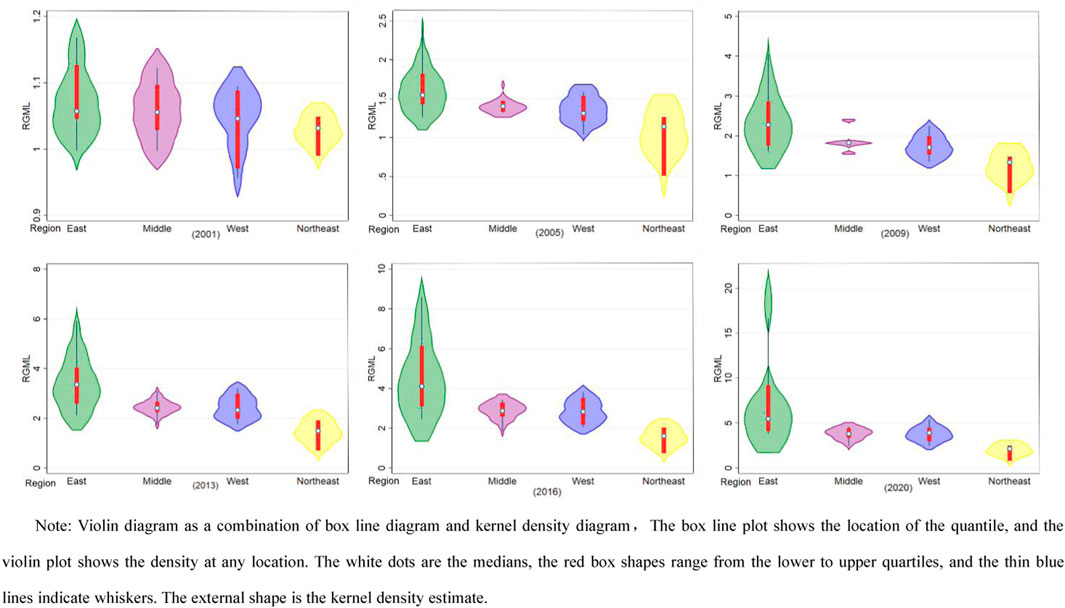
FIGURE 1. Dynamic distribution of ALTFP from 2001 to 2020.
Note: Violin diagram as a combination of box line diagram and kernel density diagram, The box line plot shows the location of the quantile, and the violin plot shows the density at any location. The white dots are the medians, the red box shapes range from the lower to upper quartiles, and the thin blue lines indicate whiskers. The external shape is the kernel density estimate.
4.2 Spatial association network characteristics and evolutionary trends
Inspired by Luo et al. (2021), we used ArcGIS to conduct a comparable analysis. Figure 2 visualizes the intensity of spatial association of provincial ALTFP in China in 2020. According to Eq. 6, considering the bidirectional and asymmetric nature of provincial ALTFP, if two provinces are connected by only one line, the difference in the magnitude of their bidirectional association cannot be reflected. Therefore, if the left graph in Figure 1 shows the gravitational intensity of province i to province j, the right graph shows the gravitational intensity of province j to province i.
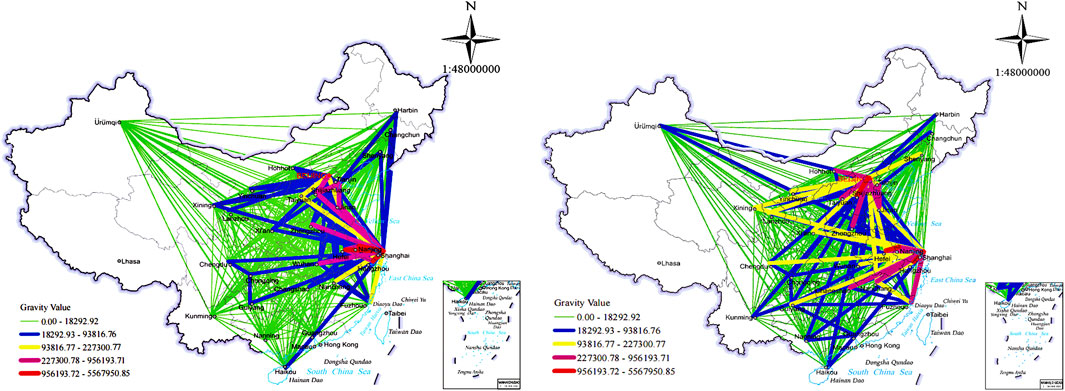
FIGURE 2. Spatial correlation intensity of ALTFP in China in 2020. Note: The map is made based on the standard map downloaded from the standard map service website of the National Bureau of Surveying, Mapping and Geographic Information, with the review number GS (2019) 1,673 and no modification of the base map (https://service.tianditu.gov.cn/#/).
In Figure 2, the spatial association network of ALTFP in China’s province has broken the traditional geographical limitation of neighbor as friend, has a complex, multi-threaded spatial association network overflowing to non-neighboring provinces, showing a situation of “dense in the east and sparse in the west”. From the gravitational strength of the line colors, the whole network forms a radiation network with Shanghai and Beijing as the south and north centers, and the association strength of Beijing-Tianjin-Hebei and Yangtze River Delta urban agglomeration is significantly higher than that of other regions.
Further, to analyze the spatial association network structure morphology of ALTFP, the spatial association intensity data obtained from Eq. 6 were binarized to turn the attribute-based data into relational data, and the spatial network topology of Chinese ALTFP in 2001 and 2020 was plotted using the visualization tool Net draw of UCINET (Figure 3). It can be seen that from 2001 to 2020, the density of the spatial association network of China’s ALTFP has increased significantly, and the inter-regional connections have gradually become closer. Among them, Beijing, Shanghai, and Tianjin have been in the core position in the whole network, while most of the western provinces are at the edge of the network and have less connection with other provinces. Mainly because these regions have strong economic development capacity, strong capital, talent, and agricultural green innovation base, and have good transportation infrastructure and strong factor mobility. This greatly reduces the cost of green technology spillovers and thus forms the core region of the spatially linked network of agricultural green development.
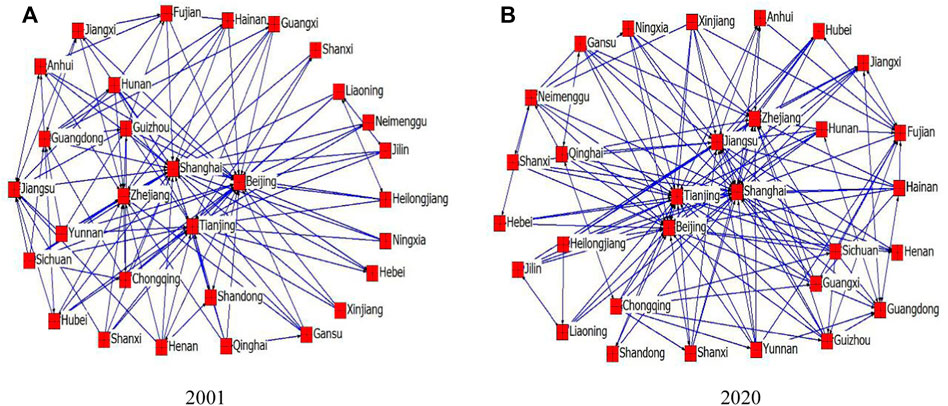
FIGURE 3. Structure of ALTFP in China in 2001 (A) and 2020 (B).
4.2.1 The whole network characteristics
In terms of network density (Figure 4), network relevance and network density maintain the same evolutionary trend during the sample period, showing an “inverted U-shape” evolutionary trend that slopes first and then decreases. In terms of specific values, the number of network relationships was 150 in 2001, peaked at 187 in 2017, and dropped to 181 in 2020. Correspondingly, the overall network density increased from 0.17 in 2001 to 0.22 in 2015, and then decreased to 0.21 in 2020, it still has a large gap between the maximum number of possible network relationships (870) and the maximum possible network density 1, indicating that the spatial correlation of ALTFP is still at a low level and the linkage spillover effect between them is low.
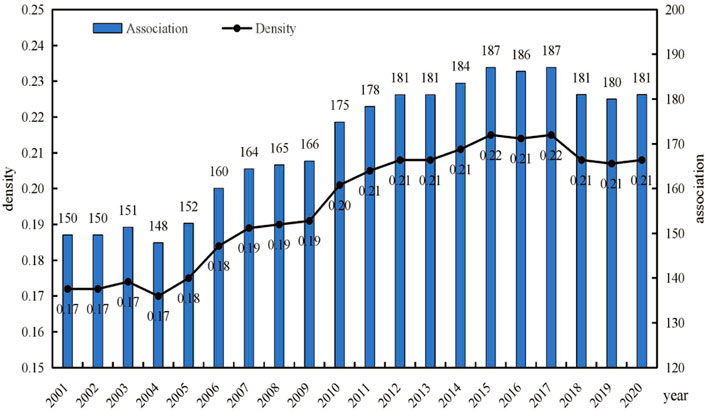
FIGURE 4. Network association and network density.
In terms of network relevance, we adopt network connectedness, network efficiency, and network hierarchy to reflect the connectedness of the spatially connected network structure of ALTFP in China (Figure 5). The network connectedness showed an obvious stepwise upward trend from 0.776 in 2001 to 0.871 in 2020, indicating that the connectivity and robustness of the network were gradually strengthened, and provinces could be spatially linked through direct and indirect means. In terms of network hierarchy, the value declined from 0.385 to 0.245 from 2001 to 2020, showing a stepwise decline, indicating that the hierarchy structure of Chinese ALTFP is gradually loosening, but there is still a hierarchy gradient and the network structure needs to be further optimized. In terms of network efficiency, the network efficiency declined from 0.783 in 2001 to 0.727 in 2020, with a less pronounced decline than the network hierarchy, indicating that although the connectivity of inter-provincial nodes is gradually increasing, there is still a high number of redundant relationship numbers, and there is an obvious phenomenon of overlapping association in the network of each province.
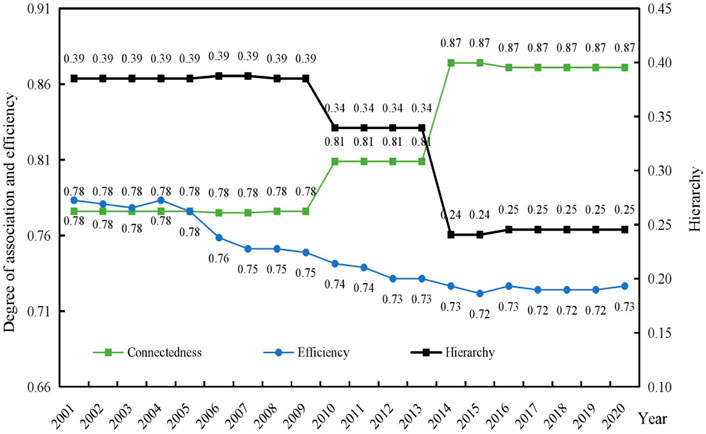
FIGURE 5. Network association, network efficiency, and network hierarchy.
4.2.2 Regional network structure characteristic
The study shows that there are significant differences in economic and social development between regions in China (Wu H. et al., 2020), and the regional differences in agricultural carbon emission rates mainly come from the regional differences between East-Central-West. To further investigate the spatial correlations of low-carbon agricultural development between regions, the 30 provinces in China were divided into four regions: eastern, central, northeastern, and western. The association network E-I index and the density matrix of each zone of the Chinese ALTFP were obtained by measuring the four major sectors as a unit.
The degree of faction throughout the network from 2001 to 2020 of ALTFP shows a narrowing trend (Figure 6). The E-I association index of the entire network of China’s ALTFP was 0.543 in 2020, indicating that relationships tend to occur among the four major segments, with a smaller degree of factional forestry. In terms of regional density (Table 3), the northeastern network has the highest density of 0.67, indicating that resources are more closely linked to agricultural development in the northeast. The density of 0.40 in the eastern region may be confined to the obvious natural resource-dependent attributes of agricultural development, the large north-south span, the different natural resource attributes, and the north-south policy differences, thus reducing the spatially linked network density of ALTFP in the eastern region. The density in the central and western regions is smaller, which may be limited by the regional economic development base and natural resource endowment differences.
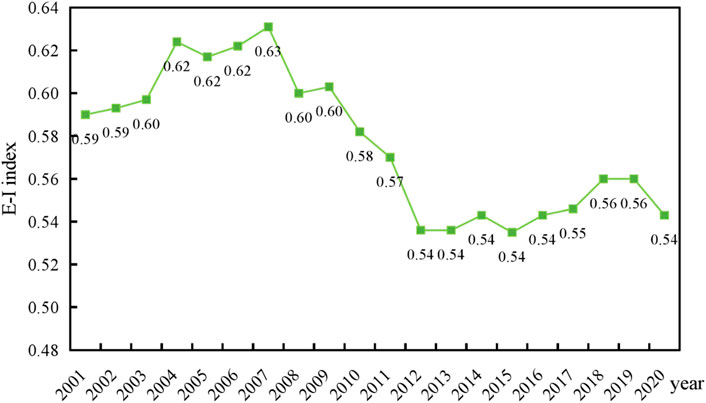
FIGURE 6. The trend of the E-I index of ALTFP in China from 2001 to 2020.
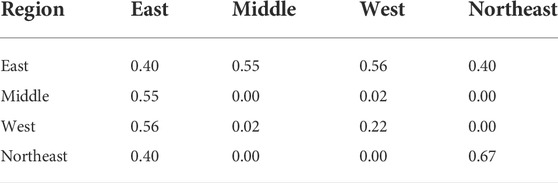
TABLE 3. Spatial correlation density matrix of ALTFP in four major regions of China in 2020.
In terms of inter-regional connections, the East is more strongly connected to the Midwest and generally connected to the Northeast. The Central region has strong connectivity with the East, little connectivity with the West, and almost no connectivity with the Northeast. The western region also has almost no connection with other regions except for the strong connection with the east. The northeast is only connected to the east. It is found that the four major regions are spatially connected, with the eastern region being more closely connected to other regions, while the central, western, and northeastern regions have very few connections with each other. Combined with the spatial linkage density of the regions themselves, the East is more connected both internally and externally, with the Northeast having a higher density value of its internal connections than that of its connections with other regions, indicating that the northeastern region has formed a “cohesive subgroup” locally. The central and western regions, on the other hand, are highly factionalized, with relatively few internal and external linkages.
4.2.3 Individual network structure characteristics
To further illustrate the position and role of each province in the spatially linked network of agricultural low-carbon development, we measured the centrality of each province. The results show that there are no significant changes in the indicators for each province during the sampling period; therefore, we analyzed the indicators for 2020 as an example, which are reported in Table 4.

TABLE 4. Centrality of spatially linked networks of ALTFP in China in 2020.
First, degree centrality is used to discriminate whether each province is at the center of the ALTFP spatial network. The results show that six provinces are higher than the mean value of 32.18 of the degree-centrality, and all of these provinces are located in the economically developed areas of the eastern coastal region of China. Indicating that the eastern coastal region is more closely related to other provinces in the ALTFP network and is in the central dominant position in the spatially linked network of ALTFP. However, Anhui, Jilin, Liaoning, Shanxi, Xinjiang, Hubei, and Heilongjiang are in the last positions and are at the edge of the network. The in-degree is greater than the out-degree in 7 provinces, Beijing, Tianjin, Shanghai, Jiangsu, Zhejiang, Fujian and Anhui in 2020. It shows that these provinces benefit from the driving effect of ALTFP in other provinces, and their high level of agricultural low-carbon development can effectively attract resource elements of agricultural green development and transform them effectively to promote ALTFP, showing a significant spatial polarization effect.
Second, closeness-centrality was used to discriminate the ease of ALTFP spatial association generation among provinces. The mean value of closeness-centrality is 60.81, and the provinces that exceed the mean value and rank in the top five are Shanghai, Beijing, Tianjin, Jiangsu, and Zhejiang, indicating that these provinces have shorter distances from other provinces, and can quickly make connections with other provinces, and are central actors in the ALTFP spatial association network. This may be because these provinces are located in the eastern region with high inter-provincial resource mobility, and developed economic strength and accessibility expand access and capacity to agricultural development resources. In contrast, Xinjiang, Shanxi, Liaoning, Jilin, Anhui, Hebei, and Henan are ranked low, mainly because these provinces are mainly located in the geographical periphery of China and have weak links with other provinces, playing a marginal role in the linkage network.
Finally, the betweenness-centrality is used to reflect the ability of each province to control resources and information in the process of low-carbon development of agriculture. The mean value of betweenness-centrality is 2.42, with Shanghai, Tianjin, Beijing, Jiangsu, and Zhejiang exceeding the mean value. It shows that these provinces play the role of “intermediary” and “bridge” in the linkage network, have strong control and dominant role in the flow of talent, technology, and capital in low-carbon agricultural development, and are the important hubs in the linkage network. These provinces are located in the economically developed eastern region, with a high level of technological innovation and relatively high government regulation of extensiveness. It is easier to absorb the inflow of green development factor resources from other provinces and achieve strong control over other provinces. In contrast, Shanxi, Hubei, Xinjiang, Jilin, and Shanxi have lower betweenness-centrality and rank lower, indicating that these provinces are in the marginal position of “dominated” in the correlation network.
4.3 Network structure effect analysis
Spatially linked networks are not only networks of relationships between regions, but also spatial flows and connections that contain knowledge and technology. The characteristics of the spatial network structure reflect the region’s access to resources and the degree of connection with other regions, therefore, different characteristics of the network structure will affect the level of development of the region.
The indicators of overall network structural characteristics, regional network structural characteristics, and individual network structural characteristics were obtained using the previous calculations as explanatory variables, the agricultural low carbon TFP was selected as the explanatory variable for the sample survey period, and Ordinary Least Squares (OLS) was used to estimate. The explanatory and explanatory variables were treated using a logit strategy to avoid differences between indicators and multicollinearity. In addition, to examine the evolutionary process of the change in the impact effect of network structure, further fixed-effects panel quantile regressions were used to estimate representative five quartiles:10%, 25%, 50%, 75%, and 90%, as shown in Table 5. Among them, the estimation results of the 50% quantile are only slightly different from the results of the other quantile in terms of coefficient magnitude, and the direction of the coefficient is consistent with the estimation results of the other quantile, so it is not shown in Table 5.
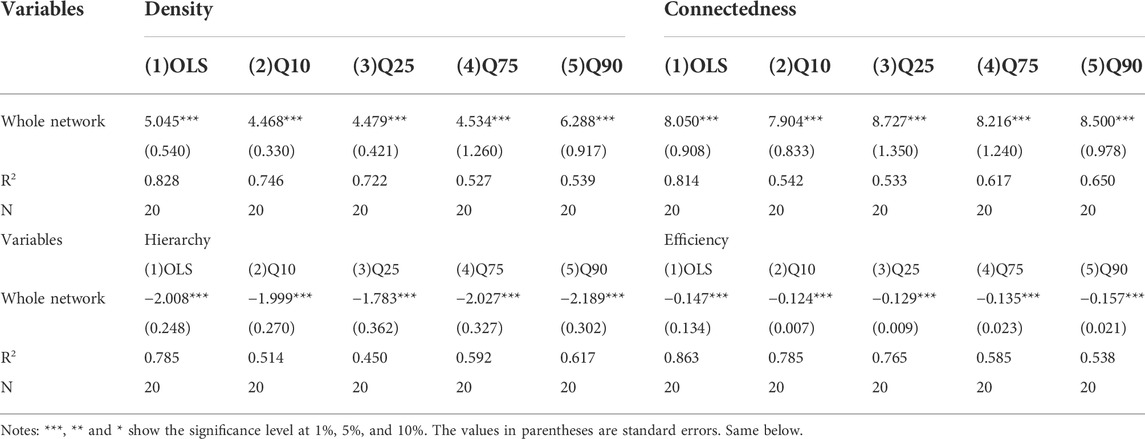
TABLE 5. Results of the impact of the overall network structure on ALTFP.
4.3.1 Impact of overall network structure on ALTFP
Table 5 reports the estimation results of the impact of overall network structure on ALTFP. Where model (1) is the result of OLS estimation and models (2) to (5) are the results of panel quantile estimation. It can be seen that the OLS estimated coefficients of network density, network connectedness, network hierarchy, and network efficiency are 5.045, 8.050, −2.008, and −0.147, all of which pass the 1% significance test, indicating that the overall network structure has a significant effect on the level of ALTFP. Increasing network density and network relevance, reducing network hierarchy and network efficiency can significantly improve the level of low carbon TFP in agriculture. The quantile regression estimation results showed that each indicator of network structure characteristics passed the 1% significance test at each quantile, and the signs were all consistent with the OLS estimation results, further indicating the reliability of the above results. This result is consistent with the findings of Qu and Huang (2021) and Chen Z. et al. (2022).
This may be because, firstly, the increase in network density indicates an increase in the number of associated relationships in the network, and the core provinces will exert a strong diffusion effect to drive the development of inter-provincial complementarities, ultimately promoting the growth of the ALTFP. Second, increased network connectivity can enhance the robustness and inter-regional connectivity of the network, all provinces can join the network, there is no isolated area, and the enhanced spatial spillover effect promotes the growth of ALTFP. Again, the reduction of network hierarchy can make the original one-way connected provinces develop into two-way connectivity, the advantageous provinces and the disadvantaged provinces gradually tend to be equal, and the provincial-led low-carbon TFP development model with the high level of economic development and rich agricultural science and technology resources changes to the overall agricultural green and coordinated development model, thus improving the overall agricultural green development level. Finally, the reduction of network efficiency has increased the connections in the relevant networks, that is, the network hierarchy has been reduced, thus reducing the factor endowment differences among provinces in agricultural low-carbon development, lowering the inter-provincial flow costs of agricultural low-carbon development factors, enhancing the relevance of regional resources to agricultural low-carbon development, and significantly improving the overall level of ALTFP.
4.3.2 Effect of regional network structure on ALTFP
The E-I index reflects the severity of regional assignment, and as shown in Table 6, regional network structure under OLS estimation significantly affects ALTFP at the 5% level with a coefficient of 0.380, indicating that the weakening of regional factional forestry is conducive to promoting agricultural low-carbon development. The quantile regression results show that the regional network structure can only play a role in the enhancement of ALTFP if the level of ALTFP is at the 75%.
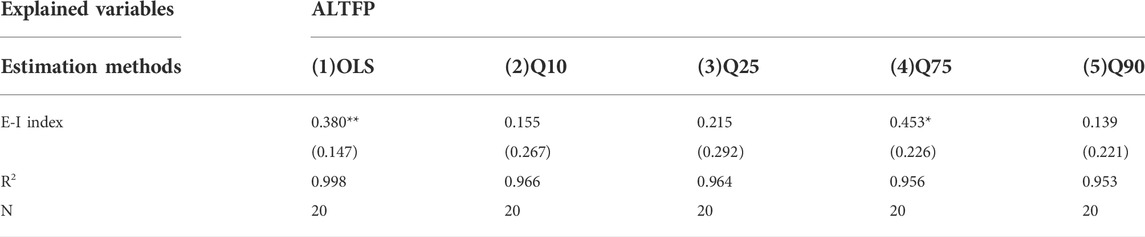
TABLE 6. Results of the regional network structure influencing the effects.
4.3.3 Effect of individual network structure on ALTFP
Model (1) in Table 7 is an OLS estimation using a panel data model, and models (2) to (3) are panel quantile regressions under the adaptive Monte Carlo method. Among them, the estimation results for the 25%, 50%, and 75% quantile points differ only slightly from those for the 10% and 90% quantile points in terms of the magnitude of the coefficients and are otherwise basically the same, so they are not shown in Table 7.
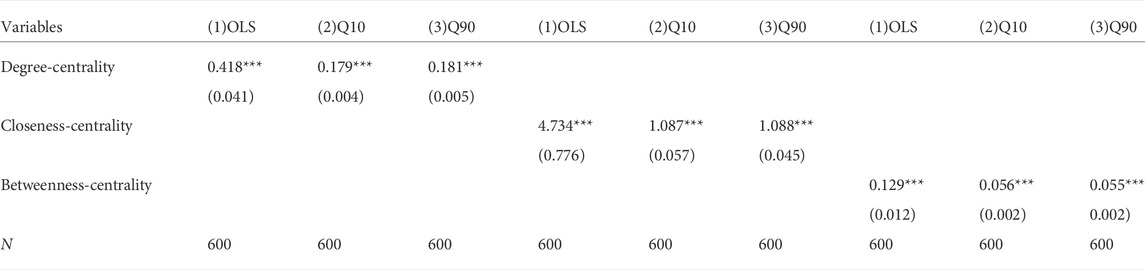
TABLE 7. Results for individual network structure effects.
The OLS regression coefficients of degree-centrality, closeness-centrality, and betweenness-centrality are 0.418, 4.734, and 0.129, all of which are significant at the 1% significance level, indicating a significant positive effect of provincial centrality on increasing the level of ALTFP. This finding is consistent with that of Chen Z. et al. (2022).
Possible reasons are: firstly, the higher the centrality, the closer the relationship between a province and other provinces, and accordingly the higher the degree of local relevance, the more favorable it is that all provinces can benefit from the whole network structure and improve their ALTFP. Secondly, higher closeness-centrality means that the greater the sum of shortcut distances between a province and other provinces, the less likely the province’s agricultural low-carbon development is constrained by other provinces, the closer the inter-provincial relationship, the higher the degree of inter-provincial communication and cooperation, the lower the cost of factor flow and resource allocation, and the increasing level of the province’s agricultural low-carbon development. Finally, the provinces with higher betweenness-centrality have obvious comparative advantages in the ALTFP network, which can effectively guide the rational allocation of resource factors, effectively control the correlation effect with other provinces, and make the huge network structure regionally effective and reasonable, thus contributing to regional agricultural low-carbon development.
5 The analysis of driving factors about spatial differences of ALTFP
5.1 Analysis of driving factors of spatial association network of ALTFP
According to the mechanism analysis, the “potential energy difference” due to the difference between regions is the main driving force for the spatial closeness of the association of ALTFP. Next, the factors affecting the spatial association network are discussed, and the following nine relational variables are selected to examine the factors affecting the spatial association: 1) spatial proximity of Provincial adjacency (RO) is expressed as 1 if the two provinces are adjacent, otherwise it is 0. It has been confirmed that low carbon efficiency in agriculture between neighboring regions affects each other (Wu et al., 2015); 2) agricultural industry structure differences (ST) are expressed by the proportion of the output value of the farming in the total output value of agriculture, forestry, livestock, and fishery. Different crops differ in terms of resource consumption, marginal benefits, and carbon effects. Accordingly, the structure of farmland use determines the input mix, desirable output, and environmental burden. Therefore, the restructuring of farmland use may affect the flow and allocation of factors, which in turn affects agricultural low-carbon development generating spatial correlations (Zhu et al., 2019); 3) urbanization level differences (UR) are expressed by the proportion of the urban resident population to the total population. The essence of the urbanization process is a multidimensional transmutation process accompanied by the flow of capital, labor, technology, and other factors from the countryside to the city, and the reconfiguration of factors between urban and rural areas, which has a great impact on the production scale and cultivation structure of agriculture (Tian et al., 2016; Xiong et al., 2020; Joséf, 2022); 4) rural labor education level differences (ED) is expressed by the average years of education of rural residents. The labor force is the decision maker of agricultural production methods and its level of education has a significant impact on the adoption and application of pioneering technologies (Wang et al., 2019; Wu et al., 2021; Khanh and Nguyen, 2022); 5) financial development level differences (FI) is expressed by the ratio of deposit and loan balance of financial institutions to GDP, a sound financial service system can provide financial support for agricultural transformation and upgrading and green technology progress (Huang et al., 2014; Cao et al., 2022; Gao et al., 2022); 6) agricultural irrigation water utilization rate differences (WA) is expressed by the ratio of effective irrigated area to cultivated area in each region, agricultural irrigation water use efficiency can affect agricultural carbon emissions and output efficiency by changing inter-regional agricultural production costs and intra-agricultural production structure (Xu et al., 2022); 7) farmland operation scale differences (SC) is expressed by the per capita crop sown area, it has been proven that the scale of agricultural production leads to differences in the cost of adoption of agricultural technology, and that larger scale of operation makes it easier to obtain economies of scale and adopt advanced technology (Helfand and Taylor, 2021; Mao et al., 2021); 8) financial support differences (IN) is expressed by the proportion of local financial expenditure on agriculture, many scholars have found that financial support for agriculture significantly affects agricultural carbon emissions (Guo et al., 2022); 9) marketization level differences (MA) is expressed by the marketization index measurements, according to (Fan et al., 2011). The level of marketization determines the flow and allocation of production factors and therefore has an impact on the spatial association network (Guo et al., 2021). The model was constructed as follows:
Where R is the spatial correlation matrix of ALTFP after binarization, the rest of the indicator data are variance matrices consisting of the absolute differences in the mean values of the corresponding indicators for each province from 2001 to 2020. Figure 7 shows the results of the QAP analysis of the driving factors, it can be seen that there are different degrees of correlation between the drivers, implying that the impact of the driving factors on the spatial correlation network overlaps significantly and there is a high degree of multicollinearity among the driving factors, further indicating that the QAP regression analysis is more appropriate.
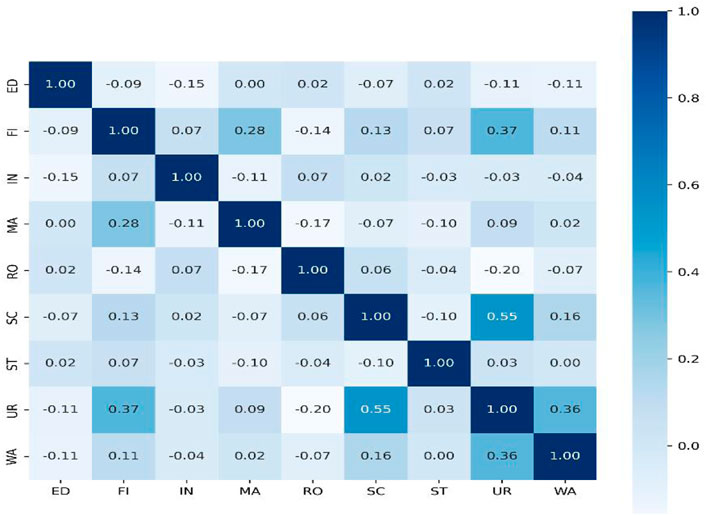
FIGURE 7. Heat map of correlation coefficients of driving factors.
5.2 QAP correlation analysis
The correlation coefficients of each influencing factor with the structure of the spatial correlation network of low-carbon TFP in Chinese agriculture were first tested using the QAP method of the quadratic assignment procedure, as shown in Table 8. It can be seen that the correlation coefficients for province adjacency, differences in urbanization levels, differences in the education level of the rural labors, differences in financial development levels, and differences in agricultural irrigation water utilization rates are all significant, indicating that these influencing factors had a significant impact on the formation of the spatial correlation network. In contrast, the correlation coefficients of differences in agricultural industry structure, the scale of farmland operation, financial support to agriculture, and the level of marketization are not significant, indicating that their inter-provincial differences do not play a significant role in the spatial association structure of ALTFP.
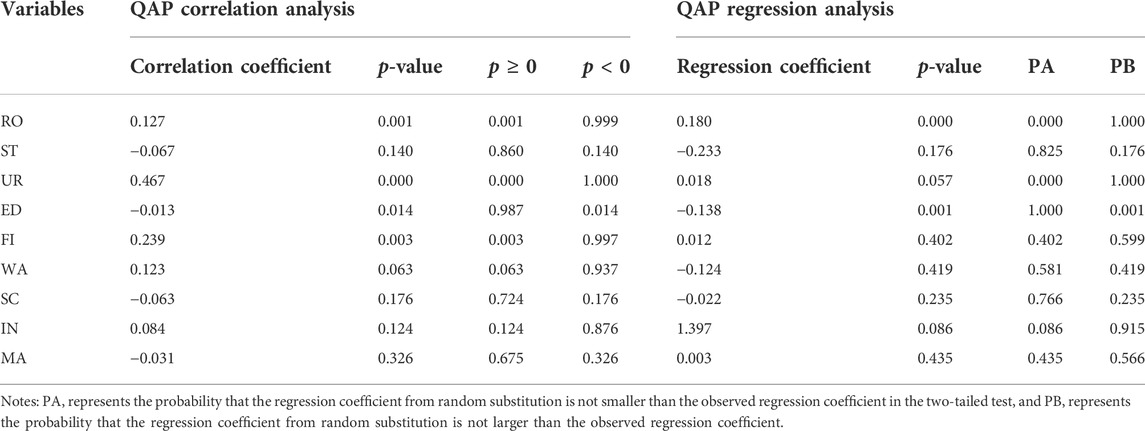
TABLE 8. The analysis of driving factors of spatial association network of ALTFP.
5.3 QAP regression analysis
Using QAP regression to analyze the relationship between the spatial association network and the drivers, the results of regression fitting were obtained by 2000 random permutations (Table 8). The adjusted decision coefficient was 0.301, indicating that the drivers could explain about 30.10% of the variation in the structure of the spatial association.
The spatial proximity of provinces, differences in urbanization, differences in financial support for agriculture, differences in financial development levels, and differences in marketization have a positive effect on the formation of spatially linked networks. Among them: the coefficient of spatial proximity is significantly positive, which indicates that inter-provincial geographical proximity can break down the barriers to resource flow and promote provincial mobility for low-carbon agricultural development. The specific reason may be the geographical proximity of the location with many similar characteristics, such as geographical environment, resource endowment, cultivation structure, and technology level, etc. These similarities reduce the cost of production factor flow and low-carbon technology diffusion and promote closer inter-regional linkages. The coefficient of urbanization differences is significantly positive, which indicates that provinces with greater urbanization differences are more likely to have economic linkages between regions, probably mainly because of the difference in urbanization levels, with factors such as labor and capital tending to flow more from provinces with low levels of urbanization to those with high levels of urbanization, in the process promoting the spread of technological progress and radiation to neighboring regions. The coefficient of the difference in fiscal support to agriculture is significantly positive, which indicates that the greater the difference in the level of fiscal support to agriculture between provinces, the more likely it is to cause spatial correlation, mainly because finance provides the foundation for agricultural production, infrastructure, and advanced technology, the higher the level of financial support for agriculture in a province, the more it helps the region to establish a model for low-carbon agricultural development, attracting regions that are lagging behind in development to learn from and exchange with these regions, and promoting policy references and the diffusion and application of low-carbon technologies among provinces. And the regression coefficients of differences in the level of financial development and differences in the level of marketization are not significant (p > 0.1), indicating that inter-provincial differences do not yet significantly affect the formation of ALTFP spatial association networks in China.
Differences in the education level of rural labor, differences in irrigation water use efficiency in agriculture, differences in agricultural industry structure, and differences in agricultural production scale have negative effects on the formation of spatial association networks. Among them: the coefficient of influence of the difference in the education level of the rural labor is significantly negative, which indicates that the greater the difference in the education level of the regional rural labor force, the fewer its agricultural economic linkages, this is mainly because agricultural human capital largely affects the application of advanced agricultural technologies, and if the difference in human capital between regions is too large, it is not conducive to the absorption and digestion of technological overflows from advanced regions by regions with relatively low technology levels and will hinder the spread of advanced agricultural production technologies, thus not conducive to the formation of ALTFP spatially linked networks. Regression coefficients for differences in agricultural irrigation water use efficiency, differences in agricultural industry structure, and differences in agricultural production scale are not significant (p > 0.1), indicating that inter-provincial differences do not yet significantly affect the formation of ALTFP spatial association networks in China.
Agricultural irrigation water use efficiency reflects resource endowment. Generally speaking, the greater the difference in resource endowment, the stronger the complementarity between regions, and the more frequent the flow of logistics, capital, and technology with resource flow as the carrier, the more conducive to the formation and development of a spatially linked network of green economic efficiency. However, the results of this paper show that the effect of differences in agricultural irrigation water use efficiency on the spatial linkage network is not significant, probably because the role of resource endowment differences on the spatial linkage of green economic efficiency has been reduced in recent years as the development approach has shifted from factor-driven to innovation-driven, and technology substitution effects have become prominent. The main reasons for the insignificant effect of agro-industrial structure and marketization on the association network are: Due to the sticky nature of agricultural production and the inherent characteristics of agriculture such as strong dependence on natural resources and environmental endowments and weak risk resistance, the internal industrial structure of agriculture is more stable, resulting in the slow development of agricultural factor markets. At the same time, Chinese agriculture has been a distinctive “big country, small farmer” model since ancient times, so the impact of differences in agricultural production scale on spatial association networks is not obvious. The smaller penetration of financial development into the agricultural economy compared to other sectors may be the reason for the insignificant effect of differences in financial development on spatial association relationships.
6 Conclusion and implications
6.1 Conclusion
In our study, by examining the ALTFP of 30 Chinese provinces from 2001 to 2020, we explored the network characteristics and driving mechanisms of spatially linked relationships with the help of UCINET visualization tools and social network analysis methods, and we mainly obtained the following conclusions and insights.
1) In terms of network structural characteristics, the spatially linked network of low-carbon development in China’s agriculture has broken the traditional geographical limitation of “neighbors as friends” and exhibited a complex network of links. However, the overall network structure is relatively loose, and there is still much room for improving the coordinated development of low-carbon agriculture between provinces. The connectivity and robustness of the network are gradually strengthened, but the network still has a certain hierarchical gradient and some redundant relationship numbers, the network structure needs to be further optimized. In terms of regional network structure characteristics, the correlations of China’s agricultural low-carbon development during 2001–2020 tend to occur among the four major plates in the east, center, west, and northeast, with a smaller degree of factional forestry, the eastern region is more connected to other regions, while there are fewer connections between the central, western and northeastern. Individual network characteristics show that there is a significant “Matthew effect” in China’s agricultural low-carbon development. The eastern provinces of Shanghai, Beijing, Tianjin, Jiangsu, Zhejiang, and Fujian are at the heart of the entire network and have a stronger role in allocating resources needed for agricultural low-carbon development, while remote provinces such as Xinjiang, Jilin, Liaoning, and Anhui are at the edge of the network and have a weaker ability to access resources for agricultural low-carbon development.
2) The analysis of the network structure effect shows that network structure has a significant effect on the level of low carbon in agriculture, and increasing the overall network density and network relevance, decreasing the network hierarchy and network efficiency can significantly increase the ALTFP. The weakening of regional factional forestry is conducive to promoting low-carbon agricultural development. The province’s central position in the network and its dominance and control over resources and factors in low-carbon agricultural development are conducive to increasing the ALTFP. The panel quantile regression model further verified the reliability of the above findings.
3) The QAP results show that the spatial proximity of provinces, the widening of differences in urbanization levels and differences in financial support for agriculture, and the narrowing of differences in the educational attainment of the rural labor have significantly contributed to the formation of provincial spatial linkages And differences in the level of financial development, differences in the level of marketization, differences in the efficiency of agricultural irrigation water use, differences in the structure of agricultural industries and differences in the scale of agricultural production do not have significant effects on the spatial correlation network of ALTFP, and their response mechanisms and response effects need to be further explored.
6.2 Implications
Firstly, inter-provincial geographical proximity can break down barriers to resource flows and facilitate provincial flows of low-carbon development in agriculture, for example, the development of city clusters such as Yangtze River Delta and Pearl River Delta is conducive to promoting the formation of related networks, so the linkage leading effect of China’s city clusters and metropolitan areas should be accelerated. At the same time, it is necessary to promote the construction of agricultural low-carbon development demonstration areas, strengthen the interconnection of core and peripheral regions, eliminate the Matthew effect of agricultural low-carbon TFP, and give full play to the role of the “leader” of Beijing-Tianjin-Hebei and the Yangtze River Delta, which are regions with high levels of economic development, to radiate and drive the balanced development of the region, to narrow the gap between provinces in the spatially linked network of green economy in terms of capital, technology, and management methods, effectively reduce the network hierarchy, and realize the spatial synergy of green economy development.
Secondly, the central and western regions need to strengthen spatial ties with developed regions, ride on the coattails of the urbanization process, undertake the overflow of factor resources such as capital, industry, and technology from the eastern regions, and formulate more precise regional policies to enable the flow of factors to the central and western regions under the guidance of market mechanisms. At the same time, the construction of agricultural low-carbon development demonstration regions within the central and western regions should also be accelerated to form a polycentric pattern of agricultural low-carbon development, which reduces the rising transaction costs in the central and western regions and accelerates the flow of agricultural resources and factor capital in the marginal regions.
Finally, local governments should clarify the position and role of each region in the low-carbon development of agriculture, give full play to the role of government macro-control and market regulation mechanisms to promote the spatial correlation of green economic development, minimize the intervention in the financial system leading to financial distortion, and effectively guide the financial expenditure to support the low-carbon development of agriculture. At the same time, we should also focus on the improvement of education level in the backward areas and gradually narrow the gap between the educational level of the labor force in the backward areas and the developed areas.
6.3 Research deficiencies and future directions
Although the paper makes an obvious contribution to the low carbon development of agriculture, there are still some limitations: First, considering the limitation of data availability, this paper examines the spatial correlation network of low carbon development of Chinese agriculture from the provincial level, and the results are relatively rough; in the subsequent research, the data should be further explored in depth to refine the research results and make the paper more valuable in the application. Second, for the analysis of spatially linked network drivers of low carbon development in agriculture, the paper selects nine aspects of influencing factors, and inevitably there are other influencing factors, such as climate and soil type, which should continue to be explored more deeply in future studies.
Data availability statement
The original contributions presented in the study are included in the article/Supplementary Material, further inquiries can be directed to the corresponding authors.
Author contributions
FF conducted data collection and measurement, and wrote the text. JZ conceived of the research, made the structure, supervised this research work. LZ provided guidance on the methodology and an overall grasp of the logical structure of the text provided. JD provided a great deal of assistance in data collection and organization, and in writing the text.
Acknowledgments
We thank the National Social Science Foundation of China “Research on intellectual property innovation mechanism of rural tourism cultural industry” (19XJY018) and the Graduate “Silk Road” Research Innovation Project of Xinjiang University “Regional Differences and Dynamic Evolution of Agricultural Green Total Factor Productivity” (SL2022007) for financial support.
Conflict of interest
The authors declare that the research was conducted in the absence of any commercial or financial relationships that could be construed as a potential conflict of interest.
Publisher’s note
All claims expressed in this article are solely those of the authors and do not necessarily represent those of their affiliated organizations, or those of the publisher, the editors and the reviewers. Any product that may be evaluated in this article, or claim that may be made by its manufacturer, is not guaranteed or endorsed by the publisher.
Footnotes
1In this paper, we mainly measure agricultural green/low carbon total factor productivity with agricultural carbon emissions as non-expected output, which is also the currently adopted method, and all will appear in the paper as agricultural low carbon TFP for conceptual clarity.
References
Adnan, N., Nordin, S. M., and Ali, M. (2018). A solution for the sunset industry: Adoption of green fertiliser technology amongst Malaysian paddy farmers. Land Use Policy 79, 575–584. doi:10.1016/j.landusepol.2018.08.033
Ang, B. W., and Su, B. (2016). Carbon emission intensity in electricity production: A global analysis. Energy Policy 94, 56–63. doi:10.1016/j.enpol.2016.03.038
Bai, C., Zhou, L., Xia, M., and Feng, C. (2020). Analysis of the spatial association network structure of China's transportation carbon emissions and its driving factors. J. Environ. Manag. 253, 109765. doi:10.1016/j.jenvman.2019.109765
Bai, L., Wan, Z., Luo, Q., Lin, W., and Fang, W. (2012). Analysis of changes of Chinese agricultural total factor productivity and its convergencefrom the 1996-2010 annual malmquist index approach. Res. Agric. Mod. 33 (5), 552–555.
Battese, G. E., Rao, D. S. P., and O'Donnell, C. J. (2004). A metafrontier production function for estimation of technical efficiencies and technology gaps for firms operating under different technologies. J. Prod. analysis 21 (1), 91–103. doi:10.1023/B:PROD.0000012454.06094.29
Cai, L., Wu, X., and Du, Z. (2022). The spatio-temporal pattern of environmentally-friendly agricultural technology diffusion and its influencing factors: From the social network perspective. Geogr. Res. 41 (1), 63–78.
Cao, J., Law, S. H., Bin Abdul Samad, A. R., Binti W Mohamad, W. N., Wang, J., and Yang, X. (2022). Effect of financial development and technological innovation on green growth—analysis based on spatial durbin model. J. Clean. Prod. 365, 132865. doi:10.1016/j.jclepro.2022.132865
Carter, M. R., Cheng, L., and Sarris, A. (2016). Where and how index insurance can boost the adoption of improved agricultural technologies. J. Dev. Econ. 118, 59–71. doi:10.1016/j.jdeveco.2015.08.008
Chen, Y., Fu, W., and Wang, J. (2022a). Evaluation and influencing factors of China's agricultural productivity from the perspective of environmental constraints. Sustainability 14 (5), 2807. doi:10.3390/su14052807
Chen, Z., Sarkar, A., Rahman, A., Li, X., and Xia, X. (2022b). Exploring the drivers of green agricultural development (gad) in China: A spatial association network structure approaches. Land use policy 112, 105827. doi:10.1016/j.landusepol.2021.105827
Cheng, L., Zhang, J., Zeng, Y., and Wu, X. (2016). Analysis on the dynamic evolution and spatial club convergence of national agricultural carbon productivity. J. China Agric. Univ. 21 (7), 121–132.
Cui, Y., Khan, S. U., Deng, Y., Zhao, M., and Hou, M. (2021). Environmental improvement value of agricultural carbon reduction and its spatiotemporal dynamic evolution: Evidence from China. Sci. Total Environ. 754, 142170. doi:10.1016/j.scitotenv.2020.142170
Dakpo, K. H., Jeanneaux, P., and Latruffe, L. (2016). Modelling pollution-generating technologies in performance benchmarking: Recent developments, limits and future prospects in the nonparametric framework. Eur. J. Operation. Res. 250 (2), 347–359. doi:10.1016/j.ejor.2015.07.024
Escribano, M., Horrillo, A., and Mesías, F. J. (2022). Greenhouse gas emissions and carbon sequestration in organic dehesa livestock farms. Does technical-economic management matters? J. Clean. Prod. 372, 133779. doi:10.1016/j.jclepro.2022.133779
Fan, G., Wang, X., and Ma, G. (2011). The contribution of marketization to China's economic growth. Econ. Res. J. 46 (9), 4–16.
Fang, L., Hu, R., Mao, H., and Chen, S. J. (2021). How crop insurance influences agricultural green total factor productivity: Evidence from Chinese farmers. J. Clean. Prod. 321, 128977. doi:10.1016/j.jclepro.2021.128977
Fukuyama, H., and Weber, W. L. (2009). Estimating indirect allocative inefficiency and productivity change. J. Operation. Res. Soc. 60 (11), 1594–1608. doi:10.1057/jors.2009.62
Gao, Q., Cheng, C., Sun, G., and Li, J. (2022). The impact of digital inclusive finance on agricultural green total factor productivity: Evidence from China. Front. Ecol. Evol. 10, 905644. doi:10.3389/fevo.2022.905644
Genius, M., Koundouri, P., Nauges, C., and Tzouvelekas, V. (2014). Information transmission in irrigation technology adoption and diffusion: Social learning, extension services, and spatial effects. Am. J. Agric. Econ. 96 (1), 328–344. doi:10.1093/ajae/aat054
Gong, B. (2020). Agricultural productivity convergence in China. China Econ. Rev. 60. doi:10.1016/j.chieco.2020.101423
Guan, D., Hubacek, K., Weber, C. L., Peters, G. P., and Reiner, D. M. (2008). The drivers of Chinese Co2 emissions from 1980 to 2030. Glob. Environ. Change 18 (4), 626–634. doi:10.1016/j.gloenvcha.2008.08.001
Guo, H., and Liu, X. (2021). Spatial and temporal differentiation and convergence of China's agricultural green total factor productivity. Quantitative Tech. Econ. 38 (10), 65–84. doi:10.13653/j.cnki.jqte.2021.10.004
Guo, L., Guo, S., Tang, M., Su, M., and Li, H. (2022). Financial support for agriculture, chemical fertilizer use, and carbon emissions from agricultural production in China. Int. J. Environ. Res. Public Health 19 (12), 7155. doi:10.3390/ijerph19127155
Guo, L., Li, H., Cao, X., Cao, A., and Huang, M. (2021). Effect of agricultural subsidies on the use of chemical fertilizer. J. Environ. Manag. 299, 113621. doi:10.1016/j.jenvman.2021.113621
Hamid, S., and Wang, K. (2022). Environmental total factor productivity of agriculture in south asia: A generalized decomposition of luenberger-hicks-moorsteen productivity indicator. J. Clean. Prod. 351, 131483. doi:10.1016/j.jclepro.2022.131483
Hao, A., Tan, J., Ren, Z., and Zhang, Z. (2022). A spatial empirical examination of the relationship between agglomeration and green total-factor productivity in the context of the carbon emission peak. Front. Environ. Sci. 10, 829160. doi:10.3389/fenvs.2022.829160
Hao, Y., Ba, N., Ren, S., and Wu, H. (2021). How does international technology spillover affect China's carbon emissions? A new perspective through intellectual property protection. Sustain. Prod. Consum. 25, 577–590. doi:10.1016/j.spc.2020.12.008
He, Y., Wei, Z., Liu, G., and Zhou, P. (2020). Spatial network analysis of carbon emissions from the electricity sector in China. J. Clean. Prod. 262, 121193. doi:10.1016/j.jclepro.2020.121193
Helfand, S. M., and Taylor, M. P. H. (2021). The inverse relationship between farm size and productivity: Refocusing the debate. Food Policy 99, 101977. doi:10.1016/j.foodpol.2020.101977
Huang, J., Lv, H., and Wang, L. (2014). Mechanism of financial development influencing regional green development:based on eco-efficiency and spatial econometrics. Geogr. Res. 33 (3), 532–545. doi:10.11821/dlyj201403012
Huo, T., Cao, R., Xia, N., Hu, X., Cai, W., and Liu, B. (2022). Spatial correlation network structure of China's building carbon emissions and its driving factors: A social network analysis method. J. Environ. Manag. 320, 115808. doi:10.1016/j.jenvman.2022.115808
Ji, C., and Xia, H. (2020). Study on the impact of agricultural science and technology service on agricultural green total factor productivity in China. J. China Agric. Resour. Regional Plan. 41 (12), 136–134.
Joséf, A., Cassman, K. G., Rattalino Edreira, J. I., Agus, F., Bala, A., Deng, N., et al. (2022). Impact of urbanization trends on production of key staple crops. Ambio 51 (5), 1158–1167. doi:10.1007/s13280-021-01674-z
Khanh, C., and Nguyen, T. (2022). Driving factors for green innovation in agricultural production: An empirical study in an emerging economy. J. Clean. Prod. 368, 132965. doi:10.1016/j.jclepro.2022.132965
Li, C., and Wu, J. (2022). Land use transformation and eco-environmental effects based on production-living-ecological spatial synergy: Evidence from shaanxi province, China. Environ. Sci. Pollut. Res. 29 (27), 41492–41504. doi:10.1007/s11356-022-18777-z
Li, Q., Li, G., Gao, X., and Yin, C. (2019). Analysis of regional gap and spatital convergence of agricultural total factor productivity growth. J. China Agric. Resour. Regional Plan. 40 (7), 28–36.
Li, Y., Lu, Q., and Guo, G. (2017). Effects of social network on water-saving irrigation technology adoption: Homogeneity or heterogeneity. Res. Agric. Mod. 38 (6), 978–986. doi:10.13872/j.1000-0275.2017.0048
Li, Z., Li, X., Sun, Q., and Ye, W. (2021). Will financial subsidies for agriculture effectively increase the total factor productivity of food: The moderate effect of agricultural technology environment. J. China Agric. Univ. 26 (8), 236–252.
Liu, M., and Yang, L. (2021). Spatial pattern of China’s agricultural carbon emission performance. Ecol. Indic. 133, 108345. doi:10.1016/j.ecolind.2021.108345
Liu, S., and Xiao, Q. (2021). An empirical analysis on spatial correlation investigation of industrial carbon emissions using sna-ice model. Energy 224, 120183. doi:10.1016/j.energy.2021.120183
Liu, X., Li, Q., Wu, C., Ma, J., Hong, Z., Zheng, K., et al. (2022). EGF signaling promotes the lineage conversion of astrocytes into oligodendrocytes. Mol. Med. 43 (1), 50–59. doi:10.1186/s10020-022-00478-5
Liu, Y., Ouyang, Y., and Cai, H. (2021). Evaluation of China's agricultural green tfp and its spatiotemporal evolution characteristics. Quantitative Tech. Econ. 38 (5), 39–56. doi:10.13653/j.cnki.jqte.2021.05.003
Lui, G. C. S., Li, W. K., Leung, K. M. Y., Lee, J. H. W., and Jayawardena, A. W. (2007). Modelling algal blooms using vector autoregressive model with exogenous variables and long memory filter. Ecol. Model. 200 (1), 130–138. doi:10.1016/j.ecolmodel.2006.06.017
Luo, X., Yang, J., Sun, W., and He, B. (2021). Suitability of human settlements in mountainous areas from the perspective of ventilation: A case study of the main urban area of chongqing. J. Clean. Prod. 310, 127467. doi:10.1016/j.jclepro.2021.127467
Mao, H., Zhou, L., Ying, R., and Pan, D. (2021). Time preferences and green agricultural technology adoption: Field evidence from rice farmers in China. Land Use Policy 109, 105627. doi:10.1016/j.landusepol.2021.105627
O'Donnell, C. J., Rao, D. S. P., and Battese, G. E. (2008). Metafrontier frameworks for the study of firm-level efficiencies and technology ratios. Empir. Econ. 34 (2), 231–255. doi:10.1007/s00181-007-0119-4
Oh, D.-h. (2010). A global malmquist-luenberger productivity index. J. Product. Anal. 34 (3), 183–197. doi:10.1007/s11123-010-0178-y
Pastor, J. T., and Lovell, C. A. K. (2005). A global malmquist productivity index. Econ. Lett. 88 (2), 266–271. doi:10.1016/j.econlet.2005.02.013
Paul, C., Techen, A. K., Robinson, J. S., and Helming, K. (2019). Rebound effects in agricultural land and soil management: Review and analytical framework. J. f Clean. Prod. 227, 1054–1067. doi:10.1016/j.jclepro.2019.04.115
Powell, D. (2020). Quantile treatment effects in the presence of covariates. Rev. Econ. Statistics 102 (5), 994–1005. doi:10.1162/rest_a_00858
Qian, Y., Song, K., Hu, T., and Ying, T. (2018). Environmental status of livestock and poultry sectors in China under current transformation stage. Sci. Total Environ. 622, 702–709. doi:10.1016/j.scitotenv.2017.12.045
Qin, Q., Yan, H., Liu, J., Chen, X., and Ye, B. (2022). China's agricultural ghg emission efficiency: Regional disparity and spatial dynamic evolution. Environ. Geochem. Health 44 (9), 2863–2879. doi:10.1007/s10653-020-00744-7
Ren, S., Li, L., Han, Y., Hao, Y., and Wu, H. (2022). The emerging driving force of inclusive green growth: Does digital economy agglomeration work? Bus. Strategy Environ. 31 (4), 1656–1678. doi:10.1002/bse.2975
Shen, Z., Baležentis, T., and Ferrier, G. D. (2019). Agricultural productivity evolution in China: A generalized decomposition of the luenberger-hicks-moorsteen productivity indicator. China Econ. Rev. 57, 101315. doi:10.1016/j.chieco.2019.101315
Song, J., Cho, C., and Won, Y. (2019). Analysis of operating system identification via fingerprinting and machine learning. Comput. Electr. Eng. 78, 1–10. doi:10.1016/j.compeleceng.2019.06.012
Song, M., Peng, J., Wang, J., and Zhao, J. (2018). Environmental efficiency and economic growth of China: A ray slack-based model analysis. Eur. J. Operational. Res. 269 (1), 51–63. doi:10.1016/j.ejor.2017.03.073
Suhariyanto, K., and Thirtle, C. (2001). Asian agricultural productivity and convergence. J. Agric. Econ. 52 (3), 96–110. doi:10.1111/j.1477-9552.2001.tb00941.x
Tian, J., Yang, H., Xiang, P., Liu, D., and Li, L. (2016). Drivers of agricultural carbon emissions in hunan province, China. Environ. Earth Sci. 75 (2), 121. doi:10.1007/s12665-015-4777-9
Tze Ling, N., Eheart, J. W., Cai, X., and Braden, J. B. (2011). An agent-based model of farmer decision-making and water quality impacts at the watershed scale under markets for carbon allowances and a second-generation biofuel crop. Water. Resour. Res. 47. doi:10.1029/2011WR010399
Wang, K., Wei, Y.-M., and Huang, Z. (2018). Environmental efficiency and abatement efficiency measurements of China's thermal power industry: A data envelopment analysis based materials balance approach. Eur. J. Operation. Res. 269 (1), 35–50. doi:10.1016/j.ejor.2017.04.053
Wang, L., Zhu, R., Yin, Z., Chen, Z., Lu, R., and Fang, C. (2022a). Quantifying the spatial–temporal patterns and influencing factors of agricultural carbon emissions based on the coupling effect of water–land resources in arid inland regions. Front. Environ. Sci. 10. doi:10.3389/fenvs.2022.908987
Wang, S., Huang, J., Wang, X., and Tuan, F. (2019). Are China's regional agricultural productivities converging: How and why? Food Policy 86, 101727. doi:10.1016/j.foodpol.2019.05.010
Wang, Z., Zhou, Y., Zhao, N., Wang, T., and Zhang, Z. (2022b). Spatial correlation network and driving effect of carbon emission intensity in China’s construction industry. Buildings 12 (2), 201. doi:10.3390/buildings12020201
Wu, H., Xu, L., Ren, S., Hao, Y., and Yan, G. (2020a). How do energy consumption and environmental regulation affect carbon emissions in China? New evidence from a dynamic threshold panel model. Resour. Policy 67, 101678. doi:10.1016/j.resourpol.2020.101678
Wu, H., Xue, Y., Hao, Y., and Ren, S. (2021). How does internet development affect energy-saving and emission reduction? Evidence from China. Energy Econ. 103, 105577. doi:10.1016/j.eneco.2021.105577
Wu, J., Ge, Z., Han, S., Xing, L., Zhu, M., Zhang, J., et al. (2020b). Impacts of agricultural industrial agglomeration on China's agricultural energy efficiency: A spatial econometrics analysis. J. Clean. Prod. 260, 121011. doi:10.1016/j.jclepro.2020.121011
Wu, Y., Rahman, R. A., and Yu, Q. (2022). Analysis of the spatial characteristics and influencing factors of agricultural eco-efficiency: Evidence from anhui province, china, during the period 2011-2018. Environ. Monit. Assess. 194 (3), 154. doi:10.1007/s10661-022-09817-9
Wu, X., Zhang, J., Cheng, L., and Tian, Y. (2015). Potential of agricultural carbon reduction under climate change and its spatial correlation characteristics in China: Based on the spatial durbin model. China Popul. Resour. Environ. 25 (6), 53–61.
Xiong, C., Chen, S., and Xu, L. (2020). Driving factors analysis of agricultural carbon emissions based on extended stirpat model of Jiangsu province, China. Growth Change 51 (3), 1401–1416. doi:10.1111/grow.12384
Xu, B., and Lin, B. (2017). Factors affecting CO2 emissions in China's agriculture sector: Evidence from geographically weighted regression model. Energy policy 104, 404–414. doi:10.1016/j.enpol.2017.02.011
Xu, H., Zhu, S., and Shi, H. (2022). Is it possible to reduce agricultural carbon emissions through more efficient irrigation: Empirical evidence from China. Water 14, 1218. doi:10.3390/w14081218
Yang, Q., Wang, J., Li, C., and Liu, X. (2019). The spatial differentiation of agricultural green total factor productivity and its driving factor recognition in China. Quantitative Tech. Econ. 36 (10), 21–37. doi:10.13653/j.cnki.jqte.2019.10.002
Yang, X., Su, X., Ran, Q., Ren, S., Chen, B., Wang, W., et al. (2022a). Assessing the impact of energy internet and energy misallocation on carbon emissions: New insights from China. Environ. Sci. Pollut. Res. 29 (16), 23436–23460. doi:10.1007/s11356-021-17217-8
Yang, X., Wang, W., Su, X., Ren, S., Ran, Q., Wang, J., et al. (2022b). Analysis of the influence of land finance on haze pollution: An empirical study based on 269 prefecture‐level cities in China. Growth Change. doi:10.1111/grow.12638
Qiu, Y., and Huang, D. (2021). The structural characteristics of trade networks along the “belt and Road” and their impacts on technological progress——An study based on social network analysis. Econ. Theory Bus. Manag. 41 (6), 66–80.
Yu, J., and Wu, J. (2018). The sustainability of agricultural development in China: The agriculture-environment nexus. Sustainability 10 (6), 1776. doi:10.3390/su10061776
Yue, D., Sarkar, A., Yu, C., Qian, L., and Minjuan, Z. (2021). The evolution of factors influencing green technological progress in terms of carbon reduction: A spatial-temporal tactic within agriculture industries of China. Front. Energy Res. 9doi. doi:10.3389/fenrg.2021.661719
Zhan, J., Tian, X., Zhang, Y., Yang, X., Qu, Z., and Tan, T. (2017). The effects of agricultural R&D on Chinese agricultural productivity growth: New evidence of convergence and implications for agricultural R&D policy. Can. J. Agric. Economics/Revue Can. d'agroeconomie. 65 (3), 453–475. doi:10.1111/cjag.12137
Zhang, L., Pang, J., Chen, X., and Lu, Z. (2019a). Carbon emissions, energy consumption and economic growth: Evidence from the agricultural sector of China's main grain-producing areas. Sci. Total. Environ. 665, 1017–1025. doi:10.1016/j.scitotenv.2019.02.162
Zhang, X., Meng, F., Li, H., Wang, L., Wu, S., Xiao, G., et al. (2019b). Optimized fertigation maintains high yield and mitigates N2o and No emissions in an intensified wheat–maize cropping system. Agric. Water Manag. 211, 26–36. doi:10.1016/j.agwat.2018.09.045
Zhao, R., Liu, Y., Tian, M., Ding, M., Cao, L., Zhang, Z., et al. (2018). Impacts of water and land resources exploitation on agricultural carbon emissions: The water-land-energy-carbon nexus. Land Use Policy 72, 480–492. doi:10.1016/j.landusepol.2017.12.029
Zhen, W., Qin, Q., and Wei, Y.-M. (2017). Spatio-temporal patterns of energy consumption-related ghg emissions in China's crop production systems. Energy Policy 104, 274–284. doi:10.1016/j.enpol.2017.01.051
Zhong, S., Li, Y., Li, J., and Yang, H. (2021). Measurement of total factor productivity of green agriculture in China: Analysis of the regional differences based on China. Plos One 16 (9), e0257239. doi:10.1371/journal.pone.0257239
Zhou, Y., Jiang, J., Ye, B., Zhang, Y., and Yan, J. (2020). Addressing climate change through a market mechanism: A comparative study of the pilot emission trading schemes in China. Environ. Geochem. Health 42 (3), 745–767. doi:10.1007/s10653-019-00258-x
Zhu, B., Zhang, M., Zhou, Y., Wang, P., Sheng, J., He, K., et al. (2019). Exploring the effect of industrial structure adjustment on interprovincial green development efficiency in China: A novel integrated approach. Energy Policy 134, 110946. doi:10.1016/j.enpol.2019.110946
Nomenclature
Super-RSBM Super-efficiency Ray Slacks-Based Model
GML Global Malmquist-Luenberger
RGML Super-RSBM method to characterize the low carbon TFP level in agriculture
RSBM-GML Super-efficiency Ray Slacks-Based Model - Global Malmquist-Luenberger
ALTFP low carbon TFP of agriculture.
Keywords: agriculture, low-carbon total factor productivity, spatially linked networks, social network analysis, super-efficiency ray slacks-based model
Citation: Fang F, Zhao J, Di J and Zhang L (2022) Spatial correlations and driving mechanisms of low-carbon agricultural development in china. Front. Environ. Sci. 10:1014652. doi: 10.3389/fenvs.2022.1014652
Received: 08 August 2022; Accepted: 14 September 2022;
Published: 03 October 2022.
Edited by:
Daniel Abreu, Federal University of Mato Grosso, BrazilReviewed by:
Haitao Wu, Beijing Institute of Technology, ChinaSiyu Ren, Nankai University, China
Zhenshuang Wang, Dongbei University of Finance and Economics, China
Chenxi Li, Xi’an University of Architecture and Technology, China
Copyright © 2022 Fang, Zhao, Di and Zhang. This is an open-access article distributed under the terms of the Creative Commons Attribution License (CC BY). The use, distribution or reproduction in other forums is permitted, provided the original author(s) and the copyright owner(s) are credited and that the original publication in this journal is cited, in accordance with accepted academic practice. No use, distribution or reproduction is permitted which does not comply with these terms.
*Correspondence: Jun Zhao, eGp4ZHRnQDEyNi5jb20=; Lijie Zhang, MTMwNzk5MjQzMDFAMTYzLmNvbQ==