 Manman Fan
 Wenzhao Zhang2
 Jiaogen Zhou
- 1Jiangsu Provincial Engineering Research Center for Intelligent Monitoring and Ecological Management of Pond and Reservoir Water Environment, Huaiyin Normal University, Huaian, China
- 2Institute of Subtropical Agriculture, Chinese Academy of Sciences, Changsha, China
Small water bodies are hotspots of biogeochemical cycles with large spatial and temporal heterogeneity of their greenhouse gas emission fluxes. To reveal the spatial and temporal variabilities of methane (CH4) and nitrogen dioxide (N2O) emission fluxes in small water bodies in subtropical agricultural headwater watersheds, monthly measurements of CH4 and N2O fluxes were performed in 53 ponds from May 2018 to July 2020. Results showed that the fluxes of CH4 and N2O exhibited distinct spatial and temporal variations, and generally showed a trend of high emission rate in summer and low emission rate in winter. Agricultural land use and pond management had important impacts on CH4 and N2O emission fluxes in ponds. The CH4 and N2O emission fluxes were significantly higher in the ponds with the landscape of farmland, tea plantation and residential area than those of forest, which might be relevant to the eutrophication of pond water bodies. The mean N2O emission flux in intensive fishing ponds was much higher than that in grass-fed fishing ponds and no fishing ponds. Moreover, the sustained-flux global warming potential (SGWP) in the eutrophic pond water bodies of farmland, tea plantation and residential area are significantly higher than that in oligotrophic water bodies of forest ponds. Our CH4 and N2O emission results suggest that the reduction potential of 4.98 kg C ha−1 y−1 for CH4 and 0.42 kg N ha−1 y−1 for N2O will occur in future if ecological management measures are implemented to improve the pond water quality from eutrophication to oligotrophic conditions.
1 Introduction
Methane (CH4) and nitrous oxide (N2O) are key radiatively active greenhouse gases (GHGs) in the atmosphere contributing to global warming, which contribute 16% and 6%, respectively, to global radiative forcing (World Meteorological Organization, 2016). According to Intergovernmental Panel on Climate Change (IPCC) (2013), the global warming potential (GWP) of CH4 is approximately 34 times greater than that of carbon dioxide (CO2), while the GWP of N2O is 298 times harmer than CO2 over a time span of 100 years. With the ever-increasing CH4 and N2O concentrations in the atmosphere, the global warming and its potential ecological imbalance has aroused researchers’ wide concern all over the world (Bastviken et al., 2008; Jacinthe et al., 2012; Paudel et al., 2015).
Aquatic ecosystems are regarded as very important sources/sinks of atmospheric GHGs, such as CH4 and N2O. Although small freshwater lakes and reservoirs cover about 3.7% of the Earth’s non-glaciated surface, they are yet sites of intense biogeochemical activity and represent large sources of CH4 and N2O emissions (Verpoorter et al., 2014; Prairie et al., 2018). Therefore, GHG emissions from aquatic systems are increasingly concerned. Numerous studies on the emission fluxes of GHGs from aquatic ecosystems has focused on rivers (Yang et al., 2015), natural lakes (Bastviken et al., 2008), and large reservoirs (Soumis et al., 2004). The above-mentioned researches pointed out that the emission fluxes of GHGs were influenced by nutrient contents, climatic conditions, water depths, water pH, water thermal regimes, biological activity, etc. (Williams and Crutzen, 2010; Natchimuthu et al., 2014).
Ponds and small reservoirs, as two major artificial wetlands, emitted plenty of atmospheric CH4 and N2O, largely due to the periodic dry/wet alteration episodes and intensive organic material and nitrogen fertilizer inputs (Zou et al., 2005; Hu et al., 2012; Liu et al., 2016). Interestingly, relative to the size of small water bodies, ponds and small reservoirs seem to contribute disproportionately to GHG emissions (Ollivier et al., 2018; Gorsky et al., 2019). The very small ponds (<0.001 km2), which represent 8.6% of lakes and ponds by area globally, were estimated to account for more than 15% of CO2 emission and 40% of CH4 emissions (Holgerson and Raymond, 2016). Compared with large reservoirs such as lakes and oceans, it may be seriously underestimated about the importance of ponds and small reservoirs with shallow water depth, small area and diverse and complex physical and geographical characteristics in the global biogeochemical cycle. In particular, such ponds and small reservoirs are often prone to hypoxia, which may be an important but long neglected CH4 emission source. However, there is still lack of field direct measurements of CH4 and N2O emissions from ponds and small reservoirs to gain an insight into regional or global estimates of CH4 and N2O source strengths (Laurion et al., 2010; Abnizova et al., 2012; Kauffman et al., 2018).
Ponds and small reservoirs have many positive ecosystem functions such as biodiversity maintenance, carbon sequestration, pollutant absorption and cultural services including education and aesthetics, but it remains unclear whether the ponds and small reservoirs might also provide some negative functions, i.e., the negative contribution of excessive CH4 and N2O emissions to global climate change (Moore and Hunt, 2012). To test for hypothesized disservices of ponds and small reservoirs in subtropical region of southern China, we selected the subtropical agricultural headwater watershed of Jinjing as the study area, and set long-term observation points of ponds to explore the CH4 and N2O emissions. The principal objectives of this study were to 1) determine CH4 and N2O emissions from ponds in the headwater watershed of Jinjing; 2) reveal the spatial and temporal patterns of CH4 and N2O emissions in the studied ponds; 3) evaluate the reduction potential of CH4 and N2O emissions in the ponds.
2 Materials and methods
2.1 Study area and sampling sites
This study area is located in the agricultural headwater watershed of Jinjing (27°55′–28°40′N, 112°56′–113°30′E) (Figure 1A), in the northeastern Changsha County of Hunan province, southern subtropical China. The watershed covers an area of 105 km2, and is the upper headwater of the Dongting Lake basin. It has a subtropical monsoonal climate, with mean annual temperature and precipitation of 17.2°C and 1,422 mm, respectively. The topography of the area is undulating hilly mountain terrain, with an altitude ranging between 56 and 440 m above the sea level. The major soil type is red soil (Haplic Acrisol) as defined in the Genetic Soil Classification of China (GSCC) (Shi et al., 2004) referenced to the FAO/UNESCO taxonomy (FAO, 1988). Five main types of land use in the study area include forest, agricultural land, tea plantation, residential land and water bodies (Zhou et al., 2020).

FIGURE 1. Distribution of rivers and elevation in Jinjing watershed (A) and distribution of land use types and sampling sites (B) in Jinjing watershed.
Fifty-three ponds were sampled in this study (Figure 1B), and the management of these studied ponds are dominated by grass-fed fishing ponds (n = 35), intensive fishing ponds (n = 7) and no fishing ponds (n = 11). The landscape types around the selected ponds consist of agricultural land, forest land, mixed land, residential land and tea plantation.
2.2 Measurement of CH4 and N2O emission fluxes
The water sampling of the selected ponds was performed once a month from May, 2018 to July, 2020 at a fixed time (around the 20th every month). Water samples from the ponds were collected at 0–10 cm in the surface of the water using a 50-ml syringe. After reaching the sampling point, a syringe was used to slowly suck 50 ml of water sample at 0–10 cm in the surface of the water, to avoid disturbing the water body, and try to ensure that there are no bubbles in the syringe (no oxygen/low oxygen environment). After 20 ml of water sample was discharged, the pressure regulating valve of the high-purity nitrogen cylinder should be adjusted. When the flow is moderate and stable, fill 20 ml of nitrogen into the syringe, shake it for about 100 times, and keep it at room temperature for at least 24 h to balance the water and gas in the syringe. After the water and gas are balanced, the headspace gas of the syringe is injected through 0.45-μm filter head of the syringe into a pre-vacuumized airtight test tube (12 ml), and the gas is collected into the vacuum bottle as much as possible. The CH4 and N2O fluxes were detected using a gas chromatograph (Agilent 7890A), and two replications were conducted in each site.
The CH4 and N2O emission fluxes at the water-air interfaces of ponds were calculated using the following equations (Liss and Slater, 1974):
where Kw is the gas transfer velocity (cm·h−1); cobs is the gas concentration measured in the water (mmol·L−1), ceq is the concentration of the gas in the surface water in equilibrium with the concentration in the atmosphere (mmol·L−1).cobs was calculated as follows (Johnson et al., 1990):
where
where
The gas transfer velocity was normalized to a Schmidt number of 600 (
where
where U10 is wind speed at a 10-m height (m s−1).
2.3 Water quality sampling and measurement
The seven water quality indicators (pH, temperature, TN, TP, DO, NO3−-N and NH4+-N) of the selected ponds were measured by simultaneous sampling with CH4 and N2O emission fluxes from May 2018 to July 2020. The collection of field water samples was carried out according to the water quality-guidance on sampling techniques, issued by Ministry of Ecology and Environment of the People’s Republic of China (HJ494-2009, https://www.mee.gov.cn/ywgz/fgbz/bz/). About 1000 ml of surface water samples were collected with 1 L plastic bottles. The water samples were instantaneous, and the sampling locations were fixed each time. The collected samples were stored in the refrigerator at −20°C, and the concentrations of nitrogen and phosphorus components were measured within 48 h. Additionally, the water quality indicators of dissolved oxygen (DO), pH and water temperature of the water bodies were measured in situ by a Hash portable water quality meter (HI8320, United States ). The concentration of TN in water was determined by the method of alkaline potassium persulfate digestion Ultraviolet Spectrophotometry (GB 11894–89), while the concentration of TP in water was measured by the potassium persulfate oxidation and molybdenum-antimony anti-spectrophotometric method (GB 11893–89). All contents of N and P components were determined with continuous flow analysis instrumentation (AA3, Germany). The water quality indicators in ponds were expressed as their monthly average values in subsequent parts.
2.4 Statistical analysis
One-way analysis of variance was performed to examine the differences in annual CH4 and N2O emissions between different treatments. The differences between the treatments were further examined by Hochberg’s GT2 test. Multiple linear analysis (MLR) was carried out in R. All statistical analysis were performed using SPSS version 19.0 (SPSS Inc., United States ) at the 0.05 significance level. All statistical plots were generated using Origin 2018 (OriginLab Corp. United States ). The spatial distributions of all targets of interest were mapped were mapped in ArcGIS 10.2 software (ESRI Inc., United States ).
3 Results
3.1 Characteristics of the environmental parameters in ponds
The pond environmental parameters and water quality under three management types were summarized in Table 1. The ages of ponds varied from 12 to 92 years, and also differed in depths and surface areas, with the mean depth and areas of 1.31 m and 6,070 m2, respectively. The water chemistry indicators (pH, DO, and T) and the contents of nitrogen and phosphorus components (TN, TP, NH4+-N, and NO3−-N) differed among the ponds under three management types. The water in the ponds under three management types was all slightly alkaline, with a mean pH around 8.0. The annual mean water temperatures during the sampling period showed slight variations in different types of ponds, with the highest mean temperature appeared in the “intensive fishing” ponds and the lowest in the “no fishing” ponds, respectively. Generally, DO concentrations varied from 5.48 to 14.04 mg L−1 with the overall state of DO saturation. The mean concentrations of both TN and TP reached the highest in the “intensive fishing” ponds, while the lowest in the “no fishing” ponds. Similar trends were found for the concentrations of NH4+_N in the ponds under three management types, with the highest in the “intensive fishing” ponds and lowest in the “no fishing” ponds. On the contrary, the mean concentrations of NO3−_N reached the highest in the “no fishing” ponds, while the lowest in the “intensive fishing” ponds.
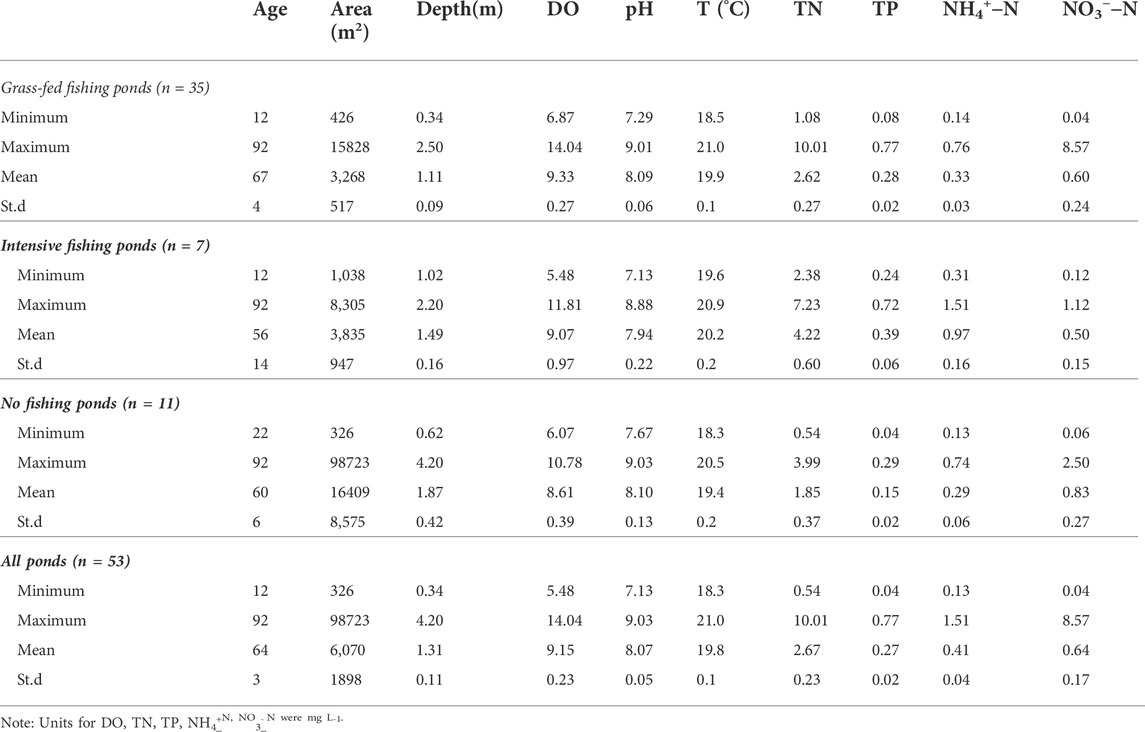
TABLE 1. Descriptive statistics of pond parameters in different management types of ponds.
3.2 Spatial-temporal variation of CH4 and N2O emission fluxes
The CH4 and N2O emission fluxes from ponds in the study area varied from 49 to 659 μg m−2 h−1 (Figure 2A) and −2.5–29.7 μg m−2 h−1 (Figure 2B), respectively, showing significant spatial variability. It is assumed that the spatial distribution patterns of the CH4 and N2O emissions were correlated with the spatial patterns of land use types in the study area (Figure 1B). Agricultural land use in the study area are mainly concentrated in the southwest region, while the northeast region has relatively few inhabitants and the land use is dominated by forests.
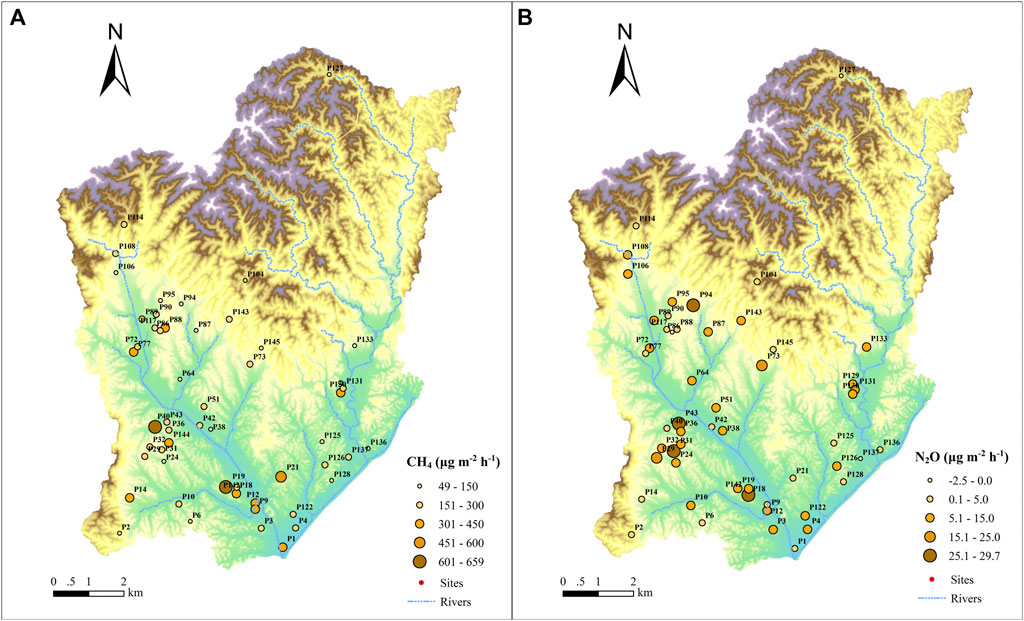
FIGURE 2. Spatial variation of CH4 (A) and N2O (B) fluxes in the studied ponds.
Pond management and land use affected the average annual emissions of CH4 and N2O. High values of average annual emissions of CH4 and N2O occurred in fish-farming ponds with 20.79 kg C ha−1 y−1 and 1.14 kg N ha−1 y−1, respectively, higher than those in non-fish-farming ponds. (Figures 3A,B). Meanwhile, the annual emissions of CH4 and N2O from ponds surrounded by land use types (tea plantation, mixed, residential, and agricultural land) are much higher than those from the ponds surrounded by forest (Figures 3C,D).
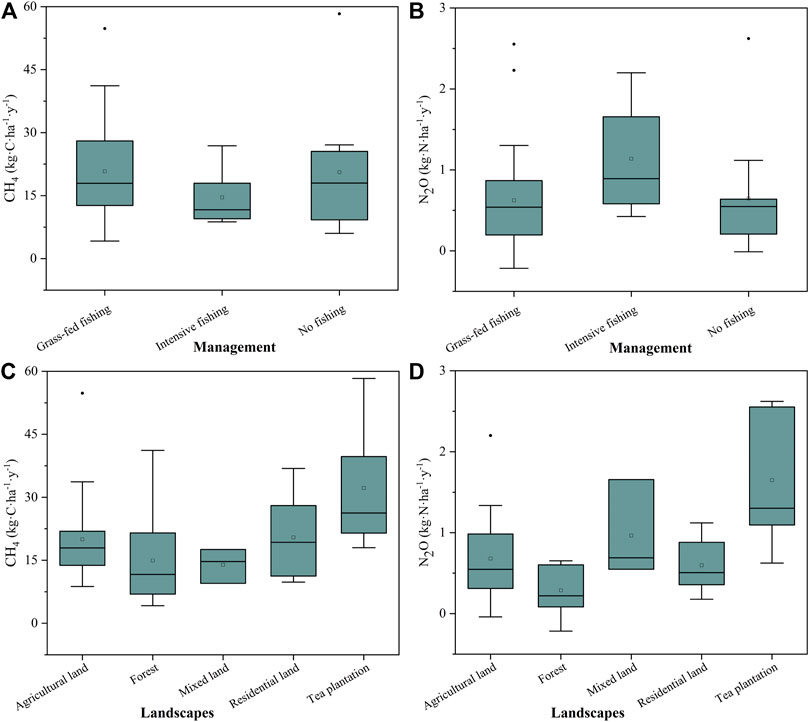
FIGURE 3. Annual CH4 and N2O emissions in different management types (A,B) and landscape types of ponds (C,D).
The CH4 and N2O emission fluxes in the study area fluctuate significantly during the 26 consecutive months of observation, showing a seasonal variation (Figure 4). In general, the observed CH4 and N2O emission fluxes were high in spring, summer and winter, and low in autumn (Figure 4). This may be related to the changes of rainfall and pond water volumes in the study area. Rainfall in the study area is mainly concentrated in spring and summer. Surface runoff formed by rainfall brings a large amount of terrestrial organic material into the ponds, which naturally stimulates pond CH4 and N2O emissions in spring and summer. In winter, the pond water volume reaches a minimum with decreasing of the pond water level due to persistent drought, which may largely reduce the total amount of dissolved greenhouse gases in the water column and increase the emissions of CH4 and N2O.
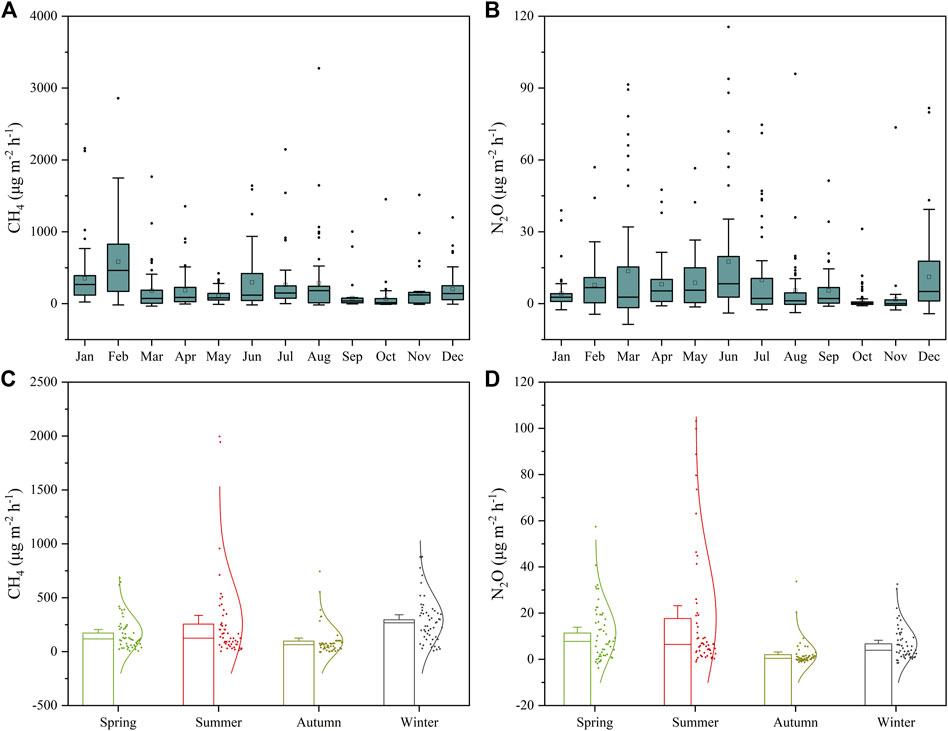
FIGURE 4. Temporal variation of monthly CH4 (A) and N2O (B) fluxes and seasonal CH4 (C) and N2O (D) fluxes in the studied ponds For (A,B), lines within the boxes give the median, boxes represent the 25th and 75th percentile, indicating the lowest and highest values, excluding outliers, and circles represent outliers and extremes; For (C,D), lines within the boxes give the standard error, the mean and the median, representatively. The curves are normal distribution curves of all the sampling sites during different seasons).
3.3 Estimation of reduction potential of CH4 and N2O emission fluxes
As shown in Table 2, cumulative CH4 and N2O emission over the annual cycle both reached the highest in the ponds with tea plantation (32.22 ± 5.23 kg C ha−1 y−1, 1.65 ± 0.30 kg N ha−1 y−1), and they were significantly higher than those in the ponds with forest land, which represented the natural ponds (Table 2). The yearly CH4 and N2O emitted in ponds with agricultural lands was 34% and 143% greater than those in forest ponds, respectively.
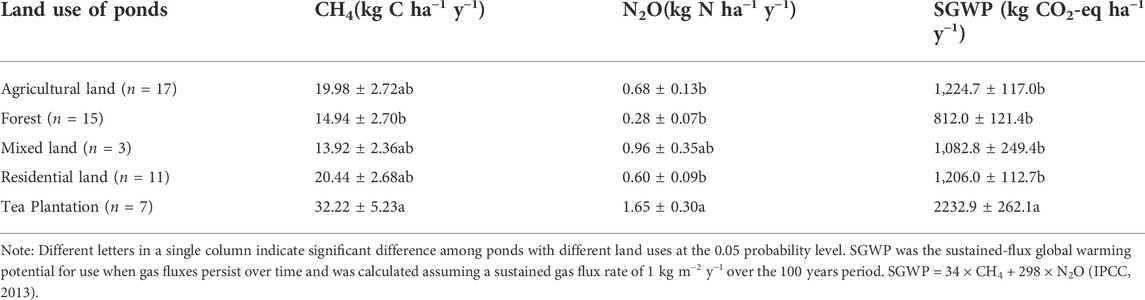
TABLE 2. Annual CH4 and N2O emissions fluxes and Annual SGWP in different landscape types of ponds.
The sustained-flux global warming potential (SGWP) for gas fluxes was calculated on a 100-year timescale, to assess the climatic impact of the ponds (Neubauer and Megonigal, 2015). The SGWP showed significant difference among ponds under different agricultural land uses (Table 2), with the highest values found in tea plantation ponds (2232.9 ± 262.1 kg CO2-eq ha−1 y−1) and the lowest in forest ponds (812.0 ± 121.4 kg CO2-eq ha−1 y−1).
3.4 Effect of environmental factors on CH4 and N2O emission fluxes in ponds
The relationships between GHG fluxes (CH4 and N2O) and environmental parameters were further analyzed using multiple linear regression method and listed in Table 3. In the grass-fed fishing ponds, CH4 fluxes had no significant correlations with any environmental parameters (p < 0.01 or <0.05). On the other hand, N2O fluxes showed significant, positive correlations with DO, TN and NO3−-N (p < 0.01) (Table 3). In the intensive fishing ponds, CH4 fluxes were significantly and positively correlated with TP (p < 0.01), while N2O fluxes were positively correlated with water depth (p < 0.01) (Table 3). As for no fishing ponds, we found that fluxes of both CH4 and N2O were positively correlated with TN and NO3−-N (p < 0.01) (Table 3).
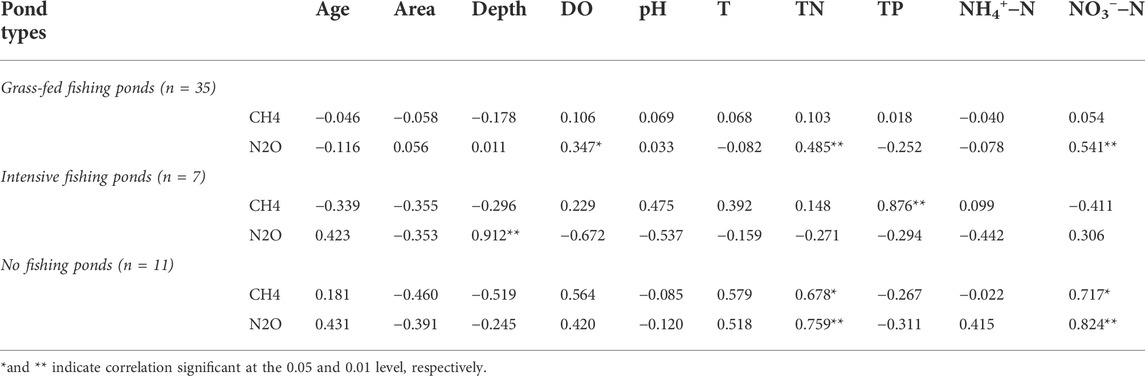
TABLE 3. Pearson’s correlation coefficients between CH4 and N2O emission fluxes and environmental variables in different management types of ponds.
The relative importance of environmental factors to CH4 and N2O emissions was further identified by the MLR method (Figure 5). The Depths and NH4+-N contents in ponds were identified as the most important factors for explaining 20% of the variance in the CH4 emissions (Figure 5A), while the NO3−-N explained the highest (35.4%) variance of N2O emissions (Figure 5B). The rdacca.hp R package was also adopted to calculate the contributions of different environmental factors to the variance of CH4 and N2O emissions. Results showed that the contribution of pond management was relatively the highest (Supplementary Figure S1).

FIGURE 5. Relative importance of the environmental variables for CH4 (A) and N2O (B) calculated by Multiple Linear Regression.
4 Discussion
4.1 CH4 and N2O emission fluxes in ponds
The average water-to-air emissions of CH4 and N2O during the observed periods from the study ponds were within the ranges reported by previous studies (Table 4; Hu, 2015; Chen et al., 2016; Ma et al., 2018; Wu et al., 2018; Fang et al., 2022). The CH4 fluxes from grass-fed fishing ponds were 20.79 ± 1.95 kg C ha−1 y−1, which were substantially lower than recent reports in those fishing ponds in China, urban ponds in Netherland and stormwater ponds in United States (Hu, 2015; Gorsky et al., 2019; van Bergen et al., 2019; Fang et al., 2022), and also quite lower than the crab ponds (Hu, 2015; Ma et al., 2018), but much higher than that reported for shrimp ponds (Chen et al., 2016). Similar trends were found for the CH4 fluxes in the intensive fishing ponds and no fishing ponds. In contrast, the N2O fluxes in the grass-fed fishing ponds and no fishing ponds were 0.62 ± 0.10 kg N ha−1 y−1 and 0.65 ± 0.22 kg N ha−1 y−1, respectively, which were generally much lower than those recorded in reservoirs and rivers located within the same or different climatic zones (Chen et al., 2016; Fang et al., 2022). Furthermore, the N2O fluxes in the intensive fishing ponds were 1.14 ± 0.24 kg N ha−1 y−1, and were much less than crab ponds and mixed mariculture ponds (Ma et al., 2018; Wu et al., 2018). The possible explanations are that the various conditions in sediment substrate availability, water parameters (e.g., DO and mineral N) and water transport efficiency may jointly cause the differences of GHG emission fluxes among different types of ponds (Davidson et al., 2018; Wang et al., 2019; Audet et al., 2020).
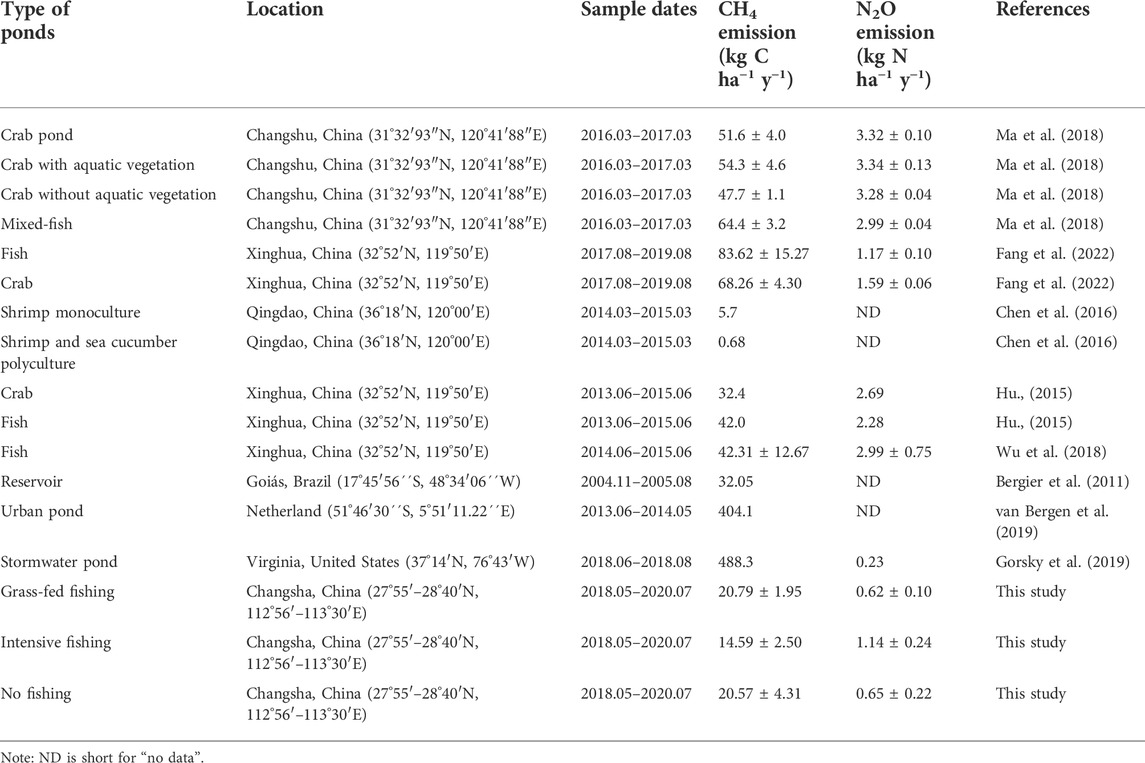
TABLE 4. Comparison of CH4 and N2O emission fluxes from pond and reservoir studies.
4.2 Factors influencing CH4 and N2O emissions
Previous studies have found that large temporal variations in CH4 and N2O fluxes existed in various aquatic ecosystems, such as reservoirs (Musenze et al., 2014), lakes (Xiao et al., 2022) and rivers (Zhao et al., 2013). However, comparable information is rare for small water bodies, particularly ponds (Chen et al., 2016; Zhang et al., 2022). Our results showed considerable temporal variations in the CH4 and N2O emissions from various ponds in the study area (Figures 4A,B). The emission fluxes of CH4 and N2O exhibited an evident seasonal variation among different ponds. Specifically, CH4 and N2O fluxes were higher during summer (June–August) when water temperature tended to be higher than in other period (Yang et al., 2021), and decreased in the later parts of the experimental period after peaking in August. Temperature has an effect on the abiotic and biotic parameters such as plankton primary production, respiration, microbial activity, and nutrient availability, which in turn govern the production and consumption of GHGs (Kosten et al., 2012; Rosentreter et al., 2017; Xiao et al., 2022). The results of the multiple linear regression in this study indicated that water temperature explained 15.6% of the CH4 fluxes (Figure 5A), implying that temperature is an important factor of CH4 emissions. The increase of CH4 emissions may also be caused by the ascending temperature, which stimulates the methanogenesis (Treat et al., 2014). This result is also supported by Natchimuthu et al. (2014), which reported the temperature influenced the diffusive emission rate and transport efficiency of the CH4 flux.
The mean CH4 emission of all the ponds was 19.92 kg C ha−1y−1 in this study, acting as a weaker CH4 source than inland waters. It is likely due to that the sediment condition of ponds may not be the optimum for methanogenesis, since the optimum pH of CH4 production was near neutral (Wang et al., 1993; Kirschke et al., 2013; Zhang et al., 2022). However, the pH ranged from 7.13 to 9.03 in this study. The relatively higher pH values were probably the main limiting factors for CH4 production in the selected ponds.
The major processes of N2O production in ponds and reservoirs could be concluded as the following three processes: aerobic nitrification, anaerobic denitrification and dissimilatory nitrate reduction to ammonium (Schlesinger, 2009; Yuan et al., 2021). N2O production generally occurs under conditions of high NO3−-N concentration and low oxygen (Zhou et al., 2017), which is supported by our results. Our study showed that there was a significant positive correlation between N2O emissions with NO3−-N and TN in grass-fed fishing ponds and no fishing ponds (p < 0.01 for both ponds) (Table 3). Moreover, the multiple linear regression for all the ponds also showed that the environmental variables of NO3−-N and TN explained 35.4% and 29.5%, respectively, for N2O emissions (Figure 5B). These results suggested that the concentrations of NO3−-N and TN played vital role in affecting N2O fluxes. The NO3−-N in water is generally regarded as an important nitrogen source of N2O, the concentration of NO3−-N in water will affect the production of N2O. Nitrification is an aerobic process that oxidizes NH4+-N to NO3−-N and releases N2O as a by-product; whereas denitrification can either produce N2O or transform it into N2 in a final reaction favored under highly reduced anoxic conditions. Thereby, to reduce NO3−-N supply for denitrification will be conducive to reducing the N2O emission in ponds. Algal blooms usually occurred in most ponds and reservoirs during summer. The temporal N2O emission variation showed the highest value observed in summer. It is likely to be related with algal blooms in ponds, which could provide large amounts of organic matter and promote the N2O production. Moreover, algal photosynthesis can release NO3−-N and DO, which would increase the proportion of N2O production in coupled denitrification and nitrification (Yang et al., 2015).
In the present study, water pH may impact temporal variations of N2O fluxes from aquaculture ponds in the coastal zone. In previous studies by Clough et al. (2011) and Yang et al. (2015), pH governed the processes of nitrification and denitrification and thus affected the temporal variations of N2O emission in aquatic environments. Lower pH may inhibit the reductase activity of nitrous oxide and thus contribute to higher N2O production from the sediment (Stow et al., 2005). The N2O flux in this study showed a negative correlation with pH in intensive fishing ponds and no fishing ponds (Table 3), indicating that pH was an environmental factor influencing the temporal variation of N2O fluxes.
Pond management is one of the most important differences between aquaculture systems and other aquatic ecosystems (Glaz et al., 2016; Chanda et al., 2019; Wang et al., 2019). The TN and TP contents in intensive fishing ponds were 4.22 mg L−1 and 0.39 mg L−1, respectively, which was much higher than those in grass-fed fishing ponds and no fishing ponds. Compared to the environmental quality standards for surface water (GB 3838–2002), these ponds showed obvious tendency to eutrophication. Similar patterns were found for the CH4 and N2O emissions, with higher emissions found in intensive fishing ponds, and much lower in grass-fed fishing ponds and no fishing ponds. The ANOVA results also indicated that the CH4 and N2O fluxes in the ponds with tea plantation were significantly higher than those in ponds with the land use of agricultural land, forest and residential land. These results suggested that pond management and agricultural land use in the subtropical hilly region have aggravated the eutrophication of pond water bodies in the study area, and therefore, indirectly increased the emission of CH4 and N2O in the ponds. To strengthen farmland drainage and the treatment of pond sewage in the study area is not only conducive to reducing the eutrophication of ponds in the study area, but also helpful to make the ponds more environmentally friendly with respect to the mitigation of global warming (Beaulieu et al., 2019; Zhang et al., 2021).
4.3 Potential roles of ponds in reducing CH4 and N2O emissions
Compared with the oligotrophic water bodies of forest ponds, the mean annual CH4 and N2O emission fluxes of all ponds in Supplementary Table S1 were adopted to calculate the reduction potential. Our CH4 and N2O emission results suggest that the reduction potential of 4.98 kg C ha−1y−1 for CH4 and 0.42 kg N ha−1y−1 for N2O will occur in future if ecological management measures are implemented to improve the pond water quality from eutrophication to oligotrophic conditions. The SGWP in the eutrophic pond water bodies of farmland, tea plantation and residential area are significantly higher than that in oligotrophic water bodies of forest ponds. On the 100-year horizon, the SGWP values in the ponds were positive, showing a trend of accelerating global warming. Compared with forest ponds, the tea plantation ponds, residential land ponds, and agricultural land ponds have the reduction potential of 1,420.9 kg CO2-eq ha−1 y−1 (175%), 394.0 kg CO2-eq ha−1 y−1 (49%), and 412.8 kg CO2-eq ha−1 y−1 (51%), respectively, to mitigate global warming. The results of this study suggest that small water bodies such as ponds should be more considered when evaluating the potential of the aquatic system in reducing CH4 and N2O emissions and mitigating global warming.
5 Conclusion
The present study discussed the spatial and temporal variability of CH4 and N2O emissions from ponds in a subtropical agricultural headwater watershed. Pond management and agricultural land use exacerbated the eutrophication of pond water bodies in the study area, indirectly increasing CH4 and N2O emissions from ponds. The SGWP in eutrophic pond waters disturbed by humans was significantly higher than that in oligotrophic water bodies of forest ponds that were not disturbed by humans. If pond ecological management measures are implemented in the study area to improve pond water quality from eutrophication to hypotrophication, the reduction potential of CH4 and N2O will amount to 4.98 kg C ha−1 y−1 and 0.42 kg N ha−1 y−1, respectively. Therefore, small water bodies such as ponds should be more considered when evaluating the potential of the aquatic system in reducing CH4 and N2O emissions and mitigating global warming.
Data availability statement
The original contributions presented in the study are included in the article/Supplementary Material, further inquiries can be directed to the corresponding author.
Author contributions
JZ contributed to conception, design and experiments of the study and revised the manuscript. MF performed the statistical analysis and wrote the original draft. WZ contributed to experiments of the study and data analysis. JW revised the manuscript. All authors have read and agreed to the published version of the manuscript.
Funding
This research was supported by the National Natural Science Foundation of China (Grant No: 41877009 and 42101062) and the Natural Science Foundation of Huai’an (Grant No: HABL202105).
Conflict of interest
The authors declare that the research was conducted in the absence of any commercial or financial relationships that could be construed as a potential conflict of interest.
Publisher’s note
All claims expressed in this article are solely those of the authors and do not necessarily represent those of their affiliated organizations, or those of the publisher, the editors and the reviewers. Any product that may be evaluated in this article, or claim that may be made by its manufacturer, is not guaranteed or endorsed by the publisher.
Supplementary material
The Supplementary Material for this article can be found online at: https://www.frontiersin.org/articles/10.3389/fenvs.2022.1029334/full#supplementary-material
References
Abnizova, A., Siemens, J., Langer, M., and Boike, J. (2012). Small ponds with major impact: The relevance of ponds and lakes in permafrost landscapes to carbon dioxide emissions. Glob. Biogeochem. Cycles 26 (2), GB2041. doi:10.1029/2011GB004237
Audet, J., Carstensen, M. V., Hoffmann, C. C., Lavaux, L., Thiemer, K., and Davidson, T. A. (2020). Greenhouse gas emissions from urban ponds in Denmark. Inland Waters 10 (3), 373–385. doi:10.1080/20442041.2020.1730680
Bastviken, D., Cole, J. J., Pace, M. L., and Van de Bogert, M. C. (2008). Fates of methane from different lake habitats: Connecting whole-lake budgets and CH4 emissions. J. Geophys. Res. 113 (G2), 61–74. doi:10.1029/2007JG000608
Beaulieu, J. J., DelSontro, T., and Downing, J. A. (2019). Eutrophication will increase methane emissions from lakes and impoundments during the 21st century. Nat. Commun. 10, 1375. doi:10.1038/s41467-019-09100-5
Bergier, I., Novo, E. M., Ramos, F. M., Mazzi, E. A., and Rasera, M. F. (2011). Carbon dioxide and methane fluxes in the littoral zone of a tropical Savanna Reservoir (Corumba, Brazil). Oecol. Aust. 15 (3), 666–681. doi:10.4257/oeco.2011.1503.17
Chanda, A., Das, S., Bhattacharyya, S., Das, I., Giri, S., Mukhopadhyay, A., et al. (2019). CO2 fluxes from aquaculture ponds of a tropical wetland: Potential of multiple lime treatment in reduction of CO2 emission. Sci. Total Environ. 655, 1321–1333. doi:10.1016/j.scitotenv.2018.11.332
Chen, Y., Dong, S. L., Wang, F., Gao, Q. F., and Tian, X. L. (2016). Carbon dioxide and methane fluxes from feeding and no-feeding mariculture ponds. Environ. Pollut. 212, 489–497. doi:10.1016/j.envpol.2016.02.039
Clough, T. J., Buckthought, L. E., Casciotti, K. L., Kelliher, F. M., and Jones, P. K. (2011). Nitrous oxide dynamics in a braided river system, New Zealand. J. Environ. Qual. 40 (5), 1532–1541. doi:10.2134/jeq2010.0527
Cole, J. J., Bade, D. L., Bastviken, D., Pace, M. L., and Van de Bogert, M. (2010). Multiple approaches to estimating air‐water gas exchange in small lakes. Limnol. Oceanogr. Methods 8 (6), 285–293. doi:10.4319/lom.2010.8.285
Davidson, T. A., Audet, J., Jeppesen, E., Landkildehus, F., Lauridsen, T. L., Søndergaard, M., et al. (2018). Synergy between nutrients and warming enhances methane ebullition from experimental lakes. Nat. Clim. Chang. 8 (2), 156–160. doi:10.1038/s41558-017-0063-z
Fang, X., Zhao, J., Wu, S., Yu, K., Huang, J., Ding, Y., et al. (2022). A two-year measurement of methane and nitrous oxide emissions from freshwater aquaculture ponds: Affected by aquaculture species, stocking and water management. Sci. Total Environ. 813, 151863. doi:10.1016/j.scitotenv.2021.151863
Food and Agriculture Organization of the United Nations (FAO) (1988). FAO/UNESCO soil map of the world. Revised legend. Rome: World Soil Resources Report 60. Available at: https://www.fao.org/soils-portal/soil-survey/soil-maps-and-databases/faounesco-soil-map-of-the-world/en .
Glaz, P., Bartosiewicz, M., Laurion, I., Reichwaldt, E. S., Maranger, R., and Ghadouani, A. (2016). Greenhouse gas emissions from waste stabilisation ponds in Western Australia and Quebec (Canada). Water Res. 101, 64–74. doi:10.1016/j.watres.2016.05.060
Gorsky, A. L., Racanelli, G. A., Belvin, A. C., and Chambers, R. M. (2019). Greenhouse gas flux from stormwater ponds in southeastern Virginia (USA). Anthropocene 28, 100218. doi:10.1016/j.ancene.2019.100218
Holgerson, M. A., and Raymond, P. A. (2016). Large contribution to inland water CO2 and CH4 emissions from very small ponds. Nat. Geosci. 9 (3), 222–226. doi:10.1038/ngeo2654
Hu, Z., Lee, J. W., Chandran, K., Kim, S., and Khanal, S. K. (2012). Nitrous oxide (N2O) emission from aquaculture: A review. Environ. Sci. Technol. 46 (12), 6470–6480. doi:10.1021/es300110x
Hu, Z. Q. (2015). “A comparison of methane and nitrous oxide emissions between paddy fields and crab-fish farming wetlands in southeast China,” (China: Nanjing Agriculture University). (Doctoral degree dissertation).
Intergovernmental Panel on Climate Change (IPCC) (2013). The physical science basis, contribution of working group I to the fifth assessment report of the intergovernmental Panel on climate change. Cambridge: Cambridge University Press.
Jacinthe, P. A., Filippelli, G. M., Tedesco, L. P., and Raftis, R. (2012). Carbon storage and greenhouse gases emission from a fluvial reservoir in an agricultural landscape. Catena 94, 53–63. doi:10.1016/j.catena.2011.03.012
Johnson, K. M., Hughes, J. E., Donaghay, P. L., and Sieburth, J. (1990). Bottle-calibration static head space method for the determination of methane dissolved in seawater. Anal. Chem. 62 (21), 2408–2412. doi:10.1021/ac00220a030
Kauffman, J. B., Bernardino, A. F., Ferreira, T. O., Bolton, N. W., Gomes, L. O., and Nobrega, G. N. (2018). Shrimp ponds lead to massive loss of soil carbon and greenhouse gas emissions in northeastern Brazilian mangroves. Ecol. Evol. 8 (11), 5530–5540. doi:10.1002/ece3.4079
Kirschke, S., Bousquet, P., Ciais, P., Saunois, M., Canadell, J. G., Dlugokencky, E. J., et al. (2013). Three decades of global methane sources and sinks. Nat. Geosci. 6 (10), 813–823. doi:10.1038/ngeo1955
Kosten, S., Huszar, V. L. M., B´ecares, E., Costa, L. S., van Donk, E., Hansson, L.-A., et al. (2012). Warmer climates boost cyanobacterial dominance in shallow lakes. Glob. Change Biol. 18, 118–126. doi:10.1111/j.1365-2486.2011.02488.x
Laurion, I., Vincent, W. F., MacIntyre, S., Retamal, L., Dupont, C., Francus, P., et al. (2010). Variability in greenhouse gas emissions from permafrost thaw ponds. Limnol. Oceanogr. 55 (1), 115–133. doi:10.4319/lo.2010.55.1.0115
Liss, P. S., and Merlivat, L. (1986). “Air-sea gas exchange rates: Introduction and synthesis,” in The role of air-sea exchange in geochemical cycling (Dordrecht: Springer), 113–127. doi:10.1007/978-94-009-4738-2_5
Liss, P. S., and Slater, P. G. (1974). Flux of gases across the air-sea interface. Nature 247, 181–184. doi:10.1038/247181a0
Liu, S. W., Hu, Z. Q., Wu, S., Li, S. Q., Li, Z. F., and Zou, J. W. (2016). Methane and nitrous oxide emissions reduced following conversion of rice paddies to inland crab-fish aquaculture in southeast China. Environ. Sci. Technol. 50, 633–642. doi:10.1021/acs.est.5b04343
Ma, Y., Sun, L., Liu, C., Yang, X., Zhou, W., Yang, B., et al. (2018). A comparison of methane and nitrous oxide emissions from inland mixed-fish and crab aquaculture ponds. Sci. Total Environ. 637, 517–523. doi:10.1016/j.scitotenv.2018.05.040
Moore, T. L., and Hunt, W. F. (2012). Ecosystem service provision by stormwater wetlands and ponds–a means for evaluation? Water Res. 46 (20), 6811–6823. doi:10.1016/j.watres.2011.11.026
Musenze, R. S., Grinham, A., Werner, U., Gale, D., Sturm, K., Udy, J., et al. (2014). Assessing the spatial and temporal variability of diffusive methane and nitrous oxide emissions from subtropical freshwater reservoirs. Environ. Sci. Technol. 48, 14499–14507. doi:10.1021/es505324h
Natchimuthu, S., Selvam, B. P., and Bastviken, D. (2014). Influence of weather variables on methane and carbon dioxide flux from a shallow pond. Biogeochemistry 100, 403–413. doi:10.1007/s10533-014-9976-z
Neubauer, S. C., and Megonigal, J. P. (2015). Moving beyond global warming potentials to quantify the climatic role of ecosystems. Ecosystems 18, 1000–1013. doi:10.1007/s10021-015-9879-4
Ollivier, Q. R., Maher, D. T., Pitfield, C., and Macreadie, P. I. (2019). Punching above their weight: Large release of greenhouse gases from small agricultural dams. Glob. Change. Biol. 25 (2), 721–732. doi:10.1111/gcb.14477
Paudel, S. R., Choi, O., Khanal, S. R., Chandran, K., Kim, S., and Lee, J. W. (2015). Effects of temperature on nitrous oxide (N2O) emission from intensive aquaculture system. Sci. Total Environ. 518, 16–23. doi:10.1016/j.scitotenv.2015.02.076
Prairie, Y. T., Alm, J., Beaulieu, J., Barros, N., Battin, T., Cole, J., et al. (2018). Greenhouse gas emissions from freshwater reservoirs: What does the atmosphere see? Ecosystems 21 (5), 1058–1071. doi:10.1007/s10021-017-0198-9
Rosentreter, J. A., Maher, D. T., Ho, D. T., Call, M., Barr, J. G., and Eyre, B. D. (2017). Spatial and temporal variability of CO2 and CH4 gas transfer velocities and quantification of the CH4 microbubble flux in mangrove dominated estuaries. Limnol. Oceanogr. 62 (2), 561–578. doi:10.1002/lno.10444
Sander, R. (2015). Compilation of Henry’s law constants (version 4.0) for water as solvent. Atmos. Chem. Phys. 15, 4399–4981. doi:10.5194/acp-15-4399-2015
Schlesinger, W. H. (2009). On the fate of anthropogenic nitrogen. Proc. Natl. Acad. Sci. U. S. A. 106 (1), 203–208. doi:10.1073/pnas.0810193105
Shi, X. Z., Yu, D. S., Warner, E. D., Pan, X. Z., Petersen, G. W., Gong, Z. G., et al. (2004). Greenhouse gas emissions from reservoirs of the Western United States. Glob. Biogeochem. Cycles 18 (3), GB3022. doi:10.1029/2003GB002197
Soumis, N., Duchemin, É., Canuel, R., and Lucotte, M. (2004). Greenhouse gas emissions from reservoirs of the Western United States. Glob. Biogeochem. Cycles 18 (3), GB3022. doi:10.1029/2003GB002197
Stow, C. A., Walker, J. T., Cardoch, L., Spence, P., and Geron, C. (2005). N2O emissions from streams in the Neuse River watershed, North Carolina. Environ. Sci. Technol. 39 (18), 6999–7004. doi:10.1021/es0500355
Treat, C. C., Wollheim, W. M., Varner, R. K., Grandy, A. S., Talbot, J., and Frolking, S. (2014). Temperature and peat type control CO2 and CH4 production in Alaskan permafrost peats. Glob. Change Biol. 20, 2674–2686. doi:10.1111/gcb.12572
van Bergen, T. J., Barros, N., Mendonça, R., Aben, R. C., Althuizen, I. H., Huszar, V., et al. (2019). Seasonal and diel variation in greenhouse gas emissions from an urban pond and its major drivers. Limnol. Oceanogr. 64 (5), 2129–2139. doi:10.1002/lno.11173
Verpoorter, C., Kutser, T., Seekell, D. A., and Tranvik, L. J. (2014). A global inventory of lakes based on high‐resolution satellite imagery. Geophys. Res. Lett. 41 (18), 6396–6402. doi:10.1002/2014GL060641
Wang, A., Ma, X., Xu, J., and Lu, W. (2019). Methane and nitrous oxide emissions in rice-crab culture systems of northeast China. Aquac. Fish. 4 (4), 134–141. doi:10.1016/j.aaf.2018.12.006
Wang, Z. P., Delaune, R. D., Patrick, W. H., and Masscheleyn, P. H. (1993). Soil redox and pH effects on methane production in a flooded rice soil. Soil Sci. Soc. Am. J. 57 (2), 382–385. doi:10.2136/sssaj1993.03615995005700020016x
Weisenburg, D. A., and Guinasso, N. L. (1979). Equilibrium solubilities of methane, carbon monoxide and hydrogen in water and seawater. J. Chem. Eng. Data 24, 356–360. doi:10.1021/je60083a006
Williams, J., and Crutzen, P. J. (2010). Nitrous oxide from aquaculture. Nat. Geosci. 3, 143. doi:10.1038/ngeo804
World Meteorlogical Organization (2016). WMO greenhouse gas bulletin No.12. Geneva, Switzerland: World Meteorlogical Organization. Available at: http://library.wmo.int/opac/doc_num.php?explnum_id=3084.pdf.
Wu, S., Hu, Z., Hu, T., Chen, J., Yu, K., Zou, J., et al. (2018). Annual methane and nitrous oxide emissions from rice paddies and inland fish aquaculture wetlands in southeast China. Atmos. Environ. X. 175, 135–144. doi:10.1016/j.atmosenv.2017.12.008
Xiao, Q. T., Duan, H. T., Qin, B. Q., Hu, Z. H., Zhang, M., Qi, T. C., et al. (2022). Eutrophication and temperature drive large variability in carbon dioxide from China’s Lake Taihu. Limnol. Oceanogr. 67 (2), 379–391. doi:10.1002/lno.11998
Yang, P., He, Q., Huang, J., and Tong, C. (2015). Fluxes of greenhouse gases at two different aquaculture ponds in the coastal zone of southeastern China. Atmos. Environ. X. 115, 269–277. doi:10.1016/j.atmosenv.2015.05.067
Yang, P., Huang, J. F., Yang, H., Pe˜nuelas, J., Tang, K. W., Lai, D. Y., et al. (2021). Diffusive CH4 fluxes from aquaculture ponds using floating chambers and thin boundary layer equations. Atmos. Environ. X. 253, 118384. doi:10.1016/j.atmosenv.2021.118384
Yuan, J. J., Liu, D. Y., Xiang, J., He, T. H., Kang, H., and Ding, W. X. (2021). Methane and nitrous oxide have separated production zones and distinct emission pathways in freshwater aquaculture ponds. Water Res. 190, 116739. doi:10.1016/j.watres.2020.116739
Zhang, D., He, J., Xu, W., Li, S., Liu, H., and Chai, X. (2022). Carbon dioxide and methane fluxes from mariculture ponds: The potential of sediment improvers to reduce carbon emissions. Sci. Total Environ. 829, 154610. doi:10.1016/j.scitotenv.2022.154610
Zhang, L., Liao, Q., Gao, R., Luo, R., Liu, C., Zhong, J., et al. (2021). Spatial variations in diffusive methane fluxes and the role of eutrophication in a subtropical shallow lake. Sci. Total Environ. 759, 143495. doi:10.1016/j.scitotenv.2020.143495
Zhao, Y., Wu, B. F., and Zeng, Y. (2013). Spatial and temporal patterns of greenhouse gas emissions from Three Gorges Reservoir of China. Biogeosciences 10 (2), 1219–1230. doi:10.5194/bg-10-1219-2013
Zhou, J., Wang, Y., and Lei, Q. (2020). Using bioinformatics to quantify the variability and diversity of the microbial community structure in pond ecosystems of a subtropical catchment. Curr. Bioinform. 15 (10), 1178–1186. doi:10.2174/1574893615999200422120819
Zhou, W., Xia, L. L., and Yan, X. Y. (2017). Vertical distribution of denitrification end-products in paddy soils. Sci. Total Environ. 576, 462–471. doi:10.1016/j.scitotenv.2016.10.135
Keywords: CH4 and N2O emission, eutrophication, headwater watershed, land use, pond management, small water bodies
Citation: Fan M, Zhang W, Wu J and Zhou J (2022) Agricultural land use and pond management influence spatial-temporal variation of CH4 and N2O emission fluxes in ponds in a subtropical agricultural headstream watershed. Front. Environ. Sci. 10:1029334. doi: 10.3389/fenvs.2022.1029334
Received: 27 August 2022; Accepted: 13 October 2022;
Published: 25 October 2022.
Edited by:
Xiaobo Qin, Chinese Academy of Agricultural Sciences (CAAS), ChinaReviewed by:
Xueqiang Lu, Nankai University, ChinaLinlin Tian, Zhejiang Agriculture and Forestry University, China
Copyright © 2022 Fan, Zhang, Wu and Zhou. This is an open-access article distributed under the terms of the Creative Commons Attribution License (CC BY). The use, distribution or reproduction in other forums is permitted, provided the original author(s) and the copyright owner(s) are credited and that the original publication in this journal is cited, in accordance with accepted academic practice. No use, distribution or reproduction is permitted which does not comply with these terms.
*Correspondence: Jiaogen Zhou, emhvdWpnQGh5dGMuZWR1LmNu