 Xiang Xu
 Waishan Qiu
 Wenjing Li3
- 1School of Architecture, South China University of Technology, Guangzhou, China
- 2Department of City and Regional Planning, Cornell University, Ithaca, NY, United States
- 3Center for Spatial Information Science, The University of Tokyo, Kashiwa-shi, Japan
- 4Guangzhou Urban Planning Association, Guangzhou, China
- 5Guangzhou Urban Planning & Design Survey Research Institute, Guangzhou, China
- 6Guangdong Enterprise Key Laboratory for Urban Sensing, Monitoring and Early Warning, Guangzhou, China
- 7The Bartlett School of Architecture, University College London, London, United Kingdom
Cities are frontlines to tackle climate change challenges including the urban heat island (UHI) effect. The classification and mapping of local climate zones (LCZs) can effectively and consistently describe the urban surface structure across urban regions. This study pays attention to two mainstream methods in classifying LCZs, namely, by using geographic information system (GIS) data such as building footprints or remote sensing (RS) satellite images. Little has been done to compare the divergence and coherence of the abovementioned two methods in modeling UHI. Thus, by comparing pairwise LCZ classes of different urban form characteristics in Guangzhou, this study investigated how GIS- and RS-based approaches complement or conflict with each other in explaining the variance of UHI measured by land surface temperature (LST). First, while both GIS-based (R2 0.724) and RS-based (R2 0.729) approaches can effectively explain heat risks measured by LST, the RS-based method slightly outperforms the GIS counterpart. Second, the sizes of LCZs classified by two methods in urban core districts tend to converge but diverge in urban outskirts with disparities in low-rise urban forms. Both approaches found that LCZs with higher heights are all cooler among compact forms. LCZ E is always related to the highest average LST, and LCZ 7, 8, and 10 contribute significantly to heat islands from both GIS and RS results. This study has developed a comparable framework that is evident based for city planners, architects, and urban policy makers to evaluate which approaches can more accurately reveal relations between UHI and urban geometry with land cover.
1 Introduction
1.1 Urban heat island and local climate zone classification
While our planet is threatened by the crisis of climate change, cities are particularly at high risk from excess heat which poses socio-economic impacts (Ebi et al., 2021; Jay et al., 2021) and endangered health (Oke 1982; UNEP 2021). For instance, heat waves are one of the climate disasters that caused the largest death toll in Europe this century (UNEP 2020). Within this context, the Urban Heat Island (UHI) effect, which describes the difference of Land Surface Temperature (LST) observed between urban and rural areas (Oke 1982; Jay et al., 2021), has been discussed by a series of pieces of literature (Oke 1982; X. Liu et al., 2022; Stewart and Oke 2012) to make urban planning and design environmentally sustainable and climate resilient. Prior studies have found areas featured by complex urban forms tend to have higher temperatures compared to the natural environment due to heat retention by urban geometry, anthropogenic heat generated by cars, and the low albedo and high solar absorption of materials used for constructions (Li and Wang 2021).
The current practices of UHI analysis have primarily relied on RS and GIS data to examine how the UHI and urban geometry with land cover properties (Ebi et al., 2021; Jay et al., 2021; Oke 1982; X. Liu et al., 2022) are correlated. To address the dichotomy for defining UHI, the local climate zone (LCZ) was proposed for characterizing the landscape and physical structure (Stewart and Oke 2012). A group of studies used satellite images and LCZ frameworks to represent the comprehensive built environment features of various types of urban developments and established the relationship between physical factors and UHI (Han et al., 2022; Khamchiangta and Dhakal 2019; Yang J et al., 2021; Y. Zhou et al., 2021). Prior studies have utilized GIS data with the accurate delineation between urban and rural areas to estimate the relationship between LST and other influencing factors (Yang J et al., 2021; Y. Zheng et al., 2018). Increasingly studies have shown the great potential to enhance GIS-based means by integrating innovative methods to address insufficient local knowledge using fuzzification and cellular automata to classify LCZs (Estacio et al., 2019). GIS data may have better coverage and resolution in the core urban area compared to RS data which resulted in more precise LCZ classification (Hidalgo et al., 2019).
LCZ classification can be divided into three categories including sampling with survey manually, RS, and GIS (Y. Zheng et al., 2018). This study focused on the latter two since they are more widely applied. The RS method can rapidly classify LCZs based on supervised pixel-based measures to sort out freely available data from satellite images (Bechtel et al., 2019). The GIS method is relatively more data driven and relies on comprehensive land use and building footprint data (Deilami, Kamruzzaman, and Liu 2018).
The built environment characteristics including sky view factor, building height–width ratio (H/W ratio), pervious surface ratio, and vegetation coverage are often used to construct the LCZ as one of the exogenous variables to explain/predict the UHI effect regarding the urban–rural LST differences. Specifically, RS data of the Landsat (USGS 2022) are useful to classify surface area with higher temperatures to reflect the UHI effect as the dependent variable (Oke 1982; N. H. Wong et al., 2021). GIS data which provide comprehensive and geo-referenced information to categorize urban surfaces with various land use functions can lay the foundation for simulating heat risks and outdoor thermal comfort affected by the built environment (Y. Zhou et al., 2021; Oliveira, Lopes, and Niza 2020; Y. Zheng et al., 2018).
1.2 Quantitative studies for urban heat island, urban geometry, and other factors
Among many urban factors, UHI and LST variation can be impacted mainly by the joined effects of urban form (X. Liu et al., 2022), land use and cover (Chen H et al., 2022), air pollutants and anthropogenic heat (Raj et al., 2020). Previous studies have shed light on measures for UHI mitigation, including the increase in vegetation fraction, floor area ratio (Yang J et al., 2021), sky view factor (Ge et al., 2022), water area proportion (Xue et al., 2019) and the decrease of percent for impervious surface area and built-up height (L. Zhou et al., 2022). These influential determinants have been quantitatively examined by a number of studies applying statistical models, among which ordinary least-squares (OLS) regression and Pearson correlation analysis were one of the most frequently applied methods (Deilami, Kamruzzaman, and Liu 2018).
In addition to urban geometry, UHI can be associated with human activities. Previous studies have revealed the linkages between LST and PM2.5 (Song et al., 2018; Ngarambe and Jeong Joen. 2021) globally as well as locally in Guangzhou, China (Lin et al., 2015; Z. Zheng et al., 2016). Gross Domestic Product (GDP) and population density have been widely used as indicators representing the intensity of human activities and urbanization which have been reported to be relevant to generating anthropogenic heat and the strength to change urban surfaces (Peng et al., 2018; M. Wong, Shaker, and Lee 2010).
1.3 Research gap
While estimating UHI through satellite RS images or land use GIS data has been proved to be effective for generating an overview of urban climate conditions, the discussion for accuracy and implications between these two approaches remain limited since these approaches require intensive GIS data acquisition across a comprehensive set of planning sectors and city authorities, which could become difficult for many studies (Y. Zheng et al., 2018).
First, little has been done to comprehensively measure the difference in results generated between GIS and RS-based approaches through open data sources in the unique context of urban landscapes in China, especially for the aim to identify which measures can enhance the LCZ classification to better model UHI by assessing LST. Second, although some studies (Tamás Gál, Bechtel, et al., 2019; Hidalgo et al., 2019) have compared the two methods to classify LCZ, few have linked these comparisons with estimations for UHI. Previous studies tend to compare the result of two measures by qualitatively analyzing the delineation of LCZs within selected areas of cities. This is because up-to-date and accessible land-use-related GIS data may not exist in every city. Studies that can quantify the difference between results and measure the effectiveness to explain the links between UHI and LCZs remained constrained. Assessing both approaches with open data sources is desirable to evaluate the advantages and disadvantages of the two means in terms of illustrating LCZs and analyzing UHI. Third, while megacities are studied in pieces of literature (Yang Z et al., 2021; M. Cai et al., 2016), the comparison to evaluate LCZ classification results based on urban core and outskirt in megacities remains insufficient.
2 Research questions and contribution
2.1 Research questions
As indicated by prior studies, this study hypothesizes that the GIS and RS data are both important sources to assess the impacts of the urban environment on the UHI, which in turn will improve the UHI modeling accuracy. By analyzing both GIS and RS data, this study asks: how do pixel-based and object-based information complement or conflict with other approaches in revealing the association between UHI and urban physical factors? What are the differences between LCZs classified by pixel-based data and LCZs classified by object-based data at the city level? Which approach is more effective to estimate the relationship between UHI and urban geometric and land cover properties quantitively? To answer this question, we set to 1) generate more subtle and quantitative comparisons between urban geometric properties and RS- and GIS-based LCZ categorical attributes; 2) Compare the results from the two models to better LST estimation using LCZs. These questions are valuable in the unique context of the urban landscape in China where urbanization has shifted towards high-quality growth calling for better environmental management (S. Wang, Liu, and Qin 2022).
2.2 Outcome and contribution
We analyzed surface cover properties by integrating RS and GIS datasets that can be freely accessible for cities around the globe and by approaches that are streamlined and feasible. This research helped clarify the relationship between RS and GIS with excessive urban heat and their attributions to UHI. Applying supervised classification on RS imageries to generate urban form factors that can subtly reflect the characteristics of built environments (Khamchiangta and Dhakal 2019) with fine resolution. More specifically, we set to contribute to the following three areas.
First, with a scalable framework using open-source GIS and RS, we enriched the literature by comparing measures to classify LCZs. The comparison is based on frameworks that could be efficient and accurate in measuring urban geometry and surface cover properties for classifying urban form features. Second, we filled the gap by analyzing the associate between UHI estimations based on RS and GIS data with a city-level dataset from a megacity endowed by a variety of landscapes and urban forms. The classification results from urban cores and peripheral areas could vary significantly and will shed light on adjustments for approaches tailored to capture these differences. Third, with an in-depth investigation into the relationship between urban form elements by RS and GIS data with UHI estimations, this study provides a comparable framework that is evident based for city planners, architects, and urban policy makers to evaluate approaches that can more accurately reveal the relations between UHI and urban geometry with land cover.
3 Materials and methods
3.1 Study area
Guangzhou is one of the most urbanized megacities in China, located in a subtropical coastal area (Figure 1), with a total surface area of 7,434 km2 and a population of 18.74 million in 2020 (Guangzhou Statistic Bureau 2021). The samples from Guangzhou can potentially provide important lessons learned for other cities in the Southeast Asia region undergoing rapid urban expansion with similar climate conditions. Following the trend of increasing LST in other cities of Pearl River Delta (Hu et al., 2020), Guangzhou is facing the typical environmental challenges including UHI as a rapidly growing megacity. The city plans to limit land expansion and protect its ecological assets to mitigate UHI while accommodating sustained population growth and maintaining vibrant economic growth. Prior studies (Chen F et al., 2022) have found an increasing tendency of the annual temperature in Guangzhou which calls for building a climate-resilient and healthy city. The vast administrative area of Guangzhou has made this study unique since the select city covers a wide variety of urban forms and land cover features ranging from compact high rises in city centers to mountainous areas in the north and waterfronts in the south. An in-depth analysis of the urban area of Guangzhou would shed light on planning and policy implications to promote sustainable urban growth that is climate responsive.
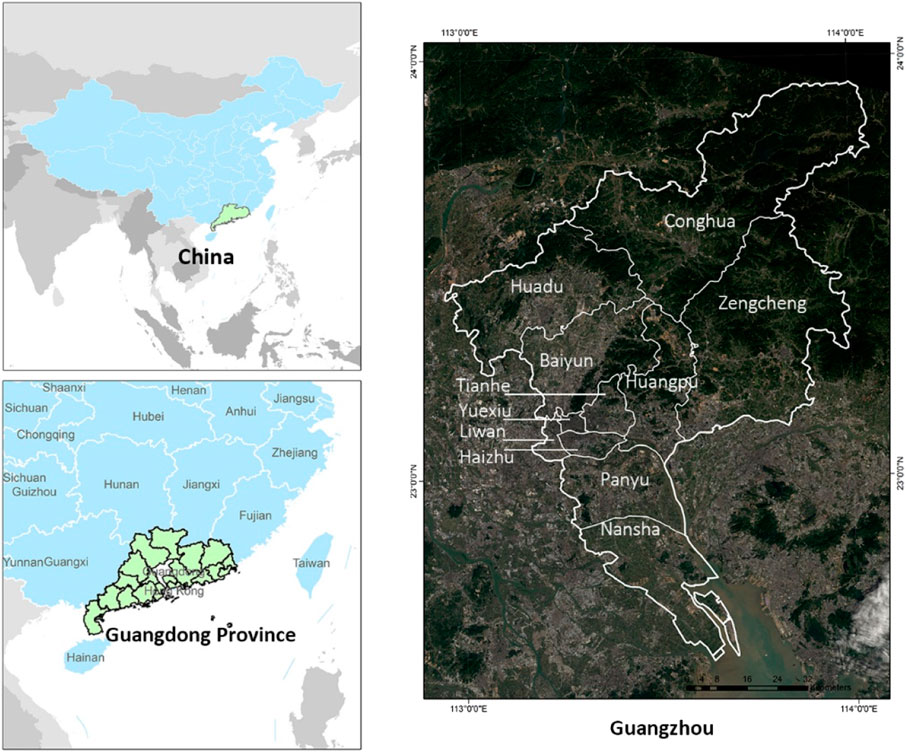
FIGURE 1. Guangzhou location map.
3.2 Model architecture
While UHI can be measured by indicators including air temperature and LST, increasing studies that focus on spatial factors are using LST as a proxy of UHI (Deilami, Kamruzzaman, and Liu 2018) given its high accessibility and wide coverage for cities with large areas. We assumed that for each urban region, its degree of UHI measured by LST is a dependent variable whose determinants can be investigated by regressing the LST variations on three main groups of explanatory variables capturing the region’s socioeconomic status, generic land use, and built environment features in the form of categorical variables by LCZs (Figure 2). Although LCZ classification is associated with urban geometric properties, the generation of LCZs is based on different data sources. For RS-based LCZs, the classification is pixel-based and RS materials are not directly linked to urban geometric characters GIS-based LCZs incorporate land cover properties from land use data. Conducting regression analysis to evaluate the influencing factors processed from different data sources and approaches is consistent with the goal of this study.
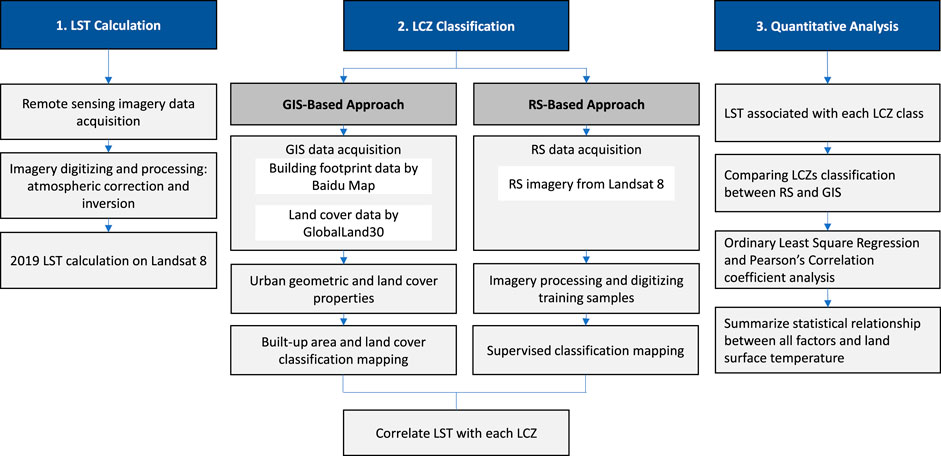
FIGURE 2. Conceptual framework.
The ordinary least squares (OLS) regressions will be utilized to quantify the parameter estimates. Table 1 provides the summary of data sources for each group of variables.
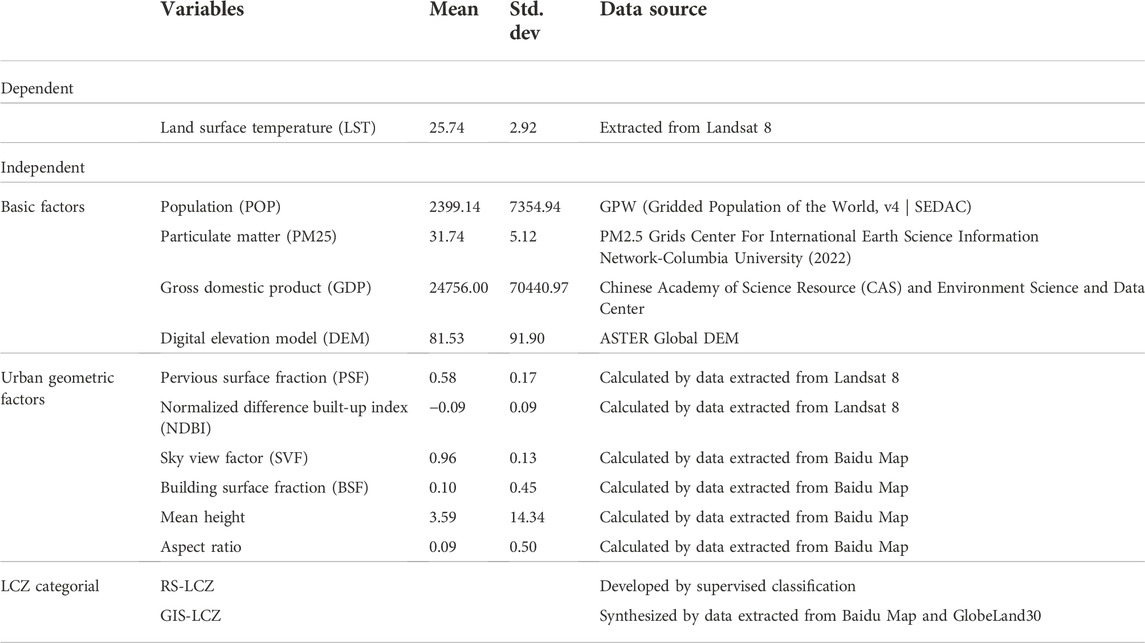
TABLE 1. Descriptive summary of variables and data source.
We developed the following models:
3.3 Variables and data
POP stands for population density data of 2015 and PM25 stands for 2019 particulate matter 2.5 data which were both downloaded from the socioeconomic data and applications center (SEDAC). Gross domestic product (GDP) data for 2015 was downloaded from the RESDC website supported CAS. Digital elevation map (DEM) data were downloaded from the USGS website. Pervious surface fraction (PSF), normalized difference building index (NDBI), sky view factor (SVF), and building surface fraction (BSF) are calculated based on building footprint data which was downloaded by Baidu Map (Baidu, 2022), one of the largest web map service providers in China. Land cover and urban geometry variables that will affect the built environment’s thermal performance will be measured from RS data using supervised classification as well as GIS data to develop aggregated urban form maps.
3.3.1 Extracting land surface temperature
The study uses LST as a dependent variable. LST estimation, using Landsat 8 satellites data (USGS 2022) which featured continuous coverage and high data accessibility over large areas, was conducted to calculate the LST through the following radiative transfer equation (RTE) method (Lu et al., 2004):
With Lλ as the thermal infrared radiation value, B(Ts) as the black body thermal radiance, Lu as the atmospheric upward radiance, Ld as the downward radiance, and τ as the transmissivity calculated by the online calculating platform (“Atmospheric Correction Parameter Calculator” 2022). ε as the surface emissivity was estimated following approaches based on normalized difference vegetation index (NDVI) (Sobrino, Jimenez-Munoz, and Paolini 2004, 200). After preprocessing including radiometric calibration and atmospheric correction, LSTs were calculated and transferred from degree Kelvin to degree Celsius.
The study has identified suitable imageries captured on October 29th and November 14th of 2019, which are dates from the season with the highest intensity of UHI according to the meteorological report in 2019 (Guangzhou Climate and Agricultural Meteorology Center 2019). The Landsat 8 imageries are selected following the requirements of previous pieces of literature (M. Cai et al., 2016; Windahl and de Beurs, 2016) to ensure minimized cloud cover (about 5% or less) based on meteorological conditions. The RTE-based LST retrieval is among the most accurate approaches examined by prior studies in other Chinese megacities (Wan, Zhu, and Ding 2021) and the RTE method is proven to be an effective method for assessing LST (Sekertekin 2019).
3.3.2 Variables of interest
Based on pieces of literature and data availability, the study has identified three sets of independent variables. First, the model has considered several basic factors, including population density (Y. Zhou et al., 2021), GDP (Wang Yanan et al., 2021), elevation generated by DEM (Wu et al., 2022), and PM2.5 (Khamchiangta and Dhakal 2019) that are considered as relevant factors for influencing LST. Second, geometric variables have covered factors for LCZ classification such as average building heights, surface fraction occupied by buildings, skyline, street canyon height-width ratio, and pervious surface. Third, LCZ categorical variables including built-up and land cover types are transformed into dummies and LCZ1 (compact high-rise) is used as a reference category for comparison. Whether and to what extent they will exhibit complementary or divergent effects to the LCZ categorial variables in explaining UHI is the interest of this study.
3.3.3 Local climate zone classifications using remote sensing data
The widely-accepted RS-based LCZ classification (Stewart and Oke 2012) was carried out (Table 2) based on the guidelines of the World Urban Database and Access Portal Tools Project (Ching et al., 2018). The mapping process for LCZ classification can be divided into the following three steps. First, RS information acquisition was extracted by data processing on Landsat 8 RS imagery captured in November of 2019 with 0.23% of cloud cover, through radiometric calibration and inversion mentioned in 3.3.1. Second, the input training samples for classification are selected based on the local knowledge related to compounds and neighborhoods that shared similar features of urban forms. Following the procedure to classify LCZs in Guangzhou (M. Cai et al., 2016), about 50 representative samples categorized in each LCZ were digitized by polygons in Google Earth software and compared with Google Street View images and other photo sources based on local knowledge. Third, a Landsat 8-based supervised classification was conducted to classify LCZs through a maximum likelihood approach (Khamchiangta and Dhakal 2019).
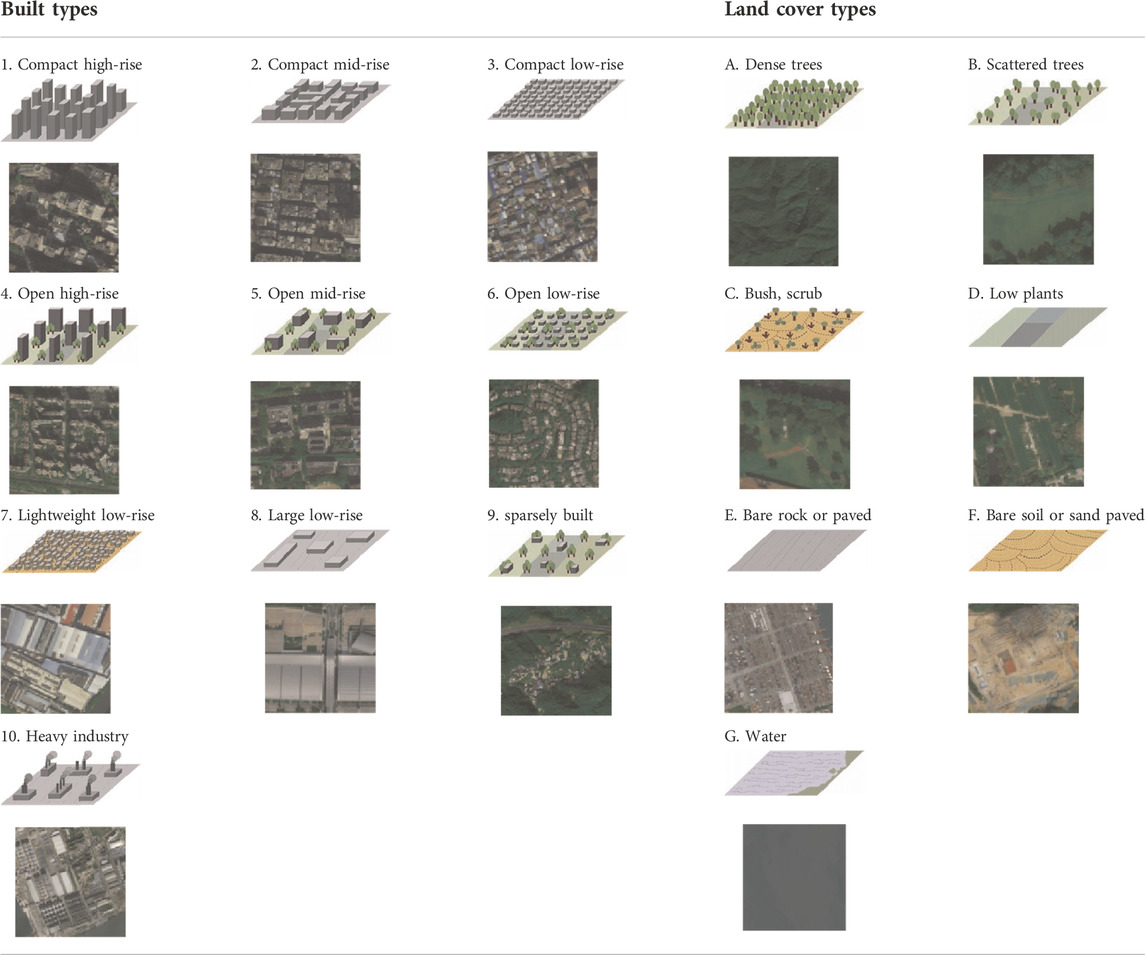
TABLE 2. LCZ classification definitions (Stewart and Oke 2012) with samples from Guangzhou.
3.3.4 Geographic information system-based local climate zone classification approach
The GIS-based approach has demonstrated its capacity to accurately classify LCZs if high-resolution vector data are available (Oliveira, Lopes, and Niza 2020). Here, we explore the integration of the fine-scale GIS-based urban form data extracted from Baidu Map’s building footprint and 30 m land use-cover map to classify LCZs in the Guangzhou metropolitan area. A series of urban form mapping layers has been established by consolidating the morphological data in the GIS. Given significant heterogeneity in urban forms across a relatively vast study area in Guangzhou, a medium spatial resolution can efficiently reflect diverse landscapes while providing an enabling environment for translating detailed spatial information into urban design policies. The resolution of these maps and the following analysis is 100 m which is the standard grid resolution in the literature (Bechtel et al., 2019) while capturing sufficient granularity across a large study area such as Guangzhou. Building footprint features including average building height (BH), and building surface fraction (BSF) are fundamental for classification to distinguish built-up and other land cover typologies. The GIS-based classification was conducted by screen land areas with indicators of urban form and cover properties composed of street layout properties such as view factors (SVF), height width ratio (H/W), and land cover properties such as pervious surface fraction (PSF). The land cover properties were extracted from the Globalland30 data to identify areas covered by water, trees, agricultural lands, and other features. The overall accuracy of GlobeLand30 2020 data is 85.72%, with a Kappa coefficient of 0.82 (National Geomatic Center of China 2019). The land cover map is validated by reexamination with local knowledge and the quality of the land cover map is verified by street view images. Processing data such as DEM and NDVI with grids based on GIS tools has proven to be effective in prior studies climate studies (Valjarević et al., 2020).
3.3.5 Mapping building height
At the grid level of LCZs, building heights can be represented by area-weighted mean building height. The data for building height was extracted and transformed into a high-resolution map with building surface area available to calculate building volume. Then the average building height weighted by area is calculated by the total building volume in an LCZ grid divided by the total surface of building areas. The value of mean building height will be used as the prioritized threshold for classifying the built-up environment covered by LCZs 1–10 in urban areas. LCZs are divided into high (BH > 25 m), middle (BH = 10–25 m), and low rises (BH < 10 m), which are in line with prior criteria (Stewart and Oke 2012).
3.3.6 Mapping building surface fraction
BSF can be calculated by identifying the fraction of land area occupied by buildings at each unit of the LCZ grid. A building cover map was established by summing up the total building cover and then dividing the sum by the surface of the grid area in the LCZ unit. Accompanied with BH, BSF will categorize built-up LCZs into compact (BSF > 0.4), and open (BSF < 0.4) forms.
3.3.7 Mapping sky view factor
SVF has been applied as a common element for describing urban geometry (T. Gál, Lindberg, and Unger 2009). Based on the building footprint, the SVF calculation was conducted based on the literature (Zakšek, Oštir, and Kokalj 2011; Y. Liu et al., 2016) to develop an SVF map that covers the surface area within the administrative boundary of Guangzhou. The detail SVF map by building footprint was aggregated to generate the mean SVF map (100 m resolution) via GIS data management tools.
3.3.8 Mapping aspect ratio/height–width ratio
In an urban street canyon, the aspect ratio was commonly calculated by dividing the height by width, which is proposed by previous studies for defining LCZs (Stewart and Oke 2012). However, calculating aspect ratio remained challenging in Guangzhou, due to its highly diversified street layouts and building forms. Given the similar climate and urban development context, this study adopted the method developed by the Hong Kong area (Y. Zheng et al., 2018).
In each LCZ unit, the mean road width was computed by the total surface of categories of road lengths times road widths according to the code for transport planning on the urban road and then divided by the total length of roads. Then, the average aspect ratio can be obtained by dividing the mean building height weighted by area by the mean road width.
3.3.9 Mapping pervious surface fraction
Pervious surface fraction, which can capture vegetated and water fraction of land surface in an LCZ site, is a useful reference to estimate UHI at the local scale since evapotranspiration by plants is a major way for natural cooling. PSF is computed by summing up the coverage ratio of waterbody and vegetation in an LCZ unit. The coverage ratio of the waterbody was identified using GLOBAL30LAND data of the waterbody, while the vegetation coverage ratio was calculated based on Landsat 8. NDVI was computed based on the data extracted from the Landsat 8, which was used to generate the NDVI map in Guangzhou with NDVI values above 0.2 to be recognized as vegetated surfaces (Weier and Herring 2000) through the following formula (Yuan and Bauer 2007):
where NIR is the near-infrared band and R represents the red band. Another related indicator NDBI could be generated by dividing the difference between shortwave infrared (SWIR) and NIR with the sum of SWIR and NIR.
4 Analysis results
4.1 Results of local climate zone classification and correlation with temperature
Both RS- and GIS-based LCZ 1–6 (Figure 3) can distinguish the compact and open urban forms with building areas from high to low heights, which are observed to be concentrated in the urban core districts. The RS map shows a continuous classification, from LCZ 1 to 6, between the center and peripheries of outskirt districts, while the GIS map classifies a significant amount of LCZ 7.
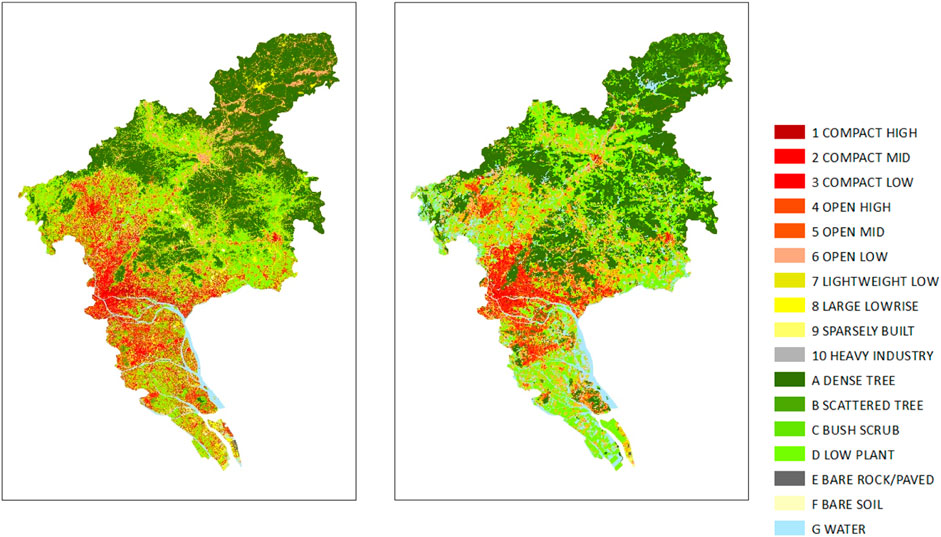
FIGURE 3. RS-based (left) and GIS-based (right) Guangzhou LCZ maps.
In southern districts of Guangzhou such as Nansha, the RS map classifies more built-up types into LCZ 8 for large industrial areas that comprise primarily the manufacturing bases and seaport facilities. Both RS and GIS maps can recognize green spaces convergently in urban cores while GIS is advantageous for identifying low plants in the outskirt districts. The overall RS-based approach classification accuracy is 82.84%, with a kappa coefficient of 0.79.
Both approaches identify LCZ E (paved and bare rock) as the hottest zone with the median value of the average temperature of all LCZ E as high as 29.90°C (RS) and 31.10°C (GIS). Considering the median value of average LST in all units, LCZ 3 (compact low-rise building areas) and LCZ 8 (large low-rise building areas) are both among the most heat-impacted areas. In both methods, the lowest average LST is identified in LCZ A, which covers dense tree areas, and other relatively lower LSTs in LCZ B and C, which are composed of scattered trees and bush areas. The largest temperature difference of about 8.2°C among the 17 LCZs was reported between the paved zones and dense tree areas.
Notably, built-up urban forms, including LCZ 3, LCZ 7, LCZ 8, and LCZ 10, were still among the main LCZ drivers for enhancing UHI. In compact forms (LCZ 1–3), both GIS and RS-based models observe the higher temperature in low-rise buildings while open forms (LCZ 4–6) low-rise buildings tend to be cooler. This finding calls for developing adaptive design strategies for enhancing cooling considering building heights with neighborhood density and comprehensively leveraging the advantage of shading generated by building intensity.
Compared with high-resolution satellite imageries, RS-based result exhibits better coverage in the peripheral area of the city, due to the better data availability than GIS-based result since the static GIS data is limited for timely capturing urban expansion and redevelopment, especially, in a rapidly growing city like Guangzhou while RS data can be routinely updated by satellites’ revisits. A large portion of agricultural lands in Guangzhou is mulberry fishponds which should be considered water areas. The RS-based approach is less advantageous in classifying LCZ G especially fishpond areas which are in general underrepresented compared to the GIS-based approach. This could be caused by the similarity of pixels between fishponds and other built-up LCZs. The RS approach can occasionally capture those subtleties, but that relies on the training samples selected for classification.
4.2 Correlation analysis
Pearson correlation studies have become one of the methods that are most widely applied in UHI-related studies including cases in cities that shared similar climate conditions and locational proximity with Guangzhou based on a literature review (Deilami, Kamruzzaman, and Liu 2018; Z. Cai, Tang, and Zhan 2021; Lau, Chung, and Ren 2019). Pearson correlation analysis results (Table 3) have demonstrated a significant correlation between LST and its influencing factors including BSF, BH, street aspect ratio, SVF, and PSF. Using the correlation coefficient as a reference, the five LST influencing factors’ importance in terms of urban geometry were ranked as follows: NDBI > PSF > SVF > BSF > Building Height > Aspect Ratio. This result is in line with previous correlation studies including the correlation between LST variation and NDBI (Peng et al., 2018), PSF (Yuan and Bauer 2007), SVF, and BSF (Shi, Xiang, and Zhang 2019; Yang J et al., 2021).
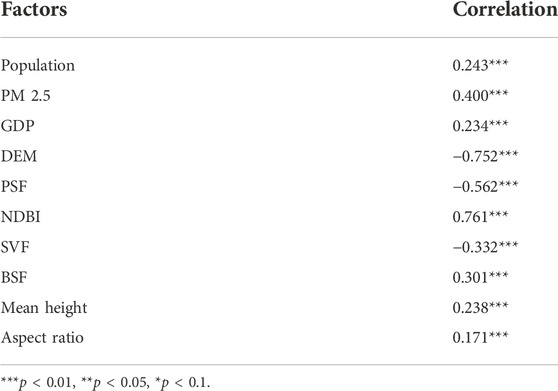
TABLE 3. Correlation analysis of LST and influencing factors.
SVF and PSF are found to be negatively correlated to LST. This negative relationship can be explained by low sky openness and low previous fraction commonly associated with the densely built-up area and poor vegetation coverage which are both known as the main contributor to high LST. Other positive relations reveal that urban geometry properties including building coverage and street canyons are some of the critical indicators to distinguish major heat island areas in Guangzhou. Earlier studies reported that LST variation and elevation are correlated (Wang Yuanyuan et al, 2021) and this could be attributed to topography and biophysical features (Negassa, Mallie, and Gemeda 2020; Moisa, Merga, and Gemeda 2022). Guangzhou is endowed with diverse geographic characteristics including significant areas of hills (Bureau of Forestry and Landscaping of Guangzhou Municipality 2020), which can explain the negative relation of elevation since northern mountainous areas are commonly observed to be cooler as shown in Figure 4. PM 2.5 exhibits significant relation with LST which has been reported in other Chinese cities (Fang and Gu 2022; Yang G et al., 2021, 5) as well as Guangzhou (Z. Zheng et al., 2016). Compared to urban geometric factors, the correlation between population and GDP is relatively moderate as discussed in previous studies (Buyantuyev and Wu 2010; M. Wong, Shaker, and Lee 2010).
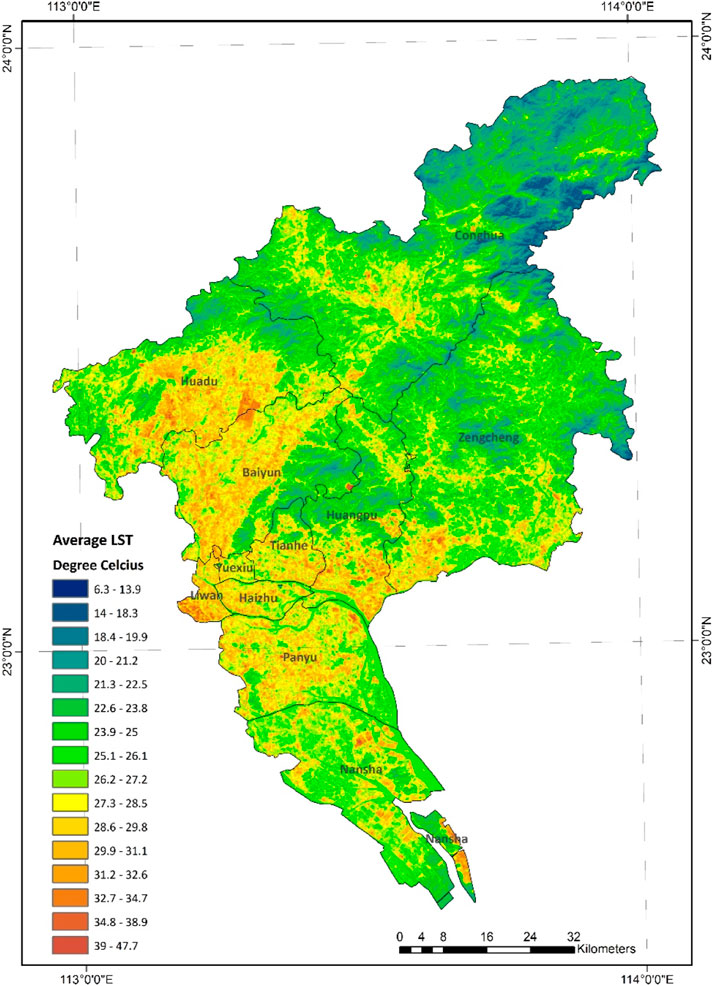
FIGURE 4. The average LST distribution in Guangzhou between selected days in October and November, which represents the autumn season that is most impacted by UHI in 2019.
4.3 Ordinary least square result
We added urban geometric attributes (Model 1) and LCZ categorical attributes based on GIS (Model 2) and RS (Model 3) to the baseline model (Model 0). After processing, models focused on basic and geometric factors (Model 0 and Model 1) with all variables’ VIFs below 10, showing models are not affected by multicollinearity. As Allison suggests (Allison 2012), multicollinearity can be safely ignored when the high VIFs are found in dummy variables that involve 16 categories in our study. The study has verified the VIFs of numeric variables have no significant change after incorporating dummy variables and kept all 16 dummy variables in model 2 and 3 following prior pieces of literature (Murray et al., 2012; Yavorsky, Cohen, and Qian 2016; Jakovljevic et al., 2020).
Table 4 reports the results and diagnostic indicators of the regression process. On one hand, R2 of 0.639 by Model 1 was improved from Model-2 with R2 equal to 0.724 and Model-3 with R2 equal to 0.729, indicating the effectiveness of integrating GIS and RS-based LCZ attributes to improve the LST estimation capability. On the other hand, RS based approach exhibits slightly higher explanatory power compared to GIS methods which can be explained by the relatively continuous and more comprehensive quality provided by raster data considering the large size of the study area. The sheer size of outskirt districts composed of extensive vegetation and low-rise urban forms that are not updated in GIS data makes RS methods advantageous in describing LCZs in peripheral areas.
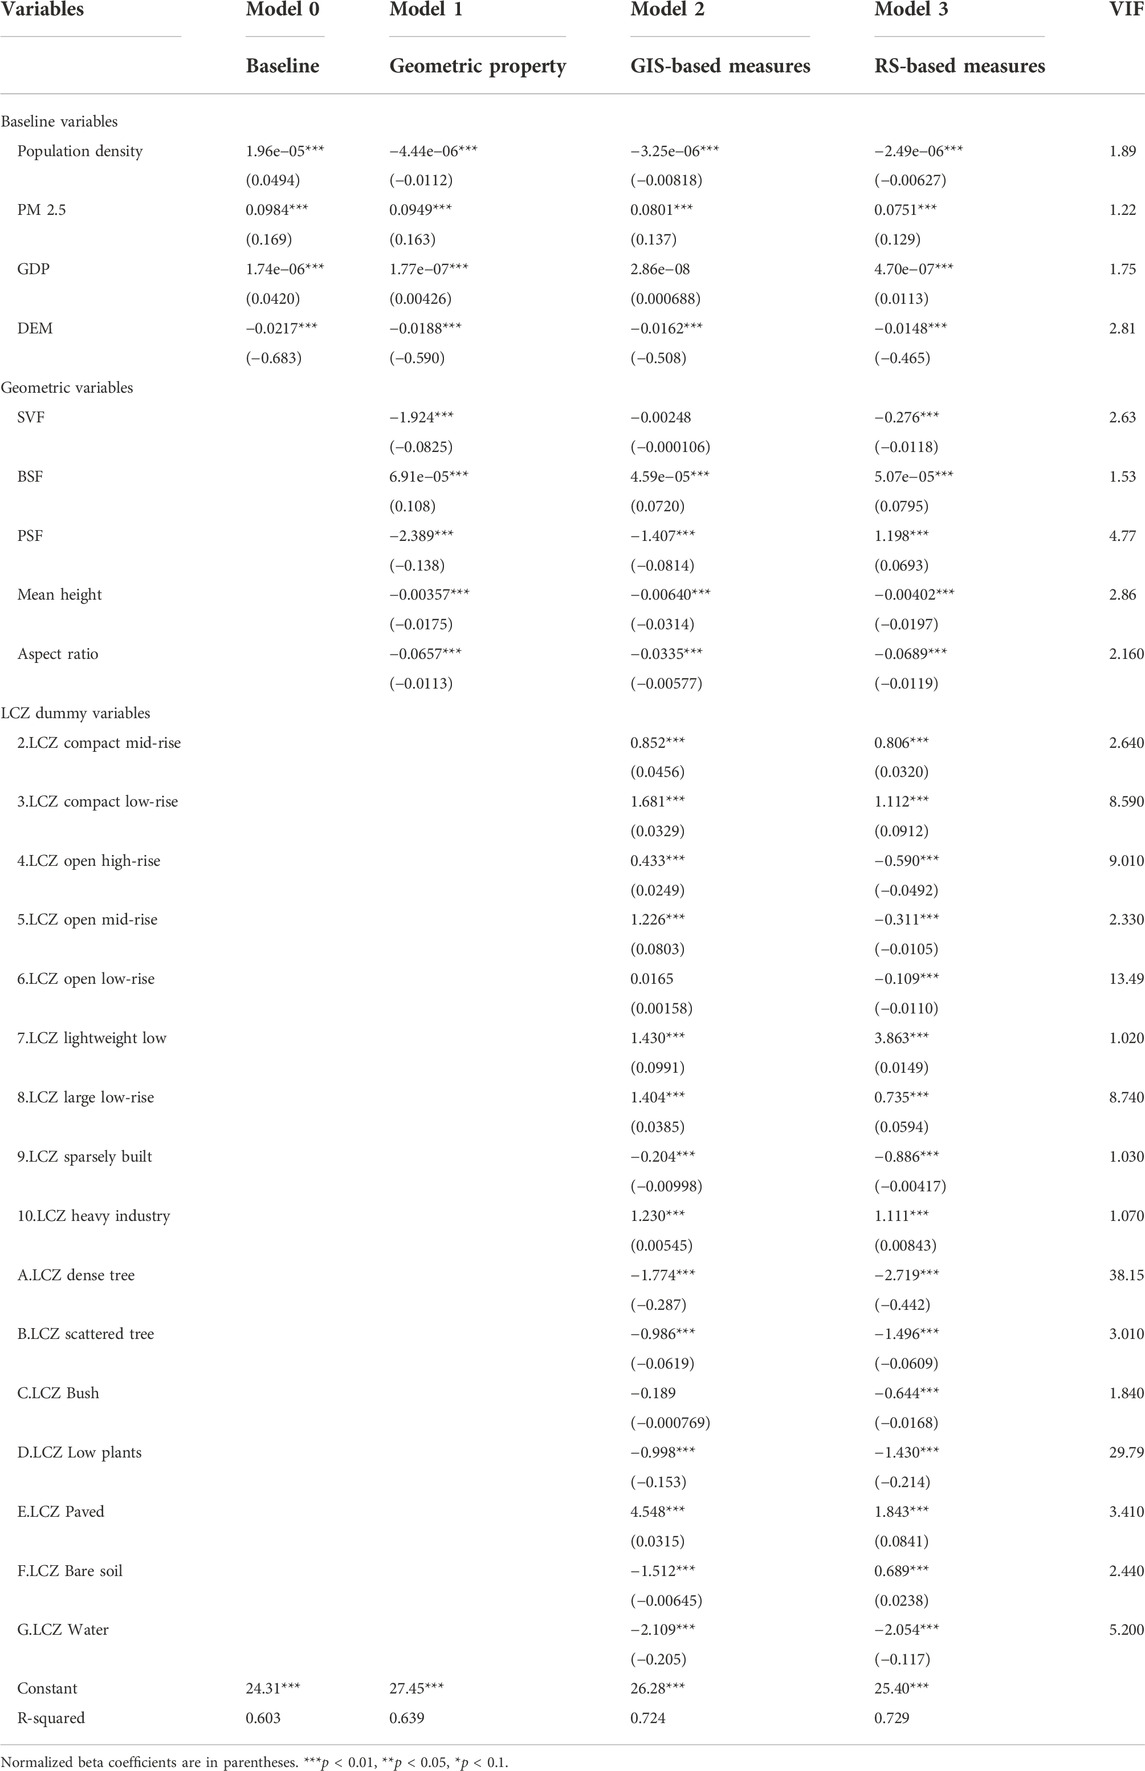
TABLE 4. Regression results and diagnosis.
5 Discussion
5.1 Comparing two approaches for local climate zone classification
Both approaches have advantageous and disadvantageous features for assessing UHI. The RS-based method is easy to use with data freely available around the globe, but the coverage of spatial detail could be unstable due to the limited capacity of the classification process to distinguish the subtle difference between LCZs. The GIS-based method can provide detailed and accurate land use information, which is advantageous for steadily classifying areas into LCZs based on standardized definitions, but it is tremendously data intensive.
In general, considering the sizes of LCZs classified by GIS and RS approaches, the classification results are divergent in outskirt areas and convergent in urban cores. Table 5 indicates that built-up type LCZ areas are estimated to be 5.86% more by the RS approach than GIS. Compared to prior studies (Hidalgo et al., 2019), this difference is moderate and should be attributed to the variety of urban forms composition between core districts and urban outskirts. The main differences appear in outskirt districts with significant suburban areas, including Baiyun, Huangpu, Huadu, and Nansha where there are compact low-rise and large low-rise buildings coexist closely which contributes to the discrepancy in classifying these zones. This is in part due to the mixed-use layout integrating industrial warehouse and residential buildings together in peripheral areas which can sometimes be reflected by GIS-based data with footprint information but difficult to be distinguished by solely RS imageries. The classification results are highly convergent in core districts including Liwan, Yuexiu, Haizhu, and Tianhe. The percentages and spatial distribution of LCZs are similar to the two approaches since most areas in core districts are dominated by compact forms such as residential and commercial buildings with fewer green areas or agricultural lands.
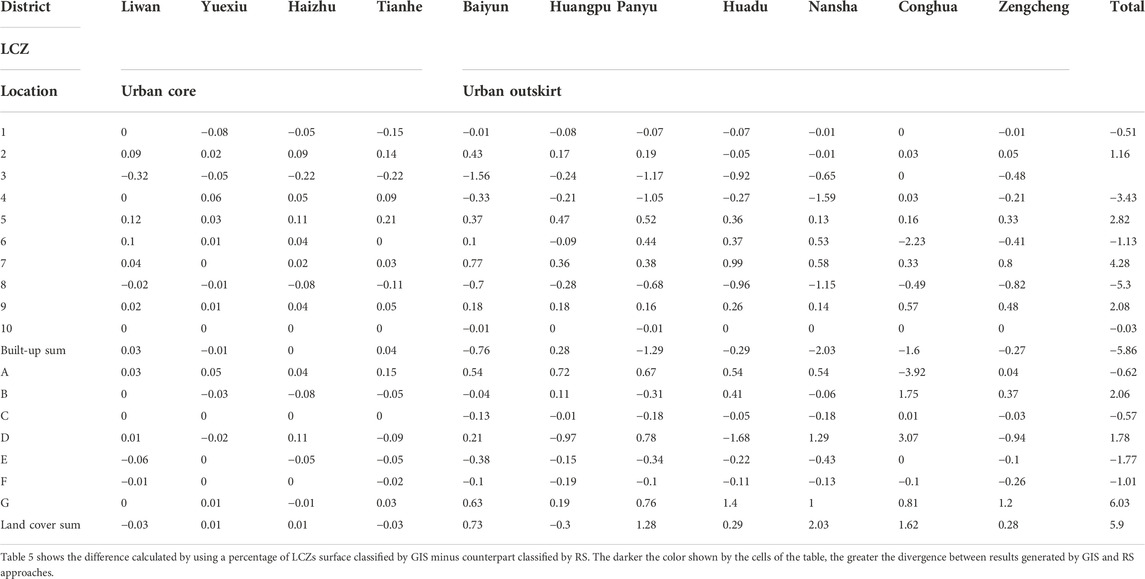
TABLE 5. Difference between the percentage of LCZ surface between GIS and RS approaches.
By mapping compact LCZs and lightweight low-rise LCZs, the GIS map can more accurately reflect the morphological characteristics in urban centers in outskirt districts, which remain crucial for assessing micro-climatic effects on urban peripheries. In core areas of urban outskirt districts, the GIS map demonstrates fine-grained classification and can capture the subtlety of polycentric urban structures based on building height data. While the RS map can provide continuous coverage for built-up areas in urban peripheries, the RS method tends to merge multiple LCZs between low-rise and sparsely built forms into one category, large low-rise LCZ 8. The ambiguity of mixed-use lands in urban peripheries comprising industrial and residential units has resulted in differences between GIS and RS-based results. LCZ 8 is less identified in the GIS map which could be caused by prioritizing the BSF in the GIS classification process. While warehouse and industrial buildings by materials definition, including concretes and steel, could fit into LCZ 8 but from a geometric perspective, their BSFs can be well above 50% in urban areas. This makes the GIS approach classify more areas into LCZ 7 which resulted in LCZ 8’s underrepresentation compared with the RS maps. Some large industrial buildings’ heights in outskirt districts are also above three stories which exceed the threshold of LCZ 8 and can sometimes be categorized as LCZ 5. When large low-rise buildings located in proximity to extensive low plant areas are occasionally classified by the GIS method as LCZ 9, but they could also be classified in LCZ 8. In the results of the RS approach, LCZ G is under-represented compared to GIS since RS has the tendency to classify the LCZ of mulberry fishponds into built-up forms.
The RS-based approach can be improved by enhancing the supervised classification process especially steps related to digitizing LCZ training samples. Prior studies have shown the potential to improve accuracy by addressing class incompleteness and inconsistent labeling of training areas (Ren et al., 2019; C. Xu et al., 2021). This study suggested the digitizing process needs to consider collecting samples adequately from both urban core and outskirt areas in case the research site is a megacity.
In summary, the similarities between classification results generated by GIS and RS approaches include 1) convergent classification in built-up areas of urban core districts where LCZs 1–6 are dominant (Figure 5); 2) consistent association between LST and LCZs 1–3 with major heat island contributor identified as LCZ E (Figure 6). Disparities remain in the urban outskirt districts, including 1) inconsistent land cover LCZs classification such as LCZ G in southern districts; 2) the built-up areas are inconsistent in peripheral areas of outskirt districts where low-rise between LCZs 6–8 are mixed and the different criteria between GIS and RS have led to significant variations on associations between classified LCZs and LST.
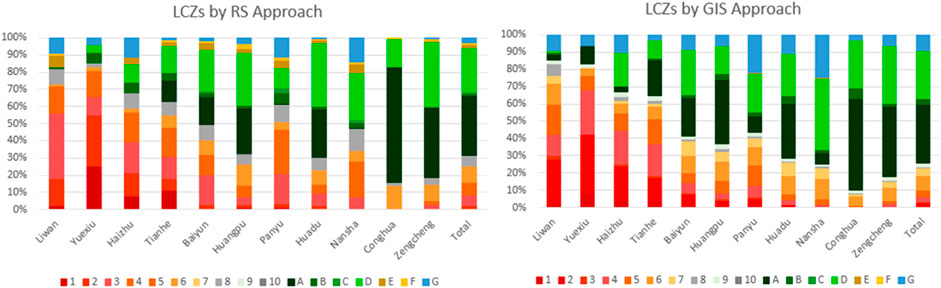
FIGURE 5. The proportion of LCZ sorted by districts in Guangzhou using RS- (left) and GIS-(right) based approaches.
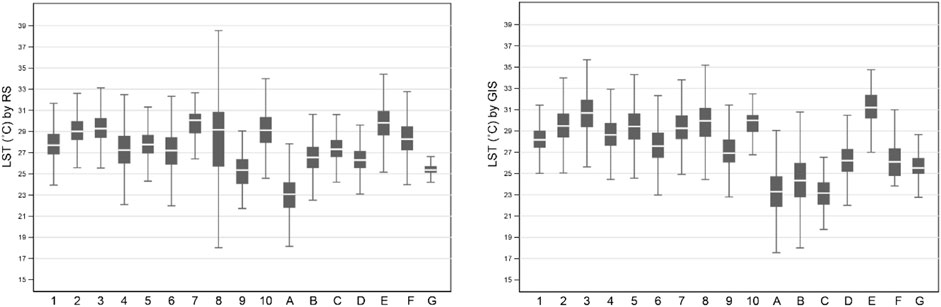
FIGURE 6. Box graphs for average LSTs extracted in LCZs classified by RS (left) and GIS (right): the white line in the box shows the median; the bottom line of the grey box indicates the first quartile; and the top line indicates the third quartile.
5.2 Effects of geographic information system-based and remote sensing-based attributes to model urban heat island
Few studies have quantitatively compared RS- and GIS-based methods for LST and UHI estimations. Addressing this issue can make the LCZ framework more evident-based and evaluate the effectiveness and feasibility of classification methods. The inconsistent format of urban data and lack of standardized methods tailored to explain urban climate studies have hampered the transfer of knowledge into urban decision-making (Ng 2015; Hidalgo et al., 2019).
First, considering the R2 coefficient (Table 4), GIS and RS-based approaches overall can better explain the relationships with UHI than the model using solely urban geometric factors. This also demonstrates the complementary effects of LCZ attributes on urban geometric and socioeconomic factors for better UHI estimation. This finding indicates that LCZ categorical elements can contribute to better reflecting the subtle conditions on urban geometry and land cover defined by LCZ classification, ultimately resulting in a stronger capability to estimate LST.
Second, the overall performance of the two approaches is largely equivalent in explaining the relationship between urban from and UHI intensity but the detailed LCZ results varied between GIS and RS means. The GIS-based measure has advantages when the study area is composed of complex urban features, and it captures better built-up land elements in urban areas which is consistent with the observation for GIS-based measures can capture finer resolution spatial details in previous studies (Hidalgo et al., 2019). By checking results with site photos, the GIS-based model for built-up area classification is less accurate in peripheral areas such as the northern outskirts due to the limitation of data availability or timely updates. Considering megacities such as Guangzhou or other rapidly growing cities, RS-based measure is advantageous to provide a quick overview with acceptable accuracy based on its continuous coverage of the total area within the city boundary.
Third, the coefficient of each LCZ categorical variable can shed light on the estimated change of LST if a parcel of land were conceived to be changed from LCZ one to a targeted LCZ. Both RS and GIS approaches identify LCZ G and A as the cooling source if an area was planned to be dominated by water and trees, with LST decreasing by 2.109 (GIS), 2.054 (RS), and 1.774 (GIS), 2.719 (RS) degrees, respectively. According to the coefficients, areas dominated by lightweight low-rise (LCZ 7) and large low-rise (LCZ 8) are major drivers for increasing LST. This difference in coefficient between LCZ 7 and 8 could be explained by the different methods between GIS- and RS-based models to classify LCZ 7 and 8.
6 Conclusion
6.1 Significance of comparing local climate zone classification approaches
Built on prior studies, this research further clarifies the complement and divergent relationship between object-based and pixel-based information from GIS and RS images which has not been stressed sufficiently. This study proposed a new framework to further compare the variance of LST based on GIS and RS data and models, with goals to address the gaps created by insufficient efforts for comparing the effectiveness between the two types of LCZ classifications. Built on prior LCZ classification and LST estimation studies (M. Cai et al., 2016; G. Chen et al., 2021; R. Wang et al., 2019), we synthesized and expanded existing frameworks to 1) effectively evaluate the classification of LCZs based on GIS and RS and 2) compare quantitatively the effects of LCZ attributes on UHI with both RS-based and GIS-based approaches taking Guangzhou as a case study.
To what extent LCZ categorical variable generated by GIS- and RS-based measures for estimating LST diverge and converge is discussed in this study. We quantified their impacts on UHI with a comprehensive set of multisource data in Guangzhou. First, the GIS- and RS-based approaches show almost equivalent collective explanatory power on overall estimation, with RS, explaining slightly more variance over GIS. Second, the LCZ categorical attributes generated by both RS and GIS models can contribute to estimating LST variation based on hypothetical changes in LCZs.
6.2 Implications to urban planning and design
This study has developed a framework for comparing GIS-based and RS-based LCZ classification in Guangzhou. It has demonstrated the workflow of synthesizing a set of planning and RS information into standardized maps of urban form. The two sets of LCZ classification maps are both capable to provide a quick diagnosis of urban forms and heat-affected areas in Guangzhou, which can serve as a base to support planners and designers to screen prioritized areas for UHI mitigation and adopting urban cooling strategies.
Considering the data-intensive and laborious process of the GIS-based approach, the RS-based approach can generate more cost-effective results with equivalent performance, but less cost time and high accessibility brought by freely available data. The RS-based approach can provide useful land use data with continuity that extends its coverage to peripheral or semi-urban areas. The RS-based approach can be maintained with the less technical capacity requirement without involving in-depth GIS techniques, which can be a relatively feasible option for agencies in large and fast-growing cities of developing countries due to the challenging data availability in terms of limited coverage and poor quality.
Based on the correlation between LCZs and UHI, we suggest urban policymakers and designers 1) compare approaches based on the different data sources and 2) identify and prioritize the most impacted built-up types, in Guangzhou’s case LCZ 7 and 8, to enhance heat mitigation. Integrating LCZs into urban planning guidelines can inform design strategies to be resilient and sustainable (C. Qiu et al., 2018; Kwok et al., 2019). In line with the new urbanization agenda which calls for high-quality growth and sustainable environmental management (S. Wang, Liu, and Qin 2022), this study identified feasible measures that can provide evidence-based policy recommendations to enhance urban resilience and tackle UHI.
6.3 Limitation and future study
Several limitations in this study will need further studies.
First, limited by the timeframe, resources, and weather conditions, the current LST data were collected from a group of RS imageries captured on specific dates. Based on the lessons learned from previous studies, representative days in autumn were identified to study the effect of the mean LST in LCZs of Guangzhou. While the select RS data sources exhibit a low cloud rate, minor areas covered by clouds could still affect the temperature captured in a limited number of pixels. Expanding RS data samples with a larger spatiotemporal consequence would possibly reveal a more subtle UHI and LST variation pattern. This study mainly assesses influencing factors and UHI by using the regression analysis method to model the association between LCZs and LST which only describes part of a complicated process. Modeling UHI comprehensively will need extra effort to consider the complex evolution process for UHI formation.
Second, given Guangzhou is a rapidly growing city, there might be minor differences between the available GIS administrative data and the actual land cover properties when remote sensing imageries were captured. Urban forms might not be timely reflected in some GIS administrative datasets which led to uncertainties. The training samples might not cover all the most suitable areas for classification since local knowledge of relevant neighborhoods and communities could not always keep up with the fast pace of urban expansion and regeneration in the city.
It could be challenging to translate the GIS- and RS-based quantification result of the association between UHI and LCZs into planning and policy recommendations. More efforts are needed to streamline RS- and GIS-based means and incorporate these approaches into feasible urban design actions that promote sustainable urban cooling and heat-resilient cities.
Third, many factors can affect LST estimation, including the top-down perspective generated by satellites and GIS which might overlook the influence posed by the vertical landscape. Previous studies (W. Qiu et al., 2022; X. Xu et al., 2022) have shown the streetscape-based approach has the potential to comprehensively measure the urban environment. This could make correlation studies between different LCZ types and LST more human centered. Future studies can compare approaches based on street view and RS to identify the effectiveness of identifying heat-vulnerable areas.
Data availability statement
The raw data supporting the conclusion of this article will be made available by the authors, without undue reservation.
Author contributions
Conceptualization: XX and WQ; methodology: XX; software: XX and SY; validation: WQ, DH, XL, and WL; formal analysis: XX, DH, and XL; investigation: WL, DH, and XL; resources: XX; data curation: XX, DH, and XL; writing—original draft preparation: XX; writing—review and editing: XX and SY; visualization: WL and SY; supervision: XX and DH; project administration: XX and SY; and funding acquisition: WQ.
Conflict of interest
The authors declare that the research was conducted in the absence of any commercial or financial relationships that could be construed as a potential conflict of interest.
Publisher’s note
All claims expressed in this article are solely those of the authors and do not necessarily represent those of their affiliated organizations, or those of the publisher, the editors, and the reviewers. Any product that may be evaluated in this article, or claim that may be made by its manufacturer, is not guaranteed or endorsed by the publisher.
Abbreviations
BH, building height; BSF, building surface fraction; GIS, geographic information system; H/W, height–width ratio; LCZ, local climate zone; LST, land surface temperature; OLS, ordinary least square; PSF, pervious surface fraction; RS, remote sensing; SVF, sky view factor; UHI, urban heat island.
References
Allison, P. (2012). When can you safely ignore multicollinearity?” Statistical horizons (blog). September 10. Available at: https://statisticalhorizons.com/multicollinearity/.
Baidu Open Source Platform (2022), Map API. Available at: https://lbsyun.baidu.com. (Accessed August 5, 2022).
Bechtel, B., Demuzere, M., Mills, G., Zhan, W., Sismanidis, P., Small, C., et al. (2019). SUHI analysis using local climate zones - a comparison of 50 cities. Urban Clim. 28, 100451. doi:10.1016/j.uclim.2019.01.005
Bureau of Forestry and Landscaping of Guangzhou Municipality. 2020. “Guangzhou green space System plan.”Available at: http://lyylj.gz.gov.cn/zmhd/wszxyj/content/post_6870961.html.
Buyantuyev, A., and Wu, J. (2010). Urban heat islands and landscape heterogeneity: Linking spatiotemporal variations in surface temperatures to land-cover and socioeconomic patterns. Landsc. Ecol. 25 (1), 17–33. doi:10.1007/s10980-009-9402-4
Cai, M., Ren, C., Xu, Y., Dai, W., and Xue Wang, M. (2016). “Local climate zone study for sustainable megacities development by using improved wudapt methodology – a case study in Guangzhou,” in Procedia Environmental Sciences, International Conference on Geographies of Health and Living in Cities: Making Cities Healthy for All (Hong Kong: Elsevier by ScienceDirect, 82–89. doi:10.1016/j.proenv.2016.09.017
Cai, Z., Tang, Y., and Zhan, Q. (2021). A cooled city? Comparing human activity changes on the impact of urban thermal environment before and after city-wide lockdown. Build. Environ. 195 (5), 107729. doi:10.1016/j.buildenv.2021.107729
Center For International Earth Science Information Network-CIESIN-Columbia University (2022). Global annual PM2.5 grids from MODIS, MISR and SeaWiFS aerosol optical depth (AOD), 1998-2019, V4.GL.03. Palisades, NY: NASA Socioeconomic Data and Applications Center SEDAC. doi:10.7927/FX80-4N39
Chen, F., Liu, M., Yang, C., Hao, X., and Chen, Z. (2022). Effect on the health of newborns caused by extreme temperature in Guangzhou. J. Environ. Manag. 311 (6), 114842. doi:10.1016/j.jenvman.2022.114842
Chen, G., Xie, J., Li, W., Li, X., Lamuel, C. H. C., Ren, C., et al. (2021). Future ‘local climate zone’ spatial change simulation in greater bay area under the shared socioeconomic pathways and ecological control line. Build. Environ. 203 (10), 108077. doi:10.1016/j.buildenv.2021.108077
Chen, H., Deng, Q., Zeng, Z., Ren, Z., and Shan, X. (2022). Influence of land cover change on spatio-temporal distribution of urban heat island —A case in wuhan main urban area. Sustain. Cities Soc. 79 (4), 103715. doi:10.1016/j.scs.2022.103715
Ching, J., Mills, G., Bechtel, B., See, L., Feddema, J., Wang, X., et al. (2018). Wudapt: An urban weather, climate, and environmental modeling infrastructure for the anthropocene. Bull. Am. Meteorol. Soc. 99 (9), 1907–1924. doi:10.1175/BAMS-D-16-0236.1
Deilami, K., Kamruzzaman, M., and Liu, Y. (2018). Urban heat island effect: A systematic review of spatio-temporal factors, data, methods, and mitigation measures. Int. J. Appl. Earth Observation Geoinformation 67 (5), 30–42. doi:10.1016/j.jag.2017.12.009
Ebi, K L., Capon, A., Berry, P., Broderick, C., de Dear, R., George, H., et al. (2021). Hot weather and heat extremes: Health risks. Lancet 398 (10301), 698–708. doi:10.1016/S0140-6736(21)01208-3
Estacio, I., Babaan, J., Pecson, N. J., Blanco, A. C., Escoto, J. E., and Alcantara, C. K. (2019). Gis-based mapping of local climate zones using fuzzy logic and cellular automata. Int. Arch. Photogramm. Remote Sens. Spat. Inf. Sci. XLII-4-W19, 199–206. Copernicus GmbH. doi:10.5194/isprs-archives-XLII-4-W19-199-2019
Fang, Y., and Gu, K. (2021). Exploring coupling effect between urban heat island effect and PM2.5 concentrations from the perspective of spatial environment. Environ. Eng. Res. 27 (2), 200559. doi:10.4491/eer.2020.559
Gál, T., Benjamin, B., and Unger, J. (2015). “Comparison of two different local climate zone mapping methods,” in 9th International Conference on Urban Climate, June, 6. Available at: http://real.mtak.hu/28577/1/GD2-6-1551002_a.pdf.
Gál, T., Lindberg, F., and Unger, J. (2009). Computing continuous sky view factors using 3D urban raster and vector databases: Comparison and application to urban climate. Theor. Appl. Climatol. 95 (1–2), 111–123. doi:10.1007/s00704-007-0362-9
Ge, J., Wang, Y., Akbari, H., and Zhou, D. (2022). The effects of sky view factor on ground surface temperature in cold regions – a case from xi’an, China. Build. Environ. 210 (2), 108707. doi:10.1016/j.buildenv.2021.108707
Guangzhou Climate and Agricultural Meteorology Center (2019). Guangzhou 2019 urban heat island monitoring report. Available at: http://tqyb.com.cn/gz/climaticprediction/islandmonitoring/2020-01-20/5834.html.
Guangzhou Statistic Bureau (2021). “2021 Guangzhou statistic yearbook.”Available at: https://lwzb.gzstats.gov.cn:20001/datav/admin/home/www_nj/2021/directory.html.
Hammer, M. S., van Donkelaar, A., Li, C., Lyapustin, A., Sayer, A. M., Hsu, N. C., et al. (2022). Global Annual PM2.5 Grids from MODIS, MISR and SeaWiFS Aerosol Optical Depth (AOD), 1998-2019, V4.GL.03. Palisades, NY: NASA Socioeconomic Data and Applications Center (SEDAC). doi:10.7927/fx80-4n39
Han, B., Luo, Z., Liu, Y., Zhang, T., and Liu, Y. (2022). Using local climate zones to investigate spatio-temporal evolution of thermal environment at the urban regional level: A case study in xi’an, China. Sustain. Cities Soc. 76 (1), 103495. doi:10.1016/j.scs.2021.103495
Hidalgo, J., Dumas, G., Masson, V., Petit, G., Benjamin, B., Bocher, E., et al. (2019). Comparison between local climate zones maps derived from administrative datasets and satellite observations. Urban Clim. 27 (3), 64–89. doi:10.1016/j.uclim.2018.10.004
Hu, M., Wang, Y., Xia, B., and Huang, G. (2020). Surface temperature variations and their relationships with land cover in the Pearl River Delta. Environ. Sci. Pollut. Res. 27 (30), 37614–37625. doi:10.1007/s11356-020-09768-z
Jakovljevic, M., Sugahara, T., Timofeyev, Y., and Rancic, N. (2020). <p>Predictors of (in)efficiencies of healthcare expenditure among the leading asian economies – comparison of OECD and non-OECD nations</p>. Risk Manag. Healthc. Policy 13 (10), 2261–2280. doi:10.2147/RMHP.S266386
Jay, ., Capon, A., Berry, P., Broderick, C., de Dear, R., George, H., et al. (2021). Reducing the health effects of hot weather and heat extremes: From personal cooling strategies to green cities. Lancet 398 (10301), 709–724. doi:10.1016/S0140-6736(21)01209-5
Khamchiangta, D., and Dhakal, S. (2019). Physical and non-physical factors driving urban heat island: Case of bangkok metropolitan administration, Thailand. J. Environ. Manag. 248 (10), 109285. doi:10.1016/j.jenvman.2019.109285
Kwok, Y. T., Schoetter, R., Ka-Lun Lau, K., Hidalgo, J., Ren, C., Pigeon, G., et al. (2019). How well does the local climate zone scheme discern the thermal environment of toulouse (France)? An analysis using numerical simulation data. Int. J. Climatol. 39 (14), 5292–5315. doi:10.1002/joc.6140
Lau, K K-L., Chung, S C., and Ren, C. (2019). Outdoor thermal comfort in different urban settings of sub-tropical high-density cities: An approach of adopting local climate zone (LCZ) classification. Build. Environ. 154 (5), 227–238. doi:10.1016/j.buildenv.2019.03.005
Li, X., and Wang, G. (2021). Examining runner’s outdoor heat exposure using urban microclimate modeling and GPS trajectory mining. Comput. Environ. Urban Syst. 89 (9), 101678. doi:10.1016/j.compenvurbsys.2021.101678
Lin, G., Fu, J., Jiang, D., Wang, J., Wang, Q., and Dong, D. (2015). Spatial variation of the relationship between PM2.5Concentrations and meteorological parameters in China. BioMed Res. Int. 2015, 1–15. doi:10.1155/2015/684618
Liu, X., Ming, Y., Liu, Y., Yue, W., and Han, G. (2022). Influences of landform and urban form factors on urban heat island: Comparative case study between chengdu and chongqing. Sci. Total Environ. 820 (5), 153395. doi:10.1016/j.scitotenv.2022.153395
Liu, Y., Fang, X., Cheng, C., Luan, Q., Du, W., Xiao, X., et al. (2016). Research and application of city ventilation assessments based on satellite data and GIS technology: A case study of the yanqi lake eco-city in huairou district, beijing. Mater. Apps. 23 (2), 320–327. doi:10.1002/met.1557
Lu, D., Schubring, J., and Schubring, J. (2004). Estimation of land surface temperature-vegetation abundance relationship for urban heat island studies. Remote Sens. Environ. 89 (2), 467–483. doi:10.1016/j.rse.2003.11.005
Moisa, M B., Bobo Merga, B., and Dessalegn, O. G. (2022). Urban heat island dynamics in response to land use land cover change: A case of jimma city, southwestern Ethiopia. Theor. Appl. Climatol. 149, 413–423. doi:10.1007/s00704-022-04055-y
Murray, L., Nguyen, H., Lee, Y-F., Remmenga, M., and Smith, D. 2012. “Variance inflation factors in regression models with dummy variables.” Conference on Applied Statistics in Agriculture, April. doi:10.4148/2475-7772.1034 Available at: https://newprairiepress.org/agstatconference/2012/proceedings/12.
National Aeronautics and Space Administration 2022. Atmospheric correction parameter calculator. Available at: https://atmcorr.gsfc.nasa.gov/.
National Geomatic Center of China (2019). “GlobeLand30 introduction.”Available at: http://globeland30.org/Page/EN_sysFrame/dataIntroduce.html?columnID=81&head=product¶=product&type=data.
Negassa, M. D., Demissie, T. M., and Dessalegn, O. G. (2020). Forest cover change detection using geographic information systems and remote sensing techniques: A spatio-temporal study on komto protected forest priority area, east wollega zone, Ethiopia. Environ. Syst. Res. (Heidelb). 9 (1), 1. doi:10.1186/s40068-020-0163-z
Ngarambe, J., Jeong Joen, S., and Han, C. H. (2021). Choong-hee han, and geun young YunExploring the relationship between particulate matter, CO, SO2, NO2, O3 and urban heat island in seoul, korea. J. Hazard. Mater. 403 (2), 123615. doi:10.1016/j.jhazmat.2020.123615
Oke, T. R. (1982). The energetic basis of the urban heat island. Q. J. R. Meteorol. Soc. 108 (455), 1–24. doi:10.1002/qj.49710845502
Oliveira, A., Lopes, A., and Niza, S. (2020). Local climate zones in five southern European cities: An improved GIS-based classification method based on copernicus data. Urban Clim. 33 (9), 100631. doi:10.1016/j.uclim.2020.100631
Peng, J., Jia, J., Liu, Y., Li, H., and Wu, J. (2018). Seasonal contrast of the dominant factors for spatial distribution of land surface temperature in urban areas. Remote Sens. Environ. 215 (9), 255–267. doi:10.1016/j.rse.2018.06.010
Qiu, C., Schmitt, M., Mou, L., Ghamisi, P., and Zhu, X X. (2018). Feature importance analysis for local climate zone classification using a residual convolutional neural network with multi-source datasets. Remote Sens. 10 (10), 1572. doi:10.3390/rs10101572
Qiu, W., Zhang, Z., Liu, X., Li, W., Li, X., Xu, X., et al. (2022). Subjective or objective measures of street environment, which are more effective in explaining housing prices? Landsc. Urban Plan. 221 (5), 104358. doi:10.1016/j.landurbplan.2022.104358
Raj, S., Paul, S K., Chakraborty, A., and Kuttippurath, J. (2020). Anthropogenic forcing exacerbating the urban heat islands in India. J. Environ. Manag. 257 (3), 110006. doi:10.1016/j.jenvman.2019.110006
Ren, C., Cai, M., Li, X., Zhang, L., Wang, R., Xu, Y., et al. (2019). Assessment of local climate zone classification maps of cities in China and feasible refinements. Sci. Rep. 9 (1), 18848. doi:10.1038/s41598-019-55444-9
Sekertekin, A. (2019). Validation of physical radiative transfer equation-based land surface temperature using Landsat 8 satellite imagery and SURFRAD in-situ measurements. J. Atmos. Solar-Terrestrial Phys. 196 (12), 105161. doi:10.1016/j.jastp.2019.105161
Shi, Y., Xiang, Y., and Zhang, Y. (2019). Urban design factors influencing surface urban heat island in the high-density city of Guangzhou based on the local climate zone. Sensors 19 (8), 3459. doi:10.3390/s19163459
Sobrino, J., Juan-Carlos, J-M., and Paolini, L. (2004). Land surface temperature retrieval from LANDSAT TM 5. Remote Sens. Environ. 90 (4), 434–440. doi:10.1016/j.rse.2004.02.003
Song, Z., Li, R., Qiu, R., Liu, S., Tan, C., Li, Q., et al. (2018). Global land surface temperature influenced by vegetation cover and PM2.5 from 2001 to 2016. Remote Sens. 10 (10), 2034. doi:10.3390/rs10122034
Stewart, I. D., and Oke, T. (2012). Local climate zones for urban temperature studies. Bull. Am. Meteorol. Soc. 93 (12), 1879–1900. doi:10.1175/BAMS-D-11-00019.1
UNEP (2020). How cities are using nature to keep heatwaves at bay. Nairobi: UNEP. Available at: http://www.unep.org/news-and-stories/story/how-cities-are-using-nature-keep-heatwaves-bay.
United Nations Environment Programme (2021). Beating the heat: A sustainable cooling handbook for cities. Nairobi, Kenya: UNEP - UN Environment Programme. Available at: http://www.unep.org/resources/report/beating-heat-sustainable-cooling-handbook-cities (Accessed November 8, 2021).
USGS (2022). “Landsat missions | Reston: U.S. Geological Survey.”Available at: https://www.usgs.gov/landsat-missions.
Valjarević, A., Filipović, D., Valjarević, D., Milanović, M., Milošević, S., Živić, N., et al. (2020). GIS and remote sensing techniques for the estimation of dew volume in the republic of Serbia. Meteorol. Appl. 27 (3), e1930. doi:10.1002/met.1930
Wan, J., Zhu, M., and Ding, W. (2021). Accuracy evaluation and parameter analysis of land surface temperature inversion algorithm for landsat-8 data. Adv. Meteorology 2021, 1–16. doi:10.1155/2021/9917145
Wang, R., Cai, M., Ren, C., Benjamin, B., Xu, Y., and Ng, E. (2019). Detecting multi-temporal land cover change and land surface temperature in Pearl River Delta by adopting local climate zone. Urban Clim. 28 (6), 100455. doi:10.1016/j.uclim.2019.100455
Wang, S., Liu, J., and Qin, X. (2022). Financing constraints, carbon emissions and high-quality urban development—empirical evidence from 290 cities in China. Int. J. Environ. Res. Public Health 19 (2), 2386. doi:10.3390/ijerph19042386
Wang, Y., Yi, G., Zhou, X., Zhang, T., Bie, X., Li, J., et al. (2021a). Spatial distribution and influencing factors on urban land surface temperature of twelve megacities in China from 2000 to 2017. Ecol. Indic. 125 (6), 107533. doi:10.1016/j.ecolind.2021.107533
Wang, Y., Guo, Z., and Han, J. (2021b). The relationship between urban heat island and air pollutants and them with influencing factors in the yangtze River Delta, China. Ecol. Indic. 129 (10), 107976. doi:10.1016/j.ecolind.2021.107976
Weier, J., and Herring, D. (2000). Measuring vegetation (NDVI & EVI).” Text.Article. NASA Earth Obs. Available at: https://earthobservatory.nasa.gov/features/MeasuringVegetation (Accessed August 30, 2000).
Windahl, E., and de Beurs, K. (2016). An intercomparison of Landsat land surface temperature retrieval methods under variable atmospheric conditions using in situ skin temperature. Int. J. Appl. Earth Observation Geoinformation 51 (9), 11–27. doi:10.1016/j.jag.2016.04.003
Wong, M., Ahmed, S., and Lee, K. (2010). Integrating biophysical and socioeconomic data to support land surface temperature analysis: An example in Hong Kong. Int. J. Geoinformatics 6 (6), 1–10.
Wong, N. H., Tan, C. L., Dionysia, D. K., and Takebayashi, H. (2021). Greenery as a mitigation and adaptation strategy to urban heat. Nat. Rev. Earth Environ. 2 (3), 166–181. doi:10.1038/s43017-020-00129-5
Wu, J., Xia, L., Chan, T. O., Joseph, A., and Zhong, B. (2022). Downscaling land surface temperature: A framework based on geographically and temporally neural network weighted autoregressive model with spatio-temporal fused scaling factors. ISPRS J. Photogrammetry Remote Sens. 187 (5), 259–272. doi:10.1016/j.isprsjprs.2022.03.009
Xu, C., Perry, H., Chen, R., Van Den Hoek, J., Hutchinson, R., Steve, H., et al. (2021). Application of training data affects success in broad-scale local climate zone mapping. Int. J. Appl. Earth Observation Geoinformation 103 (12), 102482. doi:10.1016/j.jag.2021.102482
Xu, X., Qiu, W., Li, W., Liu, X., Zhang, Z., Li, X., et al. (2022). Associations between street-view perceptions and housing prices: Subjective vs. Objective measures using computer vision and machine learning techniques. Remote Sens. 14 (4), 891. doi:10.3390/rs14040891
Xue, Z., Hou, G., Zhang, Z., Lyu, X., Jiang, M., Zou, Y., et al. (2019). Quantifying the cooling-effects of urban and peri-urban wetlands using remote sensing data: Case study of cities of northeast China. Landsc. Urban Plan. 182 (2), 92–100. doi:10.1016/j.landurbplan.2018.10.015
Yang, G., Ren, G., Zhang, P., Xue, X., Suonam, K. T., Jia, W., et al. (2021). PM2.5 influence on urban heat island (UHI) effect in beijing and the possible mechanisms. Geophys. Res. Atmos. 126 (17), e2021JD035227. doi:10.1029/2021JD035227
Yang, J, Ren, J., Sun, D., Xiao, X., Jianhong Cecilia, X., Jin, C., et al. (2021). Understanding land surface temperature impact factors based on local climate zones. Sustain. Cities Soc. 69 (6), 102818. doi:10.1016/j.scs.2021.102818
Yang, Z., Chen, Y., Guo, G., Zheng, Z., and Wu, Z. (2021). Characteristics of land surface temperature clusters: Case study of the central urban area of Guangzhou. Sustain. Cities Soc. 73 (10), 103140. doi:10.1016/j.scs.2021.103140
Yavorsky, J. E., Cohen, P. N., and Yue, Q. (2016). Man up, man down: Race–ethnicity and the hierarchy of men in female-dominated work. Sociol. Q. 57 (4), 733–758. doi:10.1111/tsq.12152
Yuan, F., and Bauer, M. E. (2007). Comparison of impervious surface area and normalized difference vegetation Index as indicators of surface urban heat island effects in Landsat imagery. Remote Sens. Environ. 106 (3), 375–386. doi:10.1016/j.rse.2006.09.003
Zakšek, K., Oštir, K., and Kokalj, Ž. (2011). Sky-view factor as a relief visualization technique. Remote Sens. 3 (2), 398–415. doi:10.3390/rs3020398
Zheng, Y., Ren, C., Xu, Y., Wang, R., Ho, J., Lau, K., et al. (2018). GIS-based mapping of local climate zone in the high-density city of Hong Kong. Urban Clim. 24 (6), 419–448. doi:10.1016/j.uclim.2017.05.008
Zheng, Z., Chen, Y., Wu, Z., and Qian, Q. (2016). “Correlation between land surface temperature inversion (based on landsat-8) and PM2.5 concentration: Taking Guangzhou as an example,” in 2016 4th International Workshop on Earth Observation and Remote Sensing Applications, Guangzhou, China, 04-06 July 2016 (IEEE), 284–289. doi:10.1109/EORSA.2016.7552814
Zhou, L., Yuan, B., Hu, F., Wei, C., Dang, X., and Sun, D. (2022). Understanding the effects of 2D/3D urban morphology on land surface temperature based on local climate zones. Build. Environ. 208 (1), 108578. doi:10.1016/j.buildenv.2021.108578
Keywords: urban heat island, local climate zones, classification, land surface temperature, urban design
Citation: Xu X, Qiu W, Li W, Huang D, Li X and Yang S (2022) Comparing satellite image and GIS data classified local climate zones to assess urban heat island: A case study of Guangzhou. Front. Environ. Sci. 10:1029445. doi: 10.3389/fenvs.2022.1029445
Received: 27 August 2022; Accepted: 17 October 2022;
Published: 18 November 2022.
Edited by:
Penghai Wu, Anhui University, ChinaReviewed by:
Zihan Liu, Nanjing University, ChinaAriel Blanco, University of the Philippines Diliman, Philippines
Copyright © 2022 Xu, Qiu, Li, Huang, Li and Yang. This is an open-access article distributed under the terms of the Creative Commons Attribution License (CC BY). The use, distribution or reproduction in other forums is permitted, provided the original author(s) and the copyright owner(s) are credited and that the original publication in this journal is cited, in accordance with accepted academic practice. No use, distribution or reproduction is permitted which does not comply with these terms.
*Correspondence: Xiang Xu, YXJjaXR5MDAxQG1haWwuc2N1dC5lZHUuY24=