- 1State Key Laboratory of Desert and Oasis Ecology, Xinjiang Institute of Ecology and Geography, Chinese Academy of Sciences, Urumqi, China
- 2Research Center for Ecology and Environment of Central Asia, Chinese Academy of Sciences, Urumqi, China
- 3University of Chinese Academy of Sciences, Beijing, China
- 4College of Ecology and Environment, Xinjiang University, Urumqi, China
- 5Key Laboratory of Oasis Ecology of Education Ministry, Urumqi, China
- 6Xinjiang Jinghe Observation and Research Station of Temperate Desert Ecosystem, Ministry of Education, Urumqi, China
Soil water repellency (SWR) is frequently observed in different types of land use and climates. Since SWR potentially enhances the difficulty of water infiltration in soil, the phenomenon can severely impact the water use of plants in arid regions. Therefore, understanding the origin of SWR is crucial in arid and semi-arid regions. This study investigated the fundamental and hydrological properties of soils in three arid ecosystems (desert, farmland, and forest). Analysis was done to determine any potential links between these properties, vegetation cover, and the severity of SWR. It was found that SWR was positively correlated with soil organic carbon (SOC), silt content, and field capacity of soil, where the SWR was in subcritical SWR range. The linear correlation and hierarchical clustering analysis confirmed that the SOC and silt content was the critical factor affecting the occurrence and persistence of SWR. The major source of organic carbon and nutrients to the soil was vegetation, which also had an impact on the distribution of soil carbon. The most striking observation was that the silt content was strongly correlated with both field capacity (r = 0.817, p = 0.001) and SWR (r = 0.710, p = 0.010), which can be attributed to the SOC on silt. In arid and semi-arid regions, the specific surface area of silt was relatively larger than that of sand. Meanwhile, compared to the clay in soil, the proportion of silt was much higher. The results imply that silt could significantly affect the soil hydrological properties and that silt content could serve as a new proxy for predicting water repellency in arid and semi-arid regions.
1 Introduction
Soil hydrophobicity or soil water repellency (SWR) is a soil physical phenomenon that reduces the affinity of soils to water in a way that soils resist wetting for periods ranging from a few seconds to hours, days, or weeks. This phenomenon can interrupt water infiltration, and potentially cause soil erosion (Dekker and Ritsema, 2000; Dekker et al., 2009; Fishkis et al., 2015; Li et al., 2019), while it can also lead to decreased cumulative evaporation (Rye and Smettem, 2017). Since SWR can hinder water flow and influence soil moisture, more attention needs to be paid to the distribution of SWR and its effect on soil hydrological parameters in arid and semi-arid regions. The occurrence of SWR is influenced by several physical and chemical properties of the soil, including soil moisture, soil organic matter, soil texture, etc (Dekker and Ritsema, 1996; DeBano, 2000; Doerr et al., 2005; Müller and Deurer, 2011; Smettem et al., 2021).
SWR is a common phenomenon that persists until the soil moisture reaches the threshold of SWR occurrence (Doerr and Thomas, 2000). While soil hydrophobicity drastically increases with decreasing soil water content, the strong water repellency of the soil severely restricts the amount of water infiltrating the soil (Wallach, 2010; Vogelmann et al., 2017; Chen et al., 2020). It is thus necessary to examine the persistence and distribution of SWR in arid ecosystems to evaluate its potential impact on soil functions. It is commonly accepted that SWR is caused by organic compounds derived from living or decomposing plants or microorganisms (Doerr et al., 2000), suggesting the fundamental effect of soil organic carbon (SOC) on the persistence of SWR (de Blas et al., 2013; Mao et al., 2019a). In general, a change in SOC content could alter the persistence of SWR in different land uses and ecosystems (Doerr et al., 2006; Behrends Kraemer et al., 2019). Hermansen et al. (2019) examined the SOC content and degree of SWR in 78 pasture soils in New Zealand and recognized SOC as an important factor influencing the occurrence of SWR. Wijewardana et al. (2016) measured the water repellency of soils collected from forests and pastures with a SOC content ranging between 1.4% and 26.3%. They proposed that the severity of SWR could be predicted using either a Langmuir-type or linear model based on the range of SOC content. Numerous studies have confirmed the role of SOC in regulating soil hydrophobicity, where SOC content was positively correlate with the level of SWR (Weber et al., 2021; Blaesbjerg et al., 2022). The spatial distribution of soil organic matter found in the soil of grassland led to the significant difference of the severity of SWR (Sándor et al., 2021). However, a contradiction was reported by de Blas et al. (2010), where the linear correlation between SOC content and SWR was insignificant, suggesting other soil properties, such as soil texture and soil moisture, may also affect the occurrence and persistence of SWR (Weber et al., 2021). As plants produce litter debris and primarily contribute to soil organic matter, the plant-derived hydrophobic compounds in soil play a part in influencing the intensity of SWR (Malvar et al., 2016; Mielnik et al., 2021). The distribution and intensity of SWR are frequently found to differ under different types and levels of vegetation coverage (Franco et al., 2000; Morley et al., 2005; Mataix-solera et al., 2013; Smettem et al., 2021). Research has not yet established the effects of vegetation cover on soil hydrophobicity for ecosystems with arid climates. To comprehend the role of SWR in arid ecosystems, interactions between SWR-relevant soil properties and vegetation cover must be considered.
Since soil texture is a fundamental characteristic of soil that significantly impacts soil hydrological properties, soil organic matter, and other soil attributes, the relationship between soil texture and soil hydrophobicity cannot be ignored. In order to reduce the intensity of water repellency in acidic-sandy soil, clay was applied as a soil amendment (McKissock et al., 2002), where the clay mixed with lime reduced the water repellency of soil and made the soil wettable (Shanmugam et al., 2014). In general, soil hydrophobicity occurs more frequently in sandy soils than in clayey soils (Dekker and Ritsema, 2003; Jordán et al., 2009; Zheng et al., 2019). Soil texture notably determines the soil moisture thresholds; the SWR of sandy soil disappears at a substantially lower threshold water content than that of clayey soil (Dekker and Ritsema, 1994; Dekker and Ritsema, 1996; Vogelmann et al., 2013). Zheng et al. (2016) reported that soil hydrophobicity increases with increasing sand content. However, Crockford et al. (1991), Vogelmann et al. (2010) found that soils with a predominance of clay had a stronger water repellency than coarse-textured soils. Behrends Kraemer et al. (2019) tested the correlation between the SWR and the clay contents of two types of soil, Vertisol and Mollisol, and found that the proportion of clay in soil, as opposed to other soil texture effects, determined the occurrence of SWR. In comparison to clay and sand, very little is known regarding the relationship between the silt content of soil and occurrence and persistence of SWR.
This study aimed to investigate the soil properties mainly soil texture and organic carbon that would influence the SWR in different ecosystems, with a focus on the occurrence and persistence of SWR in arid and semi-arid regions, as well as the determination of plant-originated SOC on soil hydrophobicity. In addition, this study was designed to ascertain whether SWR is related to field capacity for the assessment of possible impact from SWR on soil hydrological parameters.
2 Materials and methods
2.1 Study site
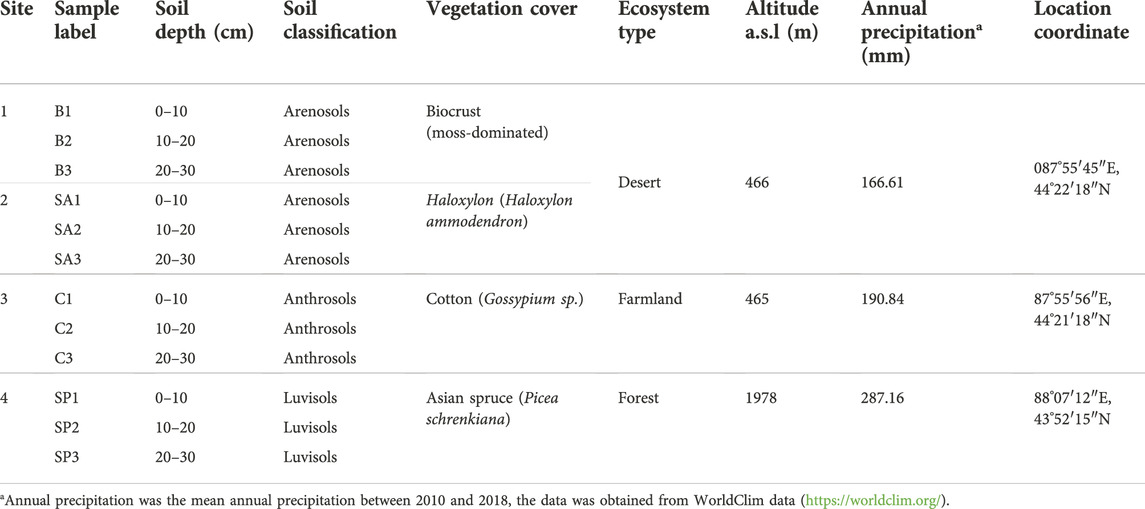
The study area is located in Fukang, Xinjiang, and has a variety of landscapes, including mountains, deserts, oases, and glaciers. The WorldClim database (https://worldclim.org/) indicates that between 2010 and 2018, the mean annual precipitation of this region was 200 mm ± 31 mm. According to the Köppen-Geiger climate classification (e.g., Kottek et al., 2006), The climate type of the region is arid. Four field sites with different types of ecosystems were selected in the study region and are presented in Table 1. Sites 1 (labelled with “B”) and 2 (labelled with “SA”) were both located at the southern edge of the Gurbantunggut Desert, where the vegetation cover was moss-dominant biological soil crust (biocrust) and Haloxylon (Haloxylon ammodendron), respectively. Site 3 (labelled with “C”) was in a cotton farmland at the edge of an oasis which was about 500 m in straight-line distance from the field site in the desert. The agricultural land is under tillage and drip-irrigation. Site 4 (labelled with “SP”) was located at a distance of 60 km from site 1 in a natural Asian spruce forest on the northern slope of the Tianshan Mountain. All the field sites were approximately in a line that ran from the low-altitude desert to the farmland in the oasis to the high-altitude mountains.
2.2 Sample collection
At each site, three sampled plots measuring 0.5 m × 0.5 m were randomly selected to obtain soils with a depth of 30 cm. The soil in the plot with the same colour in the top 30 cm was considered to belong to the same horizon. Thus, the soils at the sampled plots were equally divided into three layers, each of which was 10 cm thick. One soil sample was collected from one layer and thus in total three replicates were collected from three plots in each site. All the soil samples were air-dried at ambient room temperature and sieved through a mesh with a 2 mm diameter to remove leaf and root debris.
2.3 Soil physical and hydrological properties
Soil water content was determined by the gravimetric method. Cutting rings were used to collect undisturbed soil from each layer in the fields for soil bulk density and field capacity measurements. Soil bulk density and water content were estimated by oven-drying wet soils in the rings and aluminum tins at 105°C to constant weights. For field capacity measurement, all rings filled with soils were partially submerged in distilled water and saturated for 24 h. The rings were then placed to drain on top of additional rings that contained the same soil but had been oven-dried. The water content of the soil in the top ring was used to determine the field capacity following 24 h of gravitational drainage. The particles of the soil were classified into three categories: sand (0.05 mm–2 mm), silt (0.002 mm–0.05 mm), and clay (< 0.002 mm). Soil particle size distribution was measured using a laser diffraction particle size analyser (Mastersizer 2000; Malvern). Additionally, each dried soil sample was manually sieved using stacked sieves with the diameters of 2 mm, 1 mm, and 0.05 mm to better understand the variance in the carbon content of sand, silt, and clay particles. During the sieving process, the particle sizes of sand in soils were found to be less than 1 mm, and the clay particles were too small to physically separate from the silt-clay fraction through physical sieving. Finally, two soil particle fractions the sand fraction (0.05 mm–1 mm) and silt-clay fraction (< 0.05 mm) were obtained.
2.4 Soil chemical property analyses
A pH meter (Mettler Toledo SevenExcellence) was used to determine the pH of soil mixed with distilled water in a 1:2.5 (w:w) ratio. The organic carbon content of both soil and particle fractions (sand and silt-clay) were determined by digesting SOC in acidic potassium dichromate solution (0.8 mol L−1 K2Cr2O7). To compare the organic carbon content of silt-clay fraction and sand fraction and their individual contribution to organic carbon content of soil, two ratios were used in this study (Eqs 1, 2).
In Eqs 1, 2, OCsilt-clay denotes the organic carbon content of silt-clay fraction, and the unit is gram organic carbon per gram silt-clay; OCsand denotes the organic carbon content of sand fraction, and the unit is gram organic carbon per gram sand; OCsoil denotes the organic carbon content of the soil, and the unit is gram organic carbon per gram soil; fsilt-clay denotes the proportion of silt and clay in the soil, and the unit is %; fsand denotes the proportion of sand in the soil, and the unit is %.
The contents of nitrate nitrogen and nitrite nitrogen in the soil from our study region were neglected due to their relatively low abundance. Thus, the total nitrogen (TN) of soil was considered made of organic nitrogen and ammonia nitrogen, of which the content was measured according to the Kjeldahl method using a fully automated Kjeldahl analyser (Kjeltec 8400, FOSS). The total phosphorus content (TP) of soil was measured by a flow injection autoanalyzer (Seal Analytical, AA3) through Mo-Sb-Vc-method. Soil salinity, represented by the soluble salt content, was obtained by weighing the dried residue of water extracts from soil (Bado et al., 2016). Electrical conductivity (EC) was measured using a conductivity meter (DDS-307, INESA) in a mixture of distilled water and soil (5:1, w:w).
2.5 Soil water repellency determination
The persistence of SWR was determined by the contact angle method and the water droplet penetration test (WDPT). The WDPT was performed directly on the topsoils of the four soil profiles during the sampling process. The WDPT measurement was adapted from Dekker et al. (2009), 10 droplets of distilled water droplets were applied to the surface of the soils. When the droplet penetration time is categorized into five levels: < 5 s, 5 s–60 s, 60 s–600 s, 600 s–3,600 s and > 3,600 s, the water repellency would be accordingly classified as wettable, slightly repellent, strongly repellent, severely repellent and extremely repellent (Bisdom et al., 1993). The contact angle measurements were conducted in the laboratory. Prior to the measurements, air-dried soil was adhered to glass slides using double-sided tape to form an even and thin layer (Bachmann et al., 2000). Three droplets of distilled water were placed on each slide, and the contact angle between each droplet and the soil layer was measured by contact angle goniometer (SDC-200, SINDIN). When the contact angle is > 90°C, the material surface is considered as hydrophobic (Wessel, 1988). When the contact angle is between 0°C and 90°C, the SWR is in the subcritical SWR range (Bachmann et al., 2016). The larger contact angle indicates that the material surface is more hydrophobic.
2.6 Statistical analyses
The data of soil physical, chemical and hydrological properties was statistically analysed, including soil bulk density, water content, SOC, TN, TP, salinity, EC, contact angle and field capacity. One-way analysis of variance (ANOVA) was applied to analyse the significance of these data with Duncan test using IBM SPSS Statistics 20.0. The independent ANOVA factor was soil condition meaning the soils in different sites and depths. The Person’s correlation coefficients between all pairs of soil properties were calculated using Econometrics Toolbox of Matlab R2020b (MathWorks). The Hierarchical clustering of soil properties was analysed by normalizing all the data to be dimensionless and using Statistics and Machine Learning Toolbox of Matlab R2020b (MathWorks). Principal component analysis (PCA) was also applied using IBM SPSS Statistics 20.0 to investigate the possible association between SWR and other soil properties. The figures in the manuscript were plotted in OriginPro 2021.
3 Results
3.1 Variation of soil particle distribution
The texture of the soils was classified into four categories (Supplementary Figure S1 in the Supplemental Material): sandy loam (B1, B3, and SA2), loam (B2 and SA1), silt loam (SA3, C1, C2, SP1, SP2, and SP3), and silty clay loam (C3). For the soils in the desert (B and SA), the proportion of clay (11.02% ± 3.00%) was significantly smaller than either the proportion of silt (39.19% ± 6.88%) or sand (49.79% ± 9.47%) (Figure 1). For the soil in the cotton farmland, the proportion of soil particles significantly decreased in the order of silt (60.66% ± 0.74%), clay (27.44% ± 2.92%), and sand (11.89% ± 3.18%). Similar to the soil in the farmland, the proportion of silt (79.11% ± 3.26%) in the soil from the spruce forest was substantially higher than the proportion of clay (13.67% ± 4%) and sand (7.21% ± 5.90%). A comparison of the particle distribution of the soils in different ecosystems revealed that the largest proportion of silt was found in the spruce forest soil, followed by the soil from the farmland, while the soils from the desert had the lowest amount of silt. Meanwhile, the desert and the farmland soil had the significantly largest proportions of sand and clay, respectively.
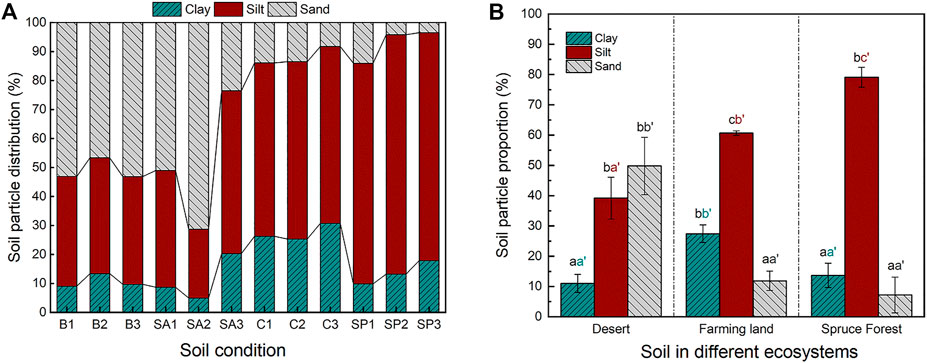
FIGURE 1. (A) The particle distribution of the soils under different vegetation; (B) the comparison of soil particle distribution in different ecosystems. The small letters in black in Figure 1B denote the significance (p < 0.05) of different types of soil particles within the same ecosystem, while the small letters in colour denote the significance (p < 0.05) of the same type of soil particles in different ecosystems, and each colour refers to one soil particle type.
3.2 Organic carbon in the soil and soil particle fractions
The topsoil in the spruce forest (SP1) had the highest SOC content (52.135 mg g−1) as shown in Figure 2A, and the soil SOC in the spruce forest significantly decreased with depth. The average organic carbon content of soil in the three ecosystems, forest, farmland, and desert followed a descending order. The organic carbon content of soils from the desert did not display a significant difference. The organic carbon ratio and organic carbon contribution ratio of the soils under different vegetations are presented in Figure 2B. The silt-clay fractions for most soils (B, SA, and C) contained a higher organic carbon content than sand fractions, as the organic carbon ratios of these soils were higher than 1. However, the silt-clay fractions for the spruce forest (SP) had a lower content of organic carbon than the sand fractions. The organic carbon contribution ratio showed the relative amount of organic carbon that the particle fractions held in soil. For all the soils except SA2, the silt-clay fractions contained more organic carbon than the sand fractions. In other words, the organic carbon was distributed more on the silt-clay fractions than on the sand fractions. In the soils from the spruce forest, the silt-clay fractions contained more than ten times the organic carbon compared to the sand fraction.
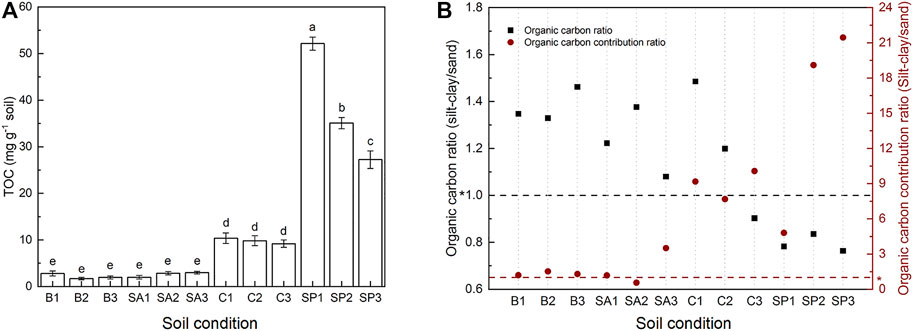
FIGURE 2. (A) The organic carbon content of the soil (SOC) under different vegetation; (B) the ratio of the organic carbon content of silt-clay and sand fractions (left Y-axis) and the ratio of organic carbon contribution of soil particle fractions to soil for silt-clay and sand fractions (right Y-axis). The small letters represent the significance (p < 0.05). The dash lines marked with “*” indicate the ratio value as 1.
3.3 Chemical and physical properties of soil
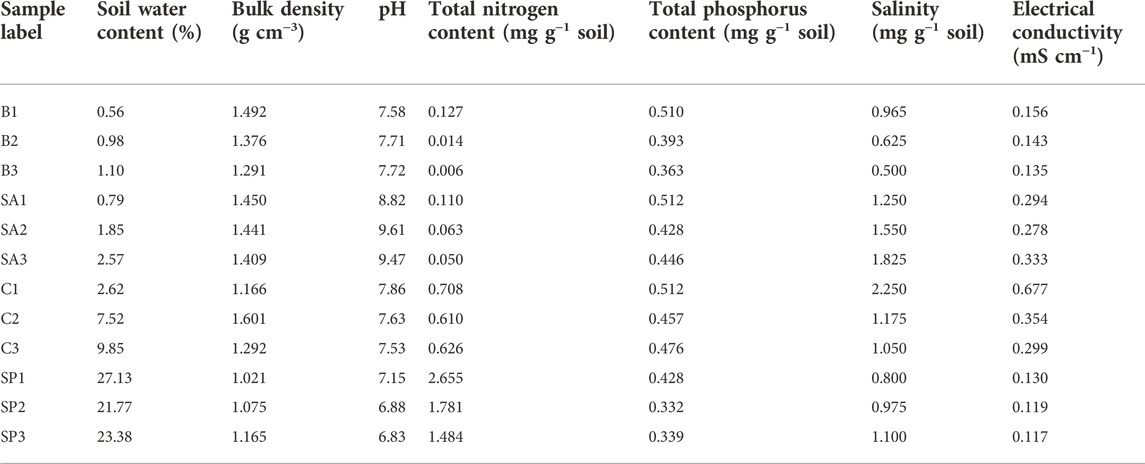
The highest and lowest soil water content were observed in the topsoil of spruce forest and biocrust, respectively (Table 2). The average bulk density of the soil under the biocrust and Haloxylon in the desert was 1.386 g cm−3 ± 0.101 g cm−3 and 1.433 g cm−3 ± 0.022 g cm−3, respectively, which was significantly higher than that of the soil from the spruce forest (1.087 g cm−3 ± 0.073 g cm−3). The highest density was observed in the soil at a depth of 10 cm–20 cm in the cotton farmland (C2). As shown in Table 2, the pH of most of the soil was higher than 7 except two deep soil the spruce forest (SP2 and SP3). The soil under Haloxylon had the highest pH (8.82–9.61), while the soil in the forest had the lowest (6.83–7.15). The average total nitrogen content (TN) of the soil had the same order as the SOC content, which was SP > C > SA > B. Soil SP1 had the highest TN content (2.655 mg g−1 soil), while soil B3 had the lowest (0.006 mg g−1 soil). In each soil profile, the soil TN content decreased with the increment of soil depth. As another important soil nutrient element, the average TP content of the soil in the spruce forest was the lowest compared to other soils. Soil salinity was presented by total salt content in our study, of which the topsoil in the cotton farmland showed the highest salinity (2.250 mg g−1 soil). The soil B3 under biocrust had the lowest salinity (0.500 mg g−1soil). In addition, the electricity conductivity (EC) of soil C1 was the highest (0.677 mS cm−1) among all the soils. The lowest EC (0.117 mS cm−1) was observed in SP3, of which the average EC of spruce forest soils was the lowest compared to the soils under other vegetation.
3.4 Soil field capacity and water repellency
The highest and lowest field capacity was found in the topsoils from the spruce forest (SP1, 40.52%) and covered by biocrust (B1, 13.36%), respectively. As can be seen in Figure 3A, the soil from the spruce forest showed a relatively higher field capacity compared to the other soils. The field capacity of the topsoil (0 cm–10 cm) under the biocrust in the desert ecosystem was significantly lower than the field capacity of the subsoils. In contrast, the field capacity of the topsoil from the spruce forest was much higher than the field capacity of the subsoils. The field capacity of the soils under the cotton and Haloxylon did not change significantly along the depth. The field capacity of soils at the depth of 10 cm–20 cm and 20 cm–30 cm were non-significantly different.
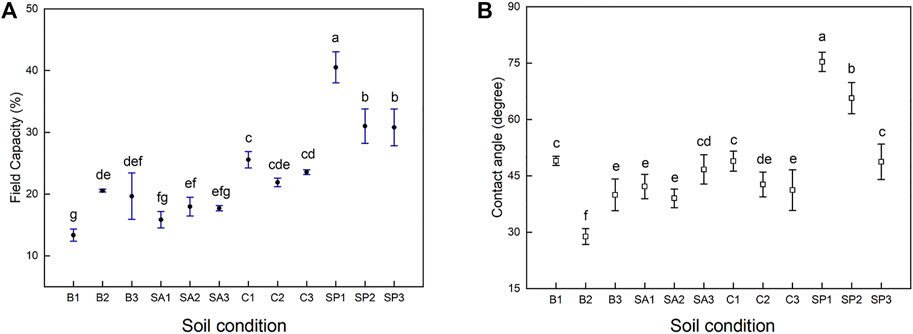
FIGURE 3. The field capacity (A) and contact angle (B) of the soils under different vegetation. The small letters denote the significance (p < 0.05).
Based on the WDPT in the field, the topsoil in the spruce forest was slightly water-repellent as it had an average WDPT time of 6 s, which the maximum one was 17 s and the minimum one was 2 s. The other three topsoils were wettable as the droplets did not last for more than 1 s. Figure 3B shows the contact angle of water droplets on the soil surface, which is the second method to determine the level of SWR. The contact angle of all soils was from 25.8°C to 75.3°C, which was considered in the subcritical water repellency range. A higher contact angle value implies stronger water repellency. The topsoil from the spruce forest (SP1) showed the highest SWR, while the sublayer soil covered by biocrust (B2) had the lowest SWR. The SWR of soils from the spruce forest significantly decreased with depth. The average SWR of the soils from the spruce forest was significantly higher than those covered by other vegetation. Most of the topsoils (0 cm–10 cm) had the highest SWR, however, the soil from the deeper depth of 20 cm–30 cm (SA3) was the most hydrophobic as compared to other two soils under Haloxylon. The water repellency of the soils covered by Haloxylon and cotton did not show any significant differences.
3.5 Correlation among soil properties
Table 3 demonstrates a matrix of Pearson’s correlations between each soil property. The severity of SWR presented by contact angle had a strong positive relationship with SOC content (r = 0.898, p = 0.000). The silt content (r = 0.710, p = 0.010) and field capacity (r = 0.768, p = 0.004) had positively significant correlations with SWR, while both were negatively correlated to bulk density. The silt content was strongly positively correlated to both SOC (r = 0.807, p = 0.001) and field capacity (r = 0.817, p = 0.001). The proportions of silt in soil had a significant negative relationship with bulk density (r = −0.672, p = 0.017). The clay content in soil did not display any significant relationship with other soil properties. The soil field capacity had a negative correlation with bulk density (r = −0.848, p = 0.001), and bulk density had a positive correlation with SOC content (r = 0.790, p = 0.002). The field capacity was positively and negatively correlated to the proportions of silt and sand, respectively. As depicted in Figure 4, the correlation between silt content and field capacity of the soil in this study (p = 0.001) and previous studies (p = 0.000) was strong.

TABLE 3. The correlation coefficient and significance (in brackets) from Pearson correlation matrix for soil properties.
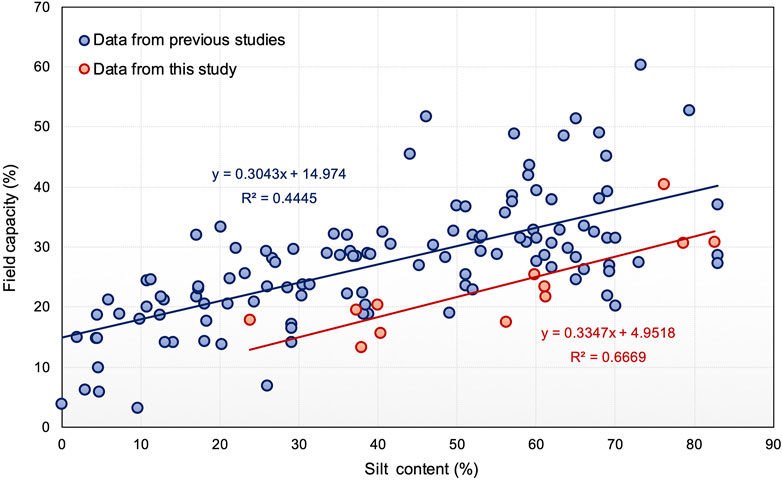
FIGURE 4. The significant linear correlation between field capacity of soil and the proportion of silt in the soil. The dataset plotted in blue was collected from previous studies (Pabin et al., 1998; Liu et al., 2007, 2015; Khan et al., 2009; Harrison-Kirk et al., 2014; Peake et al., 2014; López-Vicente et al., 2015; Wilson et al., 2016; Padarian et al., 2017; Aliku and Oshunsanya, 2018; Contreras and Bonilla, 2018; Assi et al., 2019; Vogeler et al., 2019; Rocateli et al., 2020).
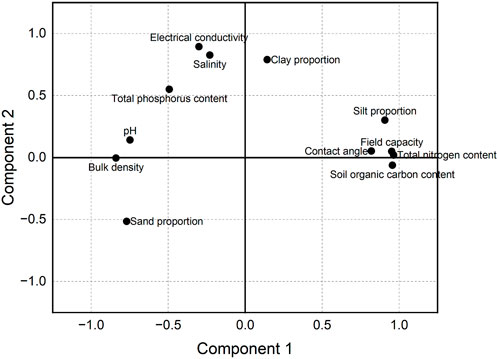
The soil properties were hierarchically clustered and combined within a heatmap (Figure 5). As shown in Figure 5, all the soil properties were grouped in two main clusters. SOC and TN contents, field capacity, and the contact angle were clustered with silt content in the first main cluster. The value of these five soil parameters followed the same increasing tendency in the soil from biocrust, Haloxylon, cotton farmland, and spruce forest. Soil bulk density, pH, and sand content were clustered as one group in the second main cluster, where the value of these properties was relatively low for the soil from the spruce forest but relatively high in the soil covered by biocrust. In addition, grouped soil TP content, salinity, electrical conductivity, and clay content also belonged to the second main cluster. The value of these properties was relatively low in the soil under biocrust and spruce forest. Based on the PCA analysis, three principal components (PCs) were selected as they explained 88.101% of variance of the dataset of soil properties, while the first two components explained 77.495%. The PC matrix in Table 4 showed the correlation coefficients of soil properties in three components. Seen from Figure 6, the fact loadings of silt content, field capacity, SOC, TN and contact angle were highly positive in PC1, while sand content, pH and bulk density had highly negative fact loadings. Soil clay content, total salinity and EC had the similar factor loadings, which were highly positive in PC2. The cluster of the soil properties in component plot was as similar as shown in Figure 5, which confirmed the strong association between silt content, field capacity, SOC and SWR.
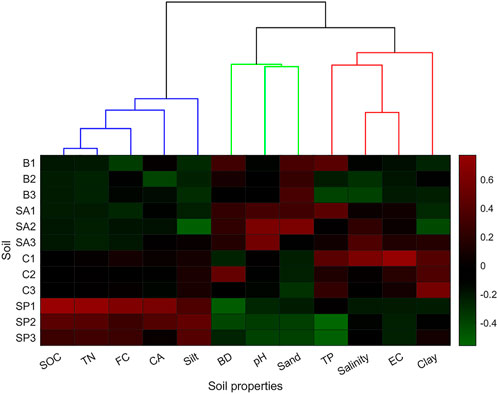
FIGURE 5. The heatmap involving the hierarchical clustering of soil properties. Here, “FC” is field capacity, “CA” is contact angle, “BD” is soil bulk density, and “EC” is soil electrical conductivity. The colour bar represents the normalized difference of the property of each soil from the average value of the property of all the soils. The red and green blocks indicate a value higher and lower than the average, respectively. The value of one block is closer to 0, implying that the property of that soil is close to the average.
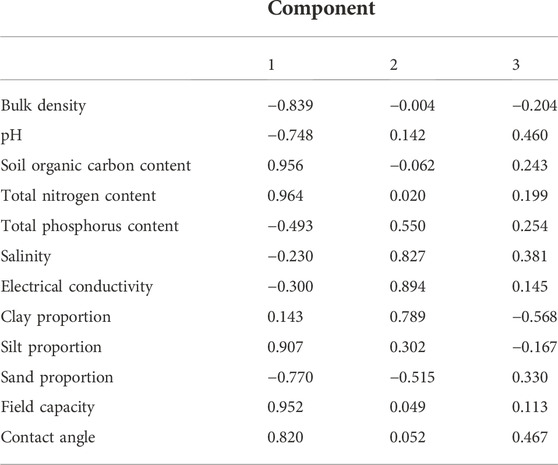
TABLE 4. Component matrix shows the correlation coefficients and variance value of three principal components with soil properties.
4 Discussion
4.1 Vegetation as the main SOC origin influencing SWR
Both the WDPT and contact angle measurements showed that the soil from the spruce forest had the greatest SWR compared to soils covered by other vegetation types. Since the high soil SOC found in the spruce forest, indicating that the abundant soil organic matter in the spruce forest leads to the highest SWR. The soil from the cotton farmland had the second highest content of SOC and water, indicating that agricultural management practices like irrigation and fertilization have probably improved these soil properties (Qiu et al., 2018; Alavaisha et al., 2019; Chenu et al., 2019). The biocrust-covered soil from the desert ecosystem had the lowest content of soil organic carbon, while the carbon content of the topsoil was much higher than that of the subsoil, implying that the biocrust is most likely the primary contributor of soil carbon and nutrients. This finding is consistent with that of Munoz-Rojas et al. (2018) who observed that soil with a larger coverage of biocrust contained a higher content of SOC. The topsoil under the biocrust exhibited a stronger SWR than other soils in the desert. The biocrusts in dryland are mainly composed of cyanobacteria, mosses, lichens, algae, and fungi (Rodriguez-Caballero et al., 2018; Kidron et al., 2020). These plants and microbes mainly influence the organic matter accumulation on topsoil, which explains the considerably higher soil hydrophobicity of topsoil compared to the deep soil (Müller and Deurer, 2011; Zavala et al., 2014; Mao et al., 2019b). On the contrary, for the soil beneath Haloxylon, the soil from the middle layer showed the lowest SWR. It corroborated with our field observations that the topsoil and the deep soil beneath Haloxylon displayed a higher content of SOC compared to the soil from the middle layer. It implied that the plant litter accumulated on the soil surface and the roots were more abundant in the deep soil than in the middle layer. The SOC was significantly and positively correlated with SWR, which was in an agreement with previous studies (Wijewardana et al., 2016; Fu et al., 2021). The soil organic matter, derived primarily from plants and sometimes from microbes, contributed to the hydrophobic compounds causing soil hydrophobicity (Doerr et al., 2000; Mao et al., 2014). Though soil bulk density was significantly negatively correlated to SOC, the bulk density of soil from the cotton farmland was the highest. It can be a result of soil compaction caused by a mechanical plough (Cavalcanti et al., 2019). Additionally, despite the fact that soils in desert ecosystems and agricultural land have a similar climate, agricultural management may significantly impact the soil properties in agricultural land, such as bulk density and soil nutrients.
4.2 SOC on silt determining SWR and field capacity
The current study found that the field capacity of the soil was significantly related to bulk density and SOC, which is in agreement with previous studies (Bauer and Black, 1992; Gozubuyuk et al., 2014). Ojeda et al. (2015) reported that since soil organic matter can adsorb water, the soil with high SOC content would hold more water and have a higher value of field capacity as compared to the soil with low carbon content. However, for the soil from the desert, the topsoil beneath the biocrust had the lowest field capacity despite having a relatively high SOC content. The effect of SOC on holding soil water may be diminished by its high bulk density. The low bulk density in soil results from either a high amount of organic matter or a porous structure (Gray et al., 2014). This could explain the increase in field capacity of soil with decreasing bulk density. Given the significant correlations between SWR and bulk density or field capacity, it probably emphasized the influence of SOC on these two factors.
It was observed that the content of either silt or sand was higher than the clay content. For instance, the cotton farmland and spruce forest soil contained more than 60% of silt. In contrast to the earlier findings, none of the soil parameters except silt content had a significant correlation with the clay content in this study. The lower content of clay observed in our study can be attributed to the removal of small particles from the surface by wind and water erosion in arid and semi-arid regions. Compared to sand, silt content is more strongly correlated to soil SOC, field capacity, and SWR. In general, the effect of clay and sand on hydrological properties receives more attention than silt. However, the field capacity, as shown in Figure 5, increased significantly and positively with the increasing silt content (r = 0.627, p = 0.000), indicating that the influence of silt on soil hydrological properties should not be underestimated. Since the particle size of silt falls between sand and clay, the fine and coarse silt would probably display characteristics similar to clay and sand, respectively. Zhao et al. (2006) demonstrated silt as fine particles with a function similar to clay and is closely associated with SOC content. Compared to sand, the silt fraction has the ability to adsorb the limited soil organic matter owing to its relatively large surface area (Oades, 1988; Virto et al., 2008). This is confirmed by the significant correlation between the silt content and SOC, and by the relatively high organic carbon content of the silt-clay fraction. The organic carbon content of the silt-clay fractions in the soils was much higher than that of the sand fractions. As in Lehrsch et al. (2012), the level of SWR had a significant positive correlation with the silt content (r = 0.705, p = 0.034), but was insignificantly (p = 0.264) related to organic carbon content. It implies that not all SOC affects SWR and the portion of organic carbon on silt might have the contribution. Moreover, Vogelmann et al. (2013) demonstrated the insignificant correlations between the proportions of soil particle size distribution, i.e. sand, silt and clay, and the level of SWR and confirmed the importance of soil organic matter associated with SWR. It potentially provided a possible hypothesis that neither the silt or other two soil particles directly affect soil hydrophobicity, however, the organic matter on these particles probably determines the persistence and occurrence of SWR. Due to the relatively broad distribution of organic matter on silt, the silt content positively correlated with SWR, suggesting that the effect of silt on SWR should be reconsidered. Compared to clay and sand, the influence of silt on SWR has rarely been reported. In a nutshell, small particles, particularly silt, can influence the soil properties associated with organic carbon in arid ecosystems. The study demonstrates that silt can be the dominant soil particle affecting the soil properties in arid and semi-arid regions.
5 Conclusion
In arid and semi-arid regions, SWR demonstrated a positive relationship with SOC, field capacity, and silt content, but a negative correlation with soil bulk density. Since SOC content impacted field capacity and bulk density, it indicates the crucial role of soil organic carbon in determining SWR. The most water-repellent soil was found under the spruce forest, which presented the highest SOC, implying the vital organic input from vegetation cover. In the arid and semi-arid regions, the vegetation, including biocrust, shrubs, and trees, primarily contributed the hydrophobic compounds and nutrients to the soil. The properties of soil (e.g., water content, salinity, nutrients, and bulk density) in the farmland amply demonstrated the effects of agricultural production. One of the most important findings from this study was that silt had a greater impact on soil properties as compared to clay and sand. The silt content was positively correlated to both SWR and field capacity. In arid and semi-arid regions, fine silt contributed more organic carbon than sand as silt had a larger surface area than sand and a relatively higher proportion than clay. Thus, a higher proportion of silt in soil results in higher field capacity and a stronger SWR. The main limitation of this study was the lack of a large sampling data to strongly support the findings and the absence of more advanced techniques to quantify the organic carbon content of clay and silt. Besides, the SWR measured in this study was in the subcritical SWR range, while the correlation between soil properties and SWR should be extended for the soils in the entire SWR range. Despite the limitations, using the soil silt content is recommended to determine the soil hydrological properties and predict the water repellency of soils in arid and semi-arid regions.
Data availability statement
The original contributions presented in the study are included in the article/Supplementary Material, further inquiries can be directed to the corresponding author.
Author contributions
Conceptualization: JM and LF; Methodology: JM and JZ; Formal analysis: JM, XM, and GW; Writing-original draft preparation: JM and KZ; Writing-review and editing: YL and LF; Supervision: YL.
Funding
This work was supported by National Natural Science Foundation of China (Grant number 42077327) and the Strategic Priority Research Program of Chinese Academy of Sciences (Grant number XDA20020101). This research is also supported by the K.C. Wong Education Foundation (Grant number GJTD-2020-14), the “High-level Talents Project-Tianchi Plan” of Xinjiang Uygur Autonomous Region and the “High-level Talents Project” of Xinjiang Institute of Ecology and Geography, Chinese Academy of Sciences.
Conflict of interest
All authors certify that they have no affiliations with or involvement in any organization or entity with any financial interest or non-financial interest in the subject matter or materials discussed in this manuscript.
Publisher’s note
All claims expressed in this article are solely those of the authors and do not necessarily represent those of their affiliated organizations, or those of the publisher, the editors and the reviewers. Any product that may be evaluated in this article, or claim that may be made by its manufacturer, is not guaranteed or endorsed by the publisher.
Supplementary material
The Supplementary Material for this article can be found online at: https://www.frontiersin.org/articles/10.3389/fenvs.2022.1031237/full#supplementary-material
References
Alavaisha, E., Manzoni, S., and Lindborg, R. (2019). Different agricultural practices affect soil carbon, nitrogen and phosphorous in Kilombero -Tanzania. J. Environ. Manage. 234, 159–166. doi:10.1016/j.jenvman.2018.12.039
Aliku, O. O., and Oshunsanya, S. O. (2018). Assessment of the SOILWAT model for predicting soil hydro-physical characteristics in three agro-ecological zones in Nigeria. Int. Soil Water Conservation Res. 6, 131–142. doi:10.1016/j.iswcr.2018.01.003
Assi, A. T., Blake, J., Mohtar, R. H., and Braudeau, E. (2019). Soil aggregates structure-based approach for quantifying the field capacity, permanent wilting point and available water capacity. Irrig. Sci. 37, 511–522. doi:10.1007/s00271-019-00630-w
Bachmann, J., Ellies, A., and Hartge, K. H. (2000). Development and application of a new sessile drop contact angle method to assess soil water repellency. J. Hydrol. X. 231–232, 66–75. doi:10.1016/S0022-1694(00)00184-0
Bachmann, J., Krueger, J., Goebel, M., and Heinze, S. (2016). Occurrence and spatial pattern of water repellency in a beech forest subsoil. J. Hydrol. Hydromech. 64, 100–110. doi:10.1515/johh-2016-0005
Bado, S., Forster, B. P., Ghanim, A. M. A., Jankowicz-Cieslak, J., Berthold, G., and Luxiang, L. (2016). Protocols for pre-field screening of mutants for salt tolerance in rice, Wheat and barley. SpingerOpen, 1–37. doi:10.1007/978-3-319-26590-2
Bauer, A., and Black, A. L. (1992). Organic carbon effects on available water capacity of three soil textural groups. Soil Sci. Soc. Am. J. 56, 248–254. doi:10.2136/sssaj1992.03615995005600010038x
Behrends Kraemer, F., Hallett, P. D., Morrás, H., Garibaldi, L., Cosentino, D., Duval, M., et al. (2019). Soil stabilisation by water repellency under no-till management for soils with contrasting mineralogy and carbon quality. Geoderma 355, 113902. doi:10.1016/j.geoderma.2019.113902
Bisdom, E. B. A., Dekker, L. W., and Schoute, J. F. T. (1993). Water repellency of sieve fractions from sandy soils and relationships with organic material and soil structure. Geoderma 56, 105–118. doi:10.1016/0016-7061(93)90103-R
Blaesbjerg, N. H., Weber, P. L., de Jonge, L. W., Moldrup, P., Greve, M. H., Arthur, E., et al. (2022). Water repellency prediction in high-organic Greenlandic soils: Comparing vis–NIRS to pedotransfer functions. Soil Sci. Soc. Am. J. 86, 643–657. doi:10.1002/saj2.20407
Cavalcanti, R. Q., Rolim, M. M., de Lima, R. P., Tavares, U. E., Pedrosa, E. M. R., and Gomes, I. F. (2019). Soil physical and mechanical attributes in response to successive harvests under sugarcane cultivation in Northeastern Brazil. Soil Tillage Res. 189, 140–147. doi:10.1016/j.still.2019.01.006
Chen, J., Mcguire, K. J., and Stewart, R. D. (2020). Effect of soil water-repellent layer depth on post-wildfire hydrological processes. Hydrol. Process. 34, 270–283. doi:10.1002/hyp.13583
Chenu, C., Angers, D. A., Barré, P., Derrien, D., Arrouays, D., and Balesdent, J. (2019). Increasing organic stocks in agricultural soils: Knowledge gaps and potential innovations. Soil Tillage Res. 188, 41–52. doi:10.1016/j.still.2018.04.011
Contreras, C. P., and Bonilla, C. A. (2018). A comprehensive evaluation of pedotransfer functions for predicting soil water content in environmental modeling and ecosystem management. Sci. Total Environ. 644, 1580–1590. doi:10.1016/j.scitotenv.2018.07.063
Crockford, H., Topalidis, S., and Richardson, D. P. (1991). Water repellency in a dry sclerophyll eucalypt forest — Measurements and processes. Hydrol. Process. 5, 405–420. doi:10.1002/hyp.3360050408
de Blas, E., Almendros, G., and Sanz, J. (2013). Molecular characterization of lipid fractions from extremely water-repellent pine and eucalyptus forest soils. Geoderma 206, 75–84. doi:10.1016/j.geoderma.2013.04.027
de Blas, E., Rodríguez-Alleres, M., and Almendros, G. (2010). Speciation of lipid and humic fractions in soils under pine and eucalyptus forest in northwest Spain and its effect on water repellency. Geoderma 155, 242–248. doi:10.1016/j.geoderma.2009.12.007
DeBano, L. (2000). The role of fire and soil heating on water repellency in wildland environments: A review. J. Hydrol. X. 231–232, 195–206. doi:10.1016/S0022-1694(00)00194-3
Dekker, L. W., and Ritsema, C. J. (1994). How water moves in a water repellent sandy soil: 1. Potential and actual water repellency. Water Resour. Res. 30, 2507–2517. doi:10.1029/94WR00749
Dekker, L. W., Ritsema, C. J., Oostindie, K., Moore, D., and Wesseling, J. G. (2009). Methods for determining soil water repellency on field-moist samples. Water Resour. Res. 45, 1–6. doi:10.1029/2008WR007070
Dekker, L. W., and Ritsema, C. J. (1996). Uneven moisture patterns in water repellent soils. Geoderma 70, 87–99. doi:10.1016/0016-7061(95)00075-5
Dekker, L. W., and Ritsema, C. J. (2000). Wetting patterns and moisture variability in water repellent Dutch soils. J. Hydrol. X. 231–232, 148–164. doi:10.1016/s0022-1694(00)00191-8
Dekker, L. W., and Ritsema, C. J. (2003). “Wetting patterns in water repellent Dutch soils,” in Soil water repellency: Occurrence, consequences, and amelioration, 151–166. doi:10.1016/B978-0-444-51269-7.50017-5
Doerr, S. H., Douglas, P., Evans, R. C., Morley, C. P., Mullinger, N. J., Bryant, R., et al. (2005). Effects of heating and post-heating equilibration times on soil water repellency. Soil Res. 43, 261–267. doi:10.1071/SR04092
Doerr, S. H., Shakesby, R. A., Dekker, L. W., and Ritsema, C. J. (2006). Occurrence, prediction and hydrological effects of water repellency amongst major soil and land-use types in a humid temperate climate. Eur. J. Soil Sci. 57, 741–754. doi:10.1111/j.1365-2389.2006.00818.x
Doerr, S. H., Shakesby, R. A., and Walsh, R. P. D. (2000). Soil water repellency : Its causes, characteristics and hydro-geomorphological significance. Earth. Sci. Rev. 51, 33–65. doi:10.1016/s0012-8252(00)00011-8
Doerr, S. H., and Thomas, A. D. (2000). The role of soil moisture in controlling water repellency: New evidence from forest soils in Portugal. J. Hydrol. X. 231–232, 134–147. doi:10.1016/S0022-1694(00)00190-6
Fishkis, O., Wachten, M., and Hable, R. (2015). Assessment of soil water repellency as a function of soil moisture with mixed modelling. Eur. J. Soil Sci. 66, 910–920. doi:10.1111/ejss.12283
Franco, C. M., Clarke, P., Tate, M., and Oades, J. (2000). Hydrophobic properties and chemical characterisation of natural water repellent materials in Australian sands. J. Hydrol. X. 231–232, 47–58. doi:10.1016/S0022-1694(00)00182-7
Fu, Z., Hu, W., Beare, M. H., Müller, K., Wallace, D., and Wai Chau, H. (2021). Contributions of soil organic carbon to soil water repellency persistence: Characterization and modelling. Geoderma 401, 115312. doi:10.1016/j.geoderma.2021.115312
Gozubuyuk, Z., Sahin, U., Ozturk, I., Celik, A., and Adiguzel, M. C. (2014). Tillage effects on certain physical and hydraulic properties of a loamy soil under a crop rotation in a semi-arid region with a cool climate. Catena 118, 195–205. doi:10.1016/j.catena.2014.01.006
Gray, M., Johnson, M. G., Dragila, M. I., and Kleber, M. (2014). Water uptake in biochars: The roles of porosity and hydrophobicity. Biomass Bioenergy 61, 196–205. doi:10.1016/j.biombioe.2013.12.010
Harrison-Kirk, T., Beare, M. H., Meenken, E. D., and Condron, L. M. (2014). Soil organic matter and texture affect responses to dry/wet cycles: Changes in soil organic matter fractions and relationships with C and N mineralisation. Soil Biol. Biochem. 74, 50–60. doi:10.1016/j.soilbio.2014.02.021
Hermansen, C., Moldrup, P., Müller, K., Jensen, P. W., van den Dijssel, C., Jeyakumar, P., et al. (2019). Organic carbon content controls the severity of water repellency and the critical moisture level across New Zealand pasture soils. Geoderma 338, 281–290. doi:10.1016/j.geoderma.2018.12.007
Jordán, A., Zavala, L. M., Nava, A. L., and Alanís, N. (2009). Occurrence and hydrological effects of water repellency in different soil and land use types in Mexican volcanic highlands. Catena 79, 60–71. doi:10.1016/j.catena.2009.05.013
Khan, M. J., Razzaq, A., Khattak, M. K., and Garcia, L. (2009). Effect of different pre-sowing water application depths on wheat yield under spate irrigation in Dera Ismael Khan District of Pakistan. Agric. Water Manag. 96, 1467–1474. doi:10.1016/j.agwat.2009.05.001
Kidron, G. J., Wang, Y., and Herzberg, M. (2020). Exopolysaccharides may increase biocrust rigidity and induce runoff generation. J. Hydrol. X. 588, 125081. doi:10.1016/j.jhydrol.2020.125081
Kottek, M., Grieser, J., Beck, C., Rudolf, B., and Rubel, F. (2006). World map of the Köppen-Geiger climate classification updated. metz. 15, 259–263. doi:10.1127/0941-2948/2006/0130
Lehrsch, G. A., Sojka, R. E., and Koehn, A. C. (2012). Surfactant effects on soil aggregate tensile strength. Geoderma 190, 199–206. doi:10.1016/j.geoderma.2012.06.015
Li, Y., Yao, N., Tang, D., Chau, H. W., and Feng, H. (2019). Soil water repellency decreases summer maize growth. Agric. For. Meteorol. 267, 1–11. doi:10.1016/j.agrformet.2018.12.001
Liu, G. D., Li, Y. C., and Alva, A. K. (2007). Temperature quotients of ammonia emission of different nitrogen sources applied to four agricultural soils. Soil Sci. Soc. Am. J. 71, 1482–1489. doi:10.2136/sssaj2006.0221
Liu, H. T., Li, B. G., and Ren, T. S. (2015). Soil profile characteristics of high-productivity alluvial cambisols in the North China Plain. J. Integr. Agric. 14, 765–773. doi:10.1016/S2095-3119(14)60789-9
López-Vicente, M., Quijano, L., and Navas, A. (2015). Spatial patterns and stability of topsoil water content in a rainfed fallow cereal field and Calcisol-type soil. Agric. Water Manag. 161, 41–52. doi:10.1016/j.agwat.2015.07.009
Malvar, M. C., Prats, S. A., Nunes, J. P., and Keizer, J. J. (2016). Soil water repellency severity and its spatio-temporal variation in burnt eucalypt plantations in north-central Portugal. Land Degrad. Dev. 27, 1463–1478. doi:10.1002/ldr.2450
Mao, J., Nierop, K. G. J., Dekker, S. C., Dekker, L. W., and Chen, B. (2019a). Understanding the mechanisms of soil water repellency from nanoscale to ecosystem scale: A review. J. Soils Sediments 19, 171–185. doi:10.1007/s11368-018-2195-9
Mao, J., Nierop, K. G. J., Sinninghe Damsté, J. S., and Dekker, S. C. (2014). Roots induce stronger soil water repellency than leaf waxes. Geoderma 232–234, 328–340. doi:10.1016/j.geoderma.2014.05.024
Mao, J., Zhang, K., and Chen, B. (2019b). Linking hydrophobicity of biochar to the water repellency and water holding capacity of biochar-amended soil. Environ. Pollut. 253, 779–789. doi:10.1016/j.envpol.2019.07.051
Mataix-Solera, J., Arcenegui, V., Tessler, N., Zornoza, R., Wittenberg, L., Martínez, C., et al. (2013). Soil properties as key factors controlling water repellency in fi re-affected areas : Evidences from burned sites in Spain and Israel. Catena 108, 6–13. doi:10.1016/j.catena.2011.12.006
McKissock, I., Gilkes, R. J., and Walker, E. L. (2002). The reduction of water repellency by added clay is influenced by clay and soil properties. Appl. Clay Sci. 20, 225–241. doi:10.1016/S0169-1317(01)00074-6
Mielnik, L., Hewelke, E., Weber, J., Oktaba, L., Jonczak, J., and Podlasiński, M. (2021). Changes in the soil hydrophobicity and structure of humic substances in sandy soil taken out of cultivation. Agric. Ecosyst. Environ. 319, 107554. doi:10.1016/j.agee.2021.107554
Morley, C. P., Mainwaring, K. A., Doerr, S. H., Douglas, P., Llewellyn, C. T., and Dekker, L. W. (2005). Organic compounds at different depths in a sandy soil and their role in water repellency. Soil Res. 43, 239. doi:10.1071/SR04094
Müller, K., and Deurer, M. (2011). Review of the remediation strategies for soil water repellency. Agric. Ecosyst. Environ. 144, 208–221. doi:10.1016/j.agee.2011.08.008
Munoz-Rojas, M., Roman, J. R., Roncero-Ramos, B., Erickson, T. E., Merritt, D. J., Aguila-Carricondo, P., et al. (2018). Cyanobacteria inoculation enhances carbon sequestration in soil substrates used in dryland restoration. Sci. Total Environ. 636, 1149–1154. doi:10.1016/j.scitotenv.2018.04.265
Oades, J. M. (1988). The retention of organic-matter in soils. Biogeochemistry 5, 35–70. doi:10.1007/BF02180317
Ojeda, G., Mattana, S., Àvila, A., Maria, J., Volkmann, M., and Bachmann, J. (2015). Are soil-water functions affected by biochar application. Geoderma 249-250, 2491–25011. doi:10.1016/j.geoderma.2015.02.014
Pabin, J., Lipiec, J., Włodek, S., Biskupski, A., and Kaus, A. (1998). Critical soil bulk density and strength for pea seedling root growth as related to other soil factors. Soil Tillage Res. 46, 203–208. doi:10.1016/S0167-1987(98)00098-1
Padarian, J., Minasny, B., and McBratney, A. B. (2017). Chile and the Chilean soil grid: A contribution to GlobalSoilMap. Geoderma Reg. 9, 17–28. doi:10.1016/j.geodrs.2016.12.001
Peake, L. R., Reid, B. J., and Tang, X. (2014). Quantifying the influence of biochar on the physical and hydrological properties of dissimilar soils. Geoderma 235–236, 182–190. doi:10.1016/j.geoderma.2014.07.002
Qiu, L., Wu, Y., Hao, M., Shen, J., Lei, X., Liao, W., et al. (2018). Simulation of the irrigation requirements for improving carbon sequestration in a rainfed cropping system under long-term fertilization on the Loess Plateau of China. Agric. Ecosyst. Environ. 265, 198–208. doi:10.1016/j.agee.2018.06.015
Rocateli, A. C., Ashworth, A. J., West, C. P., Brye, K. R., Popp, M. P., and Kiniry, J. R. (2020). Simulating switchgrass biomass productivity using ALMANAC. I. Calibration of soil water. Agron. J. 112, 183–193. doi:10.1002/agj2.20054
Rodriguez-Caballero, E., Belnap, J., Büdel, B., Crutzen, P. J., Andreae, M. O., Pöschl, U., et al. (2018). Dryland photoautotrophic soil surface communities endangered by global change. Nat. Geosci. 11, 185–189. doi:10.1038/s41561-018-0072-1
Rye, C. F., and Smettem, K. R. J. (2017). The effect of water repellent soil surface layers on preferential flow and bare soil evaporation. Geoderma 289, 142–149. doi:10.1016/j.geoderma.2016.11.032
Sándor, R., Iovino, M., Lichner, L., Alagna, V., Forster, D., Fraser, M., et al. (2021). Impact of climate, soil properties and grassland cover on soil water repellency. Geoderma 383, 114780. doi:10.1016/j.geoderma.2020.114780
Shanmugam, S., Abbott, L. K., and Murphy, D. V. (2014). Clay addition to lime-amended biosolids overcomes water repellence and provides nitrogen supply in an acid sandy soil. Biol. Fertil. Soils 50, 1047–1059. doi:10.1007/s00374-014-0927-6
Smettem, K. R. J., Rye, C., Henry, D. J., Sochacki, S. J., and Harper, R. J. (2021). Soil water repellency and the five spheres of influence : A review of mechanisms , measurement and ecological implications. Sci. Total Environ. 787, 147429. doi:10.1016/j.scitotenv.2021.147429
Virto, I., Barré, P., and Chenu, C. (2008). Microaggregation and organic matter storage at the silt-size scale. Geoderma 146, 326–335. doi:10.1016/j.geoderma.2008.05.021
Vogeler, I., Carrick, S., Cichota, R., and Lilburne, L. (2019). Estimation of soil subsurface hydraulic conductivity based on inverse modelling and soil morphology. J. Hydrol. X. 574, 373–382. doi:10.1016/j.jhydrol.2019.04.002
Vogelmann, E. S., Reichert, J. M., Prevedello, J., Awe, G. O., and Cerdà, A. (2017). Soil moisture influences sorptivity and water repellency of topsoil aggregates in native grasslands. Geoderma 305, 374–381. doi:10.1016/j.geoderma.2017.06.024
Vogelmann, E. S., Reichert, J. M., Prevedello, J., Awe, G. O., and Mataix-Solera, J. (2013). Can occurrence of soil hydrophobicity promote the increase of aggregates stability? Catena 110, 24–31. doi:10.1016/j.catena.2013.06.009
Vogelmann, E. S., Reichert, J. M., Reinert, D. J., Mentges, M. I., Vieira, D. A., de Barros, C. A. P., et al. (2010). Water repellency in soils of humid subtropical climate of Rio Grande do Sul, Brazil. Soil Tillage Res. 110, 126–133. doi:10.1016/j.still.2010.07.006
Wallach, R. (2010). Effect of soil water repellency on moisture distribution from a subsurface point source. Water Resour. Res. 46, 1–9. doi:10.1029/2009WR007774
Weber, P. L., Hermansen, C., Norgaard, T., Pesch, C., Moldrup, P., Greve, M. H., et al. (2021). Moisture-dependent water repellency of Greenlandic cultivated soils. Geoderma 402, 115189. doi:10.1016/j.geoderma.2021.115189
Wessel, A. T. (1988). On using the effective contact angle and the water drop penetration time for the classification of water repellency in dune soils. Earth Surf. Proc. Land. 13, 555–562. doi:10.1002/esp.3290130609
Wijewardana, N. S., Müller, K., Moldrup, P., Clothier, B., Komatsu, T., Hiradate, S., et al. (2016). Soil-water repellency characteristic curves for soil profiles with organic carbon gradients. Geoderma 264, 150–159. doi:10.1016/j.geoderma.2015.10.020
Wilson, T. B., Baker, C. B., Meyers, T. P., Kochendorfer, J., Hall, M., Bell, J. E., et al. (2016). Site-specific soil properties of the US climate reference network soil moisture. Vadose zone J. 15, 1–14. doi:10.2136/vzj2016.05.0047
Zavala, L. M., García-Moreno, J., Gordillo-Rivero, Á. J., Jordán, A., and Mataix-Solera, J. (2014). Natural soil water repellency in different types of Mediterranean woodlands. Geoderma 226–227, 170–178. doi:10.1016/j.geoderma.2014.02.009
Zhao, H., Zhou, R., Zhang, T., and Zhao, X. (2006). Effects of desertification on soil and crop growth properties in Horqin sandy cropland of Inner Mongolia , north China. Soil Tillage Res. 87, 175–185. doi:10.1016/j.still.2005.03.009
Zheng, S., Lourenço, S. D. N., Cleall, P. J., and Ng, A. K. Y. (2019). Erodibility of synthetic water repellent granular materials: Adapting the ground to weather extremes. Sci. Total Environ. 689, 398–412. doi:10.1016/j.scitotenv.2019.06.328
Keywords: field capacity, silt, soil hydrophobicity, soil organic carbon, vegetation cover
Citation: Mao J, Li Y, Zhang J, Zhang K, Ma X, Wang G and Fan L (2022) Organic carbon and silt determining subcritical water repellency and field capacity of soils in arid and semi-arid region. Front. Environ. Sci. 10:1031237. doi: 10.3389/fenvs.2022.1031237
Received: 29 August 2022; Accepted: 07 November 2022;
Published: 24 November 2022.
Edited by:
Elena Bresci, University of Florence, ItalyReviewed by:
Demetrio Zema, Mediterranea University of Reggio Calabria, ItalyLubomir Lichner, Slovak Academy of Sciences, Slovakia
Copyright © 2022 Mao, Li, Zhang, Zhang, Ma, Wang and Fan. This is an open-access article distributed under the terms of the Creative Commons Attribution License (CC BY). The use, distribution or reproduction in other forums is permitted, provided the original author(s) and the copyright owner(s) are credited and that the original publication in this journal is cited, in accordance with accepted academic practice. No use, distribution or reproduction is permitted which does not comply with these terms.
*Correspondence: Lianlian Fan, ZmxpYW5saWFuQG1zLnhqYi5hYy5jbg==
 Jiefei Mao
 Yaoming Li
 Junfeng Zhang1,2,3
 Kun Zhang
 Xuexi Ma
 Lianlian Fan