 Jocelyn Tsai
 Noel Wilson2
 Francis L. de los Reyes
 - 1Department of Civil, Construction, and Environmental Engineering, North Carolina State University, Raleigh, NC, United States
- 2Catapult Design, Sanford, NC, United States
Pit latrines as the primary means of sanitation for billions of people. Fecal sludge must be removed regularly when pit latrines fill up, and the workers who empty these latrines are essential service providers. Pit latrine emptying services and approaches are highly variable, ranging from highly trained teams using vacuum trucks with a suite of personal protective equipment to individuals with no protection using simple manual tools like buckets and shovels. While national governments and nonprofits endeavor to make pit latrine emptying safer, the people making day-to-day decisions such as local pit emptying associations, sanitation businesses, utilities, and local governments have limited resources to evaluate how different emptying practices vary in terms of risk. In this paper we describe the development of an open-source Illustrated System Analysis tool for the fecal sludge management community. This tool can be used in conjunction with a simple risk assessment matrix to help decision makers describe, compare, and prioritize risks for mitigation. We demonstrate this process by outlining how a pit emptying team can compare mechanical and manual emptying with respect to ingestion of fecal material and inhalation of fecal bioaerosols. Illustrated System Analysis can be a tool to analyze fecal sludge management systems, and the associated challenges and opportunities so that they could be understood and referenced by the wider public and used to spark innovation. We provide a library of graphics freely under creative commons.
1 Introduction
Nearly 1.8 billion people around the world depend on pit latrines as the primary means of sanitation (Graham and Polizzotto, 2013). It is estimated that there are nearly 772 million onsite sanitation facilities (pit latrines and septic tanks) around the world (Greene et al., 2021), and these need regular desludging for regular maintenance and to increase the lifetime of the pit (Mubatsi et al., 2021). The workers that empty latrines and septic tanks provide an essential service while facing several occupational dangers. Pit latrine emptiers in India expressed that they face hazards such as direct contact with fecal sludge, exposure to noxious gases and chemicals, and risk of injury (Gautam et al., 2021). The materials that sanitation workers handle harbor a range of waterborne bacterial, viral, and parasitic pathogens (World Health Organization, 2018), and antimicrobial resistance and multidrug resistant strains have been found in these pits (Beukes et al., 2022).
For individuals and small entities that provide sanitation services, it can be difficult to decide how to adjust current practices, especially if resources are tight. Often the service providers have limited funds to purchase necessary equipment or tools (Gautam et al., 2021). In addition, there is a wide variety of pit latrine emptying practices. An estimated 32% of pits are emptied mechanically via pumps and trucks and 50% are emptied through non-mechanized means (Greene et al., 2021). Practices are affected by pit contents (including improperly disposed trash), accessibility of the pit, sludge thickness, transport options, costs, regulations, and resources available to a given emptying team (Gurksi et al., 2022). The marginalized status of pit emptiers leads to the informal nature of labor; this in turn contributes to non-uniformity and lack of standardization in the profession (Gautam et al., 2021).
The World Health Organization’s (WHO) guidelines on sanitation safety (World Health Organization, 2015) emphasize the importance of identifying hazards and hazard events and assessing and prioritizing exposure risks. The WHO described three different approaches to evaluating risk, with the most complex being quantitative methods such as Quantitative Microbial Risk Assessment (QMRA). QMRA involves hazard identification, dose-response assessment, and risk characterization to estimate an adverse health outcome from pathogen exposure (Haas, 2020). While there are QMRA based studies that have looked at risks of subprocesses in pit latrine emptying, these studies use a more data- and resource-intensive process; getting appropriate and reliable data (e.g., video data or counts of facial touches) can be expensive and time consuming (Bischel et al., 2019; Sklar et al., 2021). Organizations such as pit emptying associations, local governments, or businesses might not have the in-house expertise to carry out these studies (World Health Organization, 2015).
The WHO identifies two additional, more feasible approaches. The first is a team-based descriptive risk assessment, where a sanitation team collectively judges a hazardous event and qualitatively classifies activities as high, medium, low or uncertain risk (World Health Organization, 2015). There are already resources that guide teams to consider relative hazards and degree of these hazards associated with different sanitation and emptying technologies (Stenström et al., 2011). The second approach is using a semi-quantitative risk assessment method, where a team assigns a likelihood and severity of a hazardous event (World Health Organization, 2015). This use of qualitative methods to characterize hazards is not new; they have been used in the field of occupational hazards when there is little or no information on established exposure limits (Schulte, 2009; Revitt et al., 2021). While both approaches are insightful, they do not clearly give guidance on how to analyze individual steps in the emptying process.
Recently, Gautam et al. (2021) identified a framework for examining the safety of vacuum truck pit emptiers after extensive stakeholder interviews and observations from two separate Indian cities. The framework includes a 55-step desludging process flowchart that starts from when operators leave home and ends with a tank emptier exiting a septic tank after finishing a job. The fine detail of the flowchart helps stakeholders see the individual steps involved with emptying. We propose that these granular process maps can be improved with illustrations and a qualitative risk assessment index. The addition of these two elements can enhance a stakeholder’s ability to model pit latrine emptying and subsequently identify and evaluate risks in individual steps.
Illustrations are a popular, proven, and useful gateway to succinct information and comprehension. Illustrations allow us to define a set of standardized symbols to allow people to quickly communicate ideas (Ashwin, 1984). Microbiologists, for example have been using animations to illustrate complex processes and illustrate hypotheses. This has been particularly useful in surfacing differences among researchers in their understanding of how different molecular processes occur (Iwasa, 2022). Illustrations can also play a key part in conveying information and discoveries to non-experts, helping audiences with diverse backgrounds and goals quickly understand and discuss information (McGill, 2022). Illustrations are powerful tools that overcome language barriers and deliver a large amount of information (Leach, 2022), and spur new observations, ideas and thinking even for those already familiar with the process (McGill, 2022).
An Illustrated System Analysis involves identifying the stakeholders, tools, and processes and illustrating how system elements interact with one another. An Illustrated System can then be paired with a risk assessment matrix, which allows decisions for how activities can be prioritized for further research or mitigation (Revitt et al., 2021). We demonstrate how Illustrated System Analysis can be applied to identifying health risks during pit latrine emptying from indirect ingestion of fecal material via facial contact and inhalation of fecal bioaerosols.
2 Materials and methods
2.1 Creation of illustrated systems for pit emptying
The first step of Illustrated System Analysis is visually depicting individual elements of the emptying process. The illustrations are assembled in a storyboard to describe how stakeholders, tools, and processes interact with one another. Based on direct observations of pit emptiers in Zambia, Kenya, Tanzania, and India, we developed illustrations for three different fecal sludge removal processes and scenarios:
2.1.1 Scenario 1: Manual emptying with proper disposal
Fecal sludge and trash from a pit latrine are removed with manual tools into a barrel and transported to a treatment facility for proper disposal. Five operators and one driver are part of the process. Data were collected in Lusaka, Zambia in 2017 by taking and analyzing photographs and videos and conducting stakeholder interviews of the pit latrine emptying process. Two manual pit latrine emptying teams with the Lusaka Water and Sewerage Company were observed, including the tools used, protective measures taken by personnel, and their interactions with the homeowners.
2.1.2 Scenario 2: Vacuum truck emptying with proper disposal
Fecal sludge is removed using a vacuum truck and transported to a waste treatment facility for proper disposal. At the end of the day, the outside of the vacuum truck is also cleaned. Three operators and one driver are part of the process. The research team collected data in Kisumu, Kenya in 2018 by observing pit emptying with vacuum trucks with the Kisumu Water and Sanitation Company Limited (KIWASCO).
2.1.3 Scenario 3: Vacuum truck emptying interrupted by a clog with improper disposal
This scenario shows operators emptying a pit where trash clogs are removed in the middle of latrine emptying, based on field observations in Kisumu, Kenya and outside Dar es Salaam, Tanzania. This scenario also shows steps that happen if the fecal sludge is improperly disposed in an open field, a process seen when there is a lack of supporting sanitation infrastructure, as was noted in field observations outside Bangalore, India.
The storyboards were developed based on field observations. Each scenario had time assigned to each individual step informed by time motion data recorded in Zambia and Kenya and are in line with previously reported pit latrine emptying time motion data (Rutayisire et al., 2022).
2.2 Qualitative risk scores
The illustrations and storyboards were used to guide the qualitative assessment of risk to workers based on exposure to aerosol inhalation and fecal ingestion at each step of the emptying process. Risk scores were estimated for each step in the emptying process using the equation:
Where R = risk index.
M = magnitude, rated on a scale of 1–4, based on how potentially dangerous an undesired event is, with 1 as “negligible”, 2 as “marginal”, 3 as “critical”, and 4 as “high”.
L = likelihood, rated on a scale of 1–5 based on how many opportunities are there for the undesired event to occur, with 1 as “minimal”, 2 as ‘marginal”, 3 as “some opportunities”, 4 as “several opportunities”, and 5 as “maximum opportunities”.
M and L ratings were qualitatively assessed based on the field observations in Zambia, Kenya, Tanzania, and India. Considerations for assigning values included our evaluation of answers to questions (in the context of fecal ingestion and aerosol inhalation) such as: How much cognitive load is involved with the activity (e.g., higher cognitive load, lower rating)? How active are the workers’ hands? How far along are the workers in the emptying process? How close are the workers to open fecal sludge? How much direct contact with fecal sludge is involved? How much mechanical disturbance is occurring in the process?
Multiplying the M and L ratings resulted in a Risk Score for the undesired event, with 1–4 as “very low”, 5–8 as “low”, 9–12 as “medium”, and 15–20 as “high”.
3 Results
3.1 Illustrated systems
The data informed the creation of a list of all individual elements of the system (Figure 1); these elements were used to construct a storyboard to describe manual pit latrine emptying. All illustrations are available under creative commons CC-BY license.
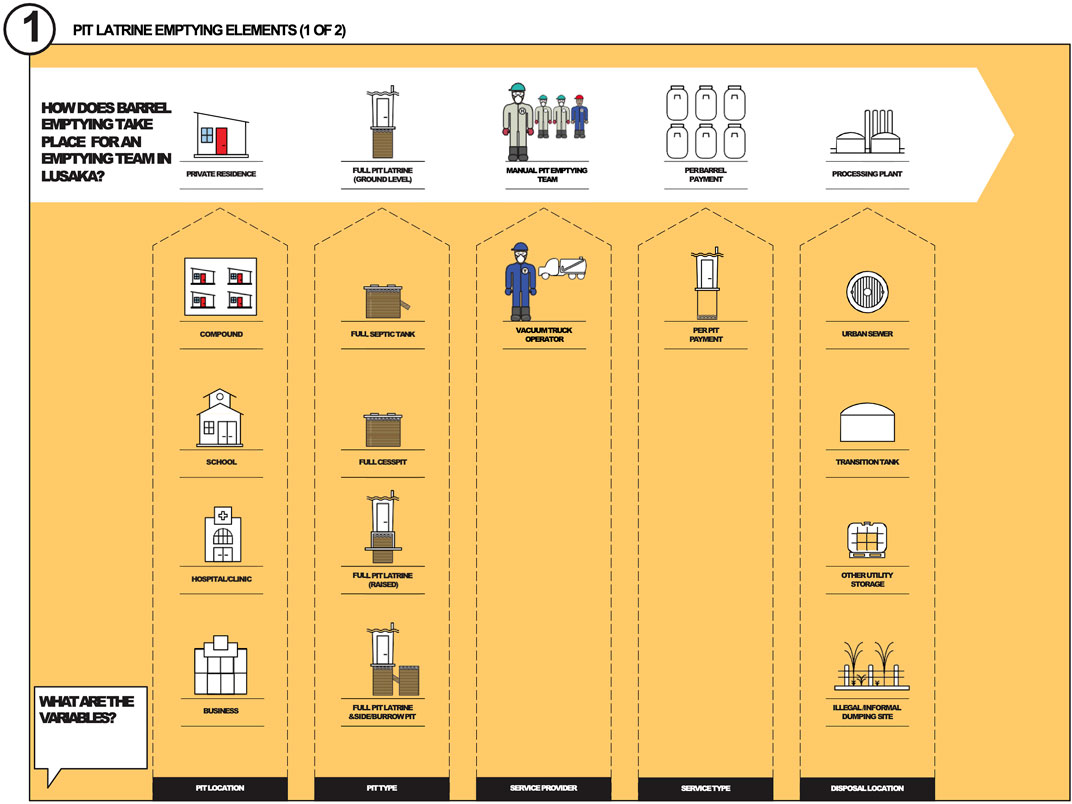
FIGURE 1. Excerpt of pit latrine emptying elements in manual pit latrine emptying. See Supplementary Material for the complete set.
3.1.1 Scenario 1: Manual emptying with proper disposal
The manual emptying storyboard describes teams loading emptying equipment at the headquarters, interfacing with customers, and preparing fecal sludge removal at the site. Fecal sludge removal includes opening the pit latrine, collecting fecal sludge and trash into barrels, transporting barrels to a centralized wastewater treatment plant, and disposing fecal sludge and trash at the treatment center (Figure 2).

FIGURE 2. Excerpt of manual emptying with proper disposal. See Supplementary Material for the complete set. The panel labels correspond to the chronological labels used in the complete set.
3.1.2 Scenario 2: Vacuum truck emptying with proper disposal. Operator does not enter the truck for cleaning
This storyboard included new elements such as a vacuum truck to describe vacuum truck emptying, starting from putting on personal protective equipment, loading necessary equipment of the truck, travelling to the customer site, preparing pit emptying by removing the lid, starting a vacuum filling the vacuum truck, and then traveling to a wastewater treatment facility for proper sludge disposal (Figure 3).
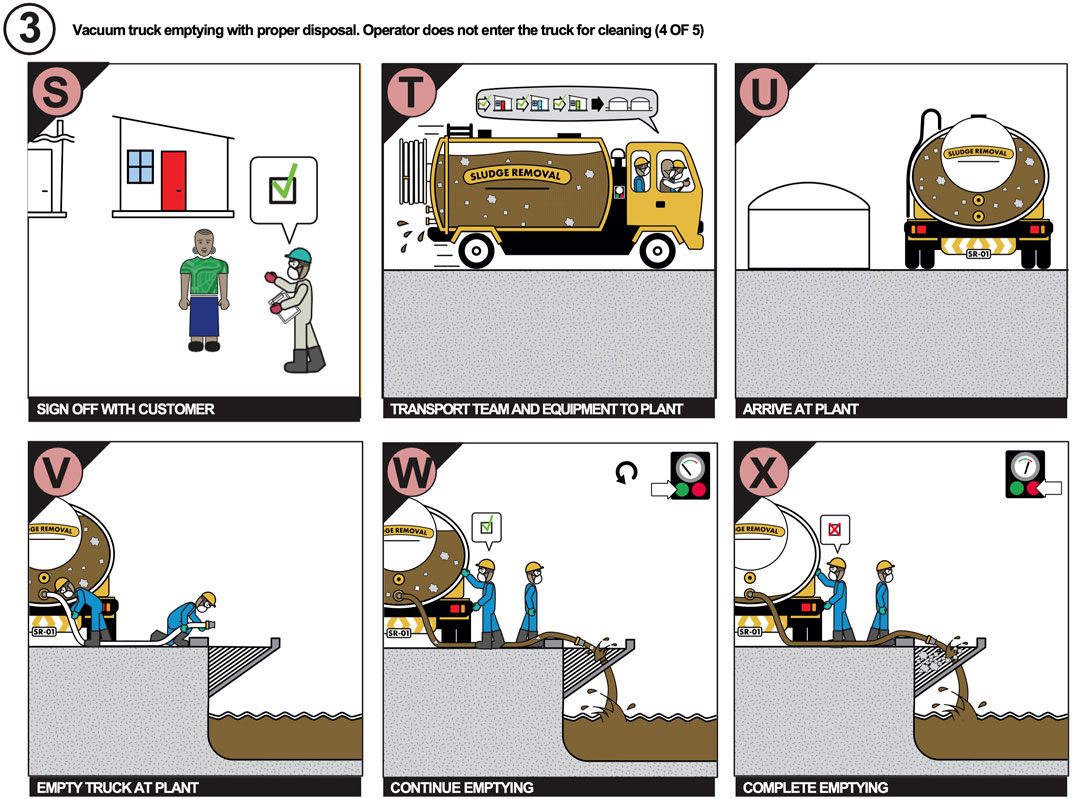
FIGURE 3. Excerpt of vacuum truck emptying with proper disposal. Operator does not enter the truck for cleaning. See Supplementary Material for the complete set. The panel labels correspond to the chronological labels used in the complete set.
3.1.3 Scenario 3: Vacuum truck emptying interrupted by a clog with improper disposal. Operator enters the truck for cleaning
Trash improperly disposed in latrines and septic tanks often interferes with mechanical emptying. The storyboard includes steps needed for unclogging (Figure 4). Sometimes sludge is disposed improperly in an open field instead of a treatment facility. This illustrated set also shows the process of fully cleaning a vacuum truck by having a worker enter the tank.
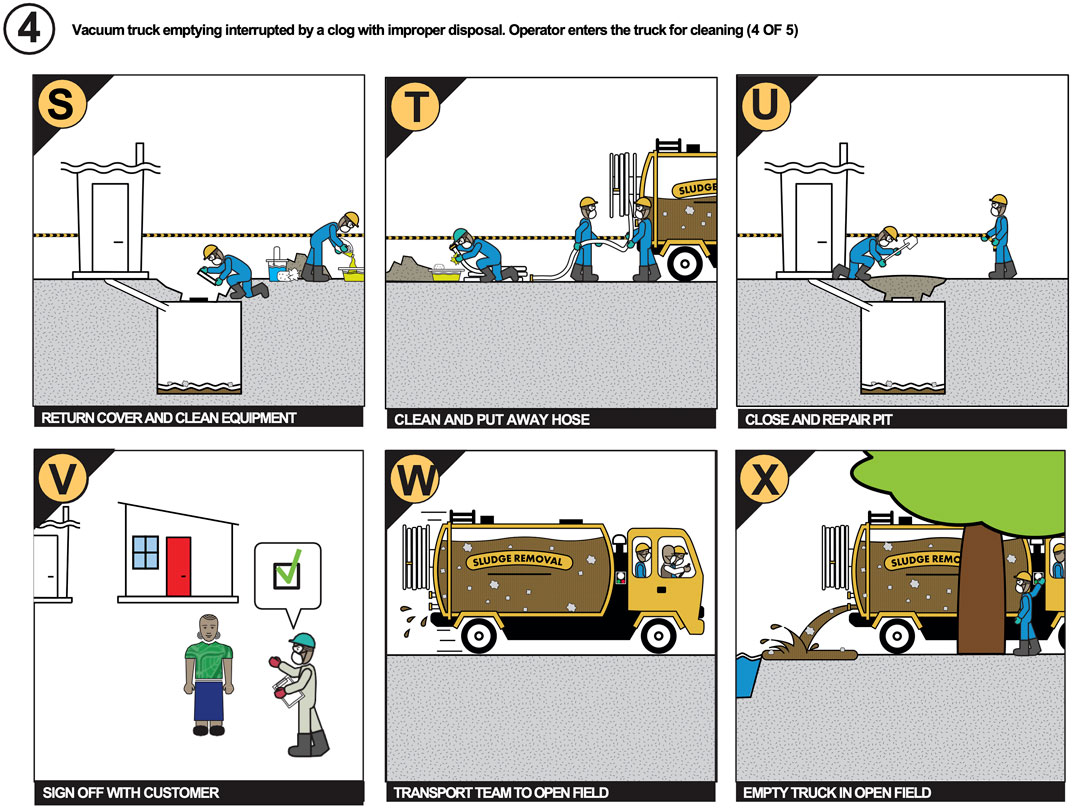
FIGURE 4. Excerpt of vacuum truck emptying interrupted by a clog with improper disposal. Operator enters the truck for cleaning. See Supplementary Material for the complete set. The panel labels correspond to the chronological labels used in the complete set.
3.2 Qualitative risk analysis
3.2.1 Scenario 1: Manual emptying with proper disposal
Manual pit latrine emptying is one of the messiest processes as emptier are handling tools to directly remove trash and fecal sludge in the pit (Supplementary Table S1, steps J-L). However, this process tends to require a lot of physical and cognitive load, making the likelihood of facial touches low. In this illustrated scenario, we see that the higher score activities are when workers have contaminated hands but are relatively idle (Table 1), with the highest score after workers have completed emptying and are relatively inactive as they are signing off with the customer and transporting barrels of fecal sludge to the treatment plant.
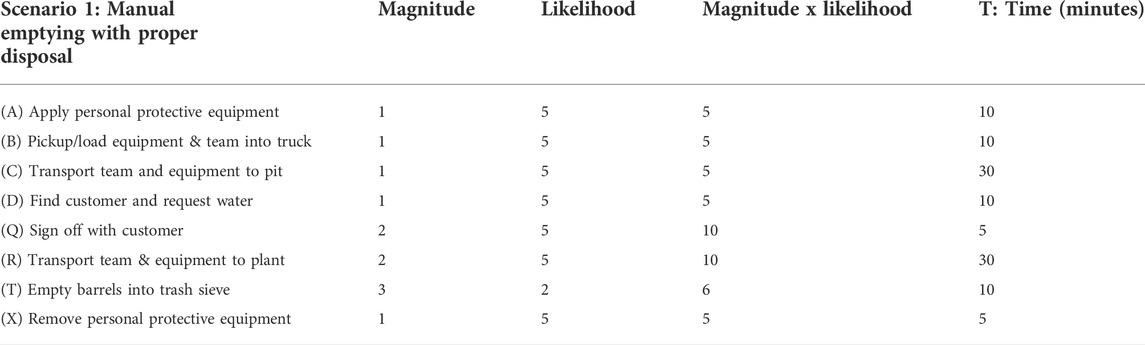
TABLE 1. Scenario 1, Excerpt of facial touch risk scores for manual emptying with proper disposal. Solid lines between rows denotes to a break in steps. See Supplementary Material for the complete set.
Fecal aerosols are most likely generated during the pit emptying process (Table 2, steps H-M) and when the fecal sludge is transferred at the treatment plant for processing (Table 2, steps T-U). Both processes have workers close to sources of fecal aerosols, and the estimated 98-min process of pit emptying and 40 min disposal of the septage into the facility have the highest risk of inhaling aerosols.
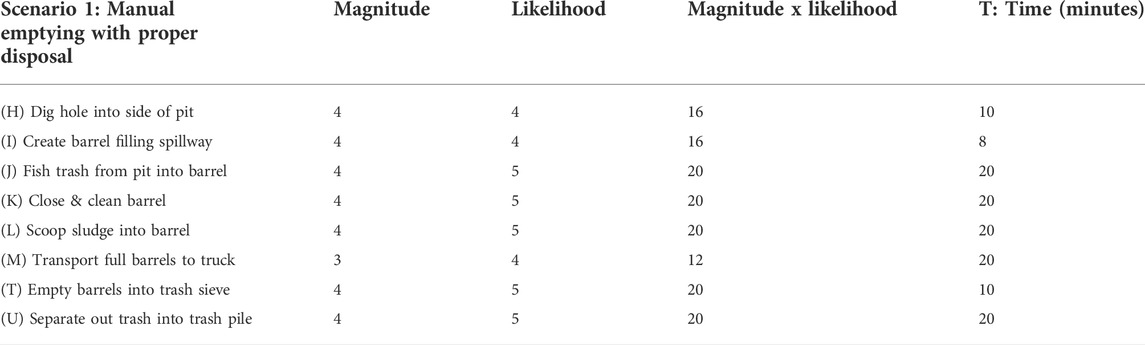
TABLE 2. Scenario 1, Excerpt of fecal aerosol inhalation risk scores for manual emptying with proper disposal. Solid lines between rows denotes to a break in steps. See Supplementary Material for the complete set.
3.2.2 Scenario 2: Vacuum truck emptying with proper disposal
Here, ingestion through indirect touches have a higher score when workers have completed pit latrine emptying and are in transit to the treatment plant (Table 3, steps S-U). With respect to aerosols the activities with the highest risk are when workers are inserting the hose for emptying (Table 4, steps I-Q) and when the workers are releasing septage into the treatment plant (Table 4, steps V-Z). Emptying takes about 1 h and the release of septage from the truck takes about 55 min.
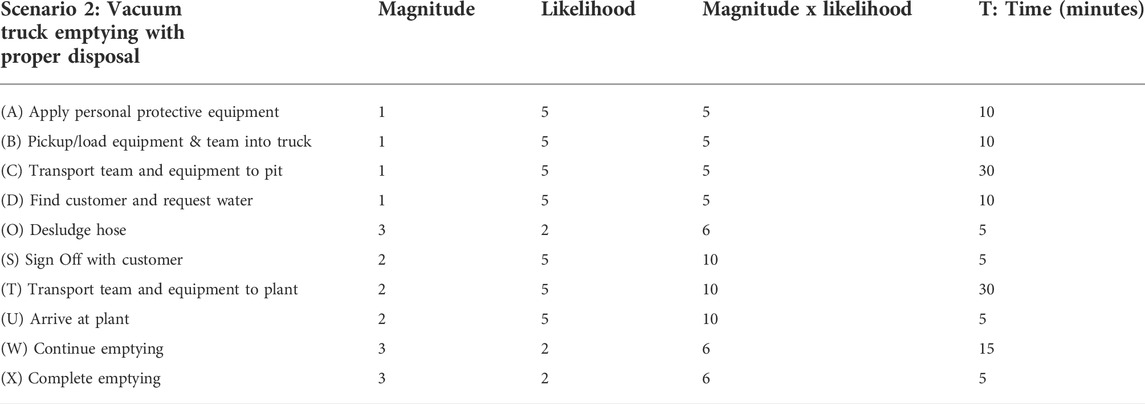
TABLE 3. Scenario 2, Excerpt of facial touch risk scores for vacuum truck emptying with proper disposal. Operator does not enter the truck for cleaning. Solid lines between rows denotes to a break in steps. See Supplementary Material for the complete set.
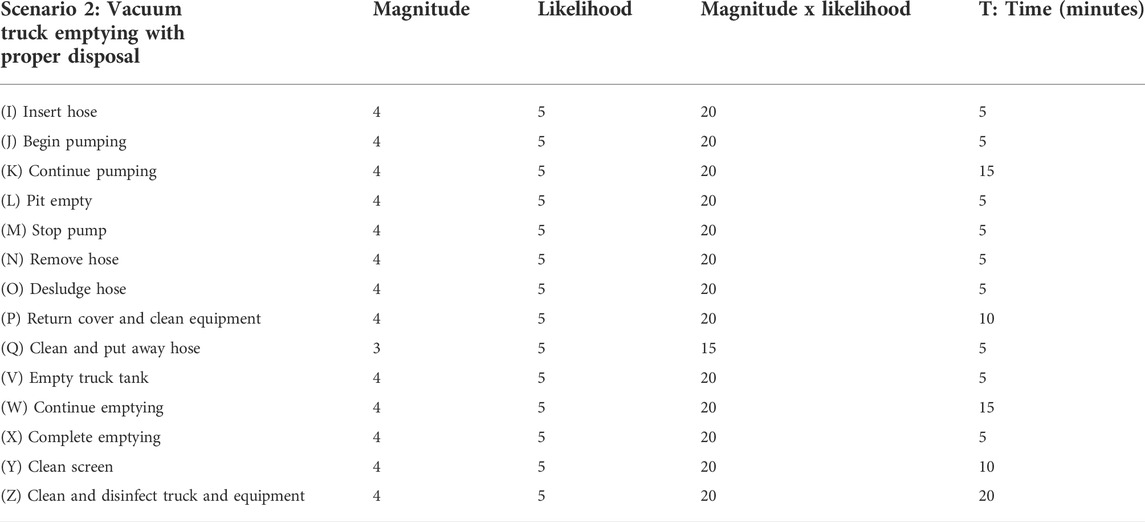
TABLE 4. Scenario 2, Excerpt of fecal aerosol inhalation risk scores for vacuum truck emptying with proper disposal. Operator does not enter the truck for cleaning. Solid lines between rows denotes to a break in steps. See Supplementary Material for the complete set.
3.2.3 Scenario 3: Vacuum truck emptying interrupted by a clog with improper disposal
With respect to indirect touches leading to ingestion of feces, emptying septage into an open field (Table 5, steps W-X) has a slightly elevated risk profile compared to emptying into a treatment facility (Table 3, steps W-X), as the act of emptying septage into a field has less cognitive load than emptying into a wastewater treatment plant.
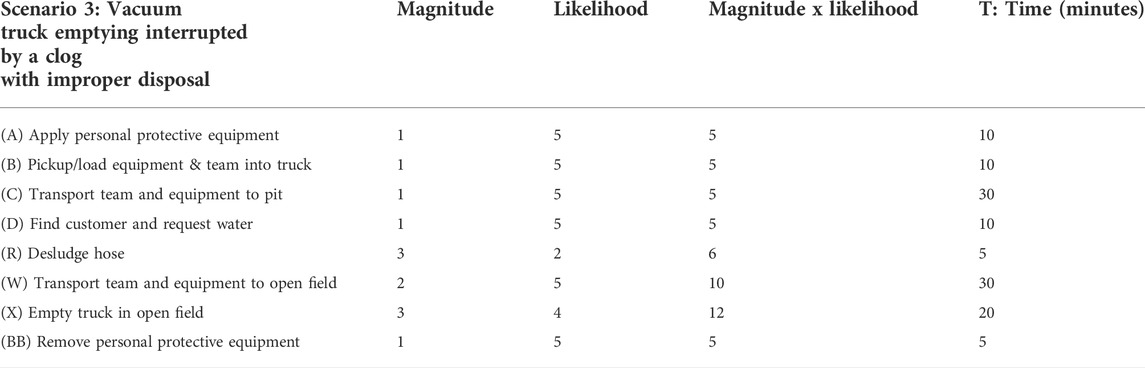
TABLE 5. Scenario 3. Excerpt of facial touch risk scores for vacuum truck emptying interrupted by a clog with improper disposal. Solid lines between rows denotes to a break in steps. Operator enters the truck for cleaning. See Supplementary Material for the complete set.
Managing clogs in hoses adds more time to the pit emptying process, creating more opportunities for fecal aerosols. The emptying process (Table 6, steps I-T) is estimated at 95 min, on par with pit latrine emptying in this scenario (Supplementary Table S2, steps H-M). Emptying the septage into an open field and spending time to clean inside the truck also exposes emptiers to fecal aerosols for longer periods (Table 6, steps X-Z).
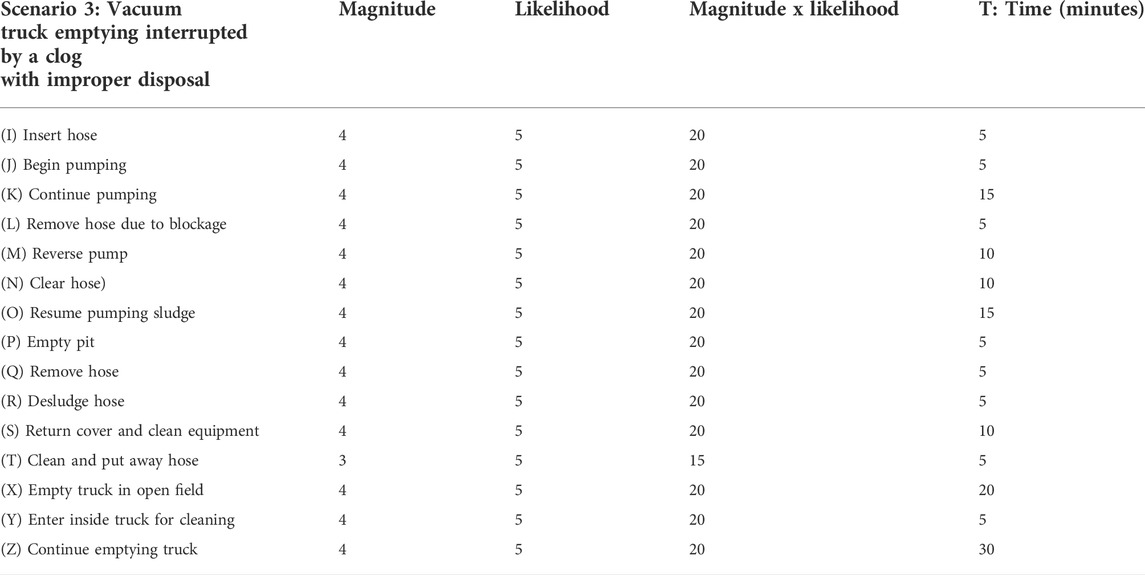
TABLE 6. Scenario 3, Excerpt of fecal aerosol inhalation risk scores for vacuum truck emptying interrupted by a clog with improper disposal. Operator enters the truck for cleaning. Solid lines between rows denotes to a break in steps. See Supplementary Material for the complete set.
4 Discussion
An illustrated system analysis has the same intent as an infographic—to clarify communication and improve information access—but goes deeper to create detailed visual communication of complexities and nuances of a system. A system analysis can have many branches of information and can zoom in and out of scale, depending on a design focus, budget, and time. Thus, one can use an illustrated system to add detail at any level and focus on a particular target of emphasis. In this study, we use the illustrated system to qualitatively analyze health risks to pit emptying workers, showing how the approach can be adjusted to fit a variety of scenarios. The mere exercise of putting together an illustration of the sanitation system along with establishing a rubric to examine exposure pathways of interest allows stakeholders to think through assumptions and mechanisms. It may highlight important steps, allowing groups to consider different design or operational approaches to safety interventions.
Here we examine the pathways of fecal aerosols and indirect ingestion via facial touches. While ingestion of feces can occur directly during pit latrine emptying, the mechanism can be subtle such as through face touches around perioral regions. There has also been recent attention towards the possibility of ingestion through fecal aerosols. Pit latrine emptiers in Malawi have been estimated to accidentally consume up to 0.4 g of feces a year through pit latrine emptying activities and inhale up to 6 g a year (Kumwenda et al., 2017). The estimated exposure dose of grams of fecal material along with dosage of Ascaris, Taenia, hookworms, E. coli, and Salmonella have been reported (Kumwenda et al., 2017).
Qualitative estimates on the likelihood of ingesting feces in different pit latrine emptying processes have been described (Stenström et al., 2011), but do not indicate steps that are more prone to these more indirect routes. As an emptier works along the emptying process, the presence of fecal indicators such as Staphylococcus aureus and E. coli on work and household surfaces (i.e., walkways between pit latrines and handles on municipal vehicles) increases (Beukes and Schmidt, 2022). Wearing gloves does not always prevent hand contamination. In one study of pit latrine emptiers in Rwanda, hands were contaminated with E. coli nearly 2.5 × 10²–4.8 × 10³ CFU/hand after mechanically collecting waste despite wearing gloves (Sklar et al., 2021).
While the amount of fecal material on hands increases over the emptying process, the material needs to be transferred into the mouth for accidental ingestion. Touching of mucosal layers can occur frequently; when attending a lecture, students were found to have touched their face an average of 23 times per hour with 44% of them touching membranes such as the mouth (Kwok et al., 2015). While the frequency of face touches varies between individuals (Bischel et al., 2019), there is evidence indicating that hand touches are tied to cognitive load and activity level of hands. When people are asked to drive in conditions that require high physical and cognitive load, drivers had an average of 4.4 face touches an hour (FT/h). Under low cognitive load driving conditions there were 26.1 face touches with a large range in individual behaviors (anywhere between 5.1 and 90.7 FT/h) (Ralph et al., 2022). Facial touches decrease when people are asked to do activities that require active hands such as performing a small home improvement project versus a more passive activity such as listening to music (Lewis et al., 2021). Under video recording, sanitation workers who collected urine containers had relatively rare hand-mouth contact during collection while gloved, but after glove removal had facial touches 0.3 ± 0.7 times per hour during urine collection (Bischel et al., 2019). As with gloves, face masks do not completely mitigate accidental exposures. Under video observation, sanitation workers had approximately 13 ± 8 times per hour hand-to-face mask touches, and thus inappropriate removal of PPE was included in models for infection risk for accidental exposure in urine collection and struvite production (Bischel et al., 2019).
Fecal aerosols have been reported in wastewater treatment plants, generated mainly through mechanical agitation such as splashing and aeration (Sánchez-Monedero et al., 2008). In wastewater bioaerosols, pathogens such as Acinetobacter, Pseudomonas, and Micrococcus have been detected, with long-term exposure having the potential to lead to chronic diseases (Yang et al., 2019). Recently, fecal based microbial genes were found in the bioaerosols in LMIC settings with inadequate sanitation infrastructure (Ginn et al., 2022). However, few of these studies measured viability, and even fewer studies connect pathogen viability to enteric pathogen exposure (Ginn et al., 2022).
There is evidence that pit latrine emptying activities can create bioaerosols; in one study of mechanical emptying, nearly 350 CFU m−3 for E. coli and 790 CFU m−3 for total coliforms were detected in air near pits being emptied, including the enterotoxigenic strain of E. coli (Farling et al., 2019). In our analysis, we directly relate the amount of mechanical disturbance in the process to higher production of bioaerosols, and inversely relate higher concentrations of aerosolized fecal indicator organisms to distance. Enteric pathogens can be found within 1 km of open wastewater canals in cities with poor sanitation (Ginn et al., 2021). Sampling of bioaerosols shows that fecal indicators are at higher concentrations within 10 m of open wastewater canals than distances greater than 10 m away (Rocha-Melogno et al., 2020).
Our analysis led to specific recommendations that in hindsight may be obvious; however, the illustrated systems highlight and clearly communicated these risks to workers. Example interventions include additional training on minimizing facial touches (when idle, or doing routine work that has low cognitive load). Cleaning hands should be emphasized, but especially in the context of going in and out of vehicles, such as the ride back from the emptying site. As hands and PPE are likely to be more contaminated over time, emptying teams should take care to properly remove PPE and properly disinfect hands and clothes prior to entering and leaving the transporting truck. Reducing mechanical disturbance of the sludge during the emptying process can help mitigate fecal aerosol production. This is of particular concern at not only the pit latrine emptying site but also the site of dumping. PPE such as masks should be seen as necessities and not simply for virtue signaling.
The framework we described here can be applied to a range of possible improvements within the sanitation system. The emptying team can visualize and consider the health and safety of workers using typical or new technologies for emptying pit latrines, such as the Gulper (e.g., Thye et al., 2011; Balasubramanya et al., 2016), a pedal-powered Gulper (Chipeta et al., 2017), a screw auger (Rogers et al., 2014; Sisco et al., 2017); and a trash excluder (Portiolli et al., 2021). By developing new illustrations (frames or “cards”) specific to these technologies and re-using the current illustrations, new storyboards can be developed. The framework could also assist examining how to make pit latrine emptying safer from an ergonomic perspective, such as how workers lift, twist, and transfer equipment and collected sludge (Bleck and Wettberg, 2012). Illustrations can also show how pit latrine emptying and its different approaches could contribute to fecal contamination of nearby soils (Pickering et al., 2012). The illustrations can be used for multiple functions: documenting team learnings, clarifying internal and external communication, decreasing onboarding/learning time, and expediting comprehension. These could lead to savings in consulting budgets and help in creating a multi-use library of visual assets (applicable from manuals to infographics to annual reports). The process of creating an illustrated system analysis inherently teaches the co-creators a deep understanding of the system and raises expectations of team comprehension and alignment.
The fecal sludge management (FSM) sector can take advantage of illustrated system analysis, by clearly communicating nuanced FSM systems so that they could be comprehensible to and referenced by a much larger audience and used to spark innovation. We recognize the benefit that this library of graphics can provide for the public and make it freely available via CC-BY. Free and open-source software can be used by the public to adapt or generate their own diagrams and make their own scenarios.
5 Conclusion
Illustrated systems have multiple functions that can help the FSM sector. As tools for analysis, communication, comprehension, and aligning team values and objectives, illustrated systems are useful and have potential impact. In this study, we show how using Illustrated System Analysis and combining this with qualitative risk analysis can allow pit emptying teams to more clearly and quickly evaluate the different levels of risks associated with the different steps of their specific pit emptying process. We provide a freely available library of graphics that the FSM community can use and disseminate widely.
Data availability statement
The original contributions presented in the study are included in the article/Supplementary Material, further inquiries can be directed to the corresponding author.
Author contributions
JT: investigation, conceptualization, methodology, and writing; NW: conceptualization, investigation, methodology, and visualization. FD: conceptualization, formal analysis, funding acquisition, investigation, methodology, supervision, writing, and editing.
Funding
This work was supported, in whole or in part, by the Bill & Melinda Gates Foundation [OPP1094923]. Under the grant conditions of the Foundation, a Creative Commons Attribution 4.0 Generic License has already been assigned to the Author Accepted Manuscript version that might arise from this submission.
Acknowledgments
We thank pit latrine emptying teams Lusaka Water and Sewerage Company in Lusaka, Zambia, KIWASCO in Kisumu, Kenya for allowing our research team to observe pit latrine emptying. We also thank Tate Rogers (Triangle Environmental), Dr. Nicola Greene (Triangle Environmental) and Payan Ole-moiyoi (Catapult Design) for giving critical feedback on the initial illustrations generated.
Conflict of interest
NW was employed by the company Catapult Design.
The remaining authors declare that the research was conducted in the absence of any commercial or financial relationships that could be construed as a potential conflict of interest.
Publisher’s note
All claims expressed in this article are solely those of the authors and do not necessarily represent those of their affiliated organizations, or those of the publisher, the editors and the reviewers. Any product that may be evaluated in this article, or claim that may be made by its manufacturer, is not guaranteed or endorsed by the publisher.
Supplementary material
The Supplementary Material for this article can be found online at: https://www.frontiersin.org/articles/10.3389/fenvs.2022.1033877/full#supplementary-material
References
Balasubramanya, S., Evans, B., Ahmed, R., Habib, A., Asad, N. S. M., Vuong, L., et al. (2016). Pump it up: Making single-pit emptying safer in rural Bangladesh. J. Water Sanit. Hyg. Dev. 6, 456–464. doi:10.2166/washdev.2016.049
Beukes, L. S., and Schmidt, S. (2022). Manual emptying of ventilated improved pit latrines and hygiene challenges - a baseline survey in a peri-urban community in KwaZulu-Natal, South Africa. Int. J. Environ. Health Res. 32, 1043–1054. doi:10.1080/09603123.2020.1823334
Bischel, H. N., Caduff, L., Schindelholz, S., Kohn, T., and Julian, T. R. (2019). Health risks for sanitation service workers along a container-based urine collection system and resource recovery value chain. Environ. Sci. Technol. 53, 7055–7067. doi:10.1021/acs.est.9b01092
Bleck, D., and Wettberg, W. (2012). Waste collection in developing countries – tackling occupational safety and health hazards at their source. Waste Manag. 32, 2009–2017. doi:10.1016/j.wasman.2012.03.025
Chipeta, W. C. C., Holm, R. H. H., Kamanula, J. F. F., Mtonga, W. E. E., and de los Reyes, F. L. (2017). Designing local solutions for emptying pit latrines in low-income urban settlements (Malawi). Phys. Chem. Earth Parts A/B/C 100, 336–342. doi:10.1016/j.pce.2017.02.012
Farling, S., Rogers, T., Knee, J. S., Tilley, E. A., Brown, J., and Deshusses, M. A. (2019). Bioaerosol emissions associated with pit latrine emptying operations. Sci. TOTAL Environ. 648, 1082–1086. doi:10.1016/j.scitotenv.2018.08.147
Gautam, M., Wankhade, K., Sarangan, G., and Sudhakar, S. (2021). Framework for addressing occupational safety of de-sludging operators: A study in two Indian cities. J. Environ. Manage. 289, 112243. doi:10.1016/j.jenvman.2021.112243
Ginn, O., Lowry, S., and Brown, J. (2022). A systematic review of enteric pathogens and antibiotic resistance genes in outdoor urban aerosols. Environ. Res. 212, 113097. doi:10.1016/j.envres.2022.113097
Ginn, O., Rocha-Melogno, L., Bivins, A., Lowry, S., Cardelino, M., Nichols, D., et al. (2021). Detection and quantification of enteric pathogens in aerosols near open wastewater canals in cities with poor sanitation. Environ. Sci. Technol. 55 (21), 14758–14771. doi:10.1021/acs.est.1c05060
Graham, J. P., and Polizzotto, M. L. (2013). Pit latrines and their impacts on groundwater quality: A systematic review. Environ. Health Perspect. 121, 521–530. doi:10.1289/ehp.1206028
Greene, N., Hennessy, S., Rogers, T. W., Tsai, J., and de los Reyes, F. L. (2021). The role of emptying services in provision of safely managed sanitation: A classification and quantification of the needs of LMICs. J. Environ. Manage. 290, 112612. doi:10.1016/j.jenvman.2021.112612
Gurksi, T., Hennessy, S., Rogers, T., and Shaw, J. (2022). A practical guide to available pit-emptying technologies. FSM Alliance Available at: https://fsm-alliance.glueup.com/event/fsma-spotlights-a-practical-guide-to-available-pit-emptying-technologies-48207/ (Accessed August 20, 2022).
Haas, C. N. (2020). Quantitative microbial risk assessment and molecular biology: Paths to integration. Environ. Sci. Technol. 54, 8539–8546. doi:10.1021/acs.est.0c00664
Iwasa, J. H. (2022). Using animation to mediate scientific discourse. Nat. Microbiol. 7, 3. doi:10.1038/s41564-021-01024-5
Kumwenda, S., Msefula, C., Kadewa, W., Ngwira, B., and Morse, T. (2017). Estimating the health risk associated with the use of ecological sanitation toilets in Malawi. J. Environ. Public Health 2017, 1–13. doi:10.1155/2017/3931802
Kwok, Y. L. A., Gralton, J., and McLaws, M.-L. (2015). Face touching: A frequent habit that has implications for hand hygiene. Am. J. Infect. Control 43, 112–114. doi:10.1016/j.ajic.2014.10.015
Leach, T. (2022). Scientist or artist? Why not be both? Nat. Microbiol. 7, 4. doi:10.1038/s41564-021-00995-9
Lewis, R. C., Rauschenberger, R., and Kalmes, R. (2021). Hand-to-mouth and other hand-to-face touching behavior in a quasi-naturalistic study under controlled conditions. J. Toxicol. Environ. Health A 84, 49–55. doi:10.1080/15287394.2020.1830457
McGill, G. G. (2022). Knowledge synthesis through scientific visualization. Nat. Microbiol. 7, 185. doi:10.1038/s41564-021-01048-x
Mubatsi, J. B., Wafula, S. T., Etajak, S., Ssekamatte, T., Isunju, J. B., Kimbugwe, C., et al. (2021). Latrine characteristics and maintenance practices associated with pit latrine lifetime in an informal settlement in Kampala, Uganda. J. Water Sanit. Hyg. Dev. 11, 657–667. doi:10.2166/washdev.2021.032
Pickering, A. J., Julian, T. R., Marks, S. J., Mattioli, M. C., Boehm, A. B., Schwab, K. J., et al. (2012). Fecal contamination and diarrheal pathogens on surfaces and in soils among Tanzanian households with and without improved sanitation. Environ. Sci. Technol. 46, 5736–5743. doi:10.1021/es300022c
Portiolli, G. F., Rogers, T. W., Beckwith, W., Tsai, J., ole-MoiYoi, P., Wilson, N., et al. (2021). Development of trash exclusion for mechanized pit latrine emptying. Environ. Sci. Water Res. Technol. 7, 1714–1722. doi:10.1039/D1EW00383F
Ralph, F., Large, D. R., Burnett, G., Lang, A., and Morris, A. (2022). U can’t touch this! Face touching behaviour whilst driving: Implications for health, hygiene and human factors. Ergonomics 65, 943–959. doi:10.1080/00140139.2021.2004241
Revitt, D. M., Lundy, L., and Fatta-Kassinos, D. (2021). Development of a qualitative approach to assessing risks associated with the use of treated wastewater in agricultural irrigation. J. Hazard. Mat. 406, 124286. doi:10.1016/j.jhazmat.2020.124286
Rocha-Melogno, L., Ginn, O., Bailey, E. S., Soria, F., Andrade, M., and Bergin, M. H. (2020). Bioaerosol sampling optimization for community exposure assessment in cities with poor sanitation: A one health cross-sectional study. Sci. Total Environ. 738, 139495. doi:10.1016/j.scitotenv.2020.139495
Rogers, T. W., de los Reyes, F. L., Beckwith, W. J., and Borden, R. C. (2014). Power Earth auger modification for waste extraction from pit latrines. J. Water Sanit. Hyg. Dev. 4, 72–80. doi:10.2166/washdev.2013.183
Rutayisire, B., Wolter, D., Kuria, N., and Sklar, R. (2022). Time and motion assessment of pit-emptying operations in Kigali, Rwanda. J. Water Sanit. Hyg. Dev. 12, 16–22. doi:10.2166/washdev.2021.079
Sánchez-Monedero, M. A., Aguilar, M. I., Fenoll, R., and Roig, A. (2008). Effect of the aeration system on the levels of airborne microorganisms generated at wastewater treatment plants. Water Res. 42, 3739–3744. doi:10.1016/j.watres.2008.06.028
Schulte, P. (2009). Qualitative risk characterization and management of occupational hazards: Control banding (CB). Available at: https://www.cdc.gov/niosh/docs/2009-152/pdfs/2009-152.pdf (Accessed August 18, 2022).
Sisco, T., Rogers, T., Beckwith, W., Chipeta, W., Holm, R., Buckley, C. A., et al. (2017). Trash removal methods for improved mechanical emptying of pit latrines using a screw auger. J. Water Sanit. Hyg. Dev. 7, 85–91. doi:10.2166/washdev.2017.106
Sklar, R., Zhou, Z., Ndayisaba, W., Muspratt, A., Fuhrmeister, E. R., Nelson, K., et al. (2021). Risk of adenovirus and cryptosporidium ingestion to sanitation workers in a municipal scale non-sewered sanitation process: A case study from kigali. Rwanda. J. Water Sanit. Hyg. Dev. 11, 570–578. doi:10.2166/washdev.2021.241
Stenström, T. A., Seidu, R., Ekane, N., and Zurbrügg, C. (2011). Microbial exposure and health assessments in sanitation technologies and systems. Stockholm: Stockholm Environment Institute.
Thye, Y. P., Templeton, M. R., and Ali, M. (2011). A critical review of technologies for pit latrine emptying in developing countries. Crit. Rev. Environ. Sci. Technol. 41, 1793–1819. doi:10.1080/10643389.2010.481593
World Health Organization (2018). Guidelines on sanitation and health. Geneva: World Health Organization.
World Health Organization (2015). Sanitation safety planning: Manual for safe use and disposal of wastewater, greywater and excreta. Geneva: World Health Organization.
Keywords: fecal, fecal sludge management, pit latrine emptying, risk assessment, graphics
Citation: Tsai J, Wilson N and de los Reyes FL (2022) Using illustrated system analysis for qualitative risk assessment of emptying of pit latrines. Front. Environ. Sci. 10:1033877. doi: 10.3389/fenvs.2022.1033877
Received: 01 September 2022; Accepted: 03 November 2022;
Published: 16 November 2022.
Edited by:
Neelam Rana, Indian Institute of Technology Bombay, IndiaReviewed by:
Roohollah Rostami, Tarbiat Modares University, IranNiti B. Jadeja, Ashoka Trust for Research in Ecology and the Environment (ATREE), India
Copyright © 2022 Tsai, Wilson and de los Reyes. This is an open-access article distributed under the terms of the Creative Commons Attribution License (CC BY). The use, distribution or reproduction in other forums is permitted, provided the original author(s) and the copyright owner(s) are credited and that the original publication in this journal is cited, in accordance with accepted academic practice. No use, distribution or reproduction is permitted which does not comply with these terms.
*Correspondence: Francis L. de los Reyes III, ZmxkZWxvc3JAbmNzdS5lZHU=