 Wenxia Tong1,2
 Guangke Qin
- 1City University of Macau, Macau, China
- 2Sun Yat-sen University, Guanzhou, China
- 3Economic Department, East China University of Political Science and Law, Shanghai, China
- 4China Special Economic Zone Research Center, Shenzhen University, Shenzhen, Guangdong, China
- 5Shenzhen Institute of Administration, Shenzhen, Guangdong, China
- 6China Medical University, Shenyang, China
This paper decomposes agricultural input factors into labor, land, fertilizer, and farm machinery in 31 provinces of China from 1990 to 2020. This paper analyzes the input factor’s contribution rates to China’s agricultural growth using the stochastic frontier model. The empirical results indicate that the contribution rate of input factors in China’s agricultural growth has weakened, with decreasing contribution rate of labor, an increasing contribution rate of fertilizer and machinery, and decreasing contribution rate of the land year by year. The contribution rate of technological progress is increasing, and there is room for improvement. In addition, technological progress and input factors alternately lead to the time of policy change in China. The research also shows that the prerequisite for promoting rural supply-side reform and achieving sustained agricultural growth is ensuring a stable supply of input factors, focusing on promoting agricultural technological progress.
1 Introduction
Agriculture is becoming more integrated into the world food chain and global climate issues. With technological development, mechanization, increased chemical investment, specialization, and environmental policy changes, the environment, mechanization, and lands are also increasingly influencing agriculture sustainability development. Currently, people have an awareness of promoting sustainable agriculture development. However, the world faces numerous challenges to meet the dual requirements, fitting the food production need, reducing environmental pollution, and simultaneously being sustainable from the agriculture production side, especially for developing countries. In developing countries, due to the backward machinery, farmers have to produce through polluting the environment, such as increasing fertilized investment, straw burning, and disposal of pollution waste, to meet the agriculture production goals. Mulat et al. (2016) evaluated agriculture production, finding that adopting improved seed, family labor, agriculture capital, and manure positively and significantly affected agriculture production. Ullah et al. (2020), Balaji et al. (2022) and Bu et al. (2013) suggested that farmers' adoption of improved technology is shallow in Pakistan, creating a substantial gap between potential and actual crop productivity. Thus, many kinds of literature studies focus on research about how to improve agriculture’s total production, especially in developing countries.
As a significant agricultural country among the developing countries, China applies the technologies and processes to maintain the environment, and economic production is a fundamental approach to promoting sustainable agriculture development globally. As a predominantly agricultural country, China is an essential economic development industry. However, China’s agricultural development has not achieved the expected results in recent years. In 2021, China imported 164,539,000 tons of grain, an increase of 18% over the same period last year. Among them, 96.518 million tons of soybeans were imported, accounting for 58.6% of the total imports, with an import dependency of 85.5%. As the world’s largest food importer, China’s agricultural development is facing a series of problems, such as unreasonable agricultural structure, weak international competitiveness of agriculture, high external dependency, and prevalence of crude development methods. In order to solve the contradiction between sustainable agricultural development and agricultural production and solving the contradiction between sustainable agricultural development and agricultural output, China has proposed to promote the supply-side structural reform of agriculture and promote sustainable agricultural development, which has pointed out the direction for the sustainable development of the agricultural economy in the future. Therefore, in promoting sustainable agricultural development, analyzing the fundamental contributions of various input factors in China’s sustainable agricultural development is of great practical significance and policy reference value for optimizing resource allocation, deepening agricultural reform, and promoting sustainable development of the global environment.
The current research spotlight on agricultural growth in China is the evolution of agricultural productivity. Since the rural reform in 1978, the real growth rate of China’s total agricultural output has increased from 2.5% to 6.7% from 1949 to 1977 (1978–2020). The output growth is mainly attributed to the increase in factor inputs and agricultural productivity (Jitendra, 2022). However, there has been academic controversy over the trend of agricultural growth in China since the mid-1990s (Wang et al., 2013), and applying different productivity models is one of the main reasons for the controversy. The findings are not yet uniform, which makes it difficult for policymakers to make accurate judgments and even design trade-off policy measures.
Based on this controversy, this paper uses data on agricultural input factors at the provincial level in China from 1990 to 2020 in order to clarify the contribution of each input factor and productivity in China’s agricultural growth over the past 30 years and to provide a more convincing academic basis for policy formulation about the importance of technology on sustainable development in agriculture.
Research on agricultural productivity estimation in China currently faces two significant challenges: traditional methods with fixed production function assumptions fail to capture changes in input–output relationships over time due to differences in China’s rural reform policies. Second is the debate on China’s agricultural productivity growth since the late 1990s. Some scholars (Pedroni, 2004; Zhang et al., 2004; Smith et al., 2007; Chivian et al., 2008; Vandebroek et al., 2010; Wang et al., 2014; Wang et al., 2019) and others assert that productivity growth rates peaked in the late 1990s, and then gradually their economic growth points decreased. It follows that accurate estimation of agricultural productivity is a prerequisite for measuring the contribution of each factor in agricultural growth. In the early days, when models were relatively homogeneous, academic studies on agricultural productivity in China were more uniform in their findings. With the birth and application of different productivity models, scholars have seriously disagreed on China’s agricultural productivity changes in the last 30 years. Although these studies differ slightly in selecting samples and variables, the significant difference lies in the choice of models. Different productivity models directly lead to different conclusions, and existing studies rely on a particular model to measure agricultural productivity when choosing a model. However, the agricultural production process is highly complex, and it is difficult for a single model to explain the input–output relationship accurately. Compared with the current literature (Jim et al., 2006; Chang et al., 2008; Chen et al., 2013; Dar and Asif, 2018), we are filling the existing knowledge gaps using 30 years of panel data based on the stochastic frontier model to analyze agriculture’s total green factor from a technology perspective.
The main contributions of this paper are as follows: first, using five classical productivity models and assigning corresponding weights according to the ability of each model to explain the data and to make a comprehensive and accurate estimation of the production function and agricultural productivity; second, using the growth accounting table to quantify and analyze the contribution rate of input factors and technological progress to China’s agricultural sustainable development during 1990–2020s at the provincial level. Third, using 30 years of panel data to scientifically analyze the changes in each factor’s contribution rate to sustainable agricultural development and provide specific policy suggestions for promoting agricultural supply-side reform and global energy economic development. However, this study also has limitations in accessing data. Our research data only access at a provincial level, perhaps differing from the empirical results of the prefecture-level data. The total factor productivity in agriculture at the prefecture-level could be studied in the future.
2 Literature
Analysis of the agriculture sustainable production system was introduced during the 1960s, and the research purpose is to improve production practices and high production. The research aims to improve production practices and high-yielding modern crops (Giannetti et al., 2015). Agriculture sustainable production can reflect economic growth while accounting for the natural resources and environmental conditions and allowing comparison across countries (Farrell, 1957; Liu et al., 2012; Huang et al., 2013; Faridy et al., 2020).
Numerous studies have begun to explore the factors influencing agriculture productivity. Magazzino et al., 2022 employed the cross-sectional dependency method finding that CO2 emissions reduce agricultural productivity in ASEAN countries and renewable energy sources positively contribute to agricultural productivity. At the same time, technological innovation has positively influenced BRICS (Brazil, Russia, India, China, and South Africa) countries to reduce environmental pollution and boost economic development (Khan H et al., 2020), and Michler et al. (2020) has proven that agriculture production significantly relies on those input factors of income, technology, and infrastructure in India. Regarding the effects of land and labor inputs on agricultural production, Khan A et al., 2020 found that increasing labor and labor resources are connected to agricultural production.
There are also many methods to evaluate agriculture’s sustainable production system. Total factor productivity (TFP) is a standard method to assess the sustainability of agricultural production systems (Guadagni and Fileccia, 2009; Donnell, C.J, 2010). Magazzino et al., 2022 primarily used an artificial neural network approach to evaluate productivity in the agricultural sector over the period 2000–2012 for a large set of countries.
For the evaluation of agriculture sustainable production in China, Glauben et al., 2006 staged China’s rural reform from the late 1970s to the early 2000s in five phases for China’s agricultural productivity: 1978–1984, 1985–1989, 1990–1993, 1994–1997, and late 1998. Zhang et al. (2011) A sixth period, beginning in 2004, is further added to examine the impact of Chinese policies on agricultural productivity in a phased manner. The first period (1978–1984) was a transition from a collective system to a family-based farming system, with the main component being the introduction of a family responsibility system that gave farmers the right to control their production after fulfilling government procurement quotas, while the second period (1985–1989) witnessed a two-tier system that included market and planning factors. The government further liberalized the pricing and marketing system for agricultural products, allowing more products to be traded in the market (Fan et al., 2002), such as cereals and cotton. Lin, 1995 discussed the reforms in prices, institutions, and markets in the first two periods. He used traditional production and stochastic frontier functions to evaluate rural policies and measured the contribution of these policies to agricultural growth in China. Using provincial panel data, he found that 47% of the output growth in the first reform phase is due to the implementation of the household contract responsibility system. Many kinds of literature studies affirm the results of the first phase of agricultural reform (McMillan et al., 1989; Fan et al., 2002; Wen and Shi, 1993; Fan et al., 2004). However, most scholars believe that Chinese agriculture productivity growth slowed down significantly in the second phase after experiencing rapid growth and attribute the stagnation of agricultural growth to the slowdown of agricultural productivity growth. For example, according to Carter and Estrin, 2001, the average annual growth rate of agricultural productivity in China was 8.1% in the first stage, while it declined to 2.4% in the second stage. Research on the second phase of China’s rural reforms has focused on the causes of the slowdown in productivity growth. Some scholars argue that the first-phase reforms only boosted productivity growth and that this dividend must have disappeared over time. Other scholars argue (Li and Ng, 1995; Huang et al., 1998) that the government’s policy failure in marketization was the leading cause of the stagnation of productivity growth in the second phase.
The current research spotlight further reformed the unified procurement and marketing system in the third period (1990–1993). To avoid government failure due to institutional problems, China replaced the central planning system and government intervention with influential market forces and solutions. By the end of 1993, more than 90% of agricultural products were sold at market-determined prices (Fan et al., 2002). However, market reformation has not been fully completed due to fragmentation of regional markets and isolation of domestic markets (Glauben et al., 2006). In addition, the acceleration of rural industry has absorbed agricultural resources such as labor, land, and capital. However, there is a controversy among academics regarding the changes in the country’s agricultural growth since the mid-1990s. Some scholars argue (Pratt et al., 2008; Dekle and Vandenbroucke, 2010; Wang et al., 2013) that the growth rate of agricultural productivity in China continued to increase in the late 1990s and began to slow down by the beginning of the 21st century. Other scholars (Chen, 2006; Chen et al., 2008; Tong et al., 2009; Zhou et al., 2013) argue that the growth rate of agricultural productivity in China slowed down in the late 1990s but rebounded from the beginning of the 21st century.
In terms of theoretical model analysis of agricultural productivity, Zulkafli and Kopanos, 2017 counted the main theoretical models analyzed as the traditional production function (CPF), stochastic frontier analysis (SFA), and data envelopment analysis (DEA) used 42, 22, and 15 times, respectively, them being the three most widely used methods. Earlier studies (McMillan et al., 1989; Lin, 1992; Buckland et al., 1997) mainly used CPF to estimate productivity. Recent studies have more often used SFA (Asif, 2017) and DEA (You and Xiao, 2022) to decompose total factor productivity (TFP) into technology and efficiency. CPF is estimated for the average production function, while the SFA and DEA methods estimate the production frontier representing the highest productivity at each stage. The change in the production frontier over time shows the change in production technology. SFA and DEA estimate a production frontier representing the maximum output achievable for a given input. The shift of the frontier over time shows technological change, and the vertical distance between a unit's output and the frontier represents the technical efficiency of that unit. SFA assumes that the production frontier follows some functional form, such as a Cobb–Douglas function, and allows a stochastic term to capture noise. DEA is a deterministic model that allows the formation of production functions to be relaxed to avoid rigid functional forms.
In summary, previous literature has a consistent view on productivity change in the first three periods but with different views on analyzing theoretical models of productivity. This paper uses stochastic frontier analysis because agriculture is undoubtedly an industry full of noise and singular values are inevitably not present, so SFA should be preferred to DEA (Cristian, 2020). Furthermore, the traditional non-frontier approach does not consider the technical non-efficiency factor to be its big drawback. Also, of the literature that has studied agricultural production in China, most of them have examined the impact of changes in total factor productivity in agriculture, such as technological progress and changes in technical efficiency, on the sustainable development of agriculture in China. However, the source of economic growth contributes to factor accumulation in addition to the growth of total factor productivity.
3 Theoretical framework and data description
3.1 Theoretical framework
Global food insecurity and global hunger are hindering economic development, health, and wellbeing globally, especially in Asia. Hence, it is essential to explore the factors that contribute to agriculture production. Compared with current literatures, we address the agriculture machine, and comparing with other nature resource including labor, workforce, and fertilizer (Dorinet et al., 2021). The theoretical framework is shown in Figure 1.
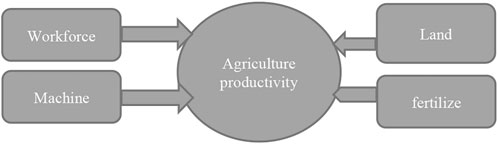
FIGURE 1. Theoretical framework.
Agriculture machinery accounts for agriculture productivity in agricultural economies. Guadagni (2007) investigated the agriculture machinery factors at agricultural productivity and found that a significant deficit in agricultural machinery is hindering sector productivity at 45 percent, which means machine input has contributed to the productivity. Steenwyk et al., 2022 suggested that additional machine-based work inputs have contributed to the growth in land and labor productivities, as they have enabled farmers to control more physical work, enabling more irrigation and agrochemical applications. Moreover, aging of the rural population and mobility of younger workforce cause reduced workforce inputs. However, workforce is always considered an essential input factor for contribution to agriculture productivity. Baldoni et al., 2021 constructed a theoretical model to investigate the influence of immigrant workforce on agriculture productivity through micro-level data in Italian. However, comparing with mechanical input factors, labor productivity increased, leading to an increase in real wages, which was an incentive to replace labor with mechanical input (Paolo, 2020).
Numerous nature resource inputs including land and fertilizer lead to agricultural productivity development, although producing a link to massive environmental pollution (Khan H et al., 2020).
3.2 Data description and statistics
The main data used in this paper are the agricultural input and output data of 31 provinces, autonomous regions, and municipalities directly under the central government in mainland China from 1990 to 2020. The reason we evaluate agricultural production at provincial level is because all indicators at the provincial level are the most complete data, which can ensure the scientific and comprehensive nature of the results in this paper.
In the actual measurement process, we take the early data of Hainan Province and Chongqing City from the Statistical Yearbook of New China in the Six Decades and the Chinese Statistical Yearbook and the Chinese Rural Statistical Yearbook in previous years. This paper is based on the agricultural input and output variables according to Chivian et al., 2008; Jim et al., 2006; Chang et al., 2008 and Xia and Xu, 2020. The agricultural output variable is calculated as the total output value of agriculture, forestry, animal husbandry, and fishery at constant prices in 1990. The agricultural input factors used are the ones with the most studied productivity at home and abroad: labor, land, fertilizer, and agricultural machinery, among which labor input is calculated as the number of people employed in rural agriculture, forestry, animal husbandry, and fishery; land input is calculated as the total sown area of crops; fertilizer input is calculated as the discounted amount of agricultural fertilizer application; and agricultural machinery input is calculated as the total power of agricultural machinery . Because of the large amount of data for 30 years, we describe the mean values of variables according to one group of 10 years in Table 1.
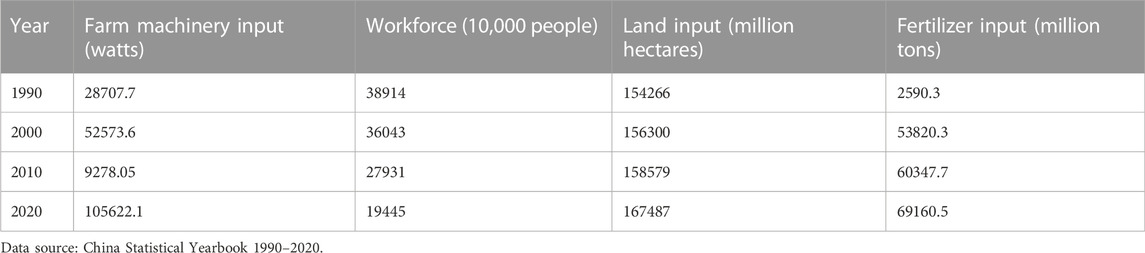
TABLE 1. Variable statistics (mean).
3.3 Cointegration test
Pedroni (2004) residual cointegration test results are given in Table 2. This finding indicates that the variables have a long-run connection at a 1% level, with a long-run effect on agricultural productivity. Also, the results also indicate that a cointegration relation is non-negligible, the long-run association of the variables is confirmed, and the results for cointegration tests further lead us to analyze the long-run impact of input factors on agricultural productivity.
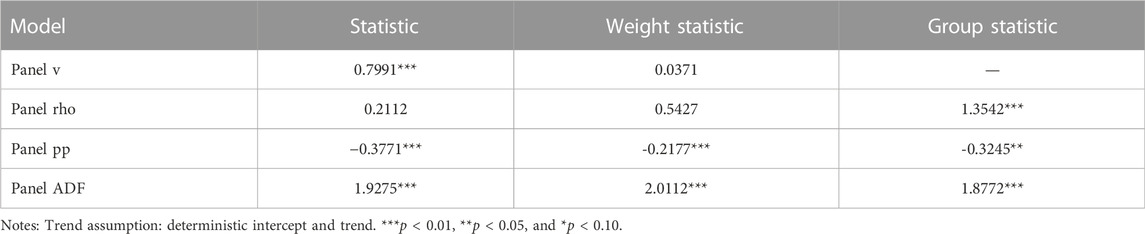
TABLE 2. Pedroni residual cointegration test results.
4 Empirical model
This section first introduces the development of the stochastic frontier model, uses the model to analyze input–output relationships, and finally uses growth accounting tables to quantify the contribution of input factors to agricultural growth.
4.1 Stochastic frontier model
According to Kumbhakar and Lovell (2000) and Battese and Coelli (1992), the stochastic frontier model is composed of a deterministic production frontier function plus a symmetric random error variable. Based on this, the stochastic frontier model set in this paper is as follows:
Eq. 1 is the general form of the stochastic frontier production function, where
Equation 2 is based on a time-varying technical inefficiency index model adopted from the study of Battese and Coelli (1992). Eq. 2 defines the technical inefficiency index of the province
Brandt et al. (2020) chose a transcendental logarithmic stochastic frontier production function form to develop an empirical model including four factors: land (D), fertilizer (R), labor (L), and farm machinery (P), with the empirical model given as follows:
4.2 Growth accounting table
After estimating the production function, the contribution of the household joint production responsibility system to China’s agricultural growth is calculated by constructing a growth accounting table. This paper uses this growth accounting table to study the changes of the contribution of input factors and productivity to China’s agricultural growth in different periods. The contribution of agricultural growth can be divided into three categories: input factors, productivity, and residuals, and only input factors and productivity are calculated in this paper because they are the most significant. The contribution of input factors can be subdivided into the contribution of each individual input factor, which is the product of the coefficient of the corresponding input factor and the change in the number of input factors, and the contribution of productivity, which is the inter-period change in productivity.
5 Empirical results
For the stochastic frontier production function model in Eq 5, R software is used for estimation. In this paper, the estimation is first carried out according to Eq 5, and the variables that do not pass the significance test are eliminated according to the magnitude of the t-test value, and then the remaining variables are re-estimated to ensure the correctness of the model form and the accuracy of the estimation results, and the final stochastic frontier production function estimation results are obtained as shown in Table 2. According to the results given in Table 3, the LR value reaches 292.871, indicating that the model has strong explanatory power. For the technical inefficiency function, the total variance estimated by the stochastic frontier production function is 0.1687, and the variance of technical inefficiency accounts for 0.8937 of the total variances, and it passes the significance test at 1% of the significance level, indicating that technical inefficiency is important in explaining output differences. The mean value of technical inefficiency, 0.1687, is significant at 1% significance level, indicating that technical inefficiency does exist, while the magnitude of change in technical efficiency, η of 0.0312, indicates that technical efficiency increases at a decreasing rate over time. Overall, the technical inefficiency function is set correctly.
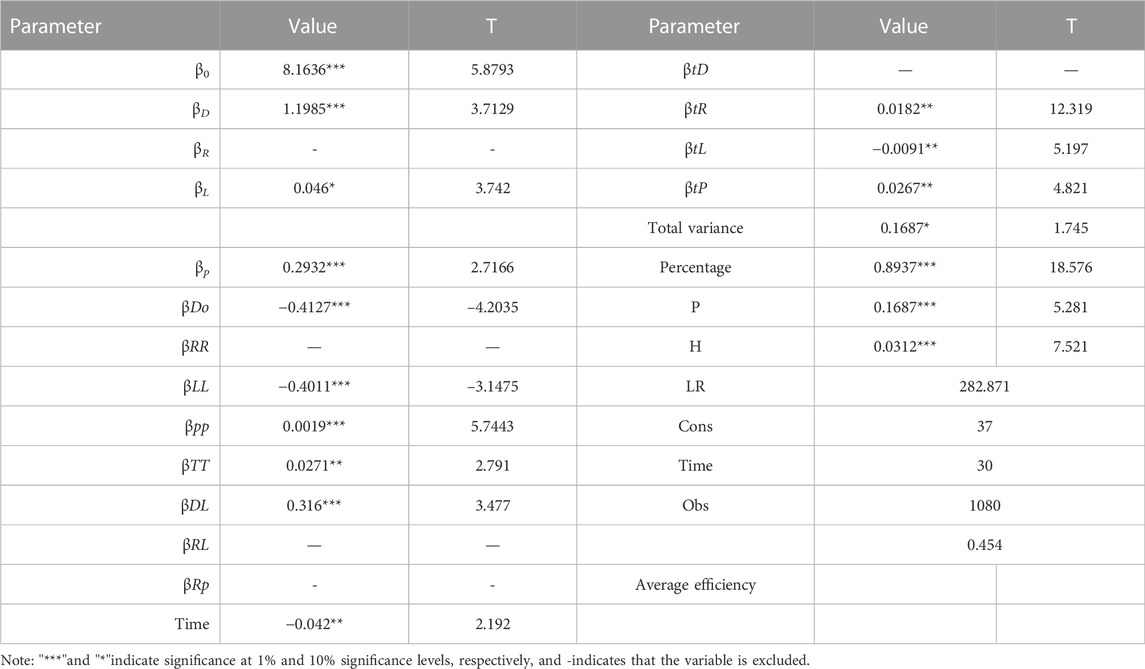
TABLE 3. Estimation results of stochastic frontier production function.
For the deterministic frontier output component, all parameter estimates pass the significance test at the 1% significance level. For land elasticity of 1.745, it indicates that for our agriculture, land still has an irreplaceable role and has an extremely strong contribution to promote agricultural output. However, the estimated value
As shown in Figure 2, the agricultural technology growth rate in China has been consistently maintained at around 3.47% during 1990–2020, when the analysis stops in 2020. On one hand, the highest agricultural technology growth occurred in 1999, 2005, and 2019, with a growth rate of 4.1%, and relatively high growth rates of 3.85% in 2009, 2012, and 2017. On the other hand, the lowest values appeared in 2011, with a growth rate of 2.63% in 2018 and 2020, in addition to four other years (1994, 2000, 2001, and 2007), with growth rates below 3%. The analysis of the contribution of agricultural economic growth comes from two aspects: input factors and productivity. The contribution of input factors can be subdivided into four agricultural contributions of labor, land, fertilizer, and farm machinery; the contribution of productivity can be subdivided into two contributions of technology and efficiency.
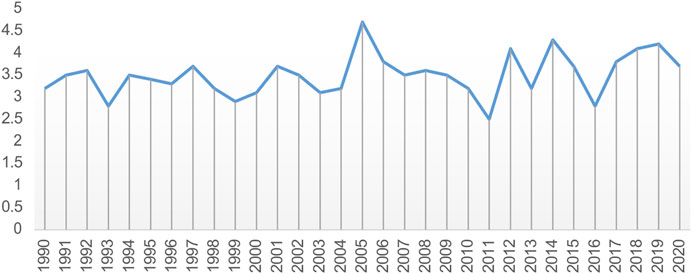
FIGURE 2. Agricultural technology growth rate.
Table 4 is an accounting table of China’s agricultural growth, which gives the changes of China’s agricultural growth and the contribution and contribution rate of each factor to the growth during 1991–2020, and this paper will use 5 years as a unit to make an in-depth analysis of the total factor growth rate of China’s agriculture. As shown in Table 4, the growth rates during 1991–1995, 2016–2020, and 2011–2015 are all stable at around 4%, with an average annual growth rate of 10.2% during 1996–2000, while the average annual growth rate decreases to 3.3% during 2006–2010. As for input factors, they provided 1.3% and 1.6% growth rate for agriculture in 1991–1995 and 1996–2000, respectively, and contributed 28% and 16% to agricultural growth, among which fertilizer and farm machinery contributed more and labor and land contributed less. The contribution of fertilizer and agricultural machinery remained high, together providing 1% of the growth rate for agriculture, accounting for more than 20% of the total growth of 4.7%, but the reduction in the amount of agricultural labor and land constrained agricultural growth, with both providing -0.5% and -0.3% of the growth rate for agriculture, respectively, basically offsetting the contribution of fertilizer and agricultural machinery. During the period 2006–2010, China increased the use of agricultural land, and the growth provided by land to agriculture increased from -0.4% in the previous period to 0.3%, and with the trend of other input factors remaining unchanged, the growth provided by input factors combined to agriculture in this period recovered to 0.9%, with a contribution rate of 26%. During 2011–2015, input factors combined to provide 0.8% growth to agriculture, with a contribution rate of 16%. The growth rate of land, fertilizer, and farm machinery all slowed down compared to the previous period, but the shrinkage of labor force slowed down, thus curbing further decline in the overall contribution of input factors. In terms of each input factor, the contribution of labor to agricultural growth is basically negative, especially from 2001 to 2010, when the shrinkage of agricultural labor significantly slowed down the growth of Chinese agriculture; land changed little, experiencing a decline from 2001 to 2005, but the decline was curbed after 2006 and basically recovered to the 2000 levels; fertilizer and farm machinery have been significant and stable contributors to agricultural growth but have decreased in the period just past 2016–2020.
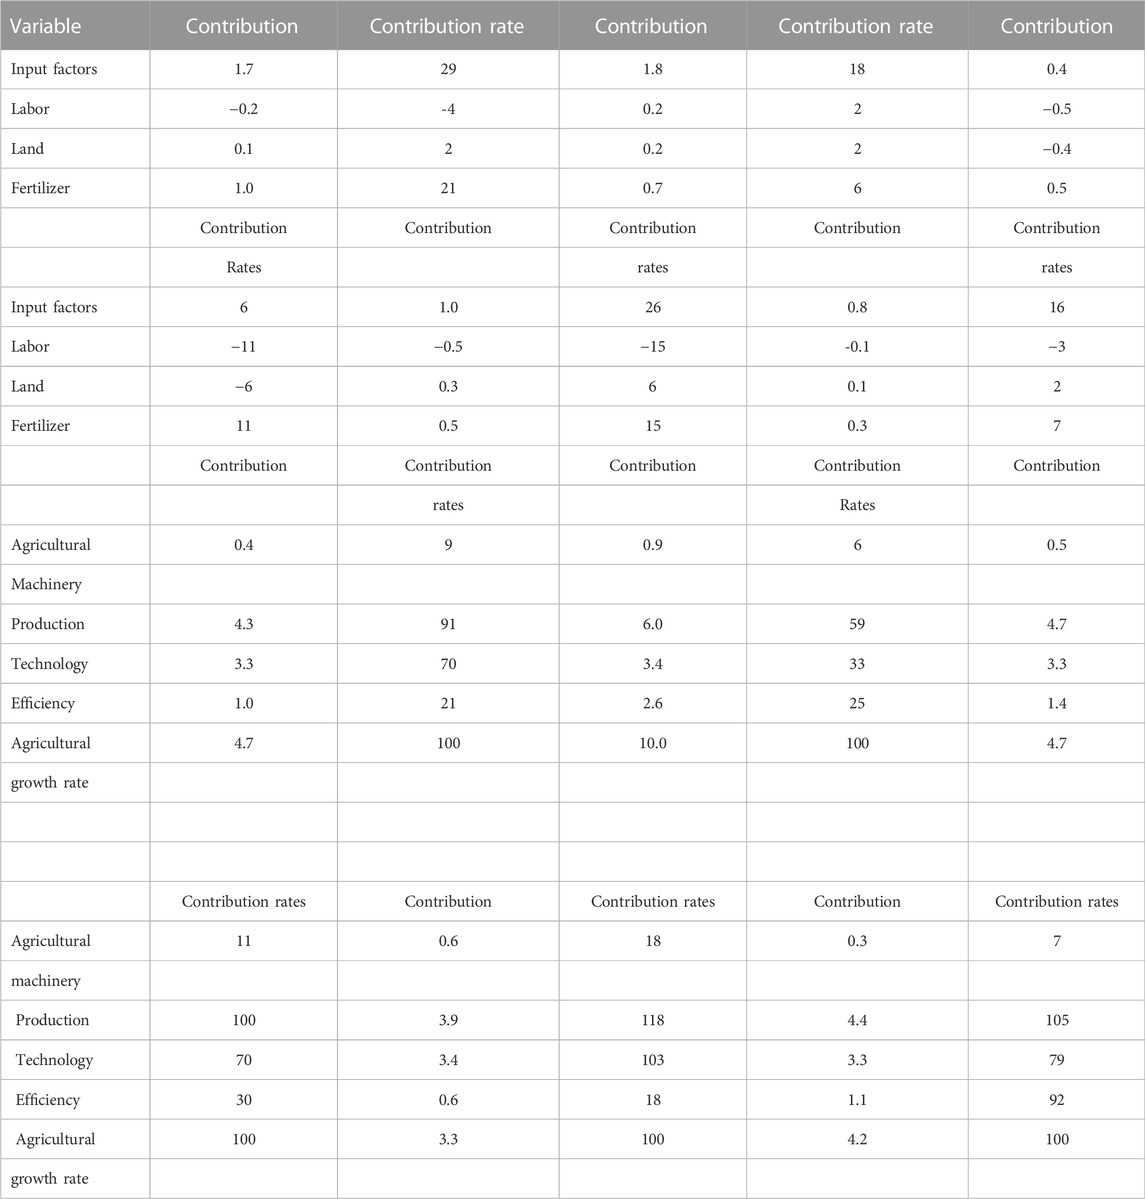
TABLE 4. Contribution of China’s agricultural growth (%).
Over the past 27 years, China’s agricultural growth has been largely dependent on productivity gains. In the 1980s, the contribution of input factors and productivity to agricultural growth was roughly 50 percent. However, in the 1990s, this ratio dropped to 25%, 75%, and the contribution of productivity to agricultural growth strengthened. As we enter the 21st century, the contribution of input factors to agricultural growth is negligible and productivity has become more important. Hanson (2020) found that the contribution of input factors to agricultural growth has gradually decreased after 1979, which is consistent with the findings of this paper. In terms of input factors, this paper finds that the contribution of land and labor is relatively low, while the contribution of fertilizer and farm machinery is relatively high, which is consistent with the findings of Steinbock (2019). However, compared to the aforementioned literature, this paper uses stochastic frontier analysis to control for the effects of uncertainties (e.g., weather) on agricultural growth, ensuring the robustness of the results.
5.1 Robustness checks
Considering the empirical results scientifically, it is essential to use the robustness test through the alternative regression method; therefore, we used the AMG (augmented mean group) estimator (Pesaran, 2008; Bu et al., 2013; Balaji et al., 2022) and CCEMG (common correlated effects estimation) to perform the panel estimates as in table 5. Those results show that fertilizer and farm machinery have a significant and stable influence on agricultural growth at a 1% level. At the same time, the labor factor input no longer contributes to agricultural output. The robustness results show consistence with stochastic frontier results (Table 2). In general, stochastic frontier analysis results and robustness results both consist with Hanson (2020) that the contribution of land and labor is relatively low while the contribution of fertilizer and farm machinery is relatively high.
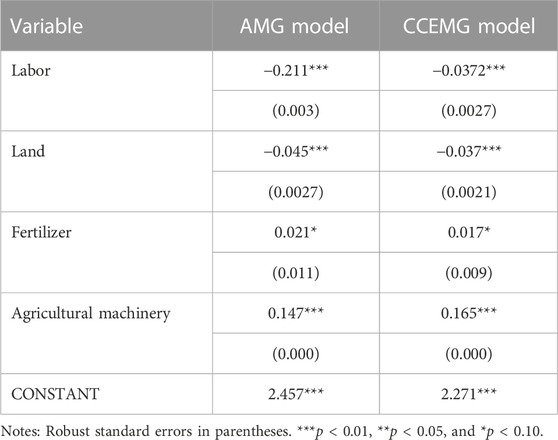
TABLE 5. Robustness test.
6 Conclusion policy recommendations
This paper establishes a stochastic frontier production function model to decompose the total factor productivity growth in agriculture and empirically analyzes the overall trend of total factor productivity growth in agriculture based on the panel data of 31 provinces in China from 1990 to 2020, using the frontier production function for estimation. Compared with current literature, Magazzino et al., 2022 suggested that natural resource plays an essential role in agriculture’s total factor productivity. We have proven that technology factor inputs play the main role in total factor productivity in agriculture, compared to labor and land input factors.
The main research findings are as follows: first, the total factor productivity growth of agriculture shows an increasing trend from 1990 to 2020, China’s agricultural total factor productivity growth has undergone two stages of change and has steadily increased in recent years, relying on the improvement of agricultural total factor productivity can increase the total agricultural output value by 1.571% per year, and the extent of the role is still strengthening and has become the driving force of agricultural economic growth. It has become a source of economic growth in agriculture. Compared with total factor input factors in all sectors, total factor productivity in agriculture gradually plays an important role in driving economic growth.
Second, China’s agricultural total factor productivity growth exhibits obvious stage-specific characteristics, with the highest growth rate in 2003–2004 and the lowest in 2008–2009. By stages, agricultural TFP growth is the fastest in 2016–2020 compared with the 2010–2015 period, and all three stages of agricultural TFP growth are driven by technological progress. In response to these key findings, the following implications should be proposed: first, to promote the continuous improvement of agricultural production efficiency. The average efficiency of agricultural production in China is less than 50%, and there is great potential to stimulate sustainable agricultural growth by improving production efficiency with the same level of technology. There is a need to improve agricultural production management, optimize the cropping structure, improve the quality of agricultural products, and innovate marketing methods. Therefore, the government should establish channels of agricultural business management exchange between inefficient and efficient regions and encourage the optimization of existing agricultural management models and methods. At the same time, it should reasonably introduce high-yielding crops according to local climate and planting conditions, improve the quality and brand influence of agricultural products, and increase their added value. The digital economy is used as an effective tool to balance the contradiction between the pursuit of agricultural production and environmental sustainability.
Finally, increase sustained investment in agricultural research and technology in current literature. The rate of technological progress has remained stable over the past 27 years. However, the contribution of technological progress to China’s agricultural growth is gradually increasing in the context of the overall slowdown in agricultural growth. Due to the long return cycle of scientific research investment, although the investment in scientific research and technology for agriculture cannot significantly improve the contribution of science and technology to agricultural growth in the short term, the growth potential of input factors is limited in the long term. The production efficiency is significantly improved in the short term, with little room for further improvement in the long term. Therefore, the policy implies that continuously increasing investment in agricultural research and technology, focusing on human capital investment, and encouraging agricultural technology research and development are important ways to achieve sustainable agricultural development.
In future research, we wish to investigate other factors, including digital technology contributing to agriculture production through machine learning. Furthermore, we intend to analyze the intermediate effects of policy efficiency on agriculture productivity to extend our discussion. The original value of this paper is to use the stochastic frontier model to investigate the influence factors on agriculture productivity through long panel data and emphasize the importance of technology applied in China’s agricultural growth in the future.
Data availability statement
Publicly available datasets were analyzed in this study. These data can be found here: http://www.stats.gov.cn/tjsj/ndsj/.
Author contributions
WT: revised the manuscript GQ: idea and writing of the draft YX: polished the language CF: idea and images.
Conflict of interest
The author declares that the research was conducted in the absence of any commercial or financial relationships that could be construed as a potential conflict of interest.
Publisher’s note
All claims expressed in this article are solely those of the authors and do not necessarily represent those of their affiliated organizations, or those of the publisher, the editors, and the reviewers. Any product that may be evaluated in this article, or claim that may be made by its manufacturer, is not guaranteed or endorsed by the publisher.
References
Balaji, M. S., Jitendra, K., Arumugam, E., and Sethupathi, B. P. (2022). State of the art on challenges for friction material manufacturers – raw materials, regulations, environmental, and NVH aspects. Proceedings of the institution of mechanical engineers, Part J J. Eng. Tribol., 135065012211350. doi:10.1177/13506501221135071
Baldoni, E., Coderoni, S., and Esposti, R. (2021). Immigrant workforce and agriculture productivity: Evidence from Italian farm-level data. Eur. Rev. Agric. Econ. 48 (4), 805–834. doi:10.1093/erae/jbaa033
Battese, G. E., and Coelli, T. J. (1992). Frontier production functions, technical efficiency and panel data: With application to paddy farmers in India. J. Prod. Analysis 3 (1), 153–169. doi:10.1007/bf00158774
Brandt, L., Kambourov, G., and Storesletten, K. (2020). Barriers to entry and regional economic growth in China. CEPR Discussio Paper No. DP14965. Available at SSRN: https://ssrn.com/abstract=3650077.
Buckland, S. T., Burnham, K. P., and Augustin, N. H. (1997). Model selection: An integral Part of Inference. Biometrics 53, 603–618. doi:10.2307/2533961
Bu, Q., Wang, B., Huang, J., Deng, S., and Yu, G. (2013). Pharmaceuticals and personal care products in the aquatic environment in China: A review. J. Hazard. Mater. 262, 189–211. doi:10.1016/j.jhazmat.2013.08.040
Carter, C., and Estrin, A. (2001). Market reforms versus structural reforms in rural China. J. Comp. Econ. 29, 527–541. doi:10.1006/jcec.2001.1732
Chang, H. H., and Chen, S. W. (2008). The impact of online store environment cues on purchase intention: Trust and perceived risk as a mediator. Online Information Review 32, 818–841. doi:10.1108/14684520810923953
Chen, H., Zhu, Q., Peng, C., Wu, N., Wang, Y., Fang, X., et al. (2013). The impacts of climate change and human activities on biogeochemical cycles on the Qinghai-Tibetan Plateau. Glob. Change Biol. 19, 2940–2955. doi:10.1111/gcb.12277
Chivian, D., Brodie, E. L., Alm, E. J., Culley, D. E., Dehal, P. S., DeSantis, T. Z., et al. (2008). Environmental genomics reveals a single-species ecosystem deep within Earth. Science 322 (5899), 275–278.
Dar, J. A., and Asif, M. (2018). Does financial development improve environmental quality in Turkey? An application of endogenous structural breaks based cointegration approach. Management of Environmental Quality 29, 368–384. doi:10.1108/MEQ-02-2017-0021
Dekle, R., and Vandenbroucke, G. (2010). Whither Chinese growth? A sectoral growth accounting approach. Rev. Dev. Econ. 14, 487–498. doi:10.1111/j.1467-9361.2010.00566.x
Donnell, C. J. (2010). Measuring and decomposing agricultural productivity and profitability change. Aust. J. Agric. Resour. Econ. 54, 527–560. doi:10.1111/j.1467-8489.2010.00512.x
Dorinet, E., Jouvet, P. A., and Wolfersberger, J. (2021). Is the agricultural sector cursed too? Evidence from Sub-Saharan Africa. World Dev. 140, 105250. doi:10.1016/j.worlddev.2020.105250
Farrell, M. (1957). The measurement of productive efficiency. J. R. Stat. Soc. Ser. A 120 (3), 253–290. doi:10.2307/2343100
Fan, J., McCandliss, B. D., Sommer, T., Raz, A., and Posner, M. I. (2002). Testing the efficiency and independence of attentional networks. J. Cognitive Neurosci. 14 (3), 340–347. doi:10.1162/089892902317361886
Giannetti, M., Liao, G., and Yu, X. (2015). The brain gain of corporate boards: Evidence from China. J. Finance 70, 1629–1682. doi:10.1111/jofi.12198
Faridy, J.-C. M., Stephanie, C. M., Gabriela, M. O., and Cristian, J. M. (2020). Biological activities of chickpea in human health (Cicer arietinum L.). A Review. Plant Foods for Human Nutrition 75 (2), 142–153.
Glauben, B., Lu, T., and Lu, W. (2006). Policy reform and productivity change in Chinese agriculture: A distance function approach. J. Dev. Econ. 81 (1), 61–79. doi:10.1016/j.jdeveco.2005.04.009
Gong, B. (2018). Agricultural reforms and production in China changes in provincial production function and productivity in 1978 -2015. J. Dev. Econ. 132 (5), 18–31. doi:10.1016/j.jdeveco.2017.12.005
Guadagni, M., and Fileccia, T. (2009). The Kyrgyz republic: Farm mechanization and agricultural productivity. Washington, DC and FAO, Rome: World Bank. https://openknowledge.worldbank.org/handle/10986/19476.License: CC BY 3.0 IGO.
Jim, C. Y., Wendy, Y., and Chen, Y. (2006). Impacts of urban environmental elements on residential housing prices in Guangzhou (China). Landscape and Urban Planning 78 (4), 422–434. doi:10.1016/j.landurbplan.2005.12.003
Hanson, G. H. (2020). Who will Fill China's Shoes? The global evolution of labor-Intensive Manufacturing. National Bureau of Economic Research. Available at: http://www.nber.org/papers.
Huang, Z. Y., Plettner, E., and Robinson, G. E. (1998). Robinson.effects of social environment and worker mandibular glands on endocrine-mediated behavioral development in honey bees. J. Comp. Physiology A 183 (2), 143–152.
Khan, A., Muhammad, F., and Chenggang, Y. (2020). The impression of technological innovations and natural resources in energy-growth-environment nexus: A new look into BRICS economies Sci. Total Environ. 727. doi:10.1016/j.scitotenv.2020.138265
Huang, C., Barnett, A. G., Xu, Z., Chu, C., Wang, X., Turner, L. R., et al. (2013). Managing the health effects of temperature in response to climate change: Challenges ahead. Environmental Health Perspectives 121, 4. doi:10.1289/ehp.1206025
Khan, H., Khan, I., and Binh, T. T. (2020). The heterogeneity of renewable energy consumption, carbon emission and financial development in the globe: A panel quantile regression approach. Energy Rep. 6, 859–867. doi:10.1016/j.egyr.2020.04.002
Kumbhakar, S. C., and Lovell, C. A. K. (2000). Stochastic frontier analysis. Cambridge ON: Cambridge University Press.
Li, S. K., and Ng, Y. C. (1995). Measuring the productive efficiency of a group of Firms. Int. Adv. Econ. Res. 1 (4), 377–390. doi:10.1007/bf02295790
Lin, J. Y. (1992). Rural reforms and agricultural growth in China. Am. Econ. Rev. 82 (1), 34–51. Available at: http://www.jstor.org/stable/2117601 (Accessed Dec 15, 2022).
Lin, J. Y. (1995). Endowments, technology, and factor markets: A natural Experiment of Induced institutional innovation from China's rural reform. Am. J. Agric. Econ. 77 (2), 231–242. doi:10.2307/1243533
Liu, Q., Roberts, A. P., Larrasoaña, J. C., Banerjee, S. K., Guyodo, Y., Tauxe, L., et al. (2012). Environmental magnetism: Principles and applications. Rev. Geophys. 50, RG4002. doi:10.1029/2012RG000393
Magazzino, C., Shah, M. I., Sharma, G. D., Rao, A., and Shahzad, U. (2022). The role of renewable energy and natural resources for sustainable agriculture in ASEAN countries: Do carbon emissions and deforestation affect agriculture productivity? Resour. Policy 76, 102578. doi:10.1016/j.resourpol.2022.102578
McMillan, J., Whalley, J., and Zhu, L. (1989). The impact of China's economic reforms on agricultural productivity growth. J. Political Econ. 97 (4), 781–807. doi:10.1086/261628
Michler, T., Seibold, S., Leverkus, A. B., Michler, T., Muller, J., Noss, R. F., et al. (2020). The living dead: Acknowledging life after tree death to stop forest degradation. Front. Ecol. Environ. 18 (7), 505–512. doi:10.1002/fee.2252
Mulat, D. G., Jacobi, H. F., Feilberg, A., Adamsen, A. P. S., Richnow, H.-H., and Nikolausz, M. (2016). Changing feeding regimes to demonstrate flexible biogas production: Effects on process performance, microbial community structure, and methanogenesis pathways. Appl. Environ. Microbiol. 82 (2), 438–449. doi:10.1128/AEM.02320-15
Pablos, C., Merino, A., Acebes, L. F., Pitarch, J. L., and Biegler, L. T. (2021). Dynamic optimization approach to coordinate industrial production and cogeneration operation under electricity price fluctuations. Comput. Chem. Eng. 149, 107292–108135. doi:10.1016/j.compchemeng.2021.107292
Paolo (2020). The limiting factor: Energy, growth, and divergence, 1820–1913. Econ. Hist. Rev. 1 (07), 486–512. doi:10.1111/ehr.12913
Pedroni, P. (2004). Panel cointegration: Asymptotic and finite sample properties of pooled time series tests with an application to the PPP hypothesis Econom. Econ. Theory 20 (3), 597–625. doi:10.1017/S0266466604203073
Smith, P., Martino, D., Cai, Z., Gwary, D., Janzen, H., Kumar, P., et al. (2007). Policy and technological constraints to implementation of greenhouse gas mitigation options in agriculture. Agric. Ecosyst. Environ. 118 (1-4), 6–28. doi:10.1016/j.agee.2006.06.006
Steenwyk, P., Heun, M. K., Brockway, P., Sousa, T., and Henriques, S. (2022). The contributions of Muscle and machine work to land and labor productivity in world agriculture since 1800. Biophys. Econ. Sust. 7, 2. doi:10.1007/s41247-022-00096-z
Steinbock, D. (2018). U.S.-China trade war and its global impacts. China Q. Int. Strategic Stud. 04 (04), 515–542. doi:10.1142/s2377740018500318
Ullah, A., Arshad, M., Kachele, H., Khan, A., Mahmood, N., and Müller, K. (2020). Information asymmetry, input markets, adoption of innovations and agricultural land use in Khyber Pakhtunkhwa, Pakistan. Land Use Policy 90, 104261. doi:10.1016/j.landusepol.2019.104261
Vandebroek, I., Balick, M. J., Ososki, A., Kronenberg, F., Yukes, J., Wade, C., et al. (2010). The importance of botellas and other plant mixtures in Dominican traditional medicine. J. Ethnopharmacol. 128 (1), 20–41. doi:10.1016/j.jep.2009.12.013
Wang, S. L., Tuan, F., Gale, F., Sombart, A., and Hansen, J. (2013). China's regional agricultural productivity growth in 1985-2007: A Multilateral comparison 1. Agric. Econ. 44 (2), 241–251. doi:10.1111/agec.12008
Wang, Q., Barge, L. M., and Steinbock, O. (2019). Microfluidic production of pyrophosphate catalyzed by mineral membranes with steep pH gradients. Chem. – A Eur. J. 25 (18), 4732–4739. doi:10.1002/chem.201805950
Wang, Y., He, Y., Lai, Q., and Fan, M. (2014). Review of the progress in preparing nano TiO2: An important environmental engineering material. J. Environ. Sci. 26 (11), 2139–2177. doi:10.1016/j.jes.2014.09.023
Wen, Q., and Shi, Y. (1993). The quaternary climo-environment changes in Chaiwopu basin of Xinjiang region. Chin. Geogr. Sci. 3, 147–158. doi:10.1007/BF02664555
Xia, F., and Xu, J. (2020). Green total factor productivity: A re-examination of quality of growth for provinces in China. China Econ. Rev. 62, 101454. doi:10.1016/j.chieco.2020.101454
You, J., and Xiao, H. (2022). Can FDI facilitate green total factor productivity in China? Evidence from regional diversity. Environ. Sci. Pollut. Res. 29, 49309–49321. doi:10.1007/s11356-021-18059-0
Zhang, Y.-L., Zhao, Y. C., Wang, J. X., Zhu, H. D., Liu, Q. F., Fan, Y. G., et al. (2004). Effect of environmental exposure to cadmium on pregnancy outcome and fetal growth: A study on healthy pregnant women in China. J. Environ. Sci. Health, Part A 39 (9), 2507–2515. doi:10.1081/ese-200026331
Zhang, Y., Wang, X., Glauben, T., and Brümmer, B. (2011). The impact of land reallocation on technical efficiency: Evidence from China. Agric. Econ. 42, 495–507. doi:10.1111/j.1574-0862.2010.00532.x
Keywords: input factors, technological progress, agriculture, growth contribution, sustainability
Citation: Tong W, Qin G, Xu Y and Fu C (2023) Sustainable growth, input factors, and technological progress in agriculture: Evidence from 1990 to 2020 in China. Front. Environ. Sci. 10:1040356. doi: 10.3389/fenvs.2022.1040356
Received: 09 September 2022; Accepted: 30 November 2022;
Published: 01 February 2023.
Edited by:
Zahid Yousaf, Government College of Management Sciences Mansehra, PakistanReviewed by:
Atif Jahanger, Hainan University, ChinaElchin Suleymanov, Baku Enginering University, Azerbaijan
Sedat Alatas, National Research University Higher School of Economics, Russia
Luigi Aldieri, University of Salerno, Italy
Copyright © 2023 Tong, Qin, Xu and Fu. This is an open-access article distributed under the terms of the Creative Commons Attribution License (CC BY). The use, distribution or reproduction in other forums is permitted, provided the original author(s) and the copyright owner(s) are credited and that the original publication in this journal is cited, in accordance with accepted academic practice. No use, distribution or reproduction is permitted which does not comply with these terms.
*Correspondence: Guangke Qin, cWdrMDkwOUAxMjYuY29t