Abstract
Solid wastes deposited in the coastal zone that date from an era of lax environmental regulations continue to pose significant challenges for regulators and coastal managers worldwide. The increasing risk of contaminant release from these legacy disposal sites, due to a range of factors including rising sea levels, associated saline intrusion, and greater hydrological extremes, have been highlighted by many researchers. Given this widespread challenge, and the often-limited remedial funds available, there is a pressing need for the development of new advanced site prioritization protocols to limit potential pollution risks to sensitive ecological or human receptors. This paper presents a multi-criteria decision analysis that integrates the principles of Conceptual Site Models (Source-Pathway-Receptor) at a national scale in England and Wales to identify legacy waste sites where occurrence of pollutant linkages are most likely. A suite of spatial data has been integrated in order to score potential risks associated with waste type (Source), likelihood of pollutant release relating to current and future flood and erosion climate projections, alongside current management infrastructure (Pathway), and proximity to sensitive ecological features or proxies of human use in coastal areas (Receptors). Of the 30,281 legacy waste deposits identified in England and Wales, 3,219 were located within the coastal zone, with coastal areas containing a density of legacy wastes (by area) 10.5 times higher than inland areas. Of these, 669 were identified as priority sites in locations without existing coastal defences or flood management infrastructure, with 2550 sites identified in protected areas where contaminant transfer risks could still be apparent. The majority (63%) of the priority sites have either undefined source terms, or are classified as mixed wastes. Mining and industrial wastes were also notable waste categories, and displayed strong regional distributions in the former mining areas of north-east and south-west of England, south Wales, and post-industrial estuaries. The large-scale screening process presented here could be used by environmental managers as a foundation to direct more high-resolution site assessment and remedial work at priority sites, and can be used as a tool by governments for directing funding to problematic sites. List of Acronyms.
1 Introduction
The concentration of urban areas and industrial activities in coastal regions has led to large-scale disposal of a range of household, commercial and industrial wastes in the coastal zone (Cooper et al., 2013). Whilst modern environmental regulation should limit the risks posed by contemporary solid waste disposal, in countries that were early to industrialise, or those with less-strict regulatory regimes, the associated environmental legacies have been highlighted as a growing concern (Nicholls et al., 2021). ‘Legacy wastes’ (originating from historical, weakly-regulated coastal waste disposal) often occur in close proximity to their production, and this was particularly the case for high-volume industrial by-products, where high production rates (and often temperature) limited their transportation range prior to disposal (Lee, 1974; Riley et al., 2020). Many of these intensive industries were located in coastal regions given the proximity to trade routes, the utility of water in industrial processes, and the use of the marine and estuarine environment to enable contaminant dispersal. Similarly, in many coastal orefields and coalfields, disposal of waste rock in the littoral or sub-littoral zone was commonplace and has been shown to impact a range of marine receptors (Giusti, 2001; Ahrens and Morrissey, 2005). Estuarine locations in proximity to major urban areas have also been widely used for disposal of locally-generated municipal wastes, with the low perceived land value of low-lying coastal areas leading to disposal of municipal wastes in flood zones (Brand and Spencer, 2018). As such, the coastal zone is particularly vulnerable to the enduring environmental risks associated with a range of different wastes. These risks are further compounded by incomplete official records, which means that the exact contents of each landfill site are often uncertain and, in many cases, contain a mixture of different unknown waste types (Brand & Spencer, 2018).
Coastal legacy waste sites are subject to a suite of hazards which may lead to, or exacerbate, pollutant release and transport pathways. These hazards, namely coastal erosion, tidal flooding and saline intrusion are projected to increase in rate, frequency, and severity as climate change continues to affect global weather systems (Robins et al., 2016; Vitousek et al., 2017; Toimil et al., 2020). It may be argued then, that coastal legacy waste sites represent a pollution ‘time-bomb’, with potential for widespread pollutant release in countries where coastal deposition of wastes was practiced. The need for a greater understanding of the distribution, content, and environmental behaviour of coastal wastes in light of a changing climate has been recognised as a key challenge for future environmental management (Nicholls et al., 2021).
The coastline of the United Kingdom (United Kingdom) is managed by a number of different governmental, charitable, and private stakeholder groups, with regional variations in their respective jurisdictions. To facilitate the effective management of these coastal legacy waste sites with limited public budget, there remains a need for a robust method to prioritise sites based on potential environmental risk. Similar large-scale environmental risk assessments have been undertaken for other legacy pollution sources, such as coal mine water pollution, non-coal mine wastes and contaminated land sites, as a means of providing a focus for subsequent regulatory attention and site intervention (e.g. Jarvis and Younger, 2000; Neitzel et al., 2002; Mayes et al., 2009). One approach for prioritising a large number of sites is through multicriteria decision analysis (MCDA), whereby each site is assessed against a number of defined and weighted criteria, and ranked to identify priority sites. The MCDA approach is particularly adaptable for use within GIS software for analysing large spatial datasets (Malcewski, 1999), and is a method that has been applied previously for assessing environmental risks in coastal zones (Le Cozannet et al., 2013). Previous studies have also used GIS-based MCDA for determining coastal landfill vulnerability, for example an investigation of historical landfill sites along the coastline of Wales used spatial MCDA to identify six sites at-risk of exposure and pollutant release due to future coastal erosion and sea level rise (Irfan et al., 2019). A prioritisation of coastal mine spoil deposits also used a variant of MCDA to identify coastal sites at risk, using a simple four-criteria assessment to profile the sites at highest-risk of erosion and subsequent pollutant release over the next 100 years (Riley et al., 2021).
The determination of current and future pollutant risks within any coastal legacy waste site is challenging, and requires the integration of several distinct criteria related to the waste itself and external processes which may act to exacerbate pollutant release. One previous risk assessment presented a method which used a range of input parameters (n = 23) to calculate four sub-indices which may impact potential pollutant release; coastal drivers, landfill vulnerability, landfill hazard, and environmental vulnerability (Brand and Spencer, 2018). These sub-indices were then combined to create an index for the risk of waste release, and the risk posed to the environment by the likely pollution released, which generated an overall risk score for the eight landfill sites analysed in the study. As in Irfan et al. (2019), this method was able to integrate a broad suite of input data to effectively generate a list of priority sites.
Although the aforementioned studies provide a valuable basis for determining present and future risks at coastal legacy landfills, there is opportunity for further development. Key areas for development are in the geographical coverage of landfills and the inclusion of additional waste types beyond those recorded within the datasets of environmental regulators, which do not comprehensively cover (or categorise) certain waste types (e.g. large volume process wastes such as iron and steelmaking slags and coal or non-coal mine wastes) that are both expansive and regionally-important (Riley et al., 2020, 2021). The existence of current coastal defences is important in determining landfill vulnerability (e.g. Brand and Spencer, 2018), however a more holistic assessment of current and future vulnerability may be achieved through the inclusion of the broader Shoreline Management Plan (SMP) approach along the section of coast in which landfills are located. For example, despite a hard defence being present at a site, the longer-term SMP may deviate away from a ‘hold the line’ approach (where constant efforts are made to maintain shoreline position), which would not be reflected in a prioritisation analysis that does not consider these longer-term management plans. Finally, one of the key limitations of past approaches has been in the conflation of hazards (e.g. risk of erosion, tidal flooding) with the sensitivity of the receiving environment (e.g. proximity to designated receptors such as conservation sites). This was the case in Irfan et al. (2019), Brand and Spencer (2018), and Riley et al. (2021), where it was possible for a landfill to receive a high risk score through proximity to sensitive receptors alone, without necessarily requiring an identified pollutant transport pathway. For example, if a waste site (source) is co-located with a designated site (e.g. Ramsar site or Site of Special Scientific Interest (SSSI), which are common along United Kingdom coastal and estuarine settings given the widespread migratory and breeding bird populations (receptors)), a site may score highly even if no contaminant linkage pathway (e.g. active erosion) was established.
To improve the prioritisation process for legacy waste landfills, an approach is suggested which borrows from the fundamental principles of contaminated land assessment; namely a conceptual site model (CSM) approach using the principles of Source-Pathway-Receptor (SPR) models. At a site-specific level, the CSM approach is used by environmental practitioners as part of contaminated land statutory guidance in the United Kingdom (HM Government, 2012) and more broadly around pollution impact studies globally (O’Brien et al., 2021). The process determines the potential sources of contamination within a site boundary, and potential sensitive receptors within and around the site, but most importantly requires a feasible pollutant linkage (the ‘pathway’) to be established between the source and the receptor. Without evidence of this pollutant linkage, it is difficult to justify remedial action. At a national scale, such a site-specific approach to determining pollution risk is not feasible, given the costly requirements for surveyor time and the high-resolution data required at such a large number of coastal legacy waste sites (conservatively estimated at over 1200 sites in England alone (Brand et al., 2018; Nicholls et al., 2021)). However, by using available national-scale data of coastal erosion rates and tidal flood risk, it is possible to determine environmental risks at waste sites, and structure prioritisation analyses in a way that places emphasis on establishing feasible pollutant transport linkages, which brings the method more closely in line with established CSM approaches.
Herein a new method for coastal legacy landfill prioritisation is presented, based on a broad-scale conceptual model of pollutant release using the SPR framework. For the first time, a complete database of all known coastal legacy waste sites, from a range of domestic and industrial sources, has been generated and prioritised to determine those sites presenting the greatest environmental risks under present-day and future climate scenarios. Prioritised outputs are provided based on River Basin Districts (RBDs), which broadly align with shoreline management cells in the United Kingdom. As such, opportunity is provided for these results to inform existing River Basin Management and Shoreline Management Plans (SMPs). Whilst the method has been developed and tested for coastal legacy waste sites in England and Wales, it may also be effectively applied to coastlines worldwide, in areas where historical waste deposition has occurred. The results presented are of national importance to environmental regulators and practitioners, where rapid low-cost and broad-scale site assessments can aid in management decision making.
2 Methods
2.1 Landfill database creation
A spatial dataset of legacy landfill sites was generated using a range of publicly-available secondary datasets and newly-generated shapefiles containing locations of several key waste types. For England and Wales, the Historic Landfill Databases (Natural Resources Wales, 2021; Environment Agency, 2022a) were merged using ArcMap 10.8 GIS software to represent historical landfill sites known by regulators to have no current environmental permit in force, predominantly those whose closure predated the enforcement of stricter environmental regulations. Specific landfill contents were not recorded in these datasets, although contents were broadly categorised as “industrial”, “commercial”, “household”, or a combination of these descriptors. To extend coverage of waste types, a dataset of coal and metal spoil areas in England and Wales were added, which originated from digitisation of historical Ordnance Survey (OS) mapping previously collated in Mayes et al. (2009) and Riley et al. (2021). Further coverage of additional waste types was achieved by merging an existing database of shapefiles representing areas of iron and steel slag deposition within Great Britain (detailed in Riley et al., 2020). The combined dataset is herein referred to as the ‘Legacy Waste Database’. Given the absence of an equivalent Historic Landfill Database for Scotland, and variations in the other datasets used, this iteration of prioritisation analysis was constrained to England and Wales only.
2.2 Spatial data analysis
A multitude of factors have potential to influence the overall environmental risk associated with a legacy waste site. These may be further categorised as; the risks posed by the release of waste to receptors in the receiving environment, and external environmental risk factors which may exacerbate contaminant release pathways by affecting the integrity of a waste site. Both forms of risk have potential to result in greater environmental damage. To unify these factors into a consistent format, a CSM approach was applied, by grouping risk factors into three categories aligned with SPR models. These categories were those related to; 1) the content of wastes, likely presence of priority substances (defined in the Water Framework Directive (WFD; Environment Agency, 2016), and reported leaching products (‘source’), 2) factors affecting pollutant transportation (‘pathway’), and 3) factors related to sensitive environmental receptors of pollution (‘receptor’). A number of sub-criteria were used in the process of calculating source, pathway, and receptor risk scores for each landfill site, as detailed in the following sections. ArcMap 10.8 GIS software was used to generate all of the raw scores for each of these criteria, as detailed in the following sections.
2.2.1 Waste type (source)
For the iron and steelmaking slag and mining-related waste deposits, details of the specific waste type were already recorded within constituent datasets (Riley et al., 2020, 2021). Within the Environment Agency (EA) and Natural Resources Wales (NRW) Historic Landfill Databases, exact waste types were not specified, but were largely categorised as containing “industrial”, “commercial”, or “household” wastes, or a combination of these categories. For deposits within the EA/NRW databases which contained wastes of multiple origin, these were re-categorised as “mixed” wastes. Within these mixed wastes, a further category was generated based on landfill closure date to categorise those which were more likely to contain wastes from the 1960s–70s, which are reported to contain hazardous organic contaminants whose production has since been legislated against, such as poly-chlorinated biphenyls (PCBs: Harrad et al., 1994) and persistent organic pollutants (POPs: Vane et al., 2021). As a result of this process, 10 waste categories were generated, which were then straight-ranked (high to low; 1.0 to 0.1) based on their perceived relative likelihood of containing hazardous priority substances, and their potential leaching products (based on authors’ consensus and literature review), as detailed in Table 1.
TABLE 1
| Waste type | Associated hazards and priority pollutants | Rationale | Weight |
|---|---|---|---|
| Radioactive | Radionuclides, radioactivity | Potential for serious chronic health effects within receptors (Kamiya et al., 2015), and potentially high mobility and transport through coastal processes for sediment-bound contaminants (Hamilton, 1999) | 1.0 |
| Mixed 1960s | Polychlorinated biphenyls (PCBs), pesticides (DDT), metals (notably Pb from paint) | More likely to contain a suite of (since prohibited) organic pollutants with neurotoxic and endocrine disrupting properties (Folland et al., 2016). Bio-accumulation of PCBs documented within marine species at higher trophic levels (Williams et al., 2020). Exposed Pb-containing wastes offer a pathway for human exposure; particularly problematic in children (Thornton et al., 1994) | 0.8 |
| Mixed, Undefined, Household, Commercial, Industrial | Flame retardants, asbestos containing materials, metals, organics, pharmaceuticals, physical hazards (broken glass, rusted metal sharps) | The uncertainty surrounding the composition of unidentified wastes increases the risk (effects of release are unpredictable). Mixed wastes (containing the other waste types listed in this group) gives rise to potential for synergistic pollution effects in the receiving environment. Construction and demolition (C&D; Commercial) and MSW waste are shown to have similar leaching levels of Perfluoroalkyl and Polyfluoroalkyl Substances (PFAS) and Perfluoroocatanoic Acid (PFOA) (and higher than some other waste types: Solo-Gabriele et al., 2020) | 0.7 |
| Metal Mine Spoil, Coal Spoil | As, Cd, Cu, Zn, V | Largely inorganic pollutant risks, potentially localised acidity in pyrite-bearing wastes; risks relatively well-defined and most pollutants of concern have modest solubility at seawater pH (Martín-Torre et al., 2015) | 0.4 |
| Iron and Steelmaking Slags | Cr, Pb, V | Despite containing toxic contaminants in bulk material, limited release of these potentially hazardous elements demonstrated in seawater leaching studies (Foekema et al., 2021), hence lowest weighting | 0.1 |
Waste categories with details of key probable pollutants, references, and weighting.
2.2.2 Extent of historical and current coastal erosion (pathway)
Where the shapefile for a landfill site partially extended beyond the constraints of the present-day coastline, it was assumed that these areas had been subject to historical erosion or submerged, and therefore were also currently being actively eroded. A shapefile of the coastline of England and Wales was ‘clipped’ in ArcMap against the legacy waste database to extract the portion of each shapefile which extended into the sea. The area of these sections were then calculated, and used to represent the area (m2) of landfill already lost to coastal erosion processes. A calculated value of zero for this parameter would indicate that no erosion is currently taking place along the seaward edge of the landfill.
2.2.3 Projected coastal erosion rates (pathway)
The National Coastal Erosion Risk Mapping (NCERM) dataset (Natural Resources Wales, 2022a; Environment Agency, 2022b) details the projected extent of coastal erosion along sections of the English and Welsh coastline over three nominal timescales; short-term (20 years), medium-term (50 years), and long-term (100 years), along with the relevant Shoreline Management Plan (SMP) for each coastal section. These erosion maps are informed by a range of geological, topographical and hydrographic factors (Natural Resources Wales, 2022a; Environment Agency, 2022b). Buffers were generated in ArcMap using each erosion estimate, and analysed against landfill locations to determine the total area (m2) of each deposit likely to be eroded over each time scale.
2.2.4 Risk of tidal flooding (pathway)
The risk of each waste deposit being inundated by tidal flood waters was estimated using the EA/NRW Flood Map for Planning datasets (Environment Agency, 2022c,d; Natural Resources Wales, 2022b) which consists of shapefiles related to the annual risk of fluvial and tidal flooding. These data were first filtered to include only tidal flood zone designations, which were further separated into two Flood Zones based on their likelihood of experiencing tidal floods; Flood Zone 2 (areas with annual probability of 0.1–0.5% chance of tidal flooding), and Flood Zone 3 (probability greater than 0.5%). The area of each waste deposit within each of these zones was calculated and used as a factor in prioritisation analysis.
2.2.5 Proximity to sensitive environmental receptors (receptor)
For the purposes of this work, the proximity of waste deposits to three types of statutory environmental designations were calculated and used as a proxy for potential exposure of pollutants to sensitive environmental receptors. These were Ramsar sites (those areas identified and protected under the Ramsar convention containing internationally important habitat for wading and wetland bird species: Matthews, 1993; Natural England, 2021; Natural Resources Wales, 2022c), National Nature Reserves (NNRs; Natural England, 2022a; Natural Resources Wales 2022d), and Sites of Special Scientific Interest (SSSIs; Natural England, 2022b; Natural Resources Wales, 2022e) which were filtered to remove those designated solely for geological interest.
2.2.6 Potential for human exposure (receptor)
To provide a holistic assessment of risk associated with potential pollutant release, a measure of potential human exposure was required. Areas designated as Bathing Waters are those which are officially listed as being of appropriate quality for public use, and as such provide a good proxy for the potential level of human activity in each coastal area. To determine whether a waste deposit had potential to impact these waters, the Bathing Water Zone of Influence (ZOI) data, specifying the sub-catchments feeding each Bathing Water area, were assessed against landfill locations to determine which were located in these ZOIs. These were then classified accordingly if sites were wholly or partially co-located with ZOIs.
2.3 Prioritisation process
The first step in the prioritisation process was to determine which sites already received a degree of incidental coastal protection based on existing defence infrastructure or management plans. This was achieved by using the NCERM datasets of existing SMPs and coastal or tidal flood defences, covering coastal and estuarine settings, respectively. For the purpose of this analysis, a buffer distance of 500 m from the present-day shoreline was used as the definition of ‘coastal’, given that the spatial extent of the most extreme coastal erosion projections (455 m) were constrained within this boundary. Coastal sites were deemed to be ‘protected’ if either; 1) sites were located behind, but within 500 m, of sections of shoreline with a ‘Hold The Line’ SMP (where there is an aspiration to build or commitment to maintain artificial defences to maintain current shoreline position), and/or 2) sites were located behind, but within 500 m of, existing defences. Sites not meeting these criteria (though within 500 m of the coastline) were categorised as ‘unprotected’ for the operational purposes of this research. Sites which were beyond 500 m of the coastline were categorised as being ‘non-coastal’, and not included in the prioritisation analysis. This was repeated for each timescale (20, 50, 100-year projections) based on future SMPs and erosion projections, and each list of sites was subject to separate prioritisation analyses.
To prioritise the legacy landfill sites, a MCDA approach was implemented, specifically the Analytical Hierarchy Process (Sipahi and Timor, 2010). Following criteria selection and data processing, the resulting data ranges for each criterion were highly variable with different units of measurement. To allow these to be analysed concurrently, data were normalised using the score range procedure such that data were scaled to unitless values between 0 and 1 (Malcewski, 1999). For criteria where a higher original value represented higher risk (e.g. area at risk of coastal erosion and tidal flooding), the ‘benefit’ equation was applied (Equation 1a). Conversely, where a lower original value represented higher risk (e.g. shorter distance to sensitive receptors), the ‘cost’ equation (Eq. (1b) was used, where in both cases i relates to the data associated with the unique landfill site being assessed. For example, to calculate a normalised value representing the area at risk of coastal erosion for a particular deposit (using Equation 1a) and (1the) difference between the measured value for that deposit and the minimum measured value from all deposits would be divided by the range of measured values from all deposits.
Eq. (1): Score range procedure equations for (a) ‘benefit’ and (b) ‘cost’ methods (x’ij = scaled value for ith object of criterion j, xij = original value for ith object of criterion j, xjmin and xjmax are the minimum and maximum values within criterion j, respectively).
Eq. (2): ‘Rank Sum’ method for normalising criterion weights using assigned rankings (Wj = normalised weight of criterion j, n = number of criteria (k = 1, 2, … , n), rj = rank position of j).
Following the scaling of values, the criteria were weighted based on their relative importance using a straight rank, then weights were normalised to sum to one using the ‘rank sum’ method (Eq. (2)). Inherent to this approach is a degree of subjectivity during criteria weighting. Further to
Table 1for waste type (source) weighting, criteria within the pathway and receptor indices were also weighted on perceived relative importance. Within the pathway section, four criteria were used, in the following order of importance:
(1)historical erosion (proxy for current erosion)
(2)projected future erosion extent (these represent a direct release of contaminated waste to the coastal zone, and the reported higher importance of erosion over flooding for coastal waste release; Beaven et al., 2020)
(3)the area of a deposit within flood zone 3 and, finally
(4)the area of a deposit within flood zone 2 (order based on decreasing annual likelihood of flooding).
For receptor criteria, the highest weighted criterion was co-location with bathing water quality ZOIs (a proxy for potential human interaction), followed by proximity to Ramsar sites (internationally important designations), NNRs (nationally important designations), then non-geological SSSIs (national significance).
Standardised values from Eqss (1a), (1b) were multiplied by the normalised weights for each criterion (from Eq. 2) and summed to produce a score for each waste deposit in the database for the pathway and receptor terms. The source, pathway, and receptor scores were then multiplied to generate an overall risk score for each waste deposit (see Figure 1). The multiplication of these indices was crucial, and meant that in order to achieve a high risk score, a non-zero pollutant pathway score was required, i.e. a feasible pollutant linkage between source and receptor had to be confirmed.
FIGURE 1
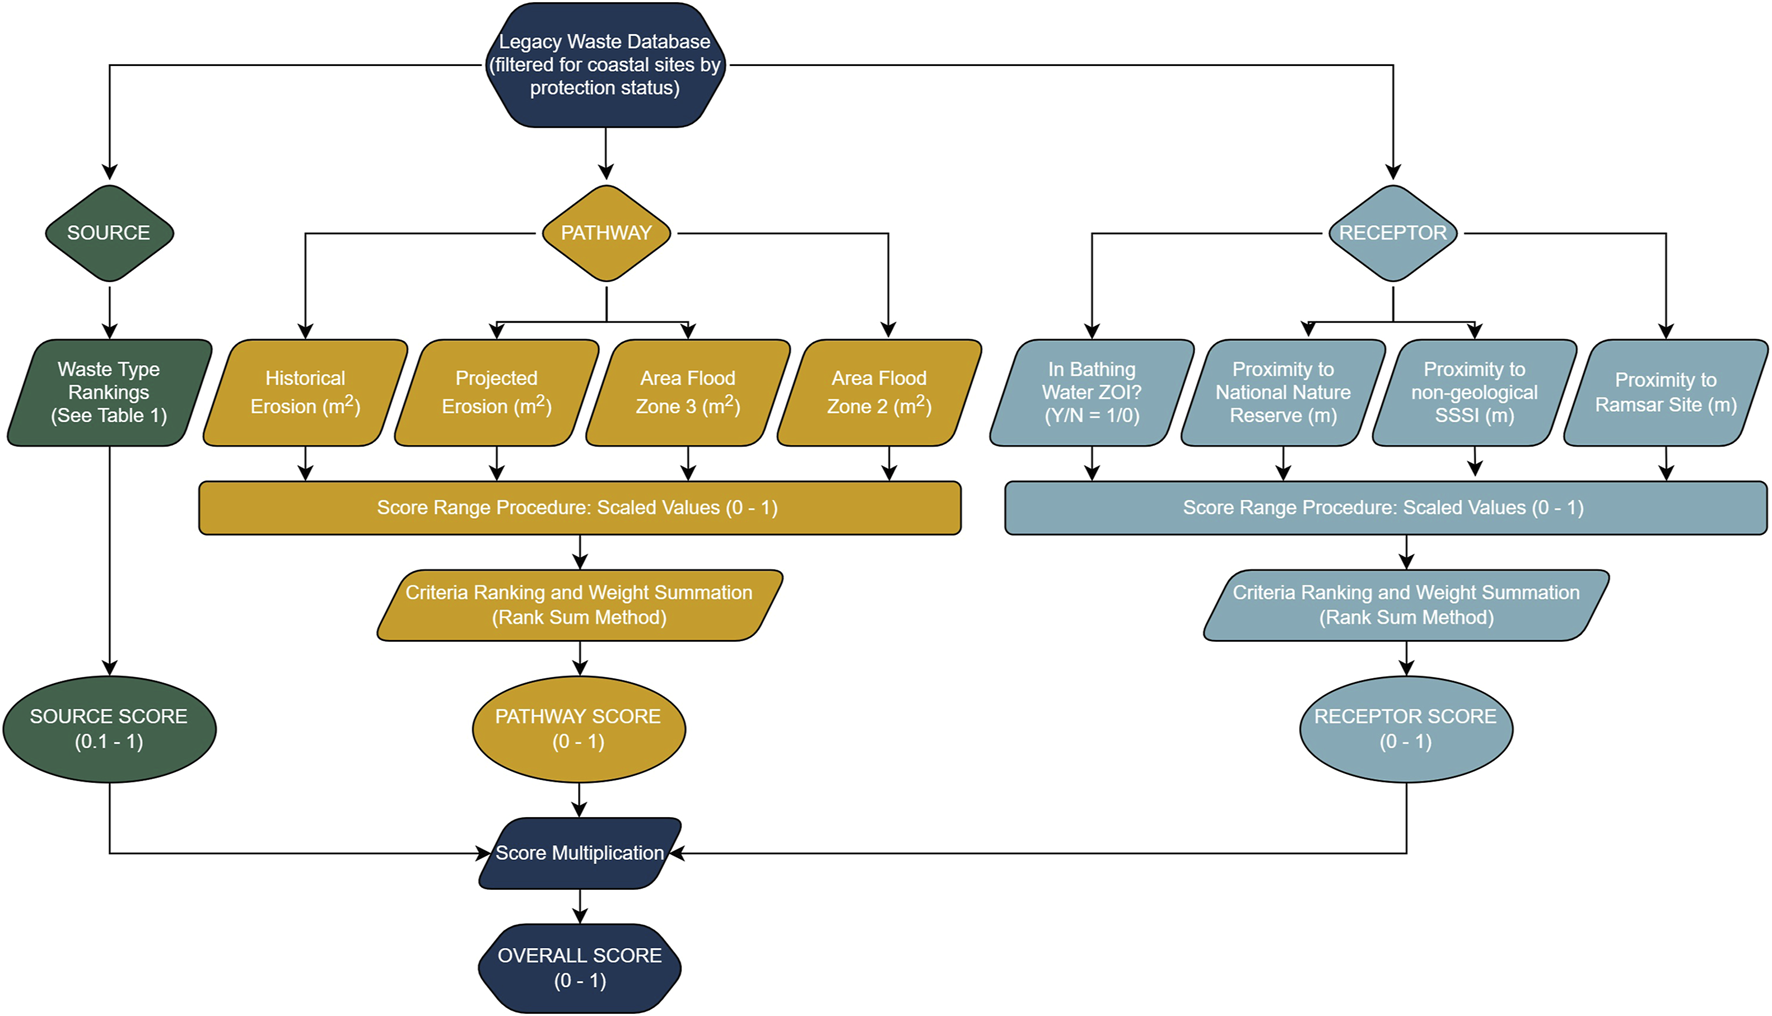
Overview of the multicriteria decision analysis method used to generate overall risk scores for each legacy waste disposal site.
3 Results
3.1 Legacy landfill database characteristics
The legacy landfill database contains information on 30,281 sites across inland and coastal areas. In terms of surface area, the coastal zone (the land within 500 m of the present-day coastline) had an average legacy waste density of 81,160 m2 per km2, approximately 10.5 times higher than the average inland density of wastes (7,711 m2 per km2). Analysis of the spatial distribution of these coastal legacy waste sites by RBDs (sub-divisions of land for management purposes within the WFD - see later Figure 5) indicated that the Humber RBD contained the highest area (approximately 6000 ha), with the Thames RBD also containing a substantial amount (approximately 5000 ha) in terms of total waste area (Figure 2). When considering area by protection status, however, it is apparent that the waste in these RBDs receive considerable protection by the Humber tidal defences and Thames Flood Barrier, respectively. The result of this is that only 10% of sites within the Thames RBD are considered as being higher risk in this analysis, and only a single site in the Humber RBD (Brickyard Lane, former Capper Pass and Son Ltd. Tin smelter) receives no protection. Despite ranking fourth in terms of total waste area, the Northumbria RBD has the highest area of unprotected wastes (1807 ha), representing approximately 72% of the waste deposited along its coastline. The differentiation of wastes based on existing protection status, therefore, is able to provide a more accurate assessment of the distribution of potentially problematic wastes.
FIGURE 2
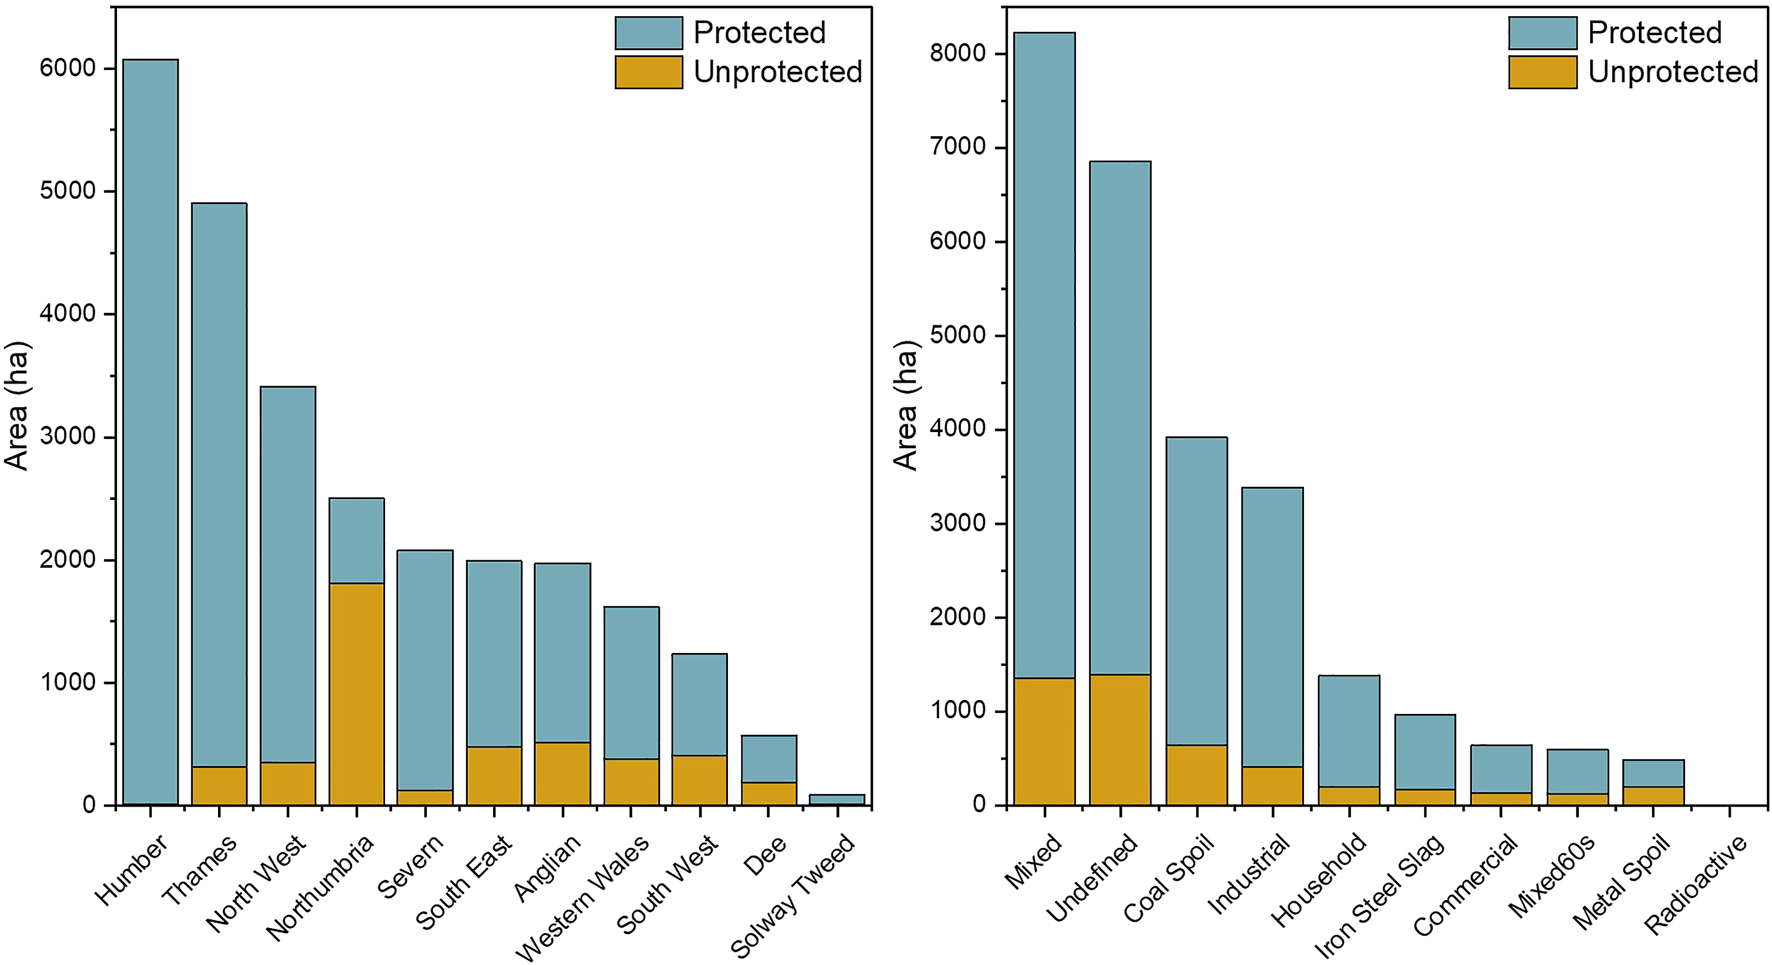
Total area of protected and unprotected coastal legacy waste deposits in England and Wales. Left: area per River Basin District (RBD). Right: area by identified waste type.
Figure 2 also indicates that the vast majority of legacy landfills were categorised as being ‘mixed’ wastes (8400 ha), or were unable to be defined (6800 ha) due predominantly to a lack of record keeping during landfill operation and closure. This high prevalence of mixed and undefined wastes in coastal landfills poses an inherently higher risk than those wastes which are well defined, given the unknown contents of the deposits and unknown interactions between the possible wastes that are co-disposed. The area of the two next most prevalent waste types, coal spoil and industrial (4000 and 3500 ha, respectively) was also high, given the coastal settings of many collieries, and the historical industrialisation of multiple estuaries around the United Kingdom. The majority of all waste types (by area) were categorised as being protected, though the proportion of unprotected metal spoil was higher than for other waste types. Only one coastal legacy waste site containing radioactive material was identified (Drigg Low Level Waste Repository; 3.9 ha; protected).
In terms of total area, most waste types were relatively evenly distributed across the coastline of England and Wales, with approximately 5–15% of each waste’s national coastal inventory distributed within each RBD (Figure 3). However, it was clear that certain waste types were relatively enriched within certain regions. Whilst mixed and undefined wastes were relatively more prevalent in the Thames RBD, presumably due to higher population density in this area, most other regionally-enriched wastes were related to industrial activity. The Humber RBD, which covers around 300 km of coastline (and Humber estuary) from Cleethorpes to Saltburn-by-the-Sea, contained 45% of all coastal industrial waste. Similarly, over 55% of coastal iron and steelmaking slags were situated within the North West of England, 56% of all coastal coal spoil were within the Northumbria RBD, and around 60% of all coastal metal spoil deposits (by area) were situated along the coastline of South West England (Figure 3), which is reflective of the dominant historical industries within those regions.
FIGURE 3

Relative distribution of waste types per RBD, calculated as the total area of each waste type per RBD as a percentage of the total national area of each waste type in coastal regions of England and Wales.
For most waste types (with the exception of metal and coal spoil deposits), it was possible to determine the year of last input to each site, which indicated that the majority of landfills within the dataset ceased operation prior to 1980, with the period between 1980 and 90 seeing the highest frequency of landfill closure (Figure 4). Of the dated landfill sites, it was apparent that these were skewed towards those dating from the latter half of the 20th century, likely through developments in environmental legislation requiring more accurate recording of waste disposal operations. The absence of accurate dates recorded for other waste types, particularly from older industries such as metal mining, also likely influenced this left-skewed age distribution.
FIGURE 4
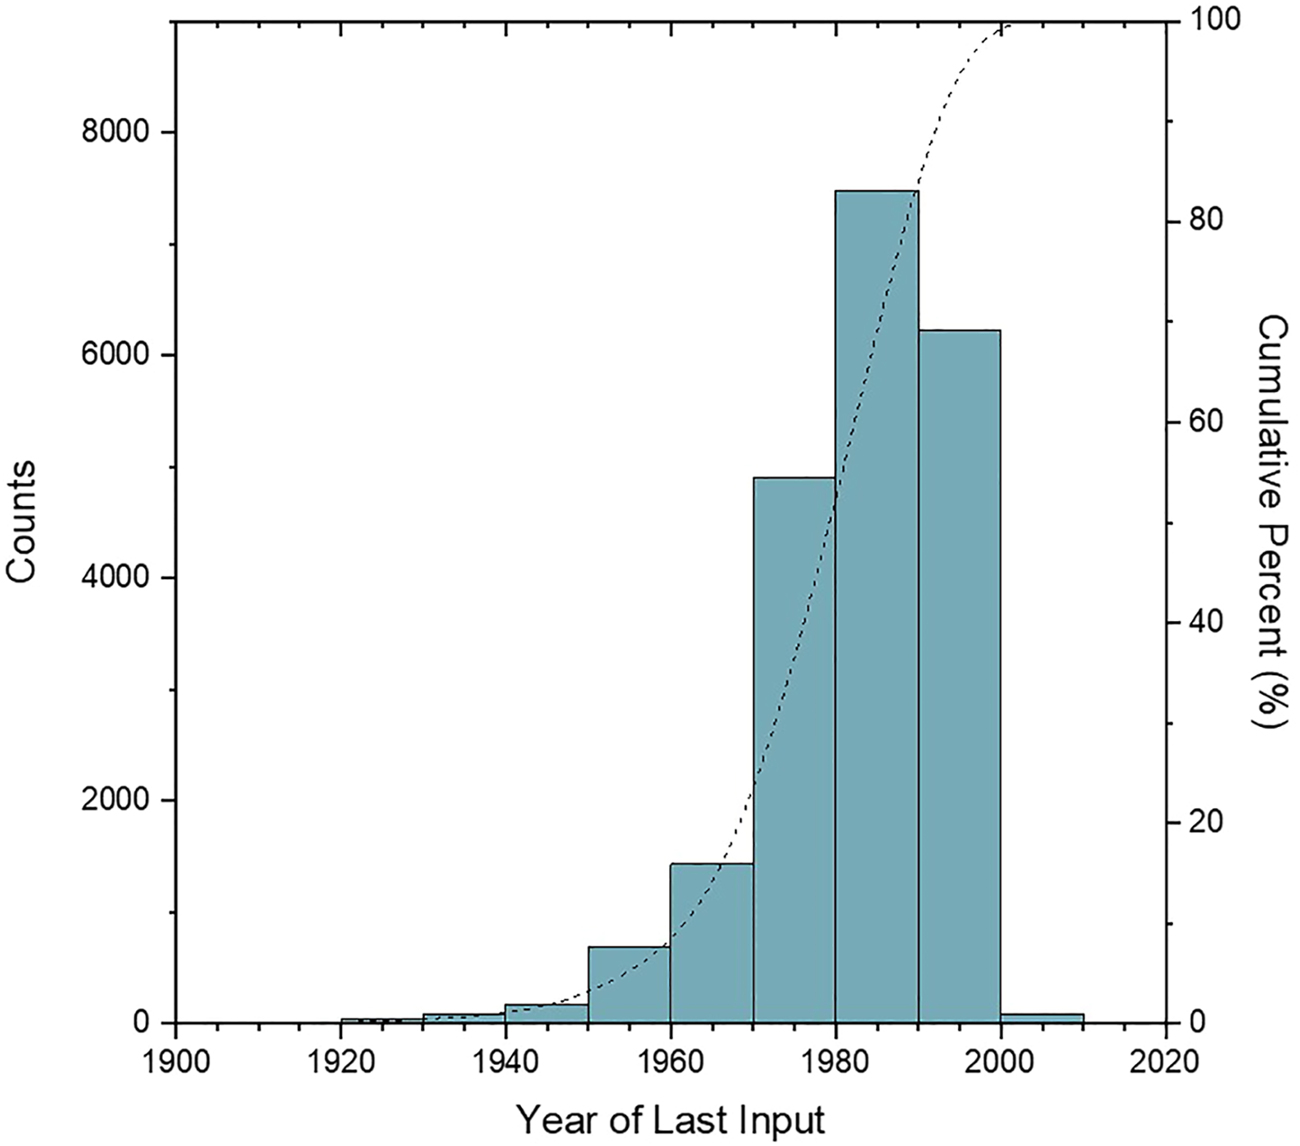
Year of last input for landfill sites within the legacy waste database (note that dates of last waste input were unavailable for coal and metal mine spoil deposits).
The spatial distribution of coastal wastes was assessed at a higher spatial resolution in Figure 5 by summarising data by Coastal and Transitional Waterbody areas, as defined within the WFD. The highest density of protected sites tended to be in highly populated estuarine settings, especially in the Thames Middle (n = 68; 1132 ha), Mersey (n = 67; 786 ha), and Medway (n = 53; 361 ha) estuaries. Many of the other water bodies which contained the highest numbers of protected waste sites were also transitional (Figure 5). Estuaries were once hubs of industrial waste-producing activities and so had, and continue to have, high human populations. The result of this is that many of the wastes in these areas are incidentally protected by flood barriers and defences aiming to protect this urban infrastructure.
FIGURE 5

The spatial distribution of protected and unprotected coastal legacy waste deposits in England and Wales per Water Framework Directive (WFD) Coastal and Transitional Waterbody (WB) delineation. Summaries are provided for WBs containing >20 waste deposits.
It is apparent that the majority of coastal and transitional waterbodies of England and Wales contain unprotected legacy wastes, yet strong regional variations exist. Of all 233 water bodies, the Tyne estuary contained the highest density of unprotected deposits, with 100 sites equating to a total area of 747 ha (Figure 5), which when coupled with the Tees (n = 42; 395 ha) and Wear (n = 26; 97 ha) estuaries, and the Tyne and Wear coastline (n = 21; 200 ha), further exemplifies the scale of the legacy waste issue along the north east coast of England and its post-industrial estuaries.
3.2 Landfill prioritisation (MCDA)
The MCDA analysis detailed in Figure 1 produced an overall risk score for each coastal legacy waste site (protected and unprotected), which may be used to compare the relative short, medium, and long-term risks. Sorting sites by these overall scores identifies those which may present a greater risk to the environment. Table 2 presents the 15 highest-ranked protected sites within the whole legacy waste database (England and Wales). All but one of these sites were categorised as containing undefined or mixed wastes, reflecting their higher frequency within the dataset as a whole (Figure 2), with many located within the Thames RBD. The areas of these priority sites were varied, with some smaller sites (e.g. Bathside, Rank #2, 14 ha) ranking higher than larger sites which were likely to contain more waste material (e.g. Shell Haven Refinery sites 1 and 2, Rank #4 and #8, 245 and 128 ha, respectively). This highlights the importance of not including total site area as a criterion in the MCDA, given that in reality only a portion of each landfill may be affected by coastal erosion or tidal flooding, and intervention is likely in scenarios where large volumes of waste began to erode (Brand and Spencer, 2018). When comparing risk projections over the three timescales (20, 50, 100-year projections), there was little change in the ranking of the top priority protected sites, which is likely related to the ongoing planned management at these locations. The exception to this, Hall Road (Crosby, Liverpool), is a site whereby the waste itself (predominantly bricks and rubble cleared during World War 2 ‘Blitz’ attacks on the city) forms the beach and intertidal zone. Presumably due to the hard nature of the material itself, no further erosion is projected beyond the 20-year estimate, and so its relative risk declines over time as other, more-rapidly eroding, sites present a greater relative risk in the future.
TABLE 2
| S | M | L | Site name | Latitude, longitude | RBD | Waste type | Area | |||
|---|---|---|---|---|---|---|---|---|---|---|
| Rank | Score | Rank | Score | Rank | Score | Decimal | ha | |||
| 1 | 0.319 | 1 | 0.319 | 1 | 0.319 | Bathside Bay | 51.941580, 1.273135 | Anglian | Undefined | 68 |
| 2 | 0.287 | 2 | 0.287 | 2 | 0.287 | Bathside | 51.942706, 1.282125 | Anglian | Mixed | 14 |
| 3 | 0.207 | 3 | 0.207 | 3 | 0.207 | Coastal Protection Works | 54.605837, -1.036550 | Northumbria | Undefined | 24 |
| 4 | 0.139 | 4 | 0.139 | 4 | 0.139 | Shell Haven Refinery 1 | 51.512178, 0.480165 | Thames | Undefined | 245 |
| 5 | 0.134 | 5 | 0.134 | 5 | 0.134 | Fobbing Marshes | 51.534152, 0.491875 | Thames | Mixed | 165 |
| 6 | 0.113 | 6 | 0.113 | 6 | 0.113 | Startrite | 51.394575, 0.570915 | Thames | Undefined | 9 |
| 7 | 0.102 | 16 | 0.043 | 42 | 0.019 | Hall Road | 53.507864, -3.062050 | North West | Undefined | 8 |
| 8 | 0.078 | 7 | 0.078 | 7 | 0.078 | Shell Haven Refinery 2 | 51.508409, 0.495055 | Thames | Undefined | 128 |
| 9 | 0.070 | 8 | 0.070 | 8 | 0.070 | Shotton Works | 53.231337, -3.064850 | Dee | Mixed | 15 |
| 10 | 0.068 | 9 | 0.068 | 9 | 0.068 | Giants Grave Tip | 51.645350, -3.831350 | Western Wales | Mixed | 38 |
| 11 | 0.066 | 10 | 0.066 | 10 | 0.066 | Leigh Controlled Tip | 51.535341, 0.628995 | Anglian | Commercial | 114 |
| 12 | 0.064 | 11 | 0.064 | 11 | 0.064 | Grange Farm No. 1 | 53.745609, -2.835850 | North West | Mixed | 44 |
| 13 | 0.057 | 12 | 0.057 | 12 | 0.057 | Redham Meade | 51.467711, 0.475685 | Thames | Undefined | 164 |
| 14 | 0.047 | 13 | 0.047 | 13 | 0.047 | Rushenden Marshes | 51.406802, 0.730515 | Thames | Undefined | 42 |
| 15 | 0.047 | 14 | 0.047 | 14 | 0.047 | Rainham Marshes | 51.504723, 0.196035 | Thames | Undefined | 92 |
The 15 highest-priority protected coastal legacy waste sites in England and Wales (n = 2550). ‘Score’ is the combined risk index (Figure 1), S = short-term (20-year), M = medium-term (50-year), L = long-term (100-year). Sites are ranked based on 20-year risk scores.
Of the 15 highest priority unprotected sites, a wider variety of waste types was encountered, with Mixed wastes from the 1960s, household, industrial (likely fly ash given the association with Fawley Power Station), iron and steelmaking slag, and coal spoil being identified (Table 3). The highest priority unprotected site, Mostyn Docks, is located entirely below the mean high water mark of the Dee Estuary, and may be related to reported cases of unregulated dumping of dredged material within the estuary (BBC, 2004). Whereas many of the high-priority protected sites were located within the Thames RBD, the distribution of priority unprotected sites is much wider, falling largely within and along former industrial estuaries and coastlines in the North West and North East of England. The truncated national lists in Tables 2 and 3 provide an overview of relative risks between all sites in the database; however, regional assessments can be made using the complete prioritised database (in Supporting Data) to inform management decisions.
TABLE 3
| S | M | L | Site name | Latitude, longitude | RBD | Waste type | Area | |||
|---|---|---|---|---|---|---|---|---|---|---|
| Rank | Score | Rank | Score | Rank | Score | Decimal | ha | |||
| 1 | 0.278 | 1 | 0.278 | 1 | 0.278 | Mostyn Docks 1 | 53.334083, -3.2662461 | Dee | Mixed | 130 |
| 2 | 0.254 | 2 | 0.254 | 2 | 0.254 | Mostyn Docks 2 | 53.321382, -3.2560063 | Dee | Mixed | 12 |
| 3 | 0.164 | 3 | 0.164 | 3 | 0.164 | Vange Marshes | 51.543102, 0.4956379 | Thames | Mixed 1960s | 96 |
| 4 | 0.065 | 4 | 0.065 | 4 | 0.065 | Connah’s Quay Power Station | 53.238255, -3.1008099 | Dee | Mixed | 30 |
| 5 | 0.044 | 5 | 0.044 | 5 | 0.044 | Dunes Seaton Snook | 54.644656, -1.1666832 | Northumbria | Undefined | 11 |
| 6 | 0.034 | 6 | 0.034 | 6 | 0.034 | South of Burfields Road | 50.812366, -1.0486987 | South East | Household | 59 |
| 7 | 0.034 | 7 | 0.034 | 7 | 0.034 | CEGB Fawley Power Station | 50.819686, -1.3280571 | South East | Industrial | 59 |
| 8 | 0.031 | 8 | 0.031 | 9 | 0.031 | Ropers Farm | 51.578285, 0.77385355 | Anglian | Undefined | 58 |
| 9 | 0.031 | 10 | 0.031 | 10 | 0.031 | Millom Pier | 54.212723, -3.2526028 | North West | Iron Steel Slag | 22 |
| 10 | 0.031 | 11 | 0.031 | 11 | 0.031 | Strand | 51.395802, 0.56663813 | Thames | Undefined | 9 |
| 11 | 0.030 | 9 | 0.031 | 8 | 0.032 | Dawdon Blast Beach | 54.823994, -1.3235915 | Northumbria | Coal Spoil | 17 |
| 12 | 0.029 | 12 | 0.029 | 12 | 0.029 | Cobholm Tip | 52.605592, 1.7051262 | Anglian | Mixed | 37 |
| 13 | 0.026 | 13 | 0.026 | 13 | 0.026 | Overtons | 51.394631, 0.57370315 | Thames | Undefined | 8 |
| 14 | 0.022 | 14 | 0.022 | 14 | 0.022 | NE Hartlepool Power Street | 54.63879, -1.1801744 | Northumbria | Mixed | 17 |
| 15 | 0.021 | 15 | 0.021 | 15 | 0.021 | Wat Tyler way | 51.551666, 0.49845812 | Thames | Mixed | 45 |
The 15 highest-priority unprotected coastal legacy waste sites in England and Wales (n = 669). S = short-term (20-year), M = medium-term (50-year), L = long-term (100-year). Sites are ranked based on 20-year risk scores.
4 Discussion
4.1 General patterns and geographical distribution of legacy waste sites
Of the 30,281 legacy waste deposits across England and Wales recorded within the dataset, the risk assessment and prioritisation exercise identified 669 priority unprotected sites and 2550 protected sites along the coastline and estuary margins. The study advances previous risk assessments of coastal landfills in the United Kingdom through using a higher number of input sites (due to greater spatial extent), the inclusion of a larger variety of specified waste types, and by using conceptual site model approaches to incorporate pollutant linkages into prioritisation methods. As such, despite the larger number of input sites considered (n = 30,281), a more constrained number of high-priority sites (n = 669) has been determined, compared to values reported elsewhere (n= >1200 in England; Brand et al., 2018; O’Shea et al., 2018).
The separation of sites based on the operational classifications of protection status will be of use in environmental management, given that most of the protected sites will likely be known and surveyed already by regulatory authorities and managers as part of routine SMP or coastal defence planning works. Hence, the unprotected sites represent those which are less-likely to have been considered before in coastal management settings. It is important to note that whilst protected and unprotected sites have been separated to highlight the likelihood of higher risk of contaminant transfer where no formal defences or ‘hold the line’ management strategies are in place, this does not mean that the risk of contaminant transfer at protected sites is zero. Pathways associated with subterranean leachate plumes, which were not considered in this assessment given the lack of reliable input data, may still create a source-to-receptor pathway, although significant attenuation would be anticipated in estuarine or coastal sediments (Njue et al., 2012; O’Shea et al., 2018).
This assessment also highlights the issue of uncertainty around contaminant risks at sites in which mixed or undefined wastes were disposed, which were the most dominant in terms of total area (Figure 2) and in higher-priority sites (Table 2 and 3). The co-disposal of wastes in this manner may lead to interactions of leaching products from the different wastes, leading to contaminant transport which is very difficult to predict and quantify within a single site. Even for relatively benign by-products with low leachability (e.g. iron-making slags: Foekema et al., 2021), there are examples of sites where these wastes encapsulate or protect more hazardous materials (e.g. Barrow-in-Furness, Cumbria; Carnforth slag bank, Lancashire: Riley et al., 2020) where site specific investigations would be required to provide a full assessment of potential contaminant linkages. It is also the case that the eroded face of a waste deposit, particularly one containing co-disposed wastes) may not be homogenous or constant over time due to variations in disposal patterns during operation. Such a possibility highlights the need for periodical analysis of eroding material to determine any major changes in risk as deposits are eroded and new faces of waste exposed.
The scoring of the source term within the presented method is at present based on a review of published data on the potential leaching behaviour of priority hazardous substances (Table 1). There was only one nuclear waste disposal site that fell within the coastal screening boundary so, despite the higher weighting here, which reflects regulatory concerns, most of the high priority wastes encountered were of mixed or unknown waste types. However, whilst good leaching data are available for certain waste types such as steelmaking slags (Foekema et al., 2021), incineration bottom ashes (Yin et al., 2018) and mixed municipal and construction wastes (Solo-Gabriele et al., 2020), the availability of systematic data describing leaching products is limited for other waste types. Furthermore, most leaching studies usually apply deionised water as the leachant, which may not be reflective of actual leaching processes in coastal locations, where a range of saline conditions are to be expected, related to direct contact with marine or estuarine waters and saline groundwater intrusion. Where leaching tests have taken place using high ionic strength solutions, there is some evidence of exacerbated release of contaminants such as cadmium and zinc due to the formation of chloride complexes (Shanmuganathan et al., 2008; Schmukat et al., 2012; Brand and Spencer, 2018). It is not always the case that leaching behaviour can be directly inferred from the bulk elemental composition of wastes, stressing the importance of robust leachate data for coastal wastes across a range of ionic strengths. Improved and systematic composition and saline leaching data for a range of common coastal waste deposits is a research need that could see further improvements made to this prioritisation method, by reducing the degree of subjectivity within waste rankings.
Geographical differences in waste distribution were observed between coastal regions of England and Wales. Municipal (household and mixed) waste landfills, being associated with urbanised locations, were encountered within most regions, particularly where population density is high, such as Thames and South East of England RBDs (Figure 5). However, wastes originating from certain industrial sources were more geographically constrained. Iron and steelmaking slags were particularly concentrated in the North West of England RBD, which contains notable centres of historical metal production on the Furness peninsula and Cumbrian coastline (Lee, 1974). A previous assessment of the distribution of legacy ironmaking slags identified Cumbria as containing over 55 million cubic metres of slag, with substantial coastal deposits located at Maryport, Workington, and Millom (Riley et al., 2020); the latter ranking within the top 15 unprotected sites in this analysis given direct disposal in the Duddon Estuary (Table 3).
Coal mining wastes are concentrated around major historical coalfields of Northumbria and Durham (Northumbrian RBD) and the South Wales Coalfield (Western Wales RBD; Figure 5), where coal spoil was frequently tipped in coastal areas, in some cases having significant local impacts on coastline geomorphology (Cooper et al., 2017). Likewise, the majority of coastal legacy metal spoil deposits were located within one RBD, with over 60% within the South West of England RBD. The total area of mining spoil (metal and coal) within coastal regions of the South West has previously been estimated at up to nine million m2 (Riley et al., 2021), which is a result of centuries of mining heritage in this region (particularly tin and copper mining, Jordan et al., 2020). Despite the large presence of mining wastes in this region, this prioritisation exercise (and that in Riley et al., 2021) reported a generally lower-risk at these sites given that many are located on hard clifftops less-susceptible to tidal flooding (Rainbow, 2020).
Industrial wastes are concentrated in the estuaries of the Humber and Mersey, which have been traditional centres for petrochemical, chemical and non-ferrous metal industries (Comber et al., 1995). Relatively few of these industrial sites score highly in the prioritisation given extensive tidal flood protection and channelisation in these estuaries (Lee, 1974). The relatively small number of sites in these estuaries that do score more highly are typically sites falling outside of formal defences with known pollution issues (e.g. Brickyard Lane, Sn smelter waste in the Humber, Rawlins et al., 2006) or sites where wastes were deposited in water bodies as part of land reclamation (e.g. Wigg Works Tip, Mersey, where wastes from soda ash production were deposited with wastes from copper extraction and mustard gas production; Wood et al., 2015). It is apparent that the inclusion of additional waste types within this analysis (beyond municipal wastes) has allowed for spatial variations such as these to be quantified, and will assist in regional coastal planning and management of legacy wastes which may have previously been overlooked.
4.2 Management implications
The prioritisation method applied here has explicitly followed the framework commonly used in assessing pollution risks: the conceptual site model. As such, the outputs provide regional-to-national-scale information that can inform coastal managers of key sites within their region which may require more in-depth site surveys. Whilst based on robust national-scale datasets, it is important to state that the prioritised output should be viewed only as a relative measure of risk between sites. Furthermore, there is an inherent sensitivity within the output scores to the input data used, and so future iterations of the analysis should use the most-recent input data (e.g. the anticipated update of the NCERM coastal erosion estimates). Having the prioritised output based on RBDs, which broadly align to the shoreline management cells of the United Kingdom, and more locally transitional and coastal water bodies used by environmental regulators for routine ambient monitoring, provides a basis to feed into existing management processes such as River Basin Management Plans and Shoreline Management Plans. In the first instance, the outputs from the screening could help prompt regulators and managers on a regional basis to gather more site specific information (e.g. on coastal/flood defence assets, known local pollution issues) which could permit reappraisal of the prioritisation. Some of the priority sites identified include those locations that have already been subject to remediation efforts or remedial planning where local concerns were apparent, and provide useful demonstration sites for effective remedial interventions (e.g. Cooper et al., 2013). These include the mixed (coal spoil and Municipal Solid Waste (MSW)) Lynemouth landfill in Northumberland (Cooper et al., 2017), coastal slag deposits in the north west where stability concerns have been raised (Cumbria County Council, 2018), Trow Quarry MSW in Tyne and Wear where extensive remedial works have taken place (Cooper et al., 2017) and Dawdon Blast Beach where removal and regrading of coal spoil has taken place (Heritage Coast, 2021).
There are only a small number of coastal water bodies around England and Wales without any protected or unprotected coastal legacy waste sites (69 of 233 water bodies; Figure 5). However, the spatial distribution of priority sites is highly skewed with a large number in heavily industrialised or urbanised estuaries, such as the Thames, Medway, Solent, Humber, Mersey, Tyne, and Wear. In such water bodies, the large number of potential estuarine and upstream pollution sources makes it particularly challenging to apportion effects from any individual site on compromising the chemical or ecological status of receiving water bodies at downstream compliance points. In some cases, contaminant release from individual legacy coastal waste sites has been demonstrated (e.g. Lodmoor Marsh, Dorset, United Kingdom: Njue et al., 2012; Hadleigh Marsh, Essex, United Kingdom: Brand and Spencer, 2020), however coastal legacy waste sites are not the only source of contamination to the coastal zone. A future research need is to evaluate the contribution of legacy waste sites in the context of the overall pollution burden to marine environments from all sources, including contaminant transfers from upstream sources, which may be significant in many areas draining former orefields or inland post-industrial urban districts (e.g. Mayes et al., 2013).
5 Conclusion
This study has used a suite of datasets to provide a national-scale risk assessment of legacy waste sites in the coastal zone of England and Wales by adopting a conceptual site model (Source-Pathway-Receptor) approach to screening risks. A total of 30,281 legacy waste sites were identified across England and Wales, of which 3,219 were in the coastal zone. On average, the coastal areas of England and Wales had a 10.5 times higher density of legacy waste deposition than inland areas. There are 669 legacy landfill sites in coastal areas without any active protection (e.g. flood barriers, ‘hold-the line’ coastal management strategy) and 2550 sites in coastal areas that are protected to some degree. The geographic distribution of these waste sites shows particular aggregations in heavily-urbanised and/or post-industrial estuaries such as the Thames, Medway, Solway, Mersey, Tyne, Tees and Wear. Whilst mixed or undefined wastes are the most common waste categories amongst high risk sites, there are clear regional patterns in the distribution of industrial wastes, with coal mining wastes predominantly in the north east of England and south Wales; metal mining wastes in the south west of England; iron and steel production wastes prevalent along the north west coast of England, and municipal wastes concentrated in the south East of England. These newly-quantified distributions are of key significance given the unique hazards which may originate from these waste types, which will disproportionately affect certain regions and require specific management interventions and associated spending. The prioritisation method presented will help to inform strategies for climate adaptation, specifically in the context of how to effectively manage contaminated legacy waste sites, at which environmental risks could increase with a rapidly changing climate. A framework is also provided which could be used to assess risk at other potentially polluting sites where liability for remediation is absent. Future research priorities to refine the prioritisation system should include 1) improved national databases of waste composition and, 2) more comprehensive contaminant mobilisation data across a range of hydrogeochemical conditions for legacy waste types. Such knowledge will underpin more robust ecological risk assessments at coastal waste sites and thereby help protect vitally important coastal habitat into the future.
Statements
Data availability statement
The original contributions presented in the study are included in the article/supplementary material, further inquiries can be directed to the corresponding author.
Author contributions
AR led the method development and performed all data analysis. AR and WM prepared the initial draft manuscript, and all other authors continuously contributed to method development through discussion, and provided valuable input into draft revisions. KH, AJ, BS, and WM were responsible for funding acquisition.
Funding
This work was funded by the Natural Environment Research Council (NERC) under grant numbers NE/T003022/1, NE/T003200/1, NE/T003286/1 and NE/T002824/1 (Legacy wastes in the coastal zone: Environmental risks and management futures).
Acknowledgments
The authors would like to thank Hugh Potter (Environment Agency) for provision of some of the mine-related spatial data, and our project partners at the Environment Agency, Scottish Environmental Protection Agency, Natural Resources Wales, Royal Haskoning DHV, National Trust, Coal Authority, and CL:AIRE for their valued constructive input throughout the development of this process.
Conflict of interest
The authors declare that the research was conducted in the absence of any commercial or financial relationships that could be construed as a potential conflict of interest.
Publisher’s note
All claims expressed in this article are solely those of the authors and do not necessarily represent those of their affiliated organizations, or those of the publisher, the editors and the reviewers. Any product that may be evaluated in this article, or claim that may be made by its manufacturer, is not guaranteed or endorsed by the publisher.
Supplementary material
The Supplementary Material for this article can be found online at: https://www.frontiersin.org/articles/10.3389/fenvs.2022.1045482/full#supplementary-material
Abbreviations
BNG, British National Grid; C&D, Construction and Demolition; CSM, Conceptual Site Model; EA: Environment Agency; GB, Great Britain; GIS, Geographical Information Systems; MCDA, Multicriteria Decision Analysis; MSW, Municipal Solid Waste; NCERM, National Coastal Erosion Risk Mapping; NNR, National Nature Reserve; NRW, Natural Resources Wales; OS, Ordnance Survey; PCB, Polychlorinated Biphenyl; PFAS, Perfluoroalkyl or Polyfluoroalkyl Substances; PFOA, Perfluorooctanoic Acid; POP, Persistent Organic Pollutant; RBD, River Basin District; SMP, Shoreline Management Plan; SPR, Source Pathway Receptor; SSSI, Site of Special Scientific Interest; United Kingdom, United Kingdom; WFD, Water Framework Directive; ZOI, Zone of Influence.
References
1
AhrensM. J.MorriseyD. J. (2005). “Biological effects of unburnt coal in the marine environment,” in Oceanography and marine biology (CRC Press), 79.
2
BeavenR. P.StringfellowA. M.NichollsR. J.HaighI. D.KebedeA. S.WattsJ. (2020). Future challenges of coastal landfills exacerbated by sea level rise. Waste Manag.105, 92–101. 10.1016/j.wasman.2020.01.027
3
BrandJ. H.SpencerK. L.O’SheaF. T.LindsayJ. E. (2018). Potential pollution risks of historic landfills on low-lying coasts and estuaries. WIREs Water5, e1264. 10.1002/wat2.1264
4
BrandJ. H.SpencerK. L. (2018). Risk screening assessment for ranking historic coastal landfills by pollution risk. Anthr. Coasts1 (1), 44–61. 10.1139/anc-2018-0001
5
British Broadcasting Corporation (Bbc) (2004). BBC News: Dredgers fined for estuary dumping. Available at: http://news.bbc.co.uk/1/hi/wales/north_east/3858071.stm (Accessed September 5, 2022).
6
ComberS. D. W.GunnA. M.WhalleyC. (1995). Comparison of the partitioning of trace metals in the Humber and Mersey estuaries. Mar. Pollut. Bull.30 (12), 851–860. 10.1016/0025-326x(95)00092-2
7
CooperN. J.BensonN.McNeillA.SiddleR. (2017). Changing coastlines in NE England: A legacy of colliery spoil tipping and the effects of its cessation. Proc. Yorks. Geol. Soc.61 (3), 217–229. 10.1144/pygs2016-369
8
CooperN. J.BowerG.TysonR.FlikweertJ. J.RaynerS.HallasA. (2013). Guidance on the management of landfill sites and land contamination on eroding or low-lying coastlines (C718). Construction Industry Research and Information Association CIRIA.
9
Cumbria County Council (2018). Cumbria coastal strategy - engagement summary. UK: Cumbria County Council. Available at: https://www.cumbria.gov.uk/elibrary/Content/Internet/544/17312/43413152620.pdf (Accessed August 15, 2022).
10
Environment Agency (2016). Environmental quality standards directive (EQSD) list for WFD assessments. Available at: https://www.gov.uk/government/publications/list-of-chemicals-for-water-framework-directive-assessments/environmental-quality-standards-directive-eqsd-list-for-wfd-assessments (Accessed September 8, 2022).
11
Environment Agency (2022c). Flood map for planning (rivers and sea). Flood Zone 3. Available at: https://www.data.gov.uk/dataset/bed63fc1-dd26-4685-b143-2941088923b3/flood-map-for-planning-rivers-and-sea-flood-zone-3 (Accessed September 8, 2022).
12
Environment Agency (2022d). Flood map for planning (rivers and sea). Flood Zone 2. Available at: https://www.data.gov.uk/dataset/cf494c44-05cd-4060-a029-35937970c9c6/flood-map-for-planning-rivers-and-sea-flood-zone-2 (Accessed September 8, 2022).
13
Environment Agency (2022a). Historic landfill sites. Available at: https://data.gov.uk/dataset/17edf94f-6de3-4034-b66b-004ebd0dd010/historic-landfill-sites (Accessed June 4, 2022).
14
Environment Agency (2022b). National coastal erosion risk mapping (NCERM). National 2018-2021. Available at: https://www.data.gov.uk/dataset/7564fcf7-2dd2-4878-bfb9-11c5cf971cf9/national-coastal-erosion-risk-mapping-ncerm-national-2018-2021 (Accessed August 16, 2022).
15
FoekemaE. M.TamisJ. E.BlancoA.van der WeideB.SonneveldC.KleissenF.et al (2021). Leaching of metals from steel slag and their ecological effects on a marine ecosystem: Validating field data with mesocosm observations. Environ. Toxicol. Chem.40 (9), 2499–2509. 10.1002/etc.5132
16
FollandW. R.NewstedJ. L.FitzgeraldS. D.FuschmanP. C.BradleyP. W.KernJ.et al (2016). Growth and reproductive effects from dietary exposure to Aroclor 1268 in mink (Neovison vison), a surrogate model for marine mammals. Environ. Toxicol. Chem.35 (3), 604–618. 10.1002/etc.3201
17
GiustiL. (2001). Heavy metal contamination of Brown seaweed and sediments from the UK coastline between the Wear river and the Tees river. Environ. Int.26 (4), 275–286. 10.1016/s0160-4120(00)00117-3
18
HamiltonE. I. (1999). The role of near-shore industrial waste releases in the dispersion of radionuclides in the NE Irish Sea. J. Environ. Radioact.44 (2-3), 297–333. 10.1016/s0265-931x(98)00138-6
19
HarradS. J.SewartA. P.AlcockR.BoumphreyR.BurnettV.Duarte-DavidsonR.et al (1994). Polychlorinated biphenyls (PCBs) in the British environment: Sinks, sources and temporal trends. Environ. Pollut.85, 131–146. 10.1016/0269-7491(94)90079-5
20
Heritage Coast (2021). Turning the tide. Heritage Coast Available at: https://durhamheritagecoast.org/ourstory/history/turning-the-tide/(Accessed April 19, 2022).
21
Hm Government (2012). Contaminated land statutory guidance. London: Department for Environment Food & Rural Affairs. Environmental protection act 1990: Part 2A.
22
IrfanM.HoudayerB.ShahH.KojA.ThomasH. (2019). GIS-based investigation of historic landfill sites in the coastal zones of Wales (UK). EuroMediterr. J. Environ. Integr.4 (1), 26. 10.1007/s41207-019-0116-y
23
JarvisA. P.YoungerP. L. (2000). Broadening the scope of mine water environmental impact assessment: A UK perspective. Environ. Impact Assess. Rev.20 (1), 85–96. 10.1016/s0195-9255(99)00032-3
24
JordanA.HillR.TurnerA.RobertsT.ComberS. (2020). Assessing options for remediation of contaminated mine site drainage entering the river teign, southwest England. Minerals10 (8), 721. 10.3390/min10080721
25
KamiyaK.OzasaK.AkibaS.NiwaO.KodamaK.TakamuraN.et al (2015). Long-term effects of radiation exposure on health. Lancet386 (9992), 469–478. 10.1016/s0140-6736(15)61167-9
26
Le CozannetG.GarcinM.BulteauT.MirgonC.YatesM. L.MéndezM.et al (2013). An AHP-derived method for mapping the physical vulnerability of coastal areas at regional scales. Nat. Hazards Earth Syst. Sci.13, 1209–1227. 10.5194/nhess-13-1209-2013
27
LeeA. R. (1974). Blastfurnace and steel slag. Production properties and uses. Edward Arnold Ltd. London., 128.
28
MalcewskiJ. (1999). GIS and multicriteria decision analysis. New Jersey: Wiley.
29
Martín-TorreM. C.PayánM. C.VerbinnenB.CozA.RuizG.VandecasteeleC.et al (2015). Metal release from contaminated estuarine sediment under pH changes in the marine environment. Arch. Environ. Contam. Toxicol.68 (3), 577–587. 10.1007/s00244-015-0133-z
30
MatthewsG. V. T. (1993). The ramsar convention on wetlands: Its history and development. Gland, Switzerland: Ramsar Convention Bureau.
31
MayesW. M.JohnstonD.PotterH. A. B.JarvisA. P. (2009). A national strategy for identification, prioritisation and management of pollution from abandoned non-coal mine sites in England and Wales. I.: Methodology development and initial results. Sci. Total Environ.407 (21), 5435–5447. 10.1016/j.scitotenv.2009.06.019
32
MayesW. M.PotterH. A. B.JarvisA. P. (2013). Riverine flux of metals from historically mined orefields in England and Wales. Water Air Soil Pollut.224 (2), 1425–1514. 10.1007/s11270-012-1425-9
33
Natural England (2022a). National nature Reserves (England). https://www.data.gov.uk/dataset/726484b0-d14e-44a3-9621-29e79fc47bfc/national-nature-reserves-england (Accessed August 16, 2022).
34
Natural England (2021). Ramsar (England). Available at: https://www.data.gov.uk/dataset/67b4ef48-d0b2-4b6f-b659-4efa33469889/ramsar-england (Accessed August 16, 2022).
35
Natural England (2022b). Sites of special scientific interest (England). Available at: https://www.data.gov.uk/dataset/5b632bd7-9838-4ef2-9101-ea9384421b0d/sites-of-special-scientific-interest-england (ccessed August 16, 2022).
36
Natural Resources Wales (2022b). Flood map for planning flood zones 2 and 3. Available at: https://www.data.gov.uk/dataset/814596db-43db-4894-af32-5bc3e3a1f641/flood-map-for-planning-flood-zones-2-and-3 (Accessed September 9, 2022).
37
Natural Resources Wales (2021). Historic landfill sites. Available at: https://lle.gov.wales/catalogue/item/HistoricLandfillSites/?lang=en (Accessed June 4, 2022).
38
Natural Resources Wales (2022a). National coastal erosion risk management (NCERM). Available at: http://lle.gov.wales/catalogue/item/NCERM (Accessed August 16, 2022).
39
Natural Resources Wales (2022d). National nature Reserves (NNR). Available at: https://lle.gov.wales/catalogue/item/ProtectedSitesNationalNatureReserves/?lang=en (Accessed August 16, 2022).
40
Natural Resources Wales (2022c). Ramsar Wetlands of international importance. Available at: https://lle.gov.wales/catalogue/item/ProtectedSitesRamsarWetlandsOfInternationalImportance/?lang=en (Accessed August 16, 2022).
41
Natural Resources Wales (2022e). Sites of special scientific interest (SSSI). Available at: https://lle.gov.wales/catalogue/item/ProtectedSitesSitesOfSpecialScientificInterest/?lang=en (Accessed August 16, 2022).
42
NeitzelP. L.SchneiderP.SchlumprechtH. (2002). “Physico-chemical surface water conditions of catchments with metallogenic origin: A contribution to the establishment of the ec water framework directive 2000/60/EG in Germany,” in Uranium in the aquatic environment (Berlin, Heidelberg: Springer), 77.
43
NichollsR. J.BeavenR. P.StringfellowA.MonfortD.Le CozannetG.WahlT.et al (2021). Coastal landfills and rising sea levels: A challenge for the 21st century. Front. Mar. Sci.8, 710342. 10.3389/fmars.2021.710342
44
NjueC. N.CundyA. B.SmithM.GreenI. D.TomlinsonN. (2012). Assessing the impact of historical coastal landfill sites on sensitive ecosystems: A case study from Dorset, southern England. Estuar. Coast. Shelf Sci.114, 166–174. 10.1016/j.ecss.2012.08.022
45
O'BrienR. M.SmitsK. M.SmithN. M.SchwartzM. R.CrouseD. R.PhelanT. J. (2021). Integrating scientific and local knowledge into pollution remediation planning: An iterative conceptual site model framework. Environ. Dev.40, 100675. 10.1016/j.envdev.2021.100675
46
O’SheaF. T.CundyA. B.SpencerK. L. (2018). The contaminant legacy from historic coastal landfills and their potential as sources of diffuse pollution. Mar. Pollut. Bull.128, 446–455. 10.1016/j.marpolbul.2017.12.047
47
RainbowP. S. (2020). Mining-contaminated estuaries of Cornwall - field research laboratories for trace metal ecotoxicology. J. Mar. Biol. Assoc. U. K.100, 195–210. 10.1017/s002531541900122x
48
RileyA. L.MacDonaldJ. M.BurkeI. T.RenforthP.JarvisA. P.Hudson-EdwardsK. H. E.et al (2020). Legacy iron and steel wastes in the UK: Extent, resource potential, and management futures. J. Geochem. Explor.219, 106630. 10.1016/j.gexplo.2020.106630
49
RileyA. L.OnnisP.JenningsE.CraneR. A.Hudson-EdwardsK. A.ComberS. D. W.et al (2021). A GIS-based prioritisation of coastal legacy mine spoil deposits in England and Wales for effective future management. Newport, Wales: International Mine Water Association Conference 2021.
50
RobinsP. E.SkovM. W.LewisM. J.GiménezL.DaviesA. G.MalhamS. K.et al (2016). Impact of climate change on UK estuaries: A review of past trends and potential projections. Estuar. Coast. Shelf Sci.169, 119–135. 10.1016/j.ecss.2015.12.016
51
SchmukatA.DuesterL.EckerD.SchmidH.HeilC.HeiningerP.et al (2012). Leaching of metal(loid)s from a construction material: Influence of the particle size, specific surface area and ionic strength. J. Hazard. Mater.227, 257–264. 10.1016/j.jhazmat.2012.05.045
52
ShanmuganathanP.LakshmipathirajP.SrikanthS.NachiappanA. L.SumathyA. (2008). Toxicity characterization and long-term stability studies on copper slag from the ISASMELT process. Resour. Conservation Recycl.52 (4), 601–611. 10.1016/j.resconrec.2007.08.001
53
SipahiS.TimorM. (2010). The analytic hierarchy process and analytic network process: An overview of applications. Manag. Decis.48 (5), 775–808. 10.1108/00251741011043920
54
Solo-GabrieleH. M.JonesA. S.LindstromA. B.LangJ. R. (2020). Waste type, incineration, and aeration are associated with per-and polyfluoroalkyl levels in landfill leachates. Waste Manag.107, 191–200. 10.1016/j.wasman.2020.03.034
55
ThorntonI.WattJ. M.DaviesD. J. A.HuntA.Cotter-HowellsJ.JohnsonD. L. (1994). Lead contamination of UK dusts and soils and implications for childhood exposure: An overview of the work of the Environmental Geochemistry Research Group. London, England 1981-1992. Environ. Geochem. Health16, 113.
56
ToimilA.CamusP.LosadaI. J.Le CozannetG.NichollsR. J.IdierD.et al (2020). Climate change-driven coastal erosion modelling in temperate sandy beaches: Methods and uncertainty treatment. Earth-Science Rev.202, 103110. 10.1016/j.earscirev.2020.103110
57
VaneC. H.KimA. W.BeriroD.CaveM. R.LoweS. R.Lopes dos SantosR. A.et al (2021). Persistent organic pollutants in urban soils of central of london, England, UK: Measurement and spatial modelling of black carbon (BC), petroleum hydrocarbons (TPH), polycyclic aromatic hydrocarbons (PAH) and polychlorinated biphenyls (PCB). aeer.2 (2), 1. 10.21926/aeer.2102012
58
VitousekS.BarnardP. L.FletcherC. H.FrazerN.EriksonL.StorlazziC. D. (2017). Doubling of coastal flooding frequency within decades due to sea-level rise. Sci. Rep.7, 1399. 10.1038/s41598-017-01362-7
59
WilliamsR. S.CurnickD. J.BarberJ. L.BrownlowA.DavisonN. J.DeavilleR.et al (2020). Juvenile harbor porpoises in the UK are exposed to a more neurotoxic mixture of polychlorinated biphenyls than adults. Sci. Total Environ.708, 134835. 10.1016/j.scitotenv.2019.134835
60
YinK.RenF.ChanW-P.ChangV. W-C. (2018). Statistical comparison of leaching behavior of incineration bottom ash using seawater and deionized water: Significant findings based on several leaching methods. J. Hazard. Mater.344, 635–648. 10.1016/j.jhazmat.2017.11.004
Summary
Keywords
conceptual site model (CSM), multicriteria decision analysis (MCDA), risk assessment, spatial analysis, pollution, legacy wastes, GIS
Citation
Riley AL, Amezaga J, Burke IT, Byrne P, Cooper N, Crane RA, Comber SDW, Gandy CJ, Hudson-Edwards KA, Jennings E, Lewis E, Lofts S, MacDonald JM, Malcolm H, Mayes WM, Onnis P, Olszewska J, Spears B and Jarvis AP (2022) Incorporating conceptual site models into national-scale environmental risk assessments for legacy waste in the coastal zone. Front. Environ. Sci. 10:1045482. doi: 10.3389/fenvs.2022.1045482
Received
15 September 2022
Accepted
13 October 2022
Published
28 October 2022
Volume
10 - 2022
Edited by
Valerio Funari, National Research Council (CNR), Italy
Reviewed by
Denis Zannoni, University of Bologna, Italy
Min-Hao Yuan, China Medical University, Taiwan
Updates
Copyright
© 2022 Riley, Amezaga, Burke, Byrne, Cooper, Crane, Comber, Gandy, Hudson-Edwards, Jennings, Lewis, Lofts, MacDonald, Malcolm, Mayes, Onnis, Olszewska, Spears and Jarvis.
This is an open-access article distributed under the terms of the Creative Commons Attribution License (CC BY). The use, distribution or reproduction in other forums is permitted, provided the original author(s) and the copyright owner(s) are credited and that the original publication in this journal is cited, in accordance with accepted academic practice. No use, distribution or reproduction is permitted which does not comply with these terms.
*Correspondence: Alex L. Riley, a.l.riley@hull.ac.uk
This article was submitted to Toxicology, Pollution and the Environment, a section of the journal Frontiers in Environmental Science
Disclaimer
All claims expressed in this article are solely those of the authors and do not necessarily represent those of their affiliated organizations, or those of the publisher, the editors and the reviewers. Any product that may be evaluated in this article or claim that may be made by its manufacturer is not guaranteed or endorsed by the publisher.