- 1Laimburg Research Centre, Vadena, Italy
- 2Department of Public Health, Servizio Igiene e Sanità Pubblica—Azienda Sanitaria dell'Alto Adige, Bolzano, Italy
Plant protection strongly increased food safety and agricultural productivity, but with societal and environmental costs as the downside. Especially the contamination of non-target areas via spray drift represents an adverse side-effect. Residential zones and playgrounds are so-called “sensitive zones”, where spray drift is considered to have an increased potential for human health risk. To study the residue profile potentially associated with spray drift we analyzed data of a residue monitoring program in South Tyrol (Northern Italy). From 2018 to 2021, 39 playgrounds were analyzed multiple times per year for the presence and concentration of pesticide residues on grass samples. In a total of 399 samples, we identified 39 different residues deriving primarily from agricultural production. Mean concentration (0.0645 mg kg−1, SD: ± 0.1013 mg kg−1) and comparison to Maximum Residue Levels (MRLs) of food, revealed that 98.2% of the residues were in the range of MRLs and close to the analytical limit of quantification. We found that 6 out of 334 residues had relatively elevated concentrations clearly above the MRLs. Finally, a time series analysis of the study period revealed a significant decrease in the number of detected residues and their concentration by 72% and 78%, respectively. In the last year of this study, playgrounds showed on average 1.46 residues (SD: ± 1.252) with a mean concentration of 0.012 mg kg−1 (SD: ± 0.025), which is almost equal to the limit of detection (0.01 mg kg−1). The presented results demonstrate that 1) spray drift decreased significantly within 4-year and that 2) the introduced measures to decrease spray drift have been effective. Consequently, these results imply 3) that improved farming practice represents an important leverage point of further spray drift reduction.
1 Introduction
One of the major pillars of global food security and agricultural production is the control of plant diseases and pests. Various pests, such as insects, fungi, or nematodes are the main threats to agricultural production and are considered to reduce global agricultural output by about 40% every year (Savary et al., 2019).
To control plant diseases and pests, agriculture strongly depends on “pesticides”, a very generic description for a substance that “prevents, destroys, or controls a harmful organism (“pest”) or disease, or protects plants or plant products during production, storage and transport “(European Commission, 2022b). Within a wide range of different substance classes, a large portion of pesticides are based on synthetic active substances. Synthetic chemistry has been successful in optimizing the efficacy of natural product lead substances, explaining the prevalence of synthetic pesticides (Casida, 2009). However, many of these active agents can be harmful to different non-target organisms and thus possess high ecological and social costs as the downside (Skinner et al., 1997; Aktar et al., 2009; Henry et al., 2012; Tang et al., 2021). They present a major pollution risk for soils, water bodies, and ecosystem diversity (Hough, 2021). Furthermore, a crucial and intensively discussed drawback of pesticide exposure is the risk to human health (Weisenburger, 1993; Damalas and Eleftherohorinos, 2011). Several branches of science, such as toxicology and epidemiology, are focusing on the negative health effects of pesticides, underlining the importance of that issue (Weisenburger, 1993; Alavanja et al., 2004; Hernández et al., 2013; Cimino et al., 2017; Kim et al., 2017; Singh et al., 2018). In contrast, the environmental chemistry focuses on the entry routes, concentrations and fates of pesticides in the environment, which is, of course, strongly interlinked to (eco-) toxicological research (Fent, 2013).
(Neumann et al., 2002; Gavrilescu, 2005). Understanding the entry routes is particularly important when non-target areas, such as natural ecosystems, water bodies, or residential districts, get contaminated with pollutants and countermeasures need to be developed (Tang et al., 2021). A common entry route is spray drift, which describes the airborne transport (wind) of pesticides and fertilizers out of agricultural target areas to non-target areas (Maybank et al., 1978; Felsot et al., 2010). There are various factors affecting the presence and quantity of spray drift. Weather conditions, in particular air turbulence, and wind are the main forces responsible for the transport of the droplets (Hilz and Vermeer, 2013). But also, the application technique and crop architecture strongly affect spray drift (Al Heidary et al., 2014). Moreover, cropland pattern (homogeneous vs. heterogeneous) and the type of cultivation system (annual vs. perennial crops) have a strong effect on pesticide use (Nicholson and Williams, 2021). As they cannot benefit from crop rotation, perennial crops, such as fruit trees, require a higher plant protection intensity than annual crops, with increased spray drift as a consequence. Therefore, efficient measures are required to reduce spray drift, in particular for permanent crops.
An important permanent cropping system often related to spray drift issues are apple orchards, as they cover 473 000 ha in Europe (Statistical database of the European Union, 2017). This is even more pronounced in South Tyrol (Northern Italy), a region highly specialized in apple with a share of about 10% of the European apple production (Food and Agriculture Organization of the United Nations. FAOSTAT Database, 2016). Hence, spray drift is an issue in South Tyrol with a distinct social perception. For that reason, several technical and legal measures have been introduced to minimize spray drift. For instance, since 2020 sprayers must be equipped with anti-drift nozzles (injector nozzles) (Provincial government South Tyrol). Furthermore, the guidelines of good agricultural practices of integrated agriculture include numerous measures to minimize spray drift. For instance, farmers should avoid plant protection treatments with elevated speed and during windy conditions and triennial functional controls of the sprayer should minimize the sprays reaching non-target areas (Extension service for fruit production and viticulture, South Tyrol, 2019; Workgroup for Integrated Fruit and Production in South Tyrol, 2020). Additional and stricter rules apply when orchards are in the close vicinity of so-called “sensitive zones”, comprising recreation areas, urban green areas, the surroundings of healthcare facilities and playgrounds (Province of South Tyrol, 2014). Measures to protect sensitive zones comprise temporal restrictions (treatments are only allowed between 7:00 pm and 7:00 am) and spatial restrictions: Within the first 5 m from the orchard border, it is only allowed to spray towards the orchard center, and active substances with hazard statements (such as H300, H330, and H373) cannot be used within a 30 m distance from the orchard border. By using anti-drift nozzles, the distance is reduced to 10 m. In the last decades, the potential contamination of sensitive zones via spray drift has become an intensely discussed societal debate, addressing primarily human health risks (Linhart et al., 2019; Nicholson and Williams, 2021).
In 2014, to investigate the extent of spray drift into “sensitive zones”, the Department of Public Health of the Public Healthcare Agency in South Tyrol gradually established a monitoring program for 33 playgrounds, four schools, one preschool, and one public green area. In the present study we used the data collected within the monitoring program to address the following research questions:
1) Can active agents be detected on public sites in South Tyrol and how many residues are present at which concentrations?
2) Do most of the detected active agents arise from agriculture or are there further input sources?
3) Is there a trend over the last years regarding the number of detected residues and their concentration, particularly regarding the introduced measures to reduce spray drift?
2 Materials and methods
The monitoring program is based on the national action plan of Italy which aims at achieving sustainable use of crop protection products (Ministero delle Politiche Agricole Alimentari e Forestali et al., 2014). A major goal of this plan is to reduce the potential risks to human health and the environment associated with the use of crop protection products, comprising obligatory training programs for farmers, inspections on the function of sprayers, and limitations for specific active agents, for instance.
2.1 Sampling sites
All sampling sites (n = 39) were all located in South Tyrol, a province situated in the north Italian Alps. As it is typical for a mountainous region, the topography and climate show a huge variability from very high to low elevations (Figure 1). 64.4% of the 7,400.4 km2 surface is above 1,500 m. a.s.l. Only 8.4% of the surface is below 800 m. a.s.l, with the lowest elevation of 205 m. a.s.l. at the Adige valley bottom.
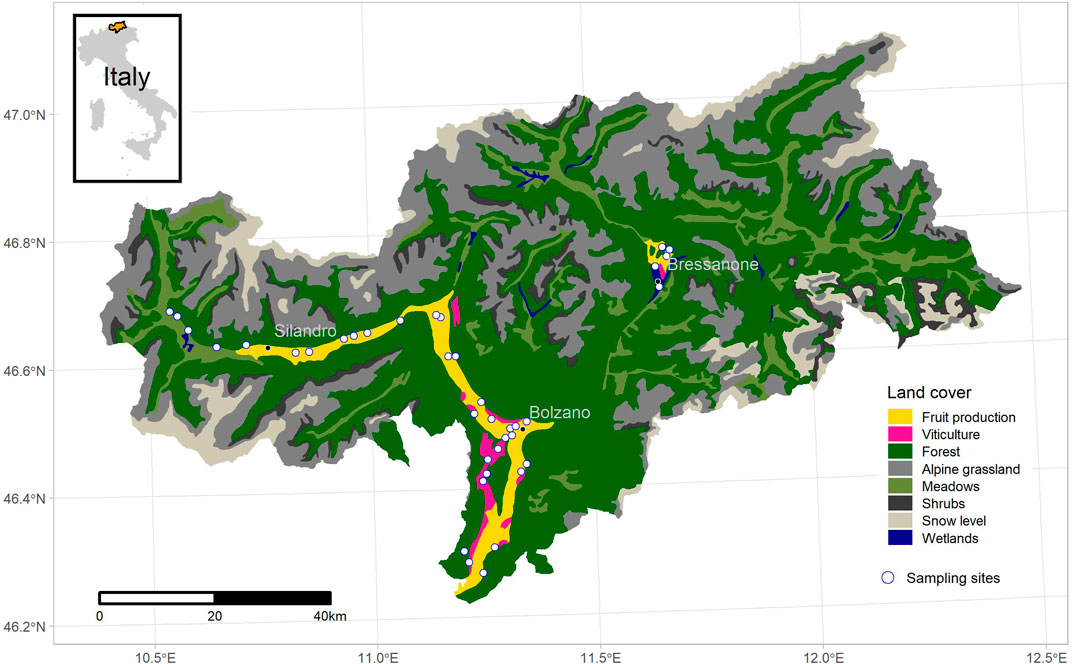
FIGURE 1. Situation of our sampling sites (white dots, n = 39, 2018–2021, see also Supplementary Table S1) within main valleys of South Tyrol (Bolzano province, Trentino-Alto Adige, Italy). Area of intensive fruit production is given in yellow (21 552 ha, year 2020).
36.1% of the surface is used for agricultural production of which, 3.9% is used for apple production (18 973 ha) and 1.1%, for viticulture (5 293 ha). The main areas of intensive apple production are the valley bottoms of the four main valleys: Adige (north-west of Bolzano), Lower Adige (south of Bolzano), Isarco (north and south of Bressanone) and Venosta (west and east of Silandro). The four main valleys are characterized as followed:
Low Adige valley (Bolzano), elevation of study sites: 212–615 m. a.s.l, mean air temperature:12.3°C, mean annual precipitation: 715.8 mm. Adige valley (Merano), elevation of study sites: 241–552 m. a.s.l, mean air temperature:11.7°C, mean annual precipitation: 716.5 mm. Venosta valley (Silandro), elevation of study sites: 628–1,123 m. a.s.l, mean air temperature: 10.0°C, mean annual precipitation: 666.5 mm. Isarco valley (Silandro), elevation of study sites: 556–885 m. a.s.l, mean air temperature: 9.9°C, mean annual precipitation: 498.3 mm.
Most of the orchards (>80%) in South Tyrol are cultivated according to the guidelines for integrated cultivation of pome fruit (Workgroup for Integrated Fruit and Production in South Tyrol, 2020). These guidelines contain a list of the authorized plant protection products and the relevant information on their application, such as dosages and the maximal annual number of applications.
To continue a long-term monitoring program of the so-called “sensitive zones” in South Tyrol, the site selection was based on a pilot monitoring study. Only sites with detected residues were continued in the presented monitoring program. Thus, our study mirrors sensitive zones with rather above-average residue concentrations. These sensitive zones are defined as areas frequented by the population or by vulnerable parts of the population and are typically playgrounds, schools, preschools, sports areas, recreation areas, cycling tracks, urban green areas, parks, and open spaces of healthcare facilities in close vicinity to agricultural areas (Ministero delle Politiche Agricole Alimentari e Forestali et al., 2014). The sensitive zones selected for this study are all located in the valley bottom of South Tyrol, the main area of intensive apple and grapevine production. The distance between the sample sites and the border of an orchard or vineyard ranged from 0 to a maximum of 450 m (inner city playgrounds). Thus, most of the selected sites were in close vicinity to the potential sources and therefore, had a high potential to be affected by spray drift (Figure 1). Moreover, inner city playgrounds and urban green areas were selected as sampling sites with higher population density and higher distance to agricultural areas (450 m; playground Talferwiesen (Bolzano), playground Milland (Bressanone), Passerterasse (Merano)). A complete list of the investigated sites with corresponding coordinates can be found in the Supplementary Data (Supplementary Table S1).
2.2 Sampling
To get representative samples, five randomly taken grass samples (technical replicates) were subsequently mixed in plastic bags to bulk samples (per site and date, 300–400 g fresh weight) and immediately cooled in freezer bags. To avoid potential contamination during the sampling process, single-use hand gloves were used. The analysis was performed usually on the same day as the sampling.
2.3 Chemical analysis
All chemical analyses were performed by the laboratory for food analysis and food safety of the Autonomous Province of Bolzano (ACCREDIIA LAB 0434L). Grass samples were analyzed for residues according to DIN EN 15662:2018: briefly, after acetonitrile extraction and purification by solid phase extraction (QuEChERS), residue concentration was determined using gas chromatography coupled to mass spectrometry (Agilent, 7000C Triple Quadrupole GC/MS series system, United States), and liquid chromatography coupled to mass spectrometry (until 2018: API 4000™ LC-MC/MS system, AB Sciex LLC, United States + Acquity™ UHPLC, Waters, United States; since 2019: QTrap 6500 LC-MS/MS system, AB Sciex LLC, United States + NexeraX2 (Shimadzu, Japan)). The residue concentrations refer to the sample fresh weight.
In the initial phase of the monitoring, samples were analyzed for 242 different synthetic-organic substances. After a consistent absence of multiple substances, the list was reduced over the years to 98 substances investigated. The lower limit of quantification (LOQ) was by default 0.01 mg kg−1.
2.4 Comparison to maximum residue levels of various crops
Maximum Residue Levels (MRL) were obtained from the MRL database of the European Commission (European Commission, 2022a). For the comparison between the residue concentrations and MRLs, for every detected residue, we used the “applicable” as well as the “non-applicable” MRLs for all foods and crops available in this database. We made a detailed comparison of the two most frequent residues (captan and fluazinam) and the MRLs of two common agricultural products, apple and blueberry. They were selected because “applicable” MRLs for both fluazinam and captan were available. We excluded MRLs of “hops” with rather high MRL values.
2.5 Statistics
All graphical plots and statistical analyses were performed with R version 4.1.2 (R Foundation for Statistical Computing, Vienna, Austria, 2021) and the ggplot2 package (Version 3.3.5) (Wickham et al., 2016).
In order to consider the heteroskedastic data (residuals), we generally used generalized linear models with asymmetric probability distribution (Poisson, Gamma) for statistical analysis. The selection of the probability distribution was based on the goodness of fit (Akaike information criterion, quantile-quantile plot). Effects were subsequently tested with Wald Chi-square tests (Type 3) referring to the generalized linear model (GLM).
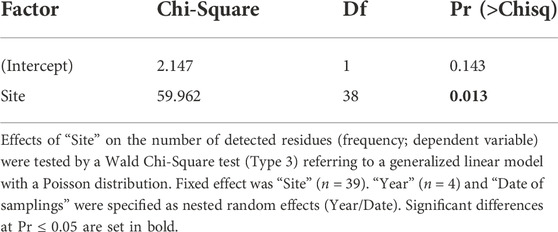
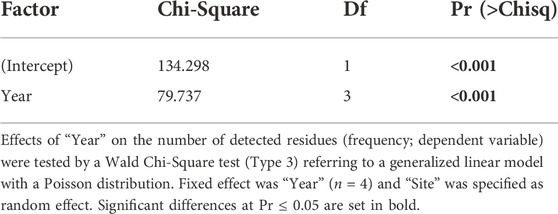
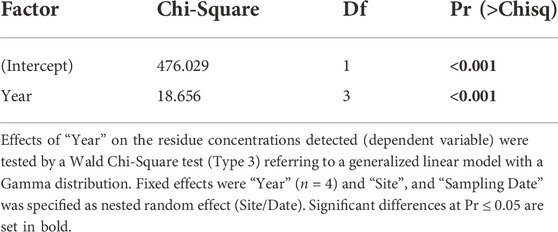
The effect of “site” (n = 39) on the number of detected residues (frequency; dependent variable) was analyzed by an GLM with a Poisson distribution and “site” as a fixed effect (Table 2). As we had 4 years with multiple sampling dates, we specified “Sampling Date” (n = 399) and “Year” (n = 4) as nested random effects (Year/Date). For the trend analysis on the temporal change of the number of detected residues (dependent variable), we used a GLM with a Poisson distribution and set “Year” (n = 4) as fixed effect and “Site” (n = 39) as random effect (Table 3). Similarly, the temporal changes of residue concentrations detected (dependent variable) were analyzed with a GLM with Gamma distribution. “Year” (n = 4) was set as fixed effect and “Site” (n = 39) and “Sampling Date” were specified as nested random effects (Site/Date) (Table 4).
GLMs were fitted by means of the lme4 package (Bates et al., 2015).
3 Results
3.1 Detected residues and their concentrations
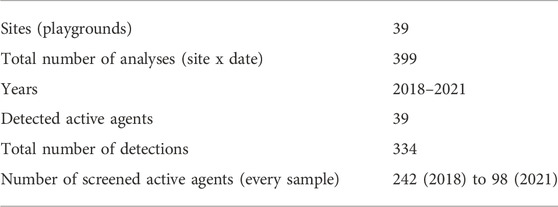
On 39 sites between 2018 and 2021, we realized a total number of 399 analyses (site x date; Table 1). Since, in pesticide analysis, 0.01 mg kg−1 is considered the limit of analytical determination, all concentrations above this limit were considered as “detected”. A total of 39 different active agents (residues) were identified on the grass samples (fresh weight) with a mean and median concentration of 0.0645 mg kg−1 (SD: ±0.1013 mg kg−1) and 0.028 mg kg−1, respectively. 222 (66%) of the residues had a concentration below 0.05 mg kg−1, 61 (18.3%) between 0.05 and 0.1 mg kg−1, 19 (5.7%) between 0.1 and 0.15 mg kg−1, and 31 (9.3%) more than 0.15 mg kg−1 (Figure 2).
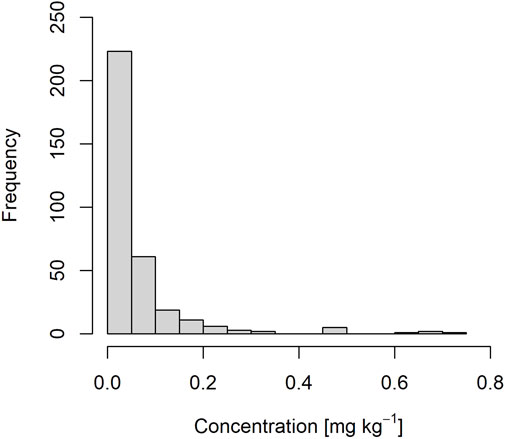
FIGURE 2. Distribution of all detected residue concentrations at 39 playgrounds from 2018 to 2021. Bin width was set to 0.05 mg kg−1.
The detected residues were classified as 25 fungicides, 10 insecticides, 1 (2) insecticide and insect repellent, and one herbicide. The share of the total detection frequency was: 274 (82.0%) fungicides, 58 (17.3%) insecticides, 1 (0.003%) insect repellent, 1 (0.003%) herbicide.
The ten residues with the highest mean concentration were: Oxadiazon (0.64 mg kg−1) > chlorpyrifos (0.36 mg kg−1)> N,N-diethyl-meta-toluamide (DEET; 0.25 mg kg−1) > captan (0.13 mg kg−1) > permethrin (0.10 mg kg−1) > meptyldinocap (0.06 mg kg−1) > penthiopyrad (0.06 mg kg−1) > folpet (0.05 mg kg−1) > fluazinam (0.05 mg kg−1) > propiconazole (0.05 mg kg−1) (Figure 3A).
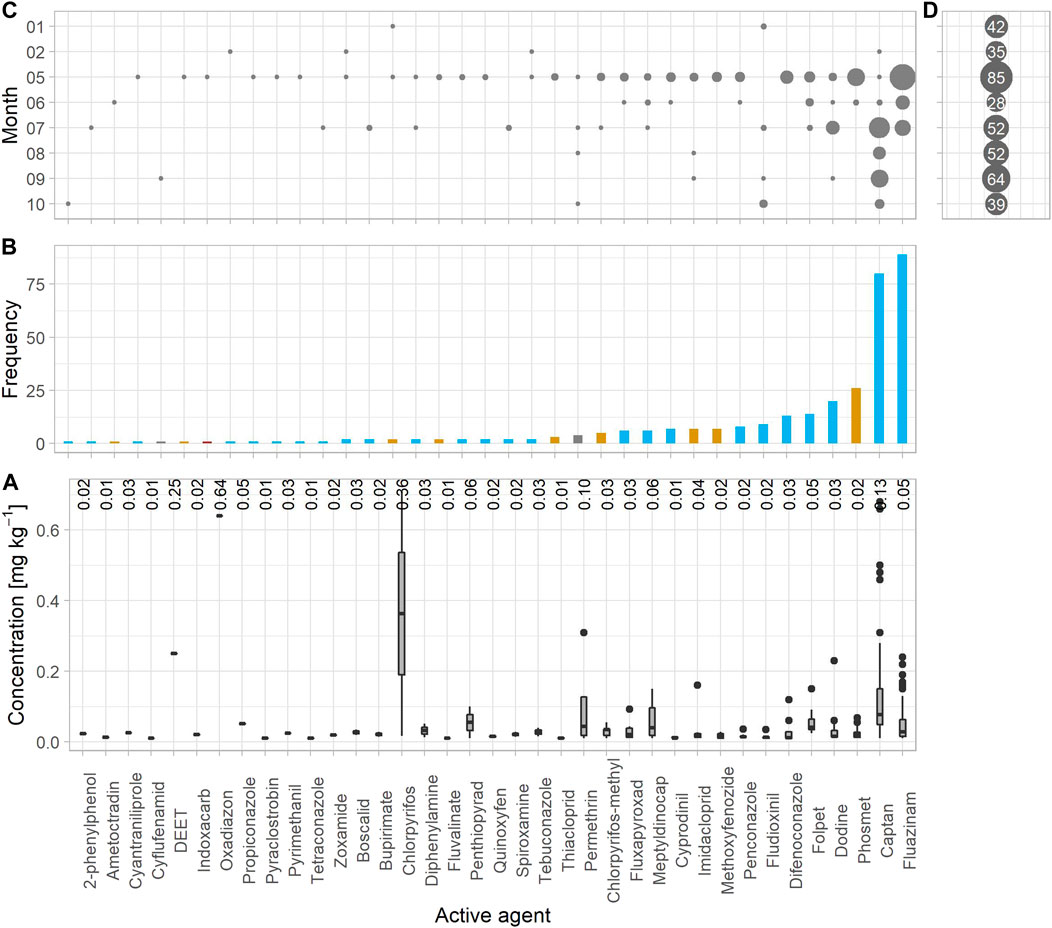
FIGURE 3. (A) Concentrations [mg kg−1] and (B) total frequency of detection (>0.01 mg kg−1) of all residues found on the grass samples of 39 different sampling sites. 399 samples (site x date) were taken from 2018 until 2021. Numbers (A) represent the mean concentration over all detections. Color-coded bars represent fungicides (blue), insecticides (orange) and herbicides (green) (C) Months (January–October) in which the residues were detected (sum of 2018–2021) and (D) Total number of samples (sum) collected in the corresponding month (sum of 2018–2019). The dot size represents the relative frequency of detection per month. The residue concentration refers to the fresh weight of grass.
The ten residues with the highest maximum concentration were:
Chlorpyrifos (0.71 mg kg−1) > captan (0.68 mg kg−1) > oxadiazon (0.64 mg kg−1) > permethrin (0.31 mg kg−1) > N,N-diethyl-meta-toluamide (DEET); 0.25 mg kg−1) > fluazinam (0.24 mg kg−1) > dodine (0.23 mg kg−1) > imidacloprid (0.16 mg kg−1) > meptyldinocap (0.15 mg kg−1) > folpet (0.15 mg kg−1) (Figure 3A, Supplementary Table S2, Supplementary Figure S3)
Three out of the 39 active agents are not used in agriculture as fungicides, insecticides or herbicides: N,N-Diethyl-meta-toluamide (DEET), and permethrin, which are a common insecticide and an insect repellent for humans and animals. Finally, diphenylamine was used as an antioxidant in storage facilities (indoor), but lost authorization in 2011.
3.2 Frequency of detection
Independently of the concentration (≥0.01 mg kg−1), we ranked the frequency of detection for all residues (Figure 3B). From the 333 detections that were made, the ten residues with the highest frequency were: Fluazinam (89) > captan (80) > phosmet (26) > dodine (20) > folpet (14) > difenoconazole (13) > fludioxonil (9) > penconazole (8)> methoxyifenozide (7) > imidacloprid (7)
All of them are active agents used as fungicides or insecticides in apple production and viticulture.
3.3 Date of detection
Generally, the sampling was performed 1 to 4 times a year per site but varied over the years (see Supplementary Figure S1). As the likelihood for detection is also influenced by the frequency of sampling, detection frequency must be compared to the frequencies of sampling (Figures 3C,D). Most of the detected residues were found in May (48.5%) followed by July (24.3%), June (9.0%), September (8.4%), August (4.2%), October (3.6%), February (1.2%) and January (0.9%; Figure 3C, Supplementary Figure S2). Residues clearly differed between the time point of sampling (months) and how often they were detected within a year. For the most part, each residue was detected only in 1 month within a year (23 active agents), seven, twice a year and four active agents, three times a year. Folpet, fludioxonil and permethrin were found in four different months. Captan was found throughout the whole year, but most frequently in February and from May until October.
3.4 Differences between sites and spatial distribution
The mean number of detected residues per site and sampling was 0.83 (SD: ± 1.34). The sites, however, varied markedly in the type and number of residues (Figure 4). Furthermore, the comparison of the sites for the number of residues per year revealed a clear regularity: there were sites with no or a low number of residues, and sites which had relatively high numbers of residues at every sampling (p = 0.013, Table 2, Supplementary Figure S3). For instance, the sites Goldrain (7.5 = mean number of detected residues per year), Staben (5.3), Rabland (5.3), Penon (5), and Neustift (5) had five or more detected residues every year, whereas Laag (0.5), School Mals (0.5) and Milland (0.0) regularly showed no or very little contamination.
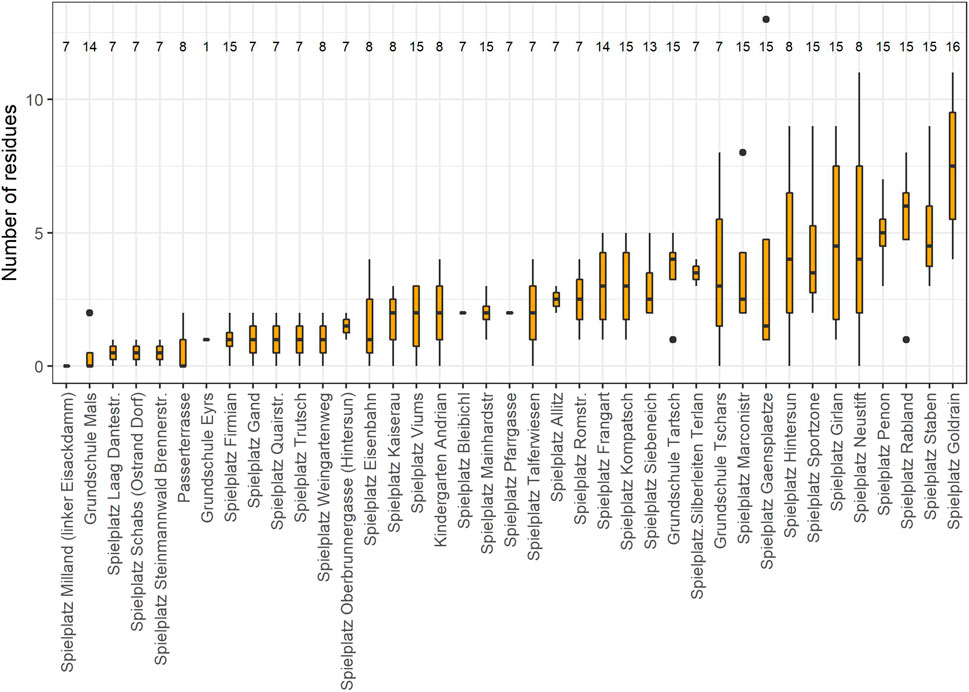
FIGURE 4. Number of detected residues per site (playground) and year in the period from 2018 to 2021. “Year” was used as a replicate. The numbers above the boxes represent the total number of sampling dates. For statistics see Table 2.
At large-scale, a spatial analysis revealed the absence of clusters or zones with relatively elevated or reduced residues. (Figure 7). Thus, the residue frequency seems to be strongly influenced by other factors than “location” (comprising topographical and climatic factors).
3.5 Temporal trends
To investigate if there is a temporal alteration over the years, we compared the years for the number of detected residues and their concentrations. From 2018 to 2021 the mean number of detected residues decreased significantly from 5.36 (SD: ±3.351) to 1.46 (SD: ±1.252) (p < 0.001, Figure 5; Table 3), which is a drop of 72%. In parallel, the mean concentration decreased significantly by 78%, from 0.055 mg kg−1 (SD: ±0.102) to 0.012 mg kg−1 (SD: ± 0.025) (p < 0.001, Figure 6 and Table 4). Considering the spatio-temporal distribution of the residue frequency, this drop becomes evident as well (Figure 7). The detected residues constantly decreased from 134 (2018) to 44 (2021), despite the opposing trend of an increasing number of samples per year (2018: 72, 2019: 95, 2020: 115, 2021: 117). Thus, the mean number of detections per sampling decreased constantly, as well (2018: 1.86, 2019: 0.95, 2020: 0.57, 2021: 0.37).
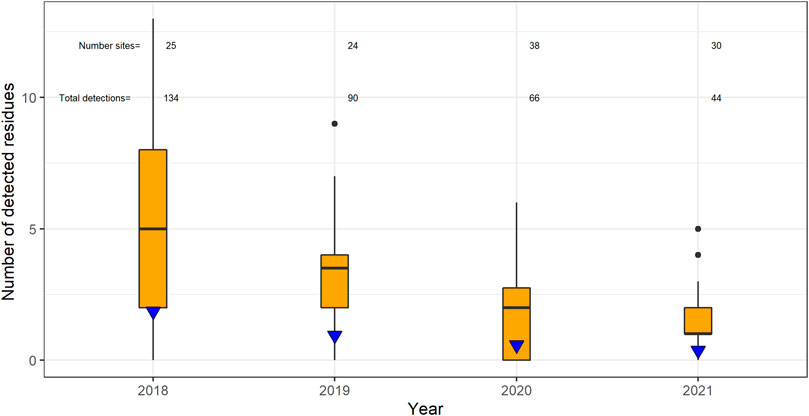
FIGURE 5. Number of detected residues per year. The boxes are based on the annual sum of residues for every site. The blue triangle represents the mean number of detections per sampling. The upper number gives the number of monitored playgrounds per year (“Number sites”). The lower number gives the number of detected residues per year (“Total detection”), among all playgrounds. For statistics see Table 3.
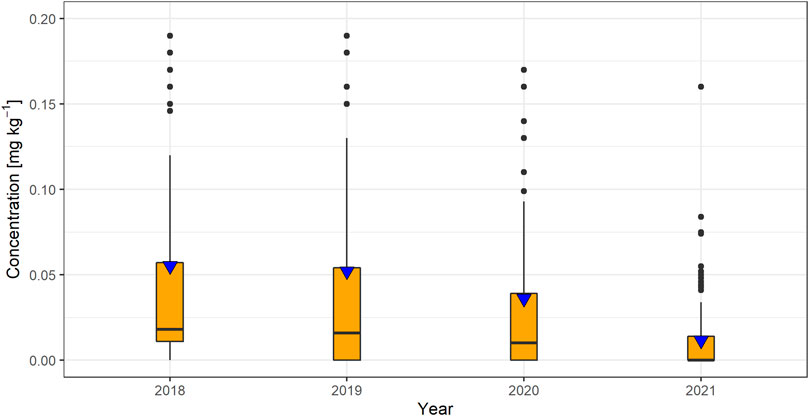
FIGURE 6. Residue concentrations per year. The boxes include all detected concentration for all active agents, sites, and sampling dates within 1 year. The blue triangle represents the mean concentration per year (over all sites and sampling dates). For statistics see Table 4. The residue concentration refers to the fresh weight of grass.
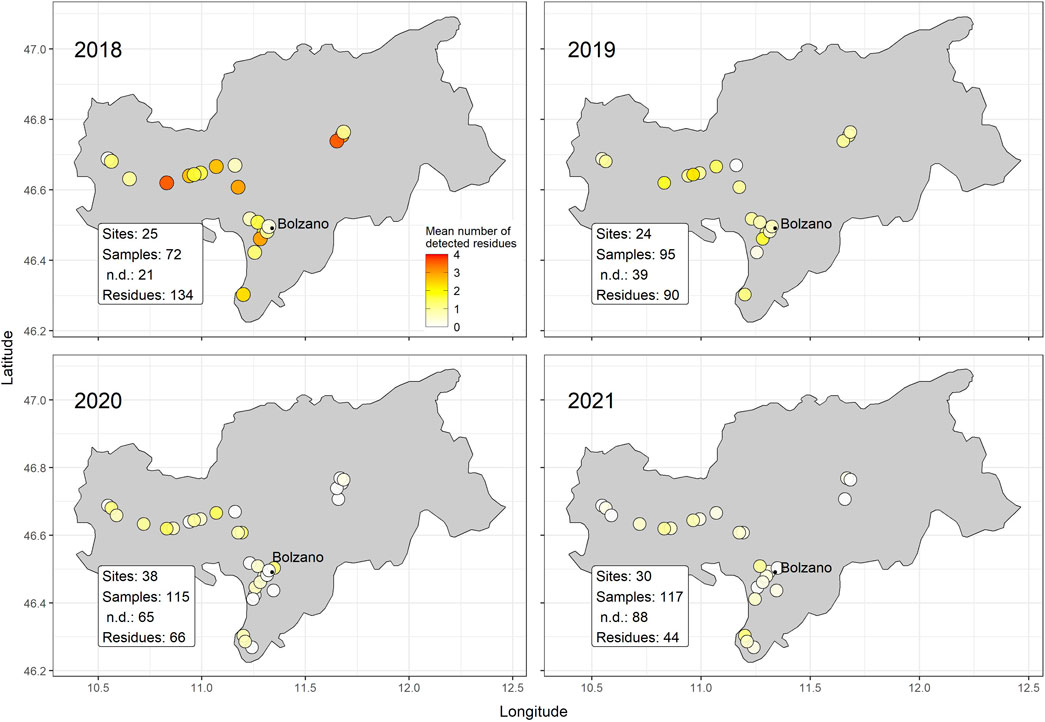
FIGURE 7. Spatio-temporal distribution of the mean number of detected residues per site from 2018 to 2021. The color code gives the mean number of detected residues (number of residues/sampling date) for all monitored sampling sites, ranging from no detection (white) to a maximum of 3.7 residues (red). The total number of taken samples and analyzed sampling sites varied between the years (see box). Information about the total number of detected residues per year and no detections (n.d.) per year is given in the box as well.
3.6 Comparison to MRLs
The Maximum Residue Level (MRL) defines the maximum concentration of active agents legally permitted in agricultural products. The MRL is always below toxicological reference values like Acceptable Daily Intake (ADI) and, for every active agent, there is a distinct MRL on each authorized food product. For products, on which the active agent is not authorized, the MRL is set to the limit of analytical determination, meaning that the products must be free of that pesticide by analytical means. This applies also in some cases for authorized crop protection products that possess relatively fast chemical fates (dissipation time). After appropriate use (Good Agricultural Practice) they should be completely degraded and absent until harvest. Since grass is not a food product, no MRL is available. To evaluate the magnitude, we compared the detected residue concentrations for the two most frequent residues, captan and fluazinam, with the MRLs of apple and blueberry as an example (Figure 8). For both active agents, the detected residues were below the selected MRL: residues of captan ranged from 0.01 mg kg−1 to 0.68 mg kg−1 (mean 0.13 mg kg−1, SD: ±0.14) while the MRLs for apple and blueberry are 10 mg kg−1 and 30 mg kg−1, respectively. For fluazinam, the residues ranged from 0.01 mg kg−1 to 0.24 mg kg−1 (mean 0.05 mg kg−1, SD: ± 0.05) and the MRLs for apple and blueberry are 0.3 mg kg−1 and 3 mg kg−1, respectively. For a more complete comparison, we added all current MRLs for the two substances, including those corresponding to the limit of analytical determination due to a lacking authorization on a given product: The detected residues of the grass samples were below the MRL of products with authorization (Figure 6, open circles), and close to the limit of analytical determination (captan: mean 0.13, SD: ± 0.14; fluazinam: mean 0.05 mg kg−1, SD: ±0.05). For all other residues, this comparison (without explicit labeling of apple and blueberry) can be found in the supplementary material (Supplementary Figure S4).
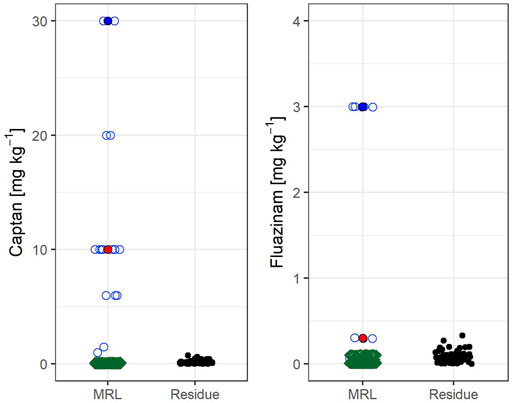
FIGURE 8. Comparison of Maximum Residue Levels (MRL) of numerous crops and food products (244) and the residue concentrations of grass samples (black dots) for the two most detected active agents (captan and fluazinam). MRLs of food products without authorization for the two fungicides (captan and fluazinam) are equal to the lower limit of quantification (LOQ) and given in green rectangles. Open circles represent the MRLs of food with authorization for both fungicides. Filled dots represent the MRLs of apples (red) or blueberries (blue). Black dots represent the concentration of all detected residues on the grass samples (2018-2021). See also Supplementary Figure S4 in the supplementary for other active agents.
4 Discussion
The purpose of this study was to 1) characterize and analyze the magnitude of contamination (frequency, concentration) of publicly accessible sites (“sensitive zones”) with plant protection agents, potentially conflicting with public health, and 2) if measures to reduce spray drift have been effective. It is a prevalent situation in South Tyrol that agricultural areas and public sites are in close vicinity (0–450 m distance in this study) and therefore the likelihood of contaminations via spray drift are increased. The monitoring program should give also insights in order to develop (additional) strategies to reduce inputs and provide information from a health perspective.
4.1 Residue frequency and classification
In our study, we found that the most frequent residues are active agents used in apple production (>90%). “Fluazinam” (present in 22% of all analyzed samples) and “captan” (present in 20% of all analyzed samples) were by far the most frequently detected residues, in terms of total frequency and seasonal presence (Figures 3B,C). Both active agents are primarily used against apple scab, one of the major fungal diseases in apple production (Sutton et al., 2014). Phosmet (present in 6.5% of all analyzed samples) was the third most frequent residue, primarily found in May. It is a broad-spectrum insecticide usually used to control different pests, including the invasive brown marmorated stink bug (Halyomorpha halys) (Lewis and Green, 2011).
The high frequency of these active agents is not surprising as all of them are used throughout the production cycle (bloom to harvest). According to the guidelines for integrated apple production, captan, fluazinam and phosmet can be used 10, 3, and 2 times per orchard and year, respectively (Extension service for fruit production and viticulture, South Tyrol, 2019; Workgroup for Integrated Fruit and Production in South Tyrol, 2020). This suggests a positive correlation between the frequency of detection and application with the corresponding active agent, particularly for captan. This correlation is also supported by the seasonal variation of residues (Figure 3C). Most of them were detected in May, the period with increasing frequency of plant protection applications within the production cycle.
Besides the frequency of use, physicochemical properties are fundamentally responsible for environmental behavior and fate (Lewis and Green, 2011). The persistence of active agents strongly depends on their degradation properties (Ghafoor et al., 2011). Captan, for instance, has a half-life in soil (DT50, aerobic) of 0.8 days while fluazinam has a half-life of 124 days. This potentially explains why fluazinam was the most frequently detected active agent.
4.2 Concentrations and sources of residues
Beyond the mere presence of a residue, the concentration is crucial for the effects on organisms (dose-effect relationship). Within this monitoring, the presence was detected for all residues at concentrations exceeding the LOQ of 0.01 mg kg−1 (grass fresh weight). On average, the residue concentration was 0.0645 mg kg−1 (SD: ± 0.1013 mg kg−1), very close to the LOQ. On the other hand, maximum concentrations above 0.5 mg kg−1 were found in five out of 334 detections: chlorpyrifos (0.71 mg kg−1), oxadiazon (0.64 mg kg−1) each once and captan (0.68, 0.66, 0.5 mg kg−1) three times within the monitoring period (Figure 1, Figure 3A, Supplementary Table S2). Regarding the single maximum concentrations per active agent, five active agents exceeded 0.25 mg kg−1. Two of these upper-end values were an insecticide and a fungicide, respectively (chlorpyrifos: 0.71 mg kg−1 and captan: 0.68 mg kg−1), an herbicide (oxadiazon: 0.64 mg kg−1) and two insecticides [permethrin: 0.31 mg kg−1, N,N-diethyl-meta-toluamide (DEET): 0.25 mg kg−1)]
These results also imply that there are further potential sources of contamination. DEET and permethrin are insecticides used as repellents to protect humans and pets (dogs) against insect bites (Lewis and Green, 2011). Permethrin is used, in particular, against lice. Furthermore, for some detected residues the source or pathway of contamination remains elusive. The maximum concentration of chlorpyrifos stands out. As the playground is protected by physical barriers (surrounding buildings and sports facilities), alternative pathways like drift from treatments of close by public green areas (flower beds) should be considered. Similarly, the herbicide oxadiazon can be also used in public green spaces (Figure 3A). Finally, the detection of diphenylamine is puzzling, as it was only authorized for indoor use in apple storage (against scald), never for field applications and lost its authorization in 2011 (Italy) (Ministero della Salute, 2022). A possible source for diphenylamine could be the contamination with lubricants or other products, in which it is common as an additive.
4.3 An attempt to estimate potential effects on human health
A central concern associated with residues on non-target areas is the potential health risk for humans. Performing a full human health risk assessment, however, was out of the scope for this study, as such procedures comprise numerous complex and time-consuming tests (Carpy et al., 2000). Nevertheless, comparing the detected residue levels (concentrations) with the legal maximum residue levels of food products (MRL) provides a rough estimate of the toxicological relevance, even though MRLs are defined for human nutrition (incorporation), which does not apply for grass. Following the precautionary concept and the ALARA principle (as low as reasonably achievable), the MRL is set lower than the ADI (Acceptable Daily Intake, typically two orders of magnitude) to correct for uncertainties. These uncertainties arise from biological differences between test species and Humans, as well as intraspecies differences between individuals (humans). The ADI (mg per mg kg−1 bodyweight day−1) “is an estimate of the amount of a substance in food or drinking water that can be consumed daily over a lifetime without presenting an appreciable risk to health “(European Food Safety Authority, 2022).
Thus, if the residue concentrations and MRLs are within a comparable magnitude, negative effects on human health seem unlikely, also because grass is not a component of the human diet and dermal absorption is usually much lower (default value 1/10; Lewis and Green, 2011). We compared the residue concentrations with the MRLs on all available agricultural products (244 in total; see Supplementary Figure S4). Due to the complexity of the data, we selected the two most frequent residues, captan and fluazinam, for a more explicit description (Figure 8). For both active agents, the residue concentrations were close to the LOQ (captan: mean 0.13 mg kg−1, SD: ± 0.14; fluazinam: mean 0.05 mg kg−1, SD: ±0.05) and below the MRLs on apple (captan: 10 mg kg−1; fluazinam: 0.3 mg kg−1) and blueberry (captan: 30 mg kg−1; fluazinam: 3 mg kg−1). Instead of arbitrarily choosing only one or few MRLs, the figure illustrates the entire range of all available MRLs (244 products), including also those MRLs where the two pesticides are not authorized. Without authorization, MRLs are automatically set to the limit of analytical determination. This variation demonstrates that single MRLs cannot be interpreted as a distinct toxicological threshold, especially for crops without authorization. Linhart et al. (2019) compared detected residue concentrations of grass samples with the MRLs as well. However, they selected primarily the MRLs of agricultural products without authorization and thus with MRLs = LOQ as a consequence. This selective comparison favors an interpretation bias. We think it is essential to consider the variation of MRLs and it is misleading to use single MRL-values as toxicological thresholds.
The three single residue concentrations of chlorpyrifos (0.71 mg kg−1), oxadiazon (0.64 mg kg−1) and permethrin (0.31 mg kg−1) were clearly above the MRLs (for apple: 0.01 mg kg−1, 0.5 mg kg−1 and 0.05 mg kg−1, respectively, MRL of oxadiazon dropped in 2020 to 0.01 mg kg−1; see Supplementary Figure S4). The three residue concentrations of chlorpyrifos-methyl (max. 0.06 mg kg−1) were below the MRL (1 mg kg−1) which dropped in 2020 to 0.01 mg kg−1.
In order to estimate the critical grass amount for ingestion, we used the ADI for the toxicological most problematic active agents chlorpyrifos and oxadiazone (based on the mean concentration). Assuming a person of 10 kg bodyweight, the amount of 30 g and 60 g can be ingested daily without health risk, respectively. It appears unreasonable that persons ingest regularly more than these amounts of grass. Both active agents lost their authorization in 2020 (both detected in 2018 and 2019). Thus, it is expected that both active agents will not be detectable in the future. Finally, we want to point out that our attempt does not substitute toxicological assessments.
4.4 Farmers’ management and legal action likely affect the extent of contamination
A further central question was: Are there sites with a consistently high or low number of residues? This was examined by comparing the interannual replicates per site. Our analysis revealed a clear tendency of sites with consistently low and sites with consistently high numbers of residues (Figure 4). The ultimate cause behind this trend is still not analyzed in detail. Topography, the distance between playgrounds and orchards, microclimate, and air turbulences can have a strong influence on spray drift and thus on the quantity of residues (Hilz and Vermeer, 2013; Al Heidary et al., 2014). Since the topography and the micro-climate of South Tyrol is characterized by strong small-scale variations, we can assume that the driving factors of spray drift show strong small-scale variations, as well. Nevertheless, we can assume that one of the most important factors are the management and farming practice.
This is in line with the outcome of our trend analysis which shows a significant downward trend within the examined period (Figures 5–7, 2018–2021). The number of residues (per site and year) decreased by 72%, from a mean of 5.36 (SD: ±3.351) to a mean of 1.46 (SD: ±1.252) (p < 0.001). In analogy, the mean residue concentration (per site and year) decreased from 0.055 mg kg−1 (SD: ±0.102) to 0.012 mg kg−1 (SD: ± 0.025), as well, which represents a decrease of 78% (Figure 6). During the same period, regional legislation and behavioral guidelines for farmers were introduced to contain spray drift (see Material and Methods).
In addition, EU legislation limited the availability of active agents during the period of the study (loss of authorization), impacting the number and concentration of residues that can be found. Within 2018 to 2021, nine of the detected active agents lost their authorization and therefore could not be detected in the last year of our study (Ministero della Salute, 2022). This accounts for 27 detections (out of a total of 334 detections (12.4%; over the 4-year study period). The loss of authorization/availability (12.4%) alone is not sufficient to explain such a distinct drop within 4 years (72%).
Even though the individual contribution of the drift-reducing measures cannot be deduced from our data, there is strong evidence that the downward trend in number and concentration of residues from 2018 to 2021 is linked to legal and behavioral efforts in reducing spray drift.
5 Conclusion
The observed drop in residue number and concentration within a few years demonstrates the high impact of “how” farmers apply plant protection products on spray drift. This also implies that management and the handling of plant protection products represent an important leverage point with a high potential to decrease spray drift. Besides the significant reduction, we still found residues on the monitoring sites, highlighting that further efforts are needed to reduce contamination close to zero. Therefore, we suggest that further “anti-drift” measures should be developed to reduce drift and contamination of non-target areas to the least possible minimum. Promising approaches are precision farming, in particular, new application techniques using low-pressure spraying. Training of farmers and a careful selection of pesticides in crop protection strategies that exclude problematic substances are fundamental leverage points as well. Finally, the development and extension of integrated and preventive measures to reduce the total quantity of applied plant protection agents represent an inevitable strategy towards a more sustainable agriculture.
Data availability statement
The original contributions presented in the study are publicly available. This data can be found here: https://zenodo.org/record/7357488#.Y4dMeH2ZNro.
Author contributions
LW was responsible for the monitoring program, including site selection, sampling, and residue analysis, and provided the raw data. UP and MB performed data analysis, plotting and statistics. UP, MB, and MO wrote the article. All authors read and approved the final manuscript.
Acknowledgments
We would like to thank Martin Thalheimer, Christa Malfertheiner and Cameron Cullinan for critical comments and proof reading.
Conflict of interest
The authors declare that the research was conducted in the absence of any commercial or financial relationships that could be construed as a potential conflict of interest.
Publisher’s note
All claims expressed in this article are solely those of the authors and do not necessarily represent those of their affiliated organizations, or those of the publisher, the editors and the reviewers. Any product that may be evaluated in this article, or claim that may be made by its manufacturer, is not guaranteed or endorsed by the publisher.
Supplementary material
The Supplementary Material for this article can be found online at: https://www.frontiersin.org/articles/10.3389/fenvs.2022.1062333/full#supplementary-material
References
Aktar, W., Sengupta, D., and Chowdhury, A. (2009). Impact of pesticides use in agriculture: Their benefits and hazards. Interdiscip. Toxicol. 2, 1–12. doi:10.2478/v10102-009-0001-7
Al Heidary, M., Douzals, J. P., Sinfort, C., and Vallet, A. (2014). Influence of spray characteristics on potential spray drift of field crop sprayers: A literature review. Crop Prot. 63, 120–130. doi:10.1016/j.cropro.2014.05.006
Alavanja, M. C., Hoppin, J. A., and Kamel, F. (2004). Health effects of chronic pesticide exposure: Cancer and neurotoxicity. Annu. Rev. Public Health 25, 155–197. doi:10.1146/annurev.publhealth.25.101802.123020
Bates, D., Mächler, M., Bolker, B., and Walker, S. (2015). Fitting linear mixed-effects models using lme4. J. Stat. Soft. 67, 1–48. doi:10.18637/jss.v067.i01
Carpy, S. A., Kobel, W., and Doe, J. (2000). Health risk of low-dose pesticides mixtures: A review of the 1985-1998 literature on combination toxicology and health risk assessment. J. Toxicol. Environ. Health Part B 3, 1–25. doi:10.1080/109374000281122
Casida, J. E. (2009). Pest toxicology: The primary mechanisms of pesticide action. Chem. Res. Toxicol. 22, 609–619. doi:10.1021/tx8004949
Cimino, A. M., Boyles, A. L., Thayer, K. A., and Perry, M. J. (2017). Effects of neonicotinoid pesticide exposure on human health: A systematic review. Environ. Health Perspect. 125, 155–162. doi:10.1289/EHP515
Damalas, C. A., and Eleftherohorinos, I. G. (2011). Pesticide exposure, safety issues, and risk assessment indicators. Int. J. Environ. Res. Public. Health 8, 1402–1419. doi:10.3390/ijerph8051402
European Commission, (2022a). EU pesticide database. Available at: https://food.ec.europa.eu/plants/pesticides/maximum-residue-levels_en (Accessed July 27, 2022).
European Commission, (2022b). Web page on food safety of the EU. Available at: https://food.ec.europa.eu/plants/pesticides_en#what-is-a-pesticide (Accessed July 27, 2022).
European Food Safety Authority, (2022). Glossary. Available at: https://www.efsa.europa.eu/en/glossary-taxonomy-terms (Accessed July 27, 2022).
Extension service for fruit production and viticulture, South Tyrol (2019). Guidelines apple cultivation. Lana.
Felsot, A. S., Unsworth, J. B., Linders, J. B., Roberts, G., Rautman, D., Harris, C., et al. (2010). Agrochemical spray drift; assessment and mitigation—a review. J. Environ. Sci. Health Part B 46, 1–23. doi:10.1080/03601234.2010.515161
Fent, K. (2013). Ökotoxikologie: Umweltchemie-Toxikologie-Ökologie. Stuttgart, Germany: Georg Thieme Verlag.
Food and Agriculture Organization of the United Nations,, , and Faostat Database, (2016). Faostat. Available at: https://www.fao.org/faostat/en/#home (Accessed July 27, 2022).
Gavrilescu, M. (2005). Fate of pesticides in the environment and its bioremediation. Eng. Life Sci. 5, 497–526. doi:10.1002/elsc.200520098
Ghafoor, A., Jarvis, N. J., Thierfelder, T., and Stenström, J. (2011). Measurements and modeling of pesticide persistence in soil at the catchment scale. Sci. Total Environ. 409, 1900–1908. doi:10.1016/j.scitotenv.2011.01.049
Henry, M., Beguin, M., Requier, F., Rollin, O., Odoux, J.-F., Aupinel, P., et al. (2012). A common pesticide decreases foraging success and survival in honey bees. Science 336, 348–350. doi:10.1126/science.1215039
Hernández, A. F., Parrón, T., Tsatsakis, A. M., Requena, M., Alarcón, R., and López-Guarnido, O. (2013). Toxic effects of pesticide mixtures at a molecular level: Their relevance to human health. Toxicology 307, 136–145. doi:10.1016/j.tox.2012.06.009
Hilz, E., and Vermeer, A. W. (2013). Spray drift review: The extent to which a formulation can contribute to spray drift reduction. Crop Prot. 44, 75–83. doi:10.1016/j.cropro.2012.10.020
Hough, R. L. (2021). A world view of pesticides. Nat. Geosci. 14, 183–184. doi:10.1038/s41561-021-00723-2
Kim, K.-H., Kabir, E., and Jahan, S. A. (2017). Exposure to pesticides and the associated human health effects. Sci. Total Environ. 575, 525–535. doi:10.1016/j.scitotenv.2016.09.009
Lewis, K., and Green, A. (2011). The pesticide properties database. Chem. Int. Available at: http://sitem.herts.ac.uk/aeru/ppdb/en/index.htm (Accessed July 27, 2022).
Linhart, C., Niedrist, G. H., Nagler, M., Nagrani, R., Temml, V., Bardelli, T., et al. (2019). Pesticide contamination and associated risk factors at public playgrounds near intensively managed apple and wine orchards. Environ. Sci. Eur. 31, 28–16. doi:10.1186/s12302-019-0206-0
Maybank, J., Yoshida, K., and Grover, R. (1978). Spray drift from agricultural pesticide applications. J. Air Pollut. Control Assoc. 28, 1009–1014. doi:10.1080/00022470.1978.10470699
Ministero delle Politiche Agricole Alimentari e Forestali, (2014). Ministero dell’Ambiente e della Tutela del Territorio e del Mare, and Ministero della Salute. Piano azione naz. l’uso sostenibile dei prodotti fitosanit. Decreto 22 gennaio 2014. Available at: https://www.mite.gov.it/pagina/piano-dazione-nazionale-pan-luso-sostenibile-dei-prodotti-fitosanitari.
Ministero della Salute (2022). Banca dati dei prodotti fitosanitari. Available at: http://www.fitosanitari.salute.gov.it/fitosanitariws_new/FitosanitariServlet (Accessed July 27, 2022).
Neumann, M., Schulz, R., Schäfer, K., Müller, W., Mannheller, W., and Liess, M. (2002). The significance of entry routes as point and non-point sources of pesticides in small streams. Water Res. 36, 835–842. doi:10.1016/s0043-1354(01)00310-4
Nicholson, C. C., and Williams, N. M. (2021). Cropland heterogeneity drives frequency and intensity of pesticide use. Environ. Res. Lett. 16, 074008. doi:10.1088/1748-9326/ac0a12
Province of South Tyrol, Italy Prescription in the use of plant protection agents. Sentence of 1st July 2014, Nr. 817. Available at: https://www.provinz.bz.it/land-forstwirtschaft/landwirtschaft/obst-weinbau/abstandsregelung-ausbringung-pflanzenschutzmitteln.asp (Accessed July 27, 2022).
R Foundation for Statistical Computing, (20212020). R: A language and environment for statistical computing. Vienna, Austria: R Core Team. Available at: https://www.R-project.org/.
Savary, S., Willocquet, L., Pethybridge, S. J., Esker, P., McRoberts, N., and Nelson, A. (2019). The global burden of pathogens and pests on major food crops. Nat. Ecol. Evol. 3, 430–439.
Singh, N. S., Sharma, R., Parween, T., and Patanjali, P. K. (2018). “Pesticide contamination and human health risk factor,” in Modern age environmental problems and their remediation (Springer), Berlin/Heidelberg, Germany, 49–68. Available at: doi:10.1007/978-3-319-64501-8_3
Skinner, J. A., Lewis, K. A., Bardon, K. S., Tucker, P., Catt, J. A., and Chambers, B. J. (1997). An overview of the environmental impact of agriculture in the UK. J. Environ. Manag. 50, 111–128. doi:10.1006/jema.1996.0103
Statistical database of the European Union, (2017). Eurostat Available at: https://ec.europa.eu/eurostat/web/main (Accessed July 27, 2022).
Sutton, T. B., Aldwinckle, H. S., Agnello, A. M., and Walgenbach, J. F. (2014). Compendium of apple and pear diseases and pests. 2nd Edn. doi:10.1094/9780890544334.fm
Tang, F. H., Lenzen, M., McBratney, A., and Maggi, F. (2021). Risk of pesticide pollution at the global scale. Nat. Geosci. 14, 206–210. doi:10.1038/s41561-021-00712-5
Weisenburger, D. D. (1993). Human health effects of agrichemical use. Hum. Pathol. 24, 571–576. doi:10.1016/0046-8177(93)90234-8
Wickham, H., Chang, W., and Wickham, M. H. (2016). Package ‘ggplot2. Create Elegant Data Vis. Using Gramm. Graph. Version 2, 1–189.
Workgroup for Integrated Fruit and Production in South Tyrol, (2020). Guidelines for the integrated cultivation of pome fruits. Available at: http://www.agrios.it/en/for-fruit-growers/2017-guidelines-for-the-integrated-cultivation-of-pome-fruits/.
Keywords: pesticides, agriculture, health risk, environmental contamination, preventive measure, non-point agricultural pollution
Citation: Prechsl UE, Bonadio M, Wegher L and Oberhuber M (2022) Long-term monitoring of pesticide residues on public sites: A regional approach to survey and reduce spray drift. Front. Environ. Sci. 10:1062333. doi: 10.3389/fenvs.2022.1062333
Received: 05 October 2022; Accepted: 21 November 2022;
Published: 14 December 2022.
Edited by:
Liang Zhang, Innovation Academy for Precision Measurement Science and Technology (CAS), ChinaReviewed by:
Pankaj Bhatt, Purdue University, United StatesJiaogen Zhou, Huaiyin Normal University, China
Copyright © 2022 Prechsl, Bonadio, Wegher and Oberhuber. This is an open-access article distributed under the terms of the Creative Commons Attribution License (CC BY). The use, distribution or reproduction in other forums is permitted, provided the original author(s) and the copyright owner(s) are credited and that the original publication in this journal is cited, in accordance with accepted academic practice. No use, distribution or reproduction is permitted which does not comply with these terms.
*Correspondence: Ulrich E. Prechsl, dWxpLnByZWNoc2xAZ21haWwuY29t
 Ulrich E. Prechsl
 Martina Bonadio1
 Michael Oberhuber