 Sabire YAZICI
- Nazar Tasimacilik Ltd. Sti, Istanbul, Turkey
Many countries are concerned about environmental dirtiness problems due to CO2 emissions, and they try to fix this issue by developing several policies. The major goal of this study is to reveal the coefficient of influence factors on carbon emissions by considering different time periods within the framework of implementation of policies. In this context, this study explores the relationship between economic growth, energy consumption, and CO2 emissions within the frame of the environmental Kuznets curve hypothesis. However, this article considers the linkage between the logistics sector and CO2 emissions in terms of the environmental Kuznets curve hypothesis for Denmark, Sweden, Norway, and Finland from 1960 to 2015, which replaced the sea transportation as independent aside from (economic growth) gross domestic product and energy consumption. The Fourier Shin co-integration test, fully modified least square, dynamic least square, canonical co-integrating regression, and autoregressive distributed lag bound test models are performed from 1960 to 2015 (as two separate periods) as annual data in order to reveal the long-run relationship between variables within the scope of the environmental Kuznets curve hypothesis for Scandinavian countries including Denmark, Sweden, Norway, and Finland. According to results of the autoregressive distributed lag bound test, if maritime freight increases by 1%, CO2 emissions increases by 0.2723%. A 1% increase in energy consumption increases CO2 emissions by 0.3356%. The short-term autoregressive distributed lag bound test findings ascertain that the major factors of CO2 emissions in the short-term are changed in maritime freight, energy consumption, and gross domestic product at a 1% significance level for Denmark. Due to the explosive growth of the transportation sector, coupled with a significant rise in greenhouse gas emissions from this sector, preventive policies should be followed. In order to avoid pollution from transportation, it is essential to find out its necessary drivers. In addition, policymakers should kick-start applications of new technology in transportation to reduce pollution by releasing new energy-saving vehicles. In this sense, transportation carbon tax and strengthening incentives for energy conservation should be implemented.
1 Introduction
The industrialization process has touched all the sectors, especially in terms of energy sources and economic growth. Economic growth is a prerequisite for communities to develop socially, politically, and culturally. For these reasons, societies have encouraged economic growth from the very beginning, making it their primary goal. In addition, energy plays a very important role both in determining the course of countries from the point of the international policies in influencing the development and welfare levels of countries. Energy resources must be used efficiently by countries to achieve sustainable economic growth. High-income economies are classified by innovation, technology, services, environmental policy pressure, and regulatory costs, ensuing transfer of polluting industries to developing countries. This in fact reduces the environmental pollution compared to industrial markets. As a result of this, boosting industrial revenue while decreasing over dependence on fossil fuels is indispensable in order to lower the wastage. High volume of production, besides providing higher output increase, also brought about an increase in production that harms the environment. The relationship between economic growth and the environment is an issue that economists have emphasized in recent years. The effects of environmental problems such as global warming, air pollution, increased use of natural resources, and CO2 emissions have been felt, especially since the 1990s. Environmental and energy issues have become of primary importance in the field of economic growth on international platforms. Therefore, environmental problems constitute the main agenda in the international arena today. The study by Kuznets (1955) has an important place in this area. There are many studies in the literature examining the relationship between economic growth and carbon emissions. Some of these studies (Köksal et al., 2020; Beşe and Kalayci, 2021; Korkmaz et al., 2017; Tarazkar et al., 2021) discuss economic growth and carbon emissions theory known as the environmental Kuznets curve in the literature.
In line with international agreements and joint initiatives, countries are required to avoid practices that will harm the environment. Especially since the 1970s, the increasing environmental pollution, climate changes, and the changes caused by the global warming problem have revealed the importance of initiatives protecting the environment. Kuznets (1955) expressed that per capita income in developing countries demonstrates a more uneven distribution compared to developed countries. On the other hand, the income inequality, which increases in the initial stage of economic development, is narrowing in the later stages of the development process. According to this hypothesis, there is an inverted U-shaped relationship between income and income inequality that first increases and then decreases. This hypothesis, which Kuznets put forward in (1955), became the center of attention again in 1991, when Grossman and Krueger (1995) reinterpreted it for the relationship between income growth and the environment. Another factor that has a positive effect on the environment is the technical effect of economic growth. According to this statement, it emerges with the replacement of dirty technologies by cleaner technologies and contributes to the technological development provided by economic growth by allocating more resources to research and development activities of a wealthy country. This factor is particularly effective with the emergence of cleaner and more efficient technologies used in the energy sector. In the early stages of economic development, countries are more willing to increase production. At this stage, there is an increasing relationship between income growth and environmental degradation as the scale effect is more dominant. Initially, both air pollution and gross domestic product (GDP) increase; however, the trend reverses beyond some level of income so that at high income levels and GDP, environmental sensitivity is affected positively. This implies that the environmental effects indicator is an inverted U-shaped function of income per capita. These effects reveal the environmental Kuznets curve hypothesis, which is demonstrated in Figure 1.
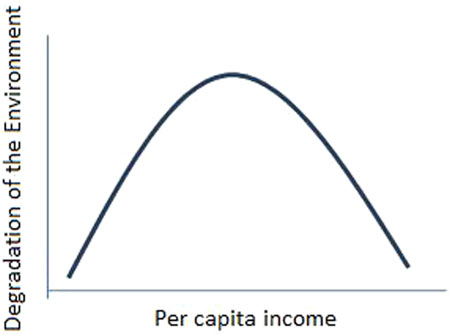
FIGURE 1. Environmental kuznet curve.
Considering the data for CO2 emissions between 1960 and 2018, it is seen that there has been a serious downward trend in Scandinavian countries, especially in the period after 1997 (see Figure 2). The main reason for this is reflected in the energy policies of the countries as a result of the agreement made in Kyoto, Japan in 1997. The main purpose of the article is to examine the before and after of the Kyoto Protocol and to support it with empirical findings. In this context, the other aim of the article is to give suggestions to countries which they should develop regarding energy policies.
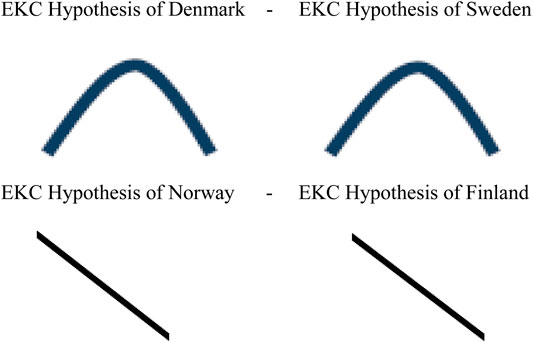
FIGURE 2. EKC hypothesis of Scandinavian countries.
The other target of this research is to peruse the coefficient of influence factors on carbon emissions by considering different time periods within the framework of implementation of policies. In this sense, the research work explores the relationship between economic growth, energy consumption, and CO2 emissions within the frame of the environmental Kuznets curve hypothesis. In order to analyze the sea transportation-induced EKC hypothesis through relevant variables for Denmark, Sweden, Norway, and Finland from 1960 to 2015 as two periods, the annual data is derived from Worldbank (2021a, b, c), UNCTAD (2021), and Ourworldindata, (2021). According to Figure 3, GDP increase in Scandinavian countries became sharper especially after 1997. Considering the decrease in CO2 emissions, it is seen that they grow without deteriorating the environment, especially after this period.
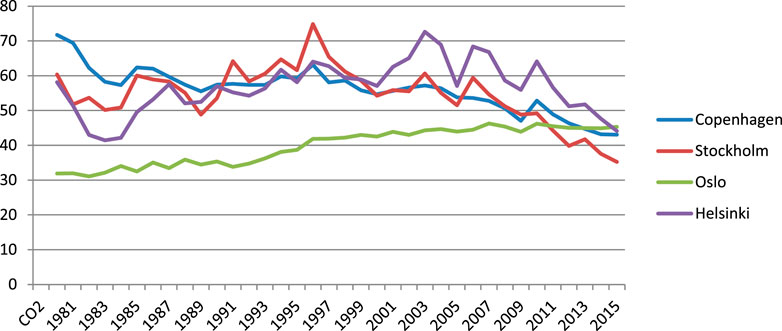
FIGURE 3. CO2 emissions of Scandinavian cities (1980–2015).
The main motivation of this research is to examine the maritime freight-induced EKC hypothesis which is not discussed within the context of Scandinavian countries in the academic literature. In addition, maritime transport has not been added to the EKC model as an independent variable in the studies conducted in the world academic literature for Scandinavian countries. In this context, the major motivation of this research is to give recommendation to policymakers by using a time series analysis in the sense of the impact coefficients of damage to the environment by considering various periods of four countries notably before and after the Kyoto Protocol agreement.
The aim of the study is to reveal the relationship between economic growth, energy consumption, sea transport, and CO2 emissions within the frame of EKC hypothesis. FMOLS, DOLS, CCR, and ARDL models are performed from 1960 to 2015 (as two separate periods) as annual data in order to reveal the long-run relationship between variables within the scope of EKC hypothesis for Scandinavian countries including Denmark, Sweden, Norway, and Finland. When the contributions and novelties of this research to the existing literature are taken into account, time series models point out the long-run relationship between maritime freight, economic growth, energy consumption, and CO2 emissions from 1960 to 2015, which is verified by the EKC hypothesis for Denmark and Sweden. However, no long-run relationship is found among relevant variables both for Norway and Finland from 1960 to 1997 and 1998 to 2015, which is not verified by the EKC hypothesis. In addition, the long-run ARDL results ascertain that if maritime freight increases by 1%, CO2 emissions increases by 0.2723%. A 1% increase in energy consumption increases CO2 emissions by 0.3356%. Short-run ARDL findings ascertain that the main elements of CO2 emissions in the short-run are changed in maritime freight, energy consumption, and GDP at a 1% significance level for Denmark. Considering the research results and the subject, there is no maritime freight-induced EKC hypothesis topic in the academic literature, which makes this research work unique.
This study is respectively structured as follows: Section 1 presents general overview and the theoretical background of the research including EKC hypothesis, Section 2 discusses the findings of the empirical literature notably regarding transportation-induced EKC hypothesis, Section 3 presents the methodological framework and empirical results of the research, and finally, Section 4 includes the conclusion part and interprets the findings of the study by providing some recommendations to Scandinavian countries’ governments.
2 Literature Review
The majority of research works concentrate more on the relationship between economic growth, energy consumption, and CO2 emissions in the sense of EKC hypothesis (Alvarado et al., 2021; Ahmad et al., 2021b; Ahmad and Wu, 2022). However, this study considers the linkage between the logistics sector and CO2 emissions in terms of the EKC hypothesis for Denmark, Sweden, Norway, and Finland from 1960 to 2015, which replaced the sea transportation as independent aside from (economic growth) GDP and energy consumption. It is broadly acknowledged that the major impact of changing environment is the excessive rise of greenhouse gases, notably CO2 emissions. On the other hand, economic growth associated with the variations in demand is estimated to increase CO2 emissions. On the contrary, following the EKC theory, economies’ dirtiness level would initially rise with increased manufacturing, owing to non-renewable energy sources (Ahmad et al., 2020; Ahmad et al., 2021a; Alvarado et al., 2021). The previous academic work regarding the EKC hypothesis was mostly related to tourism-induced EKC hypothesis, which was elaborated by Katircioglu (2014) by considering the relationship between tourism development and CO2 emissions in Singapore. According to his findings, CO2 emissions and arrival of tourists are in long-run relationship; CO2 emissions returned to its long-run equilibrium by 76.0% speed of adjustment via the economic growth, arrival of tourists, and energy consumption. Tourism development has negatively impacted CO2 emissions both in the long-run and the short-run era. Consequently, findings of the Granger causality tests ascertain that there is one-way causality that goes into action from arrival of tourists to CO2 emissions in the long-run in the economy of Singapore. For this reason, the tourism-induced EKC hypothesis is verified in terms of Singapore.
One of the main research questions of this work is are there any short- and long-run relationships between economic growth, sea transportation, energy consumption, and CO2 emissions for Scandinavian countries from 1960 to 2015? by focusing on the shape of the EKC hypothesis. For this reason, several econometrical models are performed in order to answer this question. Kalayci and Özden (2021) assayed the impact of sea transport, trade liberalization, and industrial development on CO2 emissions for China by implementing annual data ranging from 1960 to 2019 through econometric methods including FMOLS, DOLS, and CCR. According to the results of three econometric models, there is a crucial long-term relationship between sea transportation, trade liberalization, industrial development, and carbon dioxide emissions. Considering the long-term linkage between sea transportation and CO2 emissions of Kalayci and Özden’s (2021) research results, it bears similarities with the findings of this article for the first cycle of Denmark and Sweden. Raza et al. (2019) investigated the economic and environmental factors influencing energy use by implementing wavelet theory. In order to evaluate association among variables, monthly data are used from 1973 to 2015. The methods applied are wavelet covariance, wavelet coherence spectrum, wavelet correlation, maximal overlap discrete wavelet transform, and continuous wavelet power spectrum on the dataset to construct a wavelet convolutional function. In this sense, the overview reveals that energy usage has a strong positive relationship on carbon emissions. The findings of the causality test indicate the causal relationship between energy usage and carbon emissions, which is confirmed empirically. A rise in energy usage through air transportation activities that require high energy consumption deteriorates the climate and causes more carbon emissions to the environment (Satrovic et al., 2021). Arvin et al. (2015) analyzed the linkages between transportation intensity, proportion of urbanization, carbon dioxide emissions, and economic growth. They used two indicators of transportation intensity: the rate of utilization of air passenger facilities and the rate of utilization of air freight facilities. Using aggregate data from 1961 to 2012, multiple correlations between these four variables were determined. The main result of aforementioned article demonstrates that economic growth intrinsically returns to its long-run equilibrium course. Their key argument is that passenger carriage intensity should be increased in developed countries within the G-20 region as a means of stimulating economic development.
Zaman et al. (2017) evaluated the effect of transportation expenditures, energy demand, and economic growth on carbon dioxide emissions by taking into account the 11 transition economies, from 1995 to 2013. In this context, according to the results, there is a substantial effect of transportation on CO2 emissions which is demonstrated within the framework of theoretical background by considering trade-led growth and trade-led energy demand. Saboori et al. (2014) assessed the bilateral long-term connection between energy usage in the road transport sector with CO2 emissions and economic growth in OECD countries. The research points out long-term two-sided connection between economic growth and CO2 emissions, energy consumption and CO2 emissions, and the road sector and CO2 emissions for the OECD countries by implementing a time series analysis from 1960 to 2008 and by using the FMOLS method. The research results are partially consistent with this study’s findings in terms of the long-run relationship between relevant variables including transportation, energy use, economic growth, and CO2 emissions for the first cycle of Denmark and Sweden. Umar et al. (2020) discussed sustainable development goals of the United States, notably, in terms of transportation and examined the effect of fossil fuel energy usage, biomass energy usage, transportation sector, and GDP on CO2 emissions for the United States by using the FMOLS, DOLS, CCR, Hatemi-J co-integration, and spectral Breitung–Candelon causality test from 1981 Q1 to 2019 Q4, in order to comprehend research results. The research result indicates that 1) a non-linear co-integration between the causal factors of environmental quality and the transportation sector is revealed empirically by performing the Hatemi-J co-integration and Gregory–Hansen co-integration tests; 2) the real GDP, transportation sector, and consumption of biomass energy have a negative influence on carbon emissions; and 3) fossil fuel energy usage, biomass energy usage, and real GDP influence the CO2 emissions for the United States at different frequency levels in the long term. Yuan et al. (2017) investigated the inter-relationships between energy consumption, transportation sector, and CO2 emissions including 30 provincial units in China. According to their results, energy consumption and transportation development had positive significant effect on CO2 emissions, which is consistent with this study’s findings in terms of impact coefficient of the co-integrating models from 1998 to 2015. Batur et al. (2019) used the passenger transport system to examine numerous policies with various scenarios by considering their potential impact in decreasing energy usage and carbon emissions for the upcoming periods by operating a systems dynamics model for Turkey. The structured systems dynamics model contains four subsystems: energy consumption, transportation, CO2 emissions, and household disposable income. The energy consumption and the CO2 emissions from motorized passenger transport are estimated for the following scenarios depending on historical data from 2000 to 2015. The scenarios are as follow: 1) travel demand management policies that contain various levels of transportation cost rise, and a decrease in travel volume provide a 10% enhancement in the fuel economy of the vehicles; 2) a 30% rise in the transportation cost; 3) a 10% decrease in the emission intensity of electricity generation; and 4) a 15% decline in travel volume. Tanczos and Torok (2007) took into consideration the relationship between climate change and CO2 emissions to forecast the CO2 emissions of the transport sector in Hungary. They explained the emissions from the transport sector by considering the external factors in order to provide a sustainable community. The Environmental Protection Agency (EPA) is an institution that maximizes the rate of living and opportunities of the next generations with science, art, philosophy, and technology so that the speed of linear technological development, the satiation of raw materials and resources of the world, and the living standards of people of future generations are not worse. The most important aim in European transport policies is sustainable mobility. For this purpose, transportation must be standardized and the efficiency of transportation services must be improved, while the air pollution must be reduced or prevented. Controlling motorization from emissions is a work for electric engineers. The goal of economists is to decouple economic activity from mobility.
Nasreen et al. (2018) investigated the connection between economic development, transport services, and energy use for 63 developing countries in the period of 1990–2016. Countries were segmented into lower-middle-, upper-middle-, and high-income groups. The findings indicate a proof of a bidirectional causal relationship between growth of GDP and freight transportation and between growth of GDP and energy consumption by implementing the GMM method in all selected panels. The other significant finding demonstrates that energy consumption triggers economic growth. One of the findings of the study indicate that highly developed economies have a near positive relationship between freight transport and energy consumption, while upper-middle- and lower-middle-income countries have a negative relationship between freight transport and energy usage. Economists have acknowledged that energy plays a key role in economic development. A crucial recommendation is that it is vital to make gains in technology relating to vehicles to reduce energy intensity from the transportation sector and boost the energy efficiency in transportation operation, which will enable a greater positive position for transport in global economic activity.
Fan and Lei (2017) examined the connection between parameters by applying the EKC hypothesis. They took into account the driving factors which are seldom investigated in academic literatures aside from “decoupling” and “recoupling” analyses. For this purpose, they worked on the interdependence between CO2 emissions, transportation, and economic growth in China from 1995 to 2014 using the Tapio elastic analysis, taking into consideration the contribution from industrial energy saving, emission reduction, industrial development, and operating efficiency. According to the results, the negative effect of industrial energy saving elasticity overtook the positive one from industrial operating efficiency elasticity, which led to worsening of the decoupling state between economic growth, CO2 emissions, and transportation. The decoupling state was developed from expansive negative decoupling to weak decoupling after 2008, which can be attributed to policy-oriented practices contributing the energy saving.
Kharbach and Chfadi (2017) explored the transport sector within the context of environmental economics by taking into account the energy transition for Morocco. They evaluated the impact of some major elements on CO2 emissions including the road transportation sector in Morocco. In order to examine the interdependence between CO2 emissions and economic growth in the road transportation market, co-integration is applied to estimate the energy consumption pattern, and then the hypothesis of the EKC is addressed within the context of empirical findings. If all factors remain constant, economic growth would lead to a reduction in emissions in the transport sector. Mohsin et al. (2019) assayed the long-run stable relationship between energy consumption, environmental degradation, economic growth, and transportation services using a time series analysis including regression coefficients, a hybrid error correction model, the Dickey–Fuller test, platykurtic distribution, and a co-integration test to verify hypothesis for Pakistan’s transport sector from 1975 to 2015. Their findings purported that a rise in energy consumption, economic growth, and transportation services caused more environmental degradation. Furthermore, when energy consumption has risen by 13.5%, it indicates a high dependence of economic growth on energy consumption throughout the term. In addition, there is a positive relationship between energy consumption per capita and CO2 emission as well. Finally, they provided some recommendation for policymaker to reduce environmental degradation with eco-friendly retainable transportation services.
Amin et al. (2020) assessed the effects of energy consumption, economic growth, transportation sector, and urbanization on CO2 emissions within the scope of the EKC hypothesis for EU countries by performing the non-causality and second generation panel unit root tests from 1980 to 2014. The test results revealed that the rise in renewable energy usage decreased transportation-induced CO2 emissions, while urbanization had empirically inconsequential positive effects on environmental degradation. A rise in energy consumption mitigates transportation-induced carbon emissions to approximately 12%. Therefore, the EKC hypothesis is verified. Furthermore, one-way causality runs through energy consumption, urbanization, and economic growth to transportation-induced carbon emissions. The results of this study recommended strengthening the retainable transportation sector by developing the green technology, energy-efficient modes of transportation, and providing environmental awareness to community and their overall concerns mostly related to the environmental matter caused by transportation. This study also shows significant evidence to the policymakers of EU countries for, notably, sector-based renewable energy projects, garnering attention to the greenhouse gas effect of the European transportation sector. Godil et al. (2020) explored the connection between the transportation sector including the two parameters (passenger and freight) and CO2 emissions in terms of the US economy from 2000 M1 to 2019 M8 using the QARDL method. The empirical results demonstrated the negative remarkable correlation between the transportation sector and CO2 emissions; however, this interdependence holds at low quantiles of freight transport, whereas the same connection has been revealed at most quantiles of passenger transport. Therefore, this shows that the transportation sector of the United States contributes to decrease CO2 emissions. Finally, the government should develop essential technologies to sustain clean usage within the society and decrease CO2 emissions by ensuring stable economic development through eco-friendly transportation services. Magazzino et al. (2021) employed the D2C algorithm to find out the causality of solar wind production, coal consumption, economic growth, and CO2 emissions in the United States, India, and China. In the same way, Magazzino (2020) performed a causal direction from depth (D2C) algorithm in order to derive higher pollution due to economic growth concentrations, which may cause neo-crown pneumonia by making the respiratory system more susceptible to infection.
Guo et al. (2016) revealed the connection between CO2 emissions, logistics, and economic growth by performing a panel data analysis using econometrics theory and combination of statistics. In addition, the statistical analysis contains the annual data of 10 main regions in China from 2005 to 2014. The econometrical approach of their study included the variability of logistics within the framework of previous researches, and this variable is used as freight turnover of the regions. CO2 emissions are replaced as a dependent variable by considering the factors including natural gas and consumption of coal and oil. The findings of their study ascertain that the amount of logistics and economic growth have a contribution toward CO2 emissions, and the long-run connections are different among different cities in China, mostly affected by the difference between the level of logistic development, development mode, and economic structure.
Katircioglu et al. (2021) conceived the role of both transportation and financial systems in energy demand for developed and developing economies from 2000 to 2015. The results of the ARDL model ascertain that economic growth, money supply, international trade, and CO2 emissions are responsible for the increase in the demand of energy in developed countries. On the other hand, domestic credit, FDI, trade, and CO2 emissions cause an increase in demand in the energy for developing economies. The empirical results of this study coincide with Katircioglu et al. (2021)’s finding, especially in terms of the relationship between transportation and CO2 emissions.
Guo et al. (2017) affirmed the impact of the transportation sector on environmental degradation by implementing a different econometric model including VAR of GDP, urban population, and the freight turnover rate. In this context, they have developed a model by performing the time series analysis from 2000 to 2014 in China. Furthermore, the freight turnover rate, transportation sector, and SO2 emissions are taken into account as variables in order to represent the population size, logistic services, and environmental degradation, respectively. According to results, the development of the transportation sector had the substantial impact on environmental degradation. In addition, an impulse response analysis points out that the development of the transportation sector sparked off more environmental degradation which is confirmed empirically. Sharif et al. (2020) implemented the QARDL model in order to reveal the effect of GDP, globalization, transportation, and CO2 emissions for Malaysia from 1995 Q1 to 2018 Q4. The findings ascertain that GDP is considerably positive with CO2 emissions at lower to upper quantiles. Tourism has a negative impact on CO2 emissions at higher quantiles. In addition, the transportation sector and globalization are positive with CO2 emissions at upper-middle to higher quantiles. Consequently, according to empirical findings, EKC verified the existence of the inverted U-shaped curve for Malaysia.
Saleem et al. (2018) affirmed the relationship between energy consumption, aviation transport, and environmental pollution using a panel of 11 countries, from 1975 to 2015. In this sense, the empirical findings of 11 countries verify the EKC hypothesis in terms of the connection between aviation transport and individual earnings concerning the CO2 emissions, while there is a U-shaped interconnection between GHG emissions and the transportation sector. The correlating relationship between air transport passengers and aid flows resulted from the environmental resources rents. Railway goods have a huge effect on CO2 emissions, population density, and energy demands. The air transport freight plays a positive role on GHG emissions and a negative role on the natural resource rents. The relationship between railway transportations and per capita income increases in developed economies whereas energy and aid decreases. By analyzing the passenger data, it is clear that the occurrences of air transport passengers, the energy units consumed, and the relative assistance provided would largely affect CO2 emissions, GHG emissions, and the decrease in natural resource revenues over the next 10 years. Dong et al. (2019) used the technology model, the stochastic impacts of regression on population, and an unbalanced panel dataset of 128 nations from 1990 to 2014 to examine the impact of the local and global CO2 emissions by conceiving the effectiveness of renewable and non-renewable energies. According to results of their study, renewable energy can lead to a decline in CO2 emissions and verify the causality linkage among the variables across the countries.
Dong et al. (2020) perused the influence of renewable energy usage on CO2 emissions by classifying the regions with different income levels, conceiving the emission growth renewables relations in terms of a global panel of 120 countries from 1995 to 2015. Slope heterogeneity and cross-sectional dependence are confirmed for the global panel containing for all four subpanels. The high-income subpanel and the upper-middle-income subpanel are verified using the EKC hypothesis for the global panel. Consequently, energy usage has a negative influence on CO2 emissions which is not critical; the mitigation effect may be camouflaged by higher economic growth and increasing non-renewable energy usage. Furthermore, similar opinion is indicated in the Turkish case where Magazzino (2016) argued that there is no causal linkage between economic growth, energy consumption, and CO2 emissions. The other research results of Magazzino (2017a) demonstrated that the response of CO2 emissions to energy use is negative and statistically crucial in both the estimated coefficients and impulse responses considering the 3-variable vector autoregressions through panel VAR technique. Additionally, Magazzino (2017b) verified that there is no causal relationship between energy use and real GDP using the panel VAR technique for 19 APEC countries from 1960 to 2013. Moreover, Magazzino (2014) investigated the relationship between energy consumption, economic growth, and CO2 emissions for ASEAN-6 countries including Brunei, Indonesia, Malaysia, Singapore, Thailand, and Philippines from 1971 to 2007 using the panel VAR approach. According to the results, energy usage and GDP have a crucial positive relationship, and the error variances in CO2 emissions are sensible to disturbances in both economic growth and CO2 emissions equations, which coincides with the findings of this study, particularly, FMOLS, DOLS, and CCR analyses for Denmark and Sweden from 1960 to 1997.
The economic growth and environmental dirtiness nexus has broadly been investigated by academicians since the study of Grossman and Krueger (1991) was recommended. The major apprehension of Grossman and Krueger (1991) was to unearth how environmental pollution changes the dynamic growth path of 42 countries. For this reason, a cubic model was developed in order to empirically figure out the relationship and reported an N-shaped relationship between economic growth and environmental pollution. The environmental pollution and economic growth nexus has been investigated using different estimation models, and energy consumption related or macroeconomic variables in several samples is reported in Table 1. Studies regarding the transportation-based EKC hypothesis are given including methodology, variables, data interval, turning point of EKC hypothesis, and countries. There is no sea transport-induced EKC hypothesis study in the academic literature, which makes this research work unique. In the context of the EKC hypothesis, there have been researchers who have obtained different findings for different countries. Ozkan, Yanginlar, and Kalayci (2019) affirmed the relationship between CO2 emissions, GDP, energy usage, and air transportation for eight developed and eight developing economies from 1980 to 2013 by conceiving the EKC hypothesis. They employed the panel data analysis to ascertain the environmental consciousness of the two groups of countries. In this sense, the empirical results prove that environmental consciousness is extremely low for the two groups of economies from 1980 to 2000.
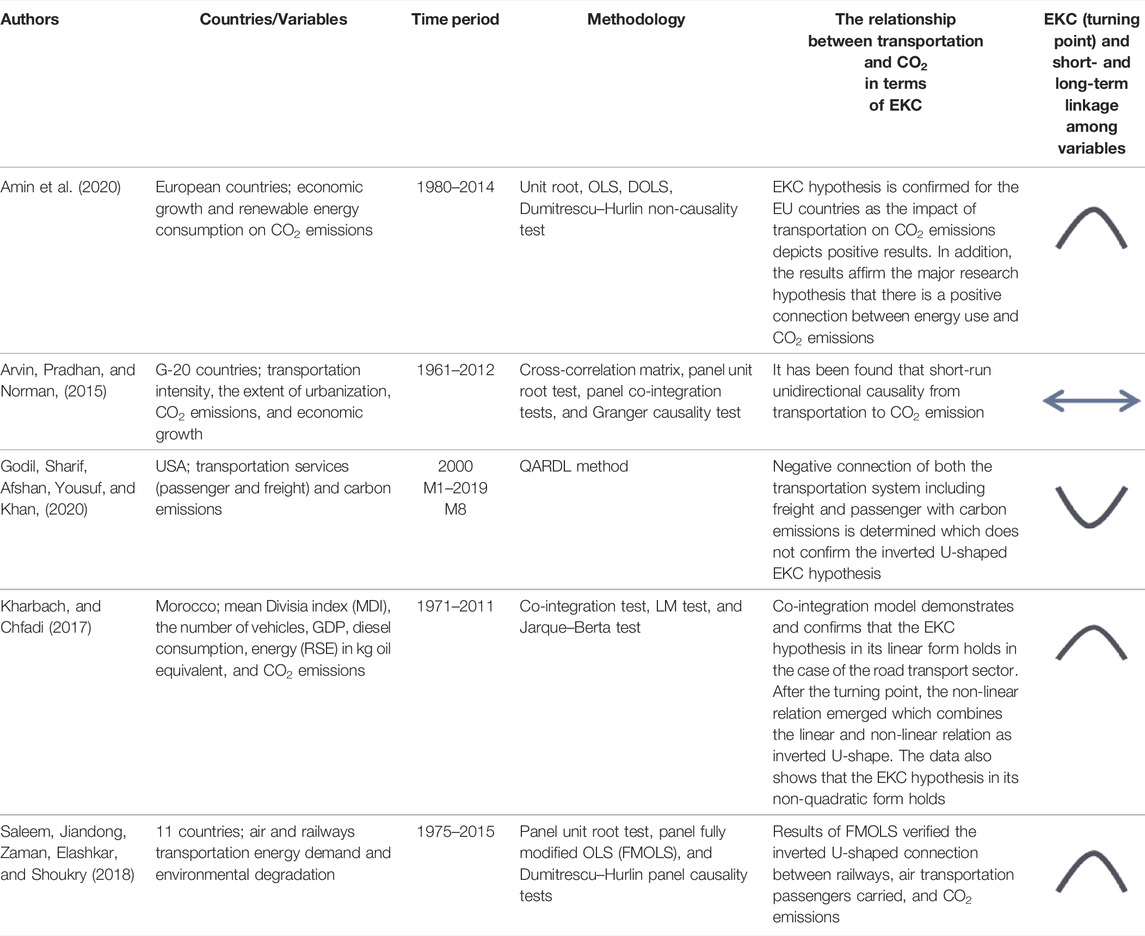
TABLE 1. Literature review regarding transportation-induced EKC hypothesis in terms of main results.
The major goal of this study is to reply the following questions below. 1) Which Scandinavian country verifies the maritime freight-induced EKC hypothesis? This topic is an important research gap in the current literature. This subject has not been discussed before in the academic literature. 2) Is there any long-run relationship between maritime transport, economic growth, energy consumption, and CO2 emissions from 1960 to 2015 in Scandinavian countries? 3) What is the impact coefficient of damage on environment by considering various periods of four countries including Denmark, Sweden, Norway, and Finland (1960–1997 and 1998–2015) notably before and after the Kyoto Protocol agreement? This topic is an important research gap in the current literature. In this context, the main reason for selecting the variables including economic growth, energy consumption, CO2 emissions, and maritime freight is revealing the damages of sea transportation within the context of EKC, which has not been studied before in the academic literature for Scandinavian countries.
3 Methodology and Data Analysis
This research work investigates the relationship between economic growth, energy consumption, CO2 emissions, and maritime freight by performing the Fourier Shin co-integration test and using FMOLS, DOLS, CCR, and ARDL models from 1960 to 2015 for Scandinavian countries including Denmark, Sweden, Norway, and Finland. Annual data are derived for merchant fleet registration of maritime transport from UNCTAD (2021), economic growth and energy consumption from the Worldbank (2021a) database, and CO2 emissions variable from Ourworldindata’s (2021) official database, respectively.
Phillips–Perron (PP) and Zivot–Andrews unit root tests were performed to analyze whether variables are stationary or not. In addition, FMOLS, DOLS, and CCR methods were implemented to comprehend the long-run co-integration relation between economic growth, maritime freight, energy consumption, and CO2 emissions. In the conclusion part, the ARDL model is used to reveal the long-run co-integrated relationship between economic growth, maritime freight, energy consumption, and CO2 emissions for Scandinavian countries from 1960 to 2015 annually. The Phillips–Perron (1989) (see Table 2 below) test is performed to comprehend the structure of parameters in terms of its stationariness. In this context, according to the Phillips–Perron (PP) test, findings of all series including economic growth, energy consumption, CO2 emissions, and maritime freight are not stationary. Therefore, first, differences of all variables are fulfilled to reveal the structure of series in order to proceed the FMOLS, DOLS, CCR, and ARDL models.
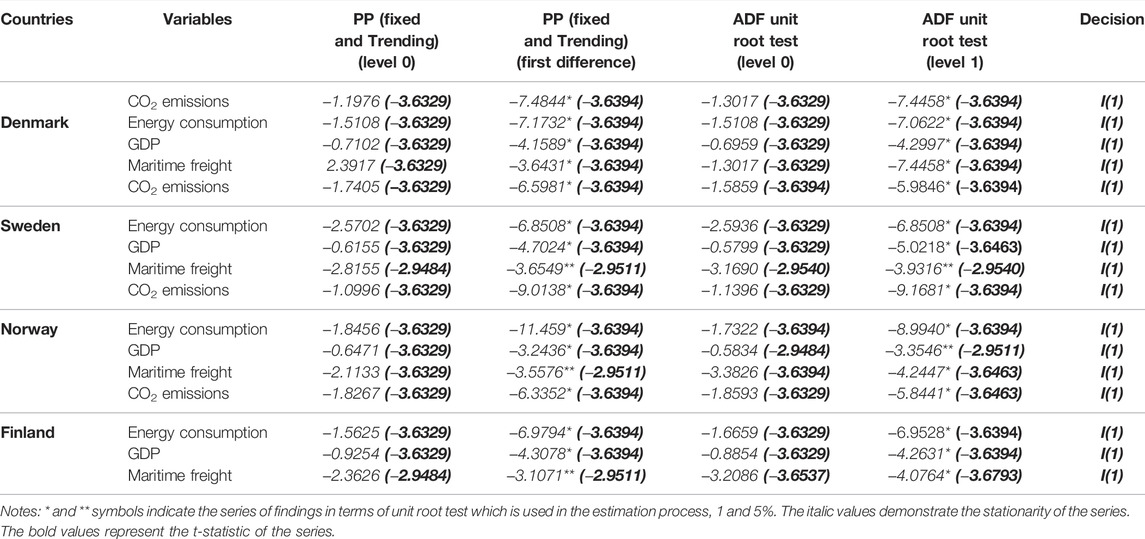
TABLE 2. Phillips–perron (PP) and augmented dickey–fuller (ADF) unit root test results of Scandinavian countries.
According to the findings of the Phillips–Perron (PP) test, the structure of series was determined as stationary after taking first degree of the series. In this way, FMOLS, DOLS, CCR and ARDL tests can be performed. In addition, applying the traditional PP unit root test without taking into account these structural breaks in the model may provide wrong output and lose validity from the point of estimation. In this sense, Zivot and Andrews (2002) developed a series of tests to comprehend the major endogenous structural changes. In addition, the test was run through the evaluation in the presence of a unit root against the alternative of a stationary process by way of a structural change both in trend or level. Thus, the ZA test examines the possibility of the entity of a segmented trend (see Table 3). The major goal of the ZA test is to establish the structural break and consider it as endogenous in the selected sample. The following equation regarding ZA test is demonstrated:
Consequently, the model for CO2 emissions in Scandinavian countries would be as follows:
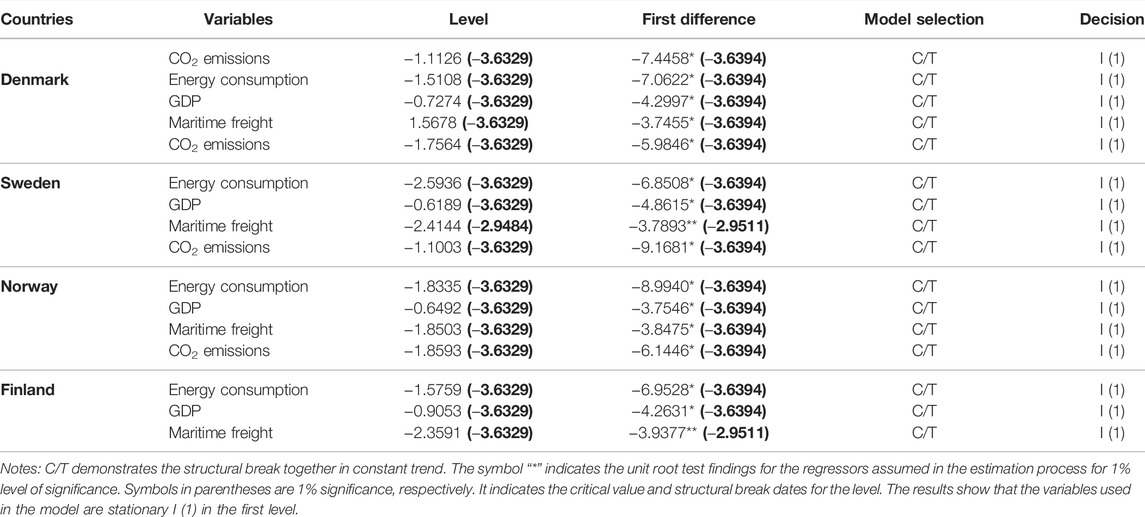
TABLE 3. Zivot–Andrews unit root test results of Scandinavian countries.
where CO2 is the logarithm of carbon dioxide emissions which is stated in levels,
In addition, the Zivot and Andrews (2002) unit root test is used with the thought that environmental pollution may occur at some point in Scandinavian countries during the 1960–2015 period, where pollution may cause a structural break in the relevant variables. If the absolute t value calculated from the one-tailed t-test in Table 3 is greater than the ZA critical value due to a structural break, it means that the series is stationary. In Table 3, the maritime transport, GDP, energy consumption, and CO2 emissions variables are stationary in the first difference. Thus, the result exhibits that ARDL, FMOLS, CCR, and DOLS methods are eligible to use, which reveals the structure of series in order to proceed the appropriate econometric models. The Fourier Shin co-integration test and FMOLS, DOLS, and CCR analyses are implemented to reveal the long-run effect coefficient between economic growth, energy consumption, CO2 emissions, and maritime freight for Scandinavian countries from 1960 to 2015 (as two separate periods). The CCR model, developed by Park (1992); the DOLS model, developed by Stock and Watson (1993); and the FMOLS model, developed by Hansen and Phillips (1990), were used. FMOLS is a semi-parametric method to efface the errors of correlation which is asymptotically impartial, influential, and similar with canonical co-integrating regression. In addition, it removes non-scalar coefficient error, permits for asymptotic chi-square testing, and involves normal mixture distribution. DOLS reproduce the explanatory variables through taking into consideration the lags and leads. In addition, the DOLS analysis estimates the co-integrating equation error problems including perpendicular stochastic regressors. Both FMOLS and DOLS models are beneficial to obviate the error of endogeneity and autocorrelation by considering nuisance parameters (Pedroni, 2001). These three methods mostly included the conditions in which the series performed, including a traditional co-integration analysis which should be affirmed as the series’ stationariness. Furthermore, having the possibility to interpret the derived coefficients provides a course of process from the point of CO2 emissions by taking into account the independent variables including GDP, energy consumption, and maritime freight.
Considering the generalized Dickey–Fuller (ADF) unit root test, developed by Engle and Granger (1987), the co-integration relations between four Stable I (1) variables at the first difference are tested. In general, the null hypothesis is tested as no co-integration in tests, and very few tests directly analyze the existence of co-integration. Shin (1994) developed a test based on the KPSS unit root test, which expresses the existence of co-integration between the series; whose null hypothesis is examined. Structural breaks are neglected in this test. In this context, the next generation test was developed by Arai and Kurozumi (2007) in order to test the existence of null hypothesis in which the co-integration is directly tested. In this approach, the structure and number of breakings are known by adding the Fourier trigonometric functions to the internal integration test. Tsong et al. (2016) added Fourier trigonometric functions to the Shin co-integration test and developed the Fourier–Shin co-integration test in which structural breaks of unknown structure, number, and time are taken into account as well. Thus, the authors eliminated the shortcomings of both mentioned co-integration tests. The regression Equation 4 created for the Fourier–Shin co-integration test is as follows:
while the equation is
If m = 0 or m = 1:
The scalar vector
According to Equation 7, k shows the optimal frequency, which is determined by the smallest value of the residual sum of squares. After determining the optimal frequency, as in Becker, Enders, and Lee (2006), it is decided whether the Fourier functions should be included in the equation by looking at the significance of the F statistic obtained from the model. If the obtained F statistic is higher than the table critical value, the Fourier functions used should be included in the model. Equations 5 and 6 are placed in Equation 8 in order to comprehend that there is a long-run relationship or not. Starting from Eq. 5, the co-integration statistics indicate that there is a co-integration relationship between the KPSS type null hypothesis structural breaks, and the variables are calculated in Equation 8, as follows:
where
First of all, the stationary levels of the variables is examined with the DF GLS unit root test, which is based on the generalized least squares method developed by Elliot et al. (1996) and can give effective results in series with small observations. Optimal lag length is determined by AIC (Akaike information criterion). According to the results of the DF GLS unit root test in Table 4, it is determined that all four series for Scandinavian countries contain unit root in their level values, and they are stationary at the first difference.
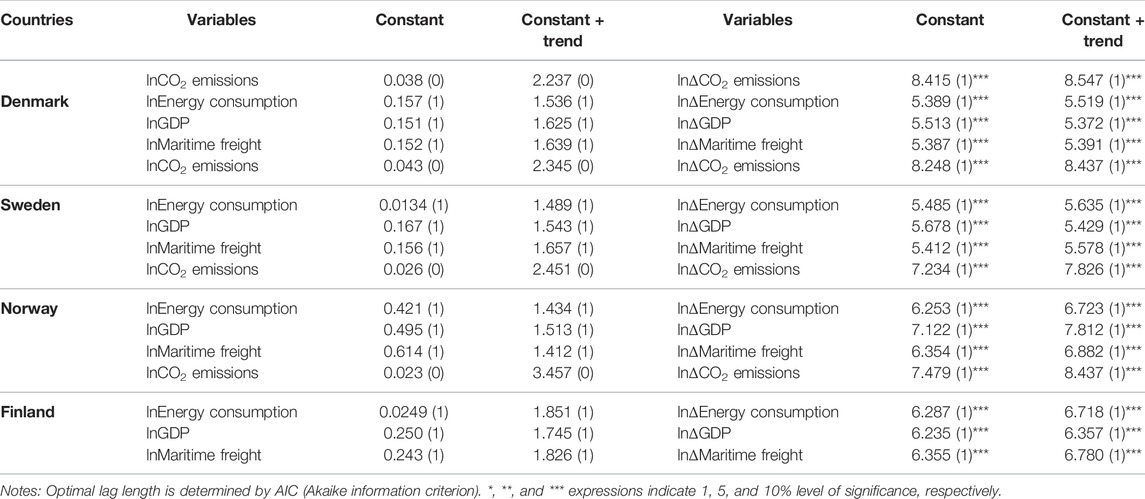
TABLE 4. DF-GLS unit root test results for Scandinavian countries.
The Fourier–Shin co-integration test is used to determine the long-term relationships between the variables determined as I (1). Table 5 indicates the results of this test. A stationary property of the series is examined by using the FKPSS test. According to the results in Table 5, F statistics indicates the non-linear terms which should be used in the test. The FKPSS test statistics demonstrate that all series are not stationary at I (0). For this reason, negative releasing impact and damaging the atmosphere cause environmental pollution when considering the initial stage of the countries. 0.172 At 5% levels for k = 1.
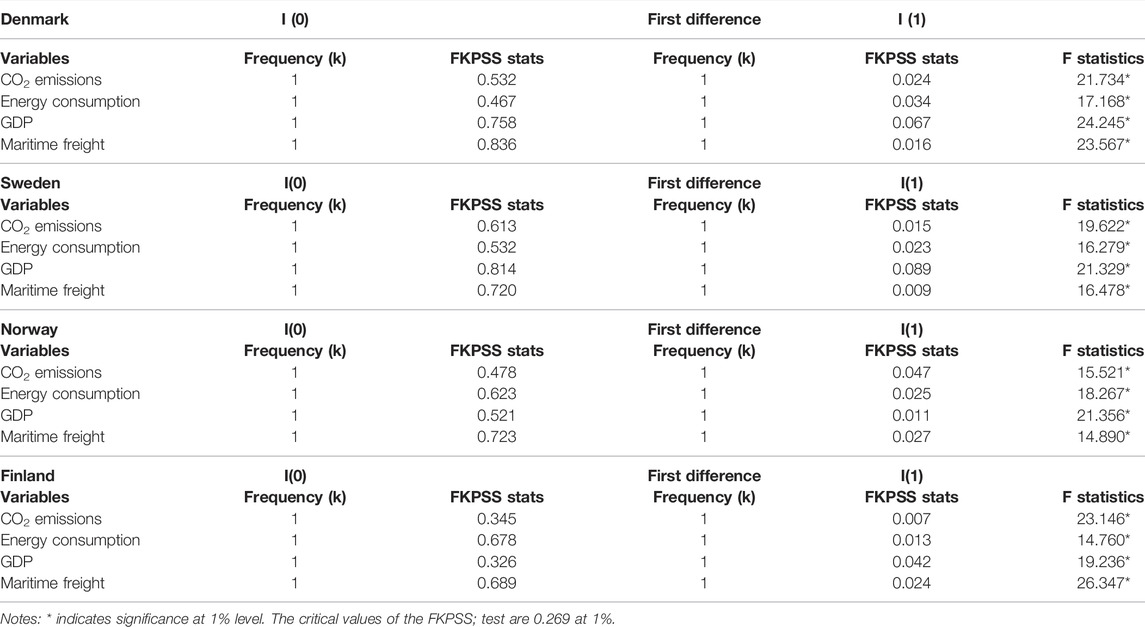
TABLE 5. FKPSS stationary test results.
Table 6 indicates the results of the Fourier–Shin co-integration test. While testing the co-integration relationship according to the obtained F statistics, the Fourier functions should be included in the model. The statistics demonstrate that there is a co-integration relationship of 1% between CO2 emissions, energy consumption, GDP, and maritime freight for Denmark and Sweden from 1960 to 2015. However, there is no long-run relationship between relevant variables for Norway and Finland from 1960 to 2015, which is consistent with FMOLS, DOLS, and CCR analyses. After determining the existence of a co-integration relationship between the variables, the long-term coefficients are estimated by FMOLS, DOLS, and CCR methods by taking into account the Fourier functions.
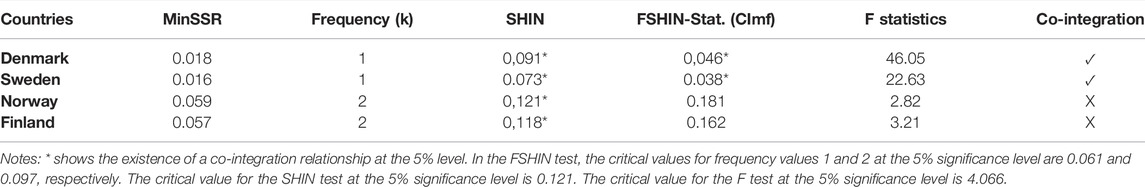
TABLE 6. Fourier–Shin co-integration test results.
Table 6 contains the results of Fourier–Shin co-integration test for the Scandinavian countries in order to determine the long-run relationship. Since the F statistic values in Table 6 are greater than the critical values (except for Norway and Finland), it is comprehended that the trigonometric terms are meaningful. According to the Fourier–Shin co-integration test results, the critical values are smaller than 5%, the existence of the null hypothesis in terms of co-integration for Denmark and Sweden cannot be rejected. In addition, using the Fourier–Shin co-integration test, a long-term relationship could not be obtained for Norway and Finland.
According to results of FMOLS (fully modified least square), DOLS (dynamic least square), and CCR (canonical co-integrating regression) models, there is a long-run stable relationship between economic growth, maritime freight, energy consumption, and CO2 emissions from 1960–1997 for Denmark and Sweden, which is indicated empirically. However, there is no long-run relationship between relevant variables both for Norway and Finland from 1960 to 1997 and 1998 to 2015, which is not confirmed in the EKC hypothesis (see Figure 2 below). The p-value of energy consumption, GDP, and maritime freight are more than 0.05, as shown in Tables 7, 8, both for Norway and Finland. Considering the periods of 1960–1997 and 1998–2015, CO2 emissions is determined as a dependent variable for Denmark and Sweden. Economic growth, maritime freight, and energy consumption affect the CO2 emissions, which confirm the linear relations between variables from 1960 to 1997 for Denmark and Sweden. If the second period (1998–2015) is taken into account, non-linear relations emerged between variables and whole independent variables do not have effect on CO2 emissions. The combinations of linear and non-linear relationship emerge as the inverted U-shape and confirmed using the EKC hypothesis for Denmark and Sweden (see Tables 7, 8 and Figure 2). On the other hand, considering both the terms 1960–1997 and 1998–2015, there is no long-run relationship between economic growth, maritime freight, energy consumption, and CO2 emissions for Norway and Finland, which is not confirmed using the EKC hypothesis (see Tables 7, 8 and Figure 2).
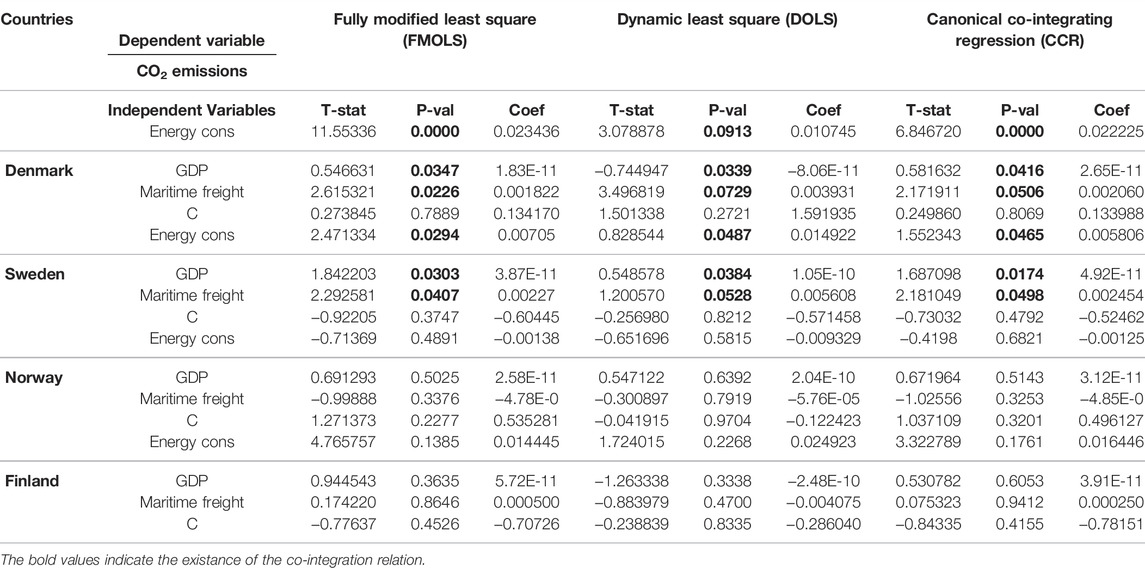
TABLE 7. Co-integration estimation results of Scandinavian countries (1960–1997).
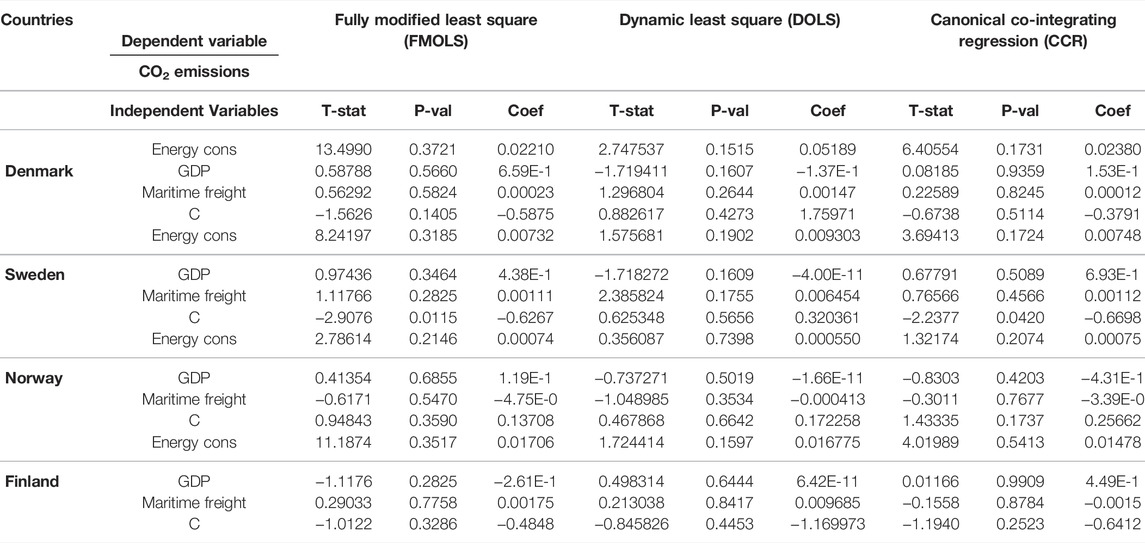
TABLE 8. Co-integration estimation results of Scandinavian countries (1998–2015).
The other widely used method of assessing the long-run relationship among variables is the ARDL method, which supports the findings of previous model’s results. The ARDL equation is demonstrated using econometric symbols; the parameters of long-term CO2 emissions are examined in Equation 10. The ARDL method is performed out of FMOLS, DOLS, and CCR analyses for detecting whether there is a long-run connection between economic growth, maritime freight, energy consumption, and CO2 emissions. Table 6 shows the findings obtained using the ARDL analysis. Consequently, the results of the ARDL model coincide with the findings of FMOLS, DOLS, and CCR analyses. As a result of the findings obtained using the bound test, it is decided to analyze the short and long-term dynamics. The unconstrained error correction model in the study can be expressed as the following Equation 10:
The long-run linkage between economic growth, energy consumption, CO2 emissions, and maritime freight for Scandinavian countries from 1960 to 2015 are taken into account via the f bounds test, which assumed the null hypothesis. Starting from Equation 10,
If the F statistic value is less than the lower limit value, which is recommended by Pesaran et al. (2001), then the null hypothesis is rejected, concluding that there is no long-term relationship between the variables. On the other hand, if the calculated F statistic is greater than the upper limit value, then it is decided that there is a long-term relationship between the variables. Apart from these, if the calculated F statistic is between the lower and upper limit values, then uncertain results may be obtained. After determining the existence of a long-term relationship between variables through the boundary test, the process of estimating the long-term coefficients of the variables can be employed.
According to the ARDL F bound test, long-term estimates are made, respectively, via ascertaining long-run co-integration among variables by implementing the econometric model (ARDL bound test), as shown in Table 9. Long-term ARDL estimation results are given in Table 10. The long-run ARDL estimation results reveal that the major factors of CO2 emissions changes in maritime freight, energy consumption, and GDP for Denmark.
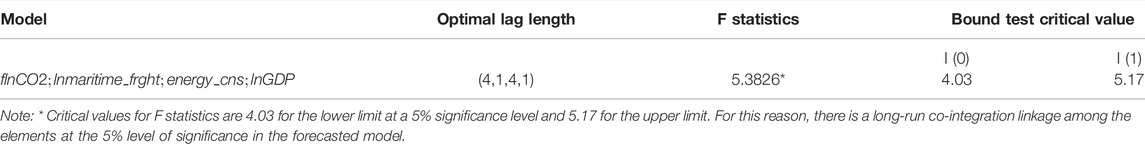
TABLE 9. ARDL bound test results of Denmark.
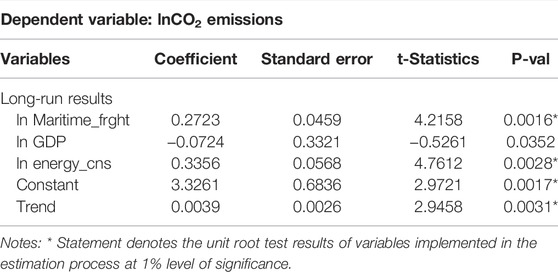
TABLE 10. Long-term ARDL estimation results of Denmark.
Considering the long-run ARDL results, summarized in Table 10, if maritime freight increases by 1%, CO2 emissions increase by 0.2723%. A 1% increase in energy consumption increases CO2 emissions by 0.3356%. The short-term ARDL findings ascertain that the major factors of CO2 emissions in the short-term are changed in maritime freight, energy consumption, and GDP at a 1% significance level for Denmark. Table 11 summarizes the short-term ARDL results and the findings for the ECM model.
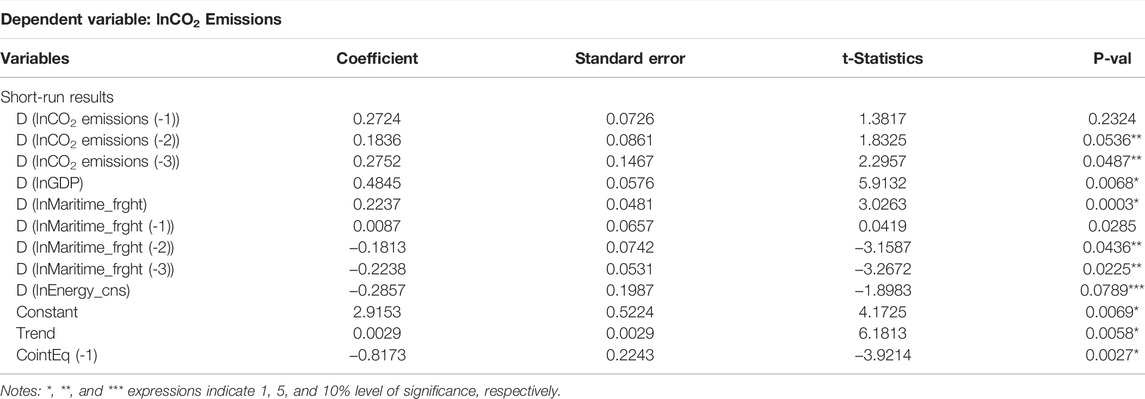
TABLE 11. Short-term ARDL results and error correction model of Denmark.
According to Table 11, the error correction model is considered to obtain short-run adjustment. In the short term, nearly 81% of shocks in maritime freight, energy consumption, and GDP are taken into account within a period of time, and the system is re-established in the long term.
There has been a significant decrease in CO2 emissions in Copenhagen, Stockholm, and Helsinki, especially in recent years, except Oslo (see Figure 3). When all periods are examined in general, an increasing trend is observed in Oslo, although the CO2 emissions rate of Oslo has stabilized in recent years compared to the other three cities.
According to Figure 4, the course of sea transportation is stable in Helsinki and Stockholm. However, Oslo’s maritime transportation has fallen in half. Copenhagen’s maritime transport has increased one and a half times throughout 26 years. Environment friendly alternative technologies have been developed in order to reduce emissions while shipping in Stockholm.
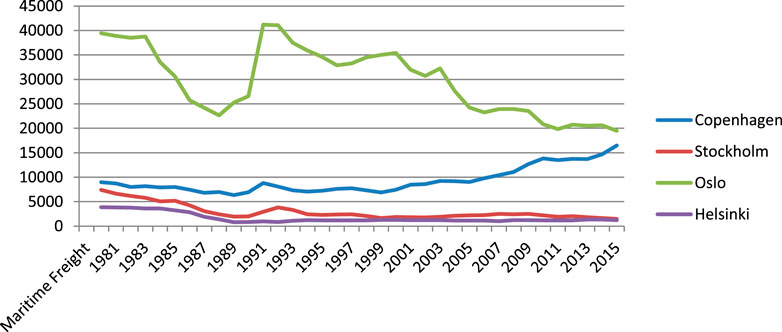
FIGURE 4. Sea transportation of Scandinavian cities (1980–2015).
The first hybrid electric passenger ferry services started in Stockholm, as of 7 January 2019. Sweden’s goal is to reduce greenhouse gases by 85% from the 1990s level by 2040. The hybrid ferry’s special feature is that it combines two diesel engines through a battery, manufactured by Baltic Workboats, and it is equipped with the electrical system of Danfoss Editron; the ferry can cut ice up to 25-cm deep.
Ferry services are conducted throughout a year in Stockholm, the capital of Sweden. Similar hybrid ferries using the “Danfoss system” aim to reduce greenhouse gas emissions and particulate pollution in the region by consuming less liquid fuel than conventional gas. The use of the ferry also has been followed by other Nordic ports to adapt using clean technologies. Oslo also has dozens of electric ferries. Since April 2018, the wind-assisted Viking Grace passenger ferry has been used in daily life in Helsinki as well. R & D works continue to develop better low-carbon ships in Sweden. The Swedish Shipowners Association proudly holds the title of being the first shipping association that aims to achieve zero carbon shipping worldwide by 2050.
While countries create carbon-neutral plans and government subsidies are seen as key to progress, Danfoss’ Project Manager Kari Savolainen (2021) expressed regarding the leadership of Scandinavian countries in terms of the eco-friendly technology, “As countries adopt regulations to move towards carbon neutrality, we can expect such hybrid electricity solutions to increase rapidly. Making shipping carbon neutral is also becoming a key trend. Scandinavian countries set an example in this way”.
When the progress has been made in carbon neutral maritime transport, the world’s first electric road can charge the batteries of electric cars and heavy vehicles. As a country that has revolutionized the field of zero waste and recycling, Sweden is one of the first countries to carry the flag in this field. The 2-km-long road, built on a public road near the capital city of Stockholm, is open to all electric vehicles. The government has also initiated the necessary roadmap for the implementation of the electric road project throughout the country.
4 Conclusion
In this research, econometric models demonstrate the long-run relationship between maritime freight, economic growth, energy consumption, and CO2 emissions from 1960 to 2015 for Denmark and Sweden, which is verified by the EKC hypothesis. However, there is no long-run relationship between relevant variables both for Norway and Finland from 1960 to 1997 and 1998 to 2015, which is not confirmed by the EKC hypothesis. According to the Fourier-Shin test, there is a co-integration relationship of 1% between CO2, energy consumption, GDP, and maritime freight for Denmark and Sweden from 1960 to 2015. However, there is no long-run relationship between relevant variables for Norway and Finland from 1960 to 2015, which is consistent with ARDL, FMOLS, DOLS, and CCR analyses. Considering the long-run ARDL results, if maritime freight increases by 1%, CO2 increases by 0.2723%. A 1% increase in energy consumption increases CO2 emissions by 0.3356%. The short-term ARDL findings ascertain that the major factors of CO2 emissions in the short term are changed in maritime freight, energy consumption, and GDP at a 1% significance level for Denmark. Table 11 summarizes the short-term ARDL results and the findings for the ECM model. According to Table 11, the error correction model is considered to obtain short-run adjustment. In the short term, nearly 82% of shocks in maritime freight, energy consumption, and GDP are taken into account within a period of time, and the system is re-established in the long term.
Due to the explosive growth of the transportation sector, coupled with a significant rise in greenhouse gas emissions from this sector, preventive policies should be followed. In order to avoid the pollution from transportation, it is essential to find out its necessary drivers. In addition, policymaker should kick start applications of new technology in transportation to reduce the pollution by releasing new energy-saving vehicles. In this context, transportation carbon tax and strengthening incentives for energy conservation should be implemented. In order to protect the integrity of the supply chain, the maritime sector and ship recycling facilities, which are an important part of this sector, must continue to operate in an eco-friendly sustainable manner. The steps must be taken to overcome the COVID-19 pandemic as soon as possible, which has affected all sectors as well as been a test for the shipping sector. Like all components of the maritime industry, sea transportation has been affected by the pandemic in different ways, and due to sectoral-specific changes including energy efficiency, wind, and solar, it has continued operations of the nuclear fleet and coal to gas fuel switching. This historical record indicates the ability of technological and policy changes to set the power sector on a dramatically different emissions trajectory. Ship recycling has been carried out in many different geographical regions, including Norway, Denmark, Sweden, and Finland. According to Programme of Work and Budget (PWB) (2021), the COVID-19 epidemic was discussed but no evaluation was made regarding its course. The maritime sector would not benefit from the rapid decline in air transport, and the demand for oil and oil tanker transport would decrease significantly and accordingly the demand for tankers. It is stated that the cruise and passenger transportation will come to a standstill due to the quarantine application, and deterioration in the functioning of the supplier industry is observed due to the isolation and quarantine measures taken by the countries. In this case, it is estimated that carbon dioxide emissions, economic growth, and energy consumption will also decrease. On the other hand, Scandinavian countries, notably, Denmark and Sweden, should distinguish the industrial activity as clean and dirty, by focusing more on the features of the sector, which causes extreme pollution, release intensive toxic waste per unit in manufacturing, high pollution reduction cost per unit operating cost, and energy-intensive per unit production, in order to reduce the carbon emissions. In addition, the other important solutions to reduce CO2 emissions for both Denmark and Sweden are as follows: encouraging the development of low-carbon fuels and biofuels, increasing vehicle’s fuel economy (increasing the production of hybrid and electric vehicles) while reducing exhaust emissions, increasing efficiency in the transport system and reducing carbon-intensive travel activities, concentrating on the renewable electricity generation technologies, and investing in energy-related R&D and innovation activities. Appropriate policies exhorting the importance of drawing on hydropower energy in Norway and Finland, which are consistent with empirical findings in terms of EKC hypothesis, are required. Conceiving both the period of 1960 to 1997 and 1998 to 2015, there is no long-term linkage between economic growth, maritime freight, energy consumption, and CO2 emissions for Norway and Finland, which is not confirmed by the EKC hypothesis. The success of the Norwegian government in terms of reducing carbon emissions are following the decision to impose a tax on carbon released to nature, Norway launched the world’s most advanced carbon capture project. According to Norway’s carbon law, if a higher rate of carbon dioxide is released to the nature, the tax will be paid by the companies, which is more than its profit. When it is examined in terms of carbon emission reduction policies in Finland, the carbon tax was first implemented and pioneered in the early 1990s. Thus, these countries have achieved low carbon emissions through appropriate policies.
Data Availability Statement
Publicly available datasets were analyzed in this study. This data can be found at: https://data.worldbank.org/indicator/NY.GDP.MKTP.CD?locations=DK</b>.
Author Contributions
The author confirms being the sole contributor of this work and has approved it for publication.
Conflict of Interest
SY was employed by Nazar Tasimacilik Ltd. Sti.
Publisher’s Note
All claims expressed in this article are solely those of the authors and do not necessarily represent those of their affiliated organizations, or those of the publisher, the editors, and the reviewers. Any product that may be evaluated in this article, or claim that may be made by its manufacturer, is not guaranteed or endorsed by the publisher.
Abbreviations
AIC, Akaike information criterion; ARDL, autoregressive distributed lag bound test; CCR, canonical co-integrating regression; DOLS, dynamic ordinary least square; ECM, error correction model; EKC, environmental Kuznets curve; FKPSS, Fourier–Kwiatkowski–Phillips–Schmidt–Shin; FMOLS, fully modified least square; PP test, Phillips–Perron test.
References
Ahmad, M., Jabeen, G., Hayat, M. K., Khan, R. E. A., and Qamar, S. (2020). Revealing Heterogeneous Causal Links Among Financial Development, Construction Industry, Energy Use, and Environmental Quality across Development Levels. Environ. Sci. Pollut. Res. 27 (5), 4976–4996. doi:10.1007/s11356-019-07299-w
Ahmad, M., Jabeen, G., and Wu, Y. (2021a). Heterogeneity of Pollution Haven/Halo Hypothesis and Environmental Kuznets Curve Hypothesis across Development Levels of Chinese Provinces. J. Clean. Prod. 285, 124898. doi:10.1016/j.jclepro.2020.124898
Ahmad, M., Muslija, A., and Satrovic, E. (2021b). Does Economic Prosperity Lead to Environmental Sustainability in Developing Economies? Environmental Kuznets Curve Theory. Environ. Sci. Pollut. Res. 28 (18), 22588–22601. doi:10.1007/s11356-020-12276-9
Ahmad, M., and Wu, Y. (2022). Combined Role of Green Productivity Growth, Economic Globalization, and Eco-Innovation in Achieving Ecological Sustainability for OECD Economies. J. Environ. Manage. 302, 113980. doi:10.1016/j.jenvman.2021.113980
Alvarado, R., Tillaguango, B., Dagar, V., Ahmad, M., Işık, C., Méndez, P., et al. (2021). Ecological Footprint, Economic Complexity and Natural Resources Rents in Latin America: Empirical Evidence Using Quantile Regressions. J. Clean. Prod. 318, 128585. doi:10.1016/j.jclepro.2021.128585
Amin, A., Altinoz, B., and Dogan, E. (2020). Analyzing the Determinants of Carbon Emissions from Transportation in European Countries: The Role of Renewable Energy and Urbanization. Clean. Techn Environ. Pol. 22 (8), 1725–1734. doi:10.1007/s10098-020-01910-2
Arai, Y., and Kurozumi, E. (2007). Testing for the Null Hypothesis of Cointegration with a Structural Break. Econometric Rev. 26 (6), 705–739. doi:10.1080/07474930701653776
Arvin, M. B., Pradhan, R. P., and Norman, N. R. (2015). Transportation Intensity, Urbanization, Economic Growth, and CO2 Emissions in the G-20 Countries. Utilities Policy 35 (35), 50–66. doi:10.1016/j.jup.2015.07.003
Batur, İ., Bayram, I. S., and Koc, M. (2019). Impact Assessment of Supply-Side and Demand-Side Policies on Energy Consumption and CO2 Emissions from Urban Passenger Transportation: The Case of Istanbul. J. Clean. Prod. 219, 391–410. doi:10.1016/j.jclepro.2019.02.064
Becker, R., Enders, W., and Lee, J. (2006). A Stationarity Test in the Presence of an Unknown Number of Smooth Breaks. J. Time Ser. Anal. 27 (3), 381–409. doi:10.1111/j.1467-9892.2006.00478.x
Beşe, E., and Kalayci, S. (2021). Environmental Kuznets Curve (EKC): Empirical Relationship between Economic Growth, Energy Consumption, and CO2 Emissions: Evidence from 3 Developed Countries. Panoeconomicus 68 (4), 483–506. doi:10.2298/PAN180503004B
Programme of Work and Budget (PWB) (2021). Retrieved from https://www.oecd.org/swac/about/programme-work-budget-2021-2022.pdf.
Dong, K., Dong, X., and Dong, C. (2019). Determinants of the Global and Regional CO2 Emissions: What Causes what and where? Appl. Econ. 51 (46), 5031–5044. doi:10.1080/00036846.2019.160641010.1080/00036846.2019.1606410
Dong, K., Dong, X., and Jiang, Q. (2020). How Renewable Energy Consumption Lower Global CO 2 Emissions? Evidence from Countries with Different Income Levels. World Econ. 43 (6), 1665–1698. doi:10.1111/twec.1289810.1111/twec.12898
Elliott, G., Rothenberg, T. J., and Stock, J. H. (1996). Efficient Tests for an Autoregressive Unit Root. Econometrica 64 (4), 813–836. doi:10.3386/t013010.2307/2171846
Engle, R. F., and Granger, C. W. J. (1987). Co-integration and Error Correction: Representation, Estimation, and Testing. Econometrica 55, 251–276. doi:10.2307/1913236
Fan, F., and Lei, Y. (2017). Responsive Relationship between Energy-Related Carbon Dioxide Emissions from the Transportation Sector and Economic Growth in Beijing-Based on Decoupling Theory. Int. J. Sust. Transportation 11 (10), 764–775. doi:10.1080/15568318.2017.1317887
Godil, D. I., Sharif, A., Afshan, S., Yousuf, A., and Khan, S. A. R. (2020). The Asymmetric Role of Freight and Passenger Transportation in Testing EKC in the US Economy: Evidence from QARDL Approach. Environ. Sci. Pollut. Res. 27, 30108–30117. doi:10.1007/s11356-020-09299-7
Grossman, G. M., and Krueger, A. B. (1995). Economic Growth and the Environment. Q. J. Econ. 110 (2), 353–377. doi:10.2307/2118443
Grossman, G. M., and Krueger, A. B. (1991). Environmental Impacts of a North American Free Trade Agreement. Retreived from https://www.nber.org/papers/w3914.doi:10.3386/w3914
Guo, X., Ren, D., and Shi, J. (2016). Carbon Emissions, Logistics Volume and GDP in China: Empirical Analysis Based on Panel Data Model. Environ. Sci. Pollut. Res. 23 (24), 24758–24767. doi:10.1007/s11356-016-7615-z
Guo, X., Shi, J., Ren, D., Ren, J., and Liu, Q. (2017). Correlations between Air Pollutant Emission, Logistic Services, GDP, and Urban Population Growth from Vector Autoregressive Modeling: A Case Study of Beijing. Nat. Hazards 87 (2), 885–897. doi:10.1007/s11069-017-2799-1
Hansen, B. E., and Phillips, P. C. (1990). Estimation and Inference in Models of Cointegration: A Simulation Study. Adv. Econom. 8, 225–248.
Kalaycı, S., and Özden, C. (2021). The Linkage Among Sea Transport, Trade Liberalization and Industrial Development in the Context of CO2: An Empirical Investigation from China. Front. Environ. Sci. 9, 145. doi:10.3389/fenvs.2021.633875
Katircioglu, S., Köksal, C., and Katircioglu, S. (2021). The Role of Financial Systems in Energy Demand: A Comparison of Developed and Developing Countries. Heliyon 7 (6), e07323. doi:10.1016/j.heliyon.2021.e07323
Katircioğlu, S. T. (2014). Testing the Tourism-Induced EKC Hypothesis: The Case of Singapore. Econ. Model. 41, 383–391. doi:10.1016/j.econmod.2014.05.028
Kharbach, M., and Chfadi, T. (2017). CO2 Emissions in Moroccan Road Transport Sector: Divisia, Cointegration, and EKC Analyses. Sust. Cities Soc. 35, 396–401. doi:10.1016/j.scs.2017.08.016
Köksal, C., Işik, M., and Katircioğlu, S. (2020). The Role of Shadow Economies in Ecological Footprint Quality: Empirical Evidence from Turkey. Environ. Sci. Pollut. Res. 27 (12), 13457–13466. doi:10.1007/s11356-020-07956-5
Korkmaz, N., Kalayci, S., and Özturk, A. (2017). The Relationship between Energy Use, CO2 Emission and Economic Growth in OPEC Countries. Route Educ. Soc. Sci. J. 48 (7), 449
Magazzino, C. (2014). A Panel VAR Approach of the Relationship Among Economic Growth, CO2 Emissions, and Energy Use in the ASEAN-6 Countries. Int. J. Energ. Econ. Pol. 4 (4), 546
Magazzino, C. (2017a). Economic Growth, CO2 Emissions and Energy Use in the South Caucasus and Turkey: a PVAR Analyses. Int. Energ. J. 16 (4), 153–162.
Magazzino, C., Mele, M., and Schneider, N. (2021). A Machine Learning Approach on the Relationship Among Solar and Wind Energy Production, Coal Consumption, GDP, and CO2 Emissions. Renew. Energ. 167, 99–115. doi:10.1016/j.renene.2020.11.050
Magazzino, C. (2017b). The Relationship Among Economic Growth, CO2 Emissions, and Energy Use in the APEC Countries: a Panel VAR Approach. Environ. Syst. Decis. 37 (3), 353–366. doi:10.1007/s10669-017-9626-9
Magazzino, C. (2016). The Relationship Among Real GDP, CO2 Emissions, and Energy Use in South Caucasus and Turkey. Int. J. Energ. Econ. Pol. 6 (4), 672
Mohsin, M., Abbas, Q., Zhang, J., Ikram, M., and Iqbal, N. (2019). Integrated Effect of Energy Consumption, Economic Development, and Population Growth on CO2 Based Environmental Degradation: a Case of Transport Sector. Environ. Sci. Pollut. Res. 26 (32), 32824–32835. doi:10.1007/s11356-019-06372-8
Nasreen, S., Saidi, S., and Ozturk, I. (2018). Assessing Links between Energy Consumption, Freight Transport, and Economic Growth: Evidence from Dynamic Simultaneous Equation Models. Environ. Sci. Pollut. Res. 25 (17), 16825–16841. doi:10.1007/s11356-018-1760-5
Ourworldindata (2021). CO2 Emissions. Retrieved from: https://github.com/owid/co2-data (Accessed 2021).
Ozkan, T., Yanginlar, G., and Kalayci, S. (2019). Testing the Transportation-Induced Environmental Kuznets Curve Hypothesis: Evidence from Eight Developed and Developing Countries. Int. J. Energ. Econ. Pol. 9 (1), 174
Park, J. Y. (1992). Canonical Cointegrating Regressions. Econometrica 60 (1), 119–143. doi:10.2307/2951679
Pedroni, P. (2001). Purchasing Power Parity Tests in Cointegrated Panels. Rev. Econ. Stat. 83 (4), 727–731. doi:10.1162/003465301753237803
Perron, P. (1989). The Calculation of the Limiting Distribution of the Least-Squares Estimator in a Near-Integrated Model. Econom. Theor. 5, 241–255. doi:10.1017/s026646660001241x
Pesaran, M. H., Shin, Y., and Smith, R. J. (2001). Bounds Testing Approaches to the Analysis of Level Relationships. J. Appl. Econ. 16, 289–326. doi:10.1002/jae.616
Raza, S. A., Shah, N., and Sharif, A. (2019). Time Frequency Relationship between Energy Consumption, Economic Growth and Environmental Degradation in the United States: Evidence from Transportation Sector. Energy 173, 706–720. doi:10.1016/j.energy.2019.01.077
Saboori, B., Sapri, M., and Bin Baba, M. (2014). Economic Growth, Energy Consumption and CO2 Emissions in OECD (Organization for Economic Co-operation and Development)'s Transport Sector: A Fully Modified Bi-directional Relationship Approach. Energy 66, 150–161. doi:10.1016/j.energy.2013.12.048
Saleem, H., Jiandong, W., Zaman, K., Elsherbini Elashkar, E., and Mohamd Shoukry, A. (2018). The Impact of Air-Railways Transportation, Energy Demand, Bilateral Aid Flows, and Population Density on Environmental Degradation: Evidence from A Panel of Next-11 Countries. Transportation Res. D: Transport Environ. 62, 152–168. doi:10.1016/j.trd.2018.02.016
Satrovic, E., Ahmad, M., and Muslija, A. (2021). Does Democracy Improve Environmental Quality of GCC Region? Analysis Robust to Cross-Section Dependence and Slope Heterogeneity. Environ. Sci. Pollut. Res. 28 (44), 62927–62942. doi:10.1007/s11356-021-15020-z
Savolainen, K. (2021). Selvitystyö Helsinki-Vantaan Ilmailualan Kestävän Kasvun Uudelleenrakentamiseksi. Retrieved from: https://julkaisut.valtioneuvosto.fi/handle/10024/162959 (Accessed 2021).
Sharif, A., Afshan, S., Chrea, S., Amel, A., and Khan, S. A. R. (2020). The Role of Tourism, Transportation and Globalization in Testing Environmental Kuznets Curve in Malaysia: New Insights from Quantile ARDL Approach. Environ. Sci. Pollut. Res. 27 (20), 25494–25509. doi:10.1007/s11356-020-08782-5
Shin, Y. (1994). A Residual-Based Test of the Null of Cointegration against the Alternative of No Cointegration. Econom. Theor. 10 (1), 91–115. doi:10.1017/S0266466600008240
Stock, J. H., and Watson, M. W. (1993). A Simple Estimator of Cointegrating Vectors in Higher Order Integrated Systems. Econometrica 61, 783–820. doi:10.2307/2951763
Tanczos, K., and Torok, A. (2007). The Linkage between Climate Change and Energy Consumption of Hungary in the Road Transportation Sector. Transport 22 (2), 134–138. doi:10.1080/16484142.2007.9638112
Tarazkar, M. H., Kargar Dehbidi, N., Ansari, R. A., Pourghasemi, H. R., Lee, C. F., Tsai, L. J., et al. (2021). Factors Affecting Methane Emissions in OPEC Member Countries: Does the Agricultural Production Matter? The Fourier Approximation and Testing for the Null of Cointegration. Environ. Dev. Sustainempirical Econ. 2351 (53), 67341085–67481113. doi:10.1007/s00181-015-1028-6
Tsong, C. C., Lee, C. F., Tsai, L. J., and Hu, T. C. (2016). The Fourier Approximation and Testing for the Null of Cointegration. Empir. Econ. 51 (3), 1085–1113. doi:10.1007/s00181-015-1028-6
Umar, M., Ji, X., Kirikkaleli, D., and Alola, A. A. (2021). The Imperativeness of Environmental Quality in the United States Transportation Sector amidst Biomass-Fossil Energy Consumption and Growth. J. Clean. Prod. 285, 124863. doi:10.1016/j.jclepro.2020.124863
UNCTAD (2021). World Merchant Fleet/UNCTADstat (Merchant Fleet by Flag of Registration and by Type of Ship, Annual). Retrieved from: https://unctadstat.unctad.org/EN/BulkDownload.html.
World Bank (2021c). CO2 Emissions (Metric Tons Per Capita). Retrieved from: https://data.worldbank.org/indicator/EN (Accessed 2021).
World Bank (2021a). Economic Growth & GDP (Current US$). Retrieved from: https://data.worldbank.org/indicator/NY.GDP.MKTP.CD?locations=DK (Accessed 2021).
World Bank (2021b). Energy Use (Kg of Oil Equivalent Per Capita). OE. Retrieved from: https://data.worldbank.org/indicator/EG.USE.PCAP.KG.
Yuan, C., Wu, D., and Liu, H. (2017). Using Grey Relational Analysis to Evaluate Energy Consumption, CO2 Emissions and Growth Patterns in China's Provincial Transportation Sectors. Ijerph 14 (12), 1536. doi:10.3390/ijerph14121536
Zaman, K., Moemen, M. A.-e., and Islam, T. (2017). Dynamic Linkages between Tourism Transportation Expenditures, Carbon Dioxide Emission, Energy Consumption and Growth Factors: Evidence from the Transition Economies. Curr. Issues Tourism 20 (16), 1720–1735. doi:10.1080/13683500.2015.1135107
Keywords: maritime freight, EKC hypothesis, economic growth, CO2 emissions, Scandinavia
Citation: YAZICI S (2022) Investigating the Maritime Freight-Induced EKC Hypothesis: The Case of Scandinavian Countries. Front. Environ. Sci. 10:727830. doi: 10.3389/fenvs.2022.727830
Received: 19 June 2021; Accepted: 07 March 2022;
Published: 19 May 2022.
Edited by:
Cosimo Magazzino, Roma Tre University, ItalyReviewed by:
Ehsan Rasoulinezhad, University of Tehran, IranMuntasir Murshed, North South University, Bangladesh
Munir Ahmad, Zhejiang University, China
Copyright © 2022 YAZICI. This is an open-access article distributed under the terms of the Creative Commons Attribution License (CC BY). The use, distribution or reproduction in other forums is permitted, provided the original author(s) and the copyright owner(s) are credited and that the original publication in this journal is cited, in accordance with accepted academic practice. No use, distribution or reproduction is permitted which does not comply with these terms.
*Correspondence: Sabire YAZICI, c2FiaXJleWF6aWNpQGdtYWlsLmNvbQ==
†ORCID: Sabire YAZICI orcid.org/0000-0003-3464-371X