- 1Key Laboratory of Desert and Desertification, Northwest Institute of Eco-Environment and Resources, Chinese Academy of Sciences, Lanzhou, China
- 2Dunhuang Gobi Desert Research Station, Northwest Institute of Eco-Environment and Resources, CAS, Lanzhou, China
- 3School of Civil Engineering, Lanzhou Jiaotong University, Lanzhou, China
Vertical sand flux density and grain-size distributions of wind-blown sand over gobi are an essential way for examining the complex grain-bed collisions over gobi surfaces and then understanding aeolian saltation dynamics. However, compared with sand surfaces, relatively few studies have reported regarding how sand flux density and grain size vary with elevation for wind-blown sand over gobi, especially in a field scale. Here, vertical sand flux density and grain-size distributions for wind-blown sand over a typical gobi surface during three transport events were revealed. The results show that the sand flux density exponentially decreased with elevation, which is different from the previous wind tunnel studies, and 99% of the sand transport amount was concentrated in the near-surface layer of 0.6 m. The mean grain size (Dm) first increased with elevation until an inflection in grain-size trends occurred at 0.175 m or 0.285 m above the ground, and then Dm decreased with height, which is significantly different from the vertical grain-size profile patterns of sand surfaces. The grain-bed collision process of medium sand over the gobi surface caused the increase of the mean grain size with height. Sorting was dominated by moderately sorted, skewness by symmetrical or fine skewed, and kurtosis by mesokurtic. The results of this study are significant for future numerical modeling studies of aeolian saltation over rough surfaces on Earth and even on Mars.
1 Introduction
The vertical distribution of sand flux density and grain-size for wind-blown sand has always been a hot spot in aeolian research, because it is essential for modeling aeolian saltation, especially for grain trajectory calculations (Sherman and Ellis, 2021). Over the past 80 years, many studies on the vertical distribution of sand flux density and grain-size for wind-blown sand, especially for sand surfaces, have been performed not only by field observations (e.g., Greeley et al., 1996; Arens et al., 2002; Farrell et al., 2012; Rotnicka, 2013; Swann et al., 2021), but by wind tunnel experiments (e.g., Dong et al., 2006; Xing, 2007; Li et al., 2008; Tan et al., 2014; Yang et al., 2019). Generally, the sand flux density decreases exponentially with height (e.g., Greeley et al., 1996; Dong et al., 2002; Namikas, 2003; Farrell et al., 2012; Rotnicka, 2013). The main grain-size profile patterns for wind-blown sand over sand surfaces can be summarized as the following three types. The first one is that grain size decreases with increasing elevation (e.g., Chen et al., 1995; Arens et al., 2002; Li et al., 2008). The second is that the particle size increases with increasing height (e.g., Bagnold, 1941; Greeley et al., 1996; Van der Wal, 2000). The third is that the mean grain-size first decreases with increasing height, and then increases, with a maximum occurring at a finite height, approximately several or dozens of centimeters above the ground (e.g., Farrell et al., 2012; Tan et al., 2014; Zhang et al., 2017; Yang et al., 2019), which is a dominant vertical profile pattern of grain-size distribution in recent studies. However, compared with sand surfaces, fewer studies have reported the vertical grain-size profiles of wind-blown sand over gobi.
Gobi is a regional name of stone pavements in central Asia (Livingstone and Warren, 1996), and the stone pavements are defined by Cooke and Warren (1973) as ‘‘armored’’ surfaces, and usually comprise gravels or boulders in the thickness of only one or two stones, underlain by deposits of sand, silt, or clay. Gobi is widely distributed in northwest China. It covers an area of approximately 661,000 km2, and accounts for 6.9% of the total land area, which is roughly equal with the area of sand surfaces in China (Zhang et al., 2014). This kind of surfaces are common on Earth and even ubiquitous on Mars (Lancaster et al., 2010). Aeolian saltation processes over gobi surfaces, however, are more complex than those of sand surfaces (e.g., Zhang et al., 2014; Tan et al., 2020). The presence of nonerodible gravels creates a nearly elastic collision between them and sand grains (Qu et al., 2005), and the sand flux profiles show a nonmonotonic curve pattern, with a maximum flux density occurring a specific height above the ground (e.g., Dong et al., 2004; Qu et al., 2005; Tan et al., 2013; Zhang et al., 2014). However, these results have usually been investigated by wind tunnel experiments. Due to the harsh natural conditions in gobi areas, field studies on the vertical distribution of the sand flux density and grain size for wind-blown sand over gobi are still limited. Sharp (1964) conducted field observations on characteristics of wind-blown sand over a bouldery alluvial plain in Coachella Valley, California, United States, and it revealed that the mean grain size achieved a maximum at heights of 0.25–1 m above the ground; however, it was the cumulative results of several events of aeolian transport. Zhang and Dong (2014) showed that the grain-size distribution of aeolian transport over an artificial gravel bed presented a monotonically deceasing pattern, while they used only four traps at a height range of 0.25–2 m. In contrast, field observation results of aeolian transport over gobi atop the Mogao Grottoes revealed that grain size first increased from the surface and then decreased after the occurrence of a maximum at heights of 0.22–0.24 m above the ground (Tan et al., 2016), while the saltation trap could only examine the grain size distribution of 0.5 m above the gobi surface. Thus, there is still no consensus regarding what the vertical distribution pattern of the grain size of wind-blown sand over gobi should be. Revealing the vertical profiles of sand flux density and grain size is an effective way to understand the collision process between saltating sand grains and the gobi bed, which is helpful to further reveal the dynamic mechanism for aeolian saltation over gobi or similar rough surfaces.
In this work, based on arrays of Big Spring Number Eight (BSNE) traps, vertical distributions of sand flux density and grain-size for wind-blown sand over a typical gobi surface in southern Xinjiang, China under three transport events were examined. The main purpose of this paper was to examine the vertical structures of the sand flux density and grain size for wind-blown sand over gobi, and then to shed light on the processes of aeolian saltation of mix-sized grains. The results of this study can also provide insights into the dynamics of aeolian saltation over gobi or similar rough surfaces.
2 Materials and Methods
2.1 Study Area
Field measurements were performed in the gobi region of Milan, Southern Xinjiang, China (39°8.062′N, 88°59.967′E) (Figures 1A, B). The gobi surface was located on a plain of alluvial-proluvial gobi in northern front of the Altun Mountains. The gobi surface has a gravel coverage rate ranging from 40 to 50%, and is composed mainly of fine gravels (<6 cm), underlain mainly by fine sand (median grain size d50 202 μm) (Figure 1C). The main sand-driving wind directions in the study area were ENE and E, and the annual sand drift potential (DP) in 2018 reached 1,160 vector units, indicating a high wind-energy environment. Detailed information on the aeolian environment has been described in Tan et al. (2020).
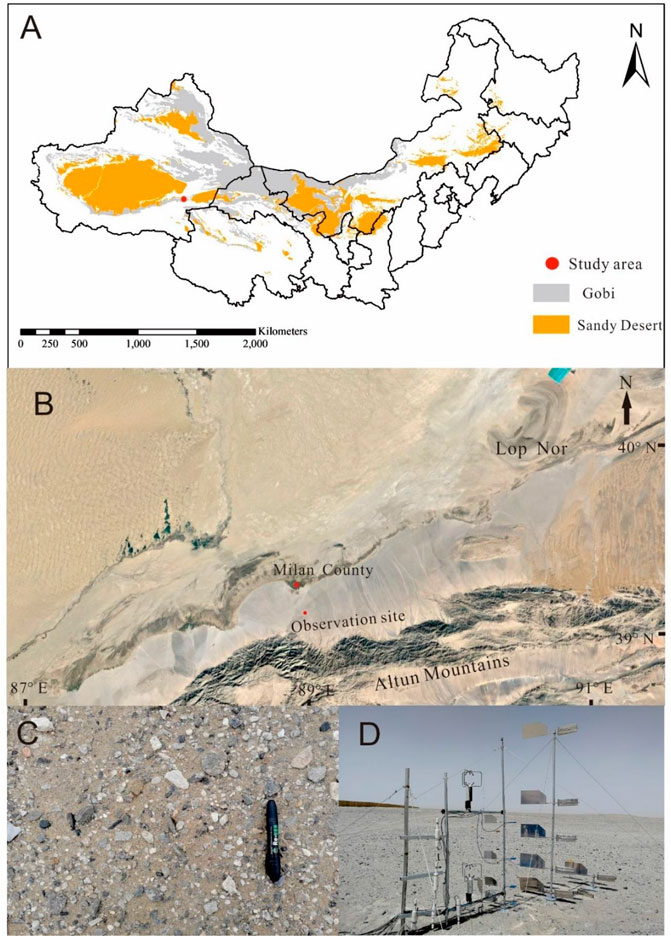
FIGURE 1. (A) The gobi distribution map of Northwest China [this figure is revised from Zhang et al. (2019)]. (B) Location map for the study site (the regional map is from Google Earth). (C) Typical gobi surface in the study site. (D) In-situ field layout of instrument.
2.2 Instrumentation
Sand particles in wind-blown sand over gobi during the three transport events were collected by a vertical array of Big Spring Number Eight (BSNE) traps (Fryrear, 1986), including seven traps at different heights (Figure 1D). The seven BSNE sand traps were placed at mid-inlet heights of 0.025, 0.175, 0.285, 0.585, 1.16, 1.79, and 3 m, and the direction of the spanwise layout was NW-SE, which was almost orthogonal to the main sand-driving wind direction (ENE) in the study area (Tan et al., 2020). Wind data used in this study were obtained from a meteorological observation tower with three 2D ultrasonic anemometers at heights of 2, 6, and 10 m, and recorded as 1 min averages, located approximately 150 m west of the saltation observation site.
2.3 Methods
All grain-size data of wind-blown sand samples in this study were measured by a Malvern Mastersizer-2000 grain-size analyzer. Grain-size statistics of mean, sorting, skewness, and kurtosis were calculated using the method of Folk and Ward (1957). Friction velocity u* was computed from the logarithmic slope between the two instruments at the heights of 2 and 10 m using the following equation (Martin et al., 2013).
where u1 and u2 were the wind velocities at the heights of 2 m (z1) and 10 m (z2).
3 Results
3.1 Sand Transport Events
Three sand transport events (20180502, 20180504, and 20180507, all the following descriptions regarding the three transport events are in this order) were observed during the fieldwork from 1 May 2018 to 8 May 2018. The variation of wind speed and direction at 10 m above the ground with time is shown in Figure 2. The measurement duration fell in between 110 and 420 min. The values of wind speed at a height of 10 m for the three transport events ranged from 8.35 to 19.27 m s−1, 8.28–19.82 m s−1, and 11.90–23.55 m s−1, respectively, and the corresponding average wind speeds were 13.92, 13.70, and 18.78 m s−1. At the same time, the values of wind direction at a height of 10 m for the three transport events ranged from 54.2° to 91.2°, 40.5° to 97.0°, and 19.5° to 75.3°;, respectively. The corresponding average wind directions were 80.6°, 69.7°, and 54.9°, which belonged to E, ENE, and NE winds, respectively. During the three transport events, the values of friction velocity u* ranged from 0.11 to 0.79 m s−1, 0.01–0.72 m s−1, and 0.10–1.28 m s−1, respectively, and the corresponding average values of u* were 0.40, 0.28, and 0.66 m s−1 (Figure 2). The measured threshold friction velocity for sand entrainment u*t was 0.30 m s−1 in the study area. During the transport event 20180504, the average u* was smaller than u*t, and intermittent aeolian sand transport occurred, especially in the period of 13:00–16:59 (Tan et al., 2020). In contrast, during the transport event 20180507, almost all the values of u* were over u*t in the whole measurement period, and strong aeolian sand transport occurred (see Figure 3A in the next part).
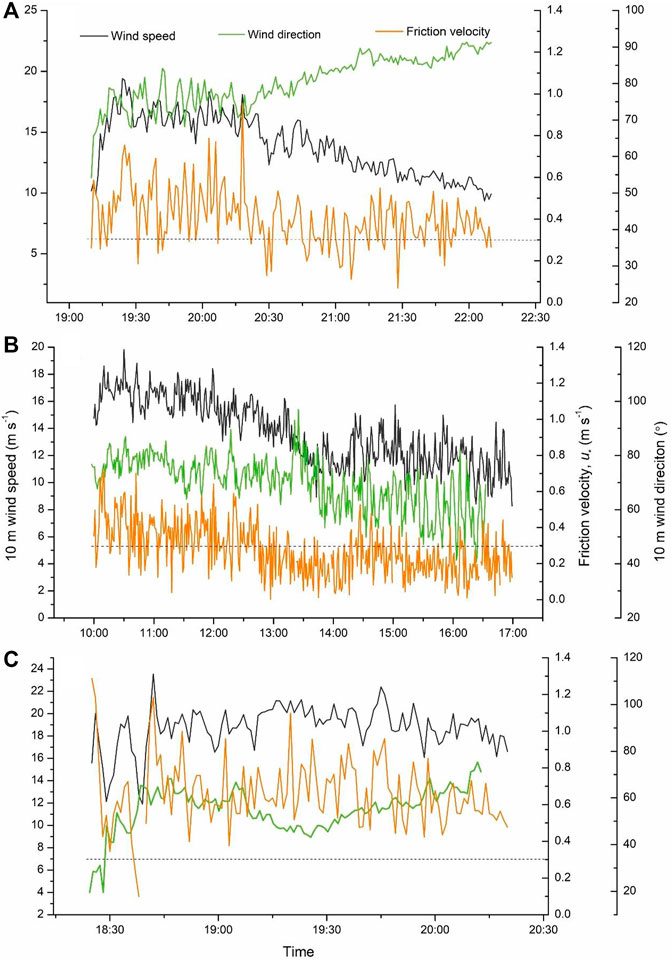
FIGURE 2. Variation of wind speed and direction at a height of 10 m and friction velocity with time during the three transport events. (A) 20180502 event, (B) 20180504 event, and (C) 20180507 event. The dash line refers to the threshold friction velocity u*t (0.30 m s−1).
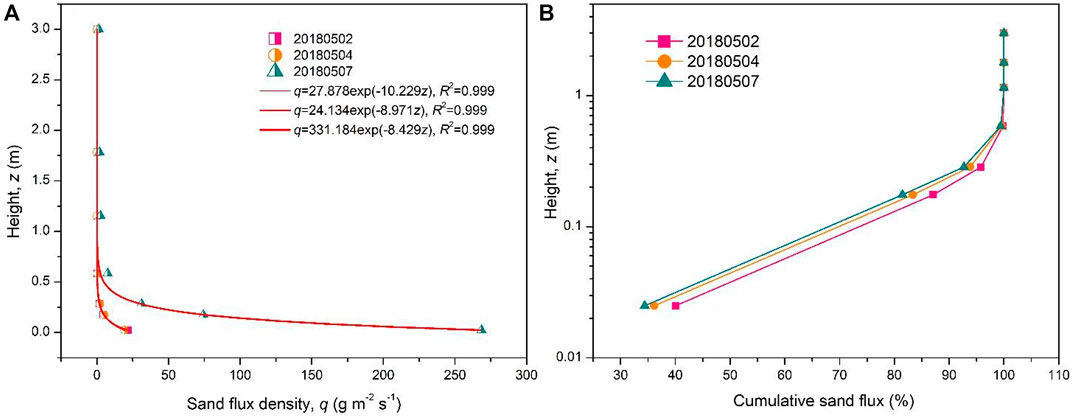
FIGURE 3. Variation of the sand flux density (A) and cumulative sand flux (B) with height above the ground during the three transport events.
3.2 Sand Flux Profiles of Wind-Blown Sand Over Gobi
Vertical sand flux profiles show that the sand flux density decreased exponentially with increasing height during the three transport events (Figure 3A). The proportions of the transported sand particles caught at the lowest trap (with a mid-inlet height of 0.025 m) were 40.04, 36.14, and 34.39% for the three transport events, respectively. 90% of the total sand flux for the three transport events was concentrated within layers of 0.20, 0.23, and 0.25 m above the ground, respectively. The sand particles caught within a height of 0.585 m above the surface accounted for less than 1% of the total, and thus, 99% of the sand particles in wind-blown sand over gobi were transported in the layer of 0–0.585 m (Figure 3B).
3.3 Vertical Grain Size Distribution of Wind-Blown Sand Over Gobi
3.3.1 Vertical Grain-Size Frequency Distribution
To ensure the accuracy of data, we excluded samples with altitudes higher than 0.585 m in the analysis of grain-size distribution. The variation of the grain-size frequency of blown sand samples with height is shown in Figure 4. The results show that the variation trend of the mode grain size (the grain size which corresponded to the maximum grain-size frequency) as a function of height was consistent among the three transport events, that is, the mode grain size first increased with height then decreased. At 0.025 m, the values of the mode grain size in the three transport events were 182, 158, and 182 μm, respectively, and the corresponding frequencies were 11.65, 10.44, and 11.23%, respectively. At 0.175 m, the values of the mode grain size in the three transport events were 182, 240, and 240 μm, respectively, and the corresponding frequencies were 9.58, 9.89, and 10.02%, respectively. At 0.285 m, all mode grain size increased to 275 μm, and the corresponding frequencies were 10.84, 9.69, and 7.74%, respectively. However, as the height increased to 0.585 m, all mode grain size decreased to 105 μm, and the corresponding frequencies changed to 8.46, 8.57, and 7.91%, respectively.
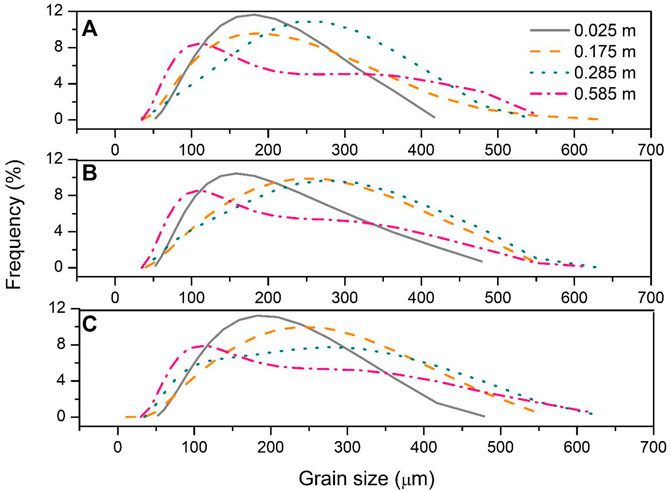
FIGURE 4. The grain-size frequency of wind-blown sand samples changing with height in the three transport events. (A) 20180502 event, (B) 20180504 event, and (C) 20180507 event.
3.3.2 Grain-Size Statistics
3.3.2.1 Mean Grain Size
The vertical profile patterns of the mean grain size of wind-blown sand over gobi were consistent among the three measured transport events, that is, Dm first increased almost linearly with elevation until a reversal in grain-size trends occurred, and then Dm decreased, with a maximum occurring at a finite height above the ground (Figure 5A). Specifically, the inflection points in the vertical mean grain size profile occurred at a height of 0.175 m or 0.285 m above the ground during the three transport events, with Dm values ranging from 200 to 221 μm.
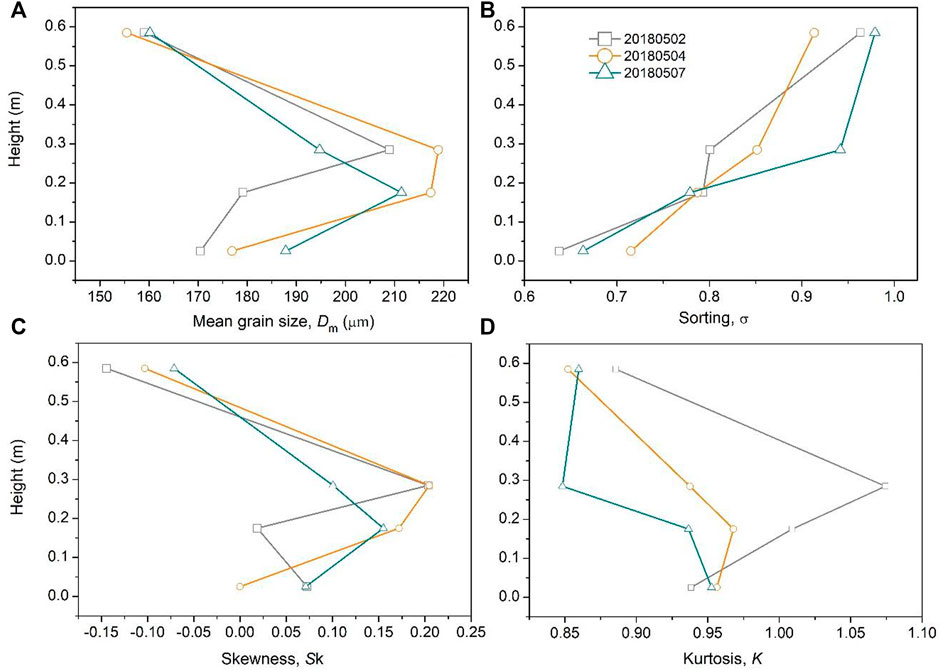
FIGURE 5. Variation of the grain-size statistics with height during the three transport events. (A) Mean grain size, (B) Sorting, (C) Skewness, (D) Kurtosis.
3.3.2.2 Sorting
For the three transport events, sorting values increased with increasing height within the layer of 0–0.585 m, which ranged from 0.64 to 0.98 (Figure 5B), and they changed from moderately well sorted to moderately sorted with increasing height according to the categorization of Folk and Ward (1957).
3.3.2.3 Skewness
The pattern of skewness changing as a function of height was similar to that of the mean grain size. Sk first increased with elevation until a reversal in grain-size trends occurred, and then Sk decreased, with a maximum occurring at a finite height above the ground (Figure 5C). According to the categorization of Folk and Ward (1957), the skewness changed from symmetrical on the surface to fine skewed with increasing height to 0.285 m, and then changed back to symmetrical or coarse skewed at the height of 0.585 m.
3.3.2.4 Kurtosis
The kurtosis increased with the increase of height above the ground, with values ranging from 0.85 to 1.07 (Figure 5D), and they belonged to the category of mesokurtic according to Folk and Ward (1957) at the lower three traps, while it changed to platykurtic for the sand trap at the height of 0.585 m.
4 Discussion
4.1 The Saltation Flux Profile Pattern for the Gobi Surface
Many previous studies, mostly through wind tunnel tests, show that the sand flux density varies with height in a non-monotonic curve, with a maximum occurring at a certain height above the ground (e.g., Dong et al., 2004; Qu et al., 2005; Tan et al., 2013; Zhang et al., 2014). In contrast, this study shows that sand flux density decreases exponentially with increasing height among all the three measured transport events. Furthermore, the field study of Tan et al. (2016) also reveals that the sand flux density decreases exponentially with increasing height, which is different from the results of previous wind tunnel studies. Meanwhile, the recent field study of Tan et al. (2021) shows that the particle flux density of wind-blown sand over gobi decreases exponentially with height, which is consistent with the exponential decay model of the sand flux density against height determined using BSNE traps. The difference in results of wind tunnel tests and field observation can be attributed to the fact that the blocking effect of gravels on sand transport near the gobi surface is not as pronounced in the field as that in the wind tunnel. The scale of gravels cannot be reduced in wind tunnel tests, which, in turn, increases their blocking effect, while in the field, the relief of the terrain makes the function of gravels in inhibiting near-surface wind-blown sand less obvious than that in the wind tunnel.
This study shows that 99% of the sand transport amount over gobi is concentrated in the near-surface layer of 0.6 m. Comparatively, it shows that 99% of the sand transport amount over gobi atop the Mogao Grottoes is concentrated in the near-surface layer of 0.3 m (Figure 6), and thus the height of the saltation layer in this study is nearly two times of that atop the Mogao Grottoes. However, in the Hundred Miles windy area along the Lanzhou-Xinjiang High-Speed Railway, 99% of sand particles are transported in the layer of 3 m above the gobi surface (Wang et al., 2022). This can be attributed to the difference in the wind speed and grain size, and Zhang et al. (2017) revealed that the cumulative sand flux is controlled more by the mean grain size of sand surfaces than wind speed. For example, the maximum mean grain size of wind-blown atop the Mogao Grottoes is 150 μm, while that of in this study is 220 μm, and larger saltating particles can reach higher in the process of aeolian saltation over gobi. In contrast, sand transport on sand surfaces is mainly concentrated in a height range of 0–0.2 m. This indicates that the grain-bed collision over gobi facilitates aeolian saltation by increasing saltation heights, in which sand particles can retain a higher proportion of their impact energy. In addition, Nield and Wiggs (2011) revealed that compared with dry, rippled sand surfaces, the saltation cloud height increased over slightly damper and harder sand surfaces.
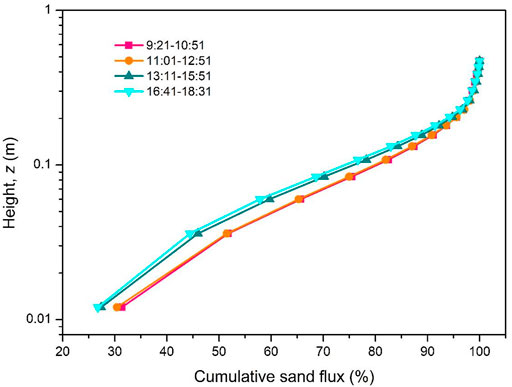
FIGURE 6. Variation of the cumulative sand flux with height above the gobi surface atop the Mogao Grottoes during the transport event 20130417 (Tan et al., 2016).
4.2 Vertical Distributions of Grain-Size Statistics for Wind-Blown Sand Over Gobi
Vertical mean grain-size profiles of gobi wind-blown sand show that the mean grain size increases with height above the ground until a reversal occurs, and then the mean grain size decreases with height. It indicates that the coarsest grains are found at a finite height above the ground rather than on the surface. The field work atop the Mogao Grottoes also revealed a reversal in the variation of grain size with height, with an inflection occurring at 0.22 and 0.24 m for the two transport events of 20130415 and 20130417, respectively (Tan et al., 2016). Below the inflection, the mean grain size also increased with height; however, above the inflection, it showed a linear decrease in mean grain size with height, in which only 0.3 m above the inflection had been measured, while in this study an approximate 0.6 m transport layer had been considered (Figure 5A). The reason is that the study area of Mogao Grottoes belongs to a low wind-energy environment (Zhang et al., 2014), while the study areas in this study indicates a high wind-energy environment (Tan et al., 2020), resulting in a relatively thicker saltation layer in this study. Zhang and Dong (2014) also used BSNE traps to examine characteristics of grain-size distribution for an artificial gobi bed; however, only four traps at 0.25, 0.5, 1, and 2 m above the ground had been used. As a result, they showed that the mean grain size decreased monotonically with height, yet the change in mean grain size with height could not be examined below 0.25 m. The field study of Sharp (1964) revealed that the mean grain size for wind-blown sand over a bouldery alluvial plain in Coachella Valley, California, United States, achieved a maximum at heights ranging from 0.25 to 1 m above the ground. Wang et al. (2022) revealed that the inflection point in the vertical median grain size profile of wind-blown sand over a gobi surface in the Hundred Miles windy area, China reached 2 m above the ground surface. The heights where the inflection occurred in these two studies were larger than those of this study. This may be caused by the difference in wind power and the grain-size composition of sand sources for wind-blown sand over the rough surface.
Apparently, the vertical mean grain-size profile over gobi is significantly different from those of sand surfaces, in which the dominant profile pattern is grain size first decreases till to an inflection and then increases with elevation. This can be attributed to the difference in grain-bed collisions between gobi beds and sand surfaces. The collision between saltating particles and gravels on the gobi surface is nearly elastic, and thus, saltating sand particles will rebound and maintain a higher proportion of momentum; however, those of sand surfaces will transport momentum to new particles and the momentum has been consumed mainly on bed deformation. Liu et al. (2021) reveals that for the same gobi bed and at the same experimental particle speed, the larger the sand particle size, the higher the bounce height of sand particles after colliding with gravels. This is because gravity and the drag of the wind are the main influencing factors for the trajectory of rebounding sand particles, and as grain size increases, the ratio of inertia to drag force becomes larger. As a result, larger grains can travel in higher and farther trajectories than smaller grains. Figure 7 shows the variation of frequencies for three grain-size groups (very fine, fine, and medium sand) with height in the three transport events. The results demonstrate that below the height of the inflection point, both the frequencies of very fine and fine sand in the three transport events decreased with height (Figures 7A, B), while that of the medium sand increased with height (Figure 7C), resulting in the increase of the mean grain size with height. In contrast, above the inflection points, the frequency of very fine sand increased (Figure 7A), while that of the medium sand decreased (Figure 7C), resulting the decrease of the mean grain size with height. This indicates that larger grains like medium sand particles participate in the grain-bed collision process over gobi and the rebound medium sand particles can reach a higher layer. Comparatively, very fine sand is more notably affected by turbulence, and the frequency only increases in the upper saltation layer where wind momentum is less affected by saltating particles. However, in regard to sand surfaces, bed deformation consumes more energy of saltating grains, resulting in the reduction in the available energy for grain ejection. Larger grains are relatively more difficult than smaller grains to reach the same launch speed, and thus larger particles will move close to the bed in reptation rather than saltation (e.g., Rice et al., 1995; Farrell et al., 2012). Consequently, the coarse fraction of the transport sand population is distributed within near-bed elevations, while the finer fraction is at higher elevations. Thus, the mean grain size decreased with height in the saltation layer over sand surfaces.
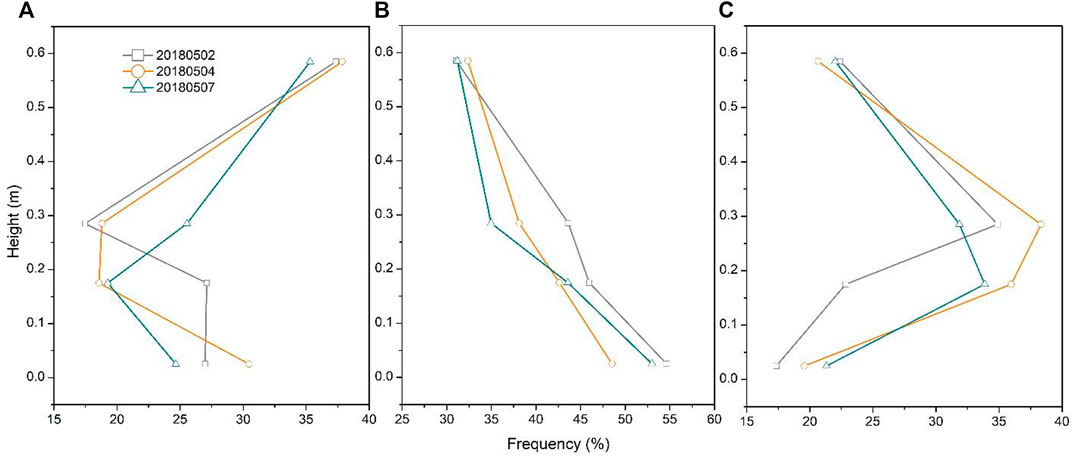
FIGURE 7. Variation of frequencies for three grain-size groups with height in the three transport events. (A) very fine sands (63–125 μm), (B) fine sands (125–250 μm), and (C) medium sands (250–500 μm).
Studies of quantifying the variation of sorting, skewness, and kurtosis with height are relatively few for sand surfaces. Williams (1964), Li et al. (2008), and Farrell et al. (2012) found that sorting improved with height. Zhang et al. (2017) revealed that sorting of sand surfaces composed of fine or medium sands improved with increasing height, while both profile patterns of sorting improving and declining with height presented for coarse sand surfaces. However, the sorting of gobi wind-blown sand in this study shows a decreasing trend with increasing height, which is consistent with the result of Tan et al. (2016).
5 Conclusion
Vertical flux density and grain-size profiles of wind-blown sand over a typical gobi surface during three transport events were measured using arrays of BSNE traps. The results show that in contrast with the nonmonotonic flux profiles over gobi beds measured in wind tunnel studies, the sand flux density decreased exponentially with elevation in the field. 90% of sand transport amount is concentrated in the height range of 0.22–0.27 m, while 99% of saltating sand particles are transported in the near-surface layer of 0.6 m. The mean grain size (Dm) first increased with elevation until a reversal in grain-size trends occurred, and then Dm decreased, with a maximum occurring at a finite height above the ground (0.175 or 0.285 m). In the whole saltation layer, sorting mainly belongs to moderately sorted, skewness is symmetrical or fine skewed, and kurtosis is mesokurtic.
This study provides grain-size data of wind-blown sand over gobi to the modeling community for saltating grain trajectories and also sheds light on the complex grain-bed collision on gobi surfaces, which is helpful for understanding aeolian saltation dynamics over gobi.
Data Availability Statement
The original contributions presented in the study are included in the article/Supplementary Material, further inquiries can be directed to the corresponding author.
Author Contributions
LT designed the field observation and wrote the manuscript. KZ and HW conducted statistical analysis. ZA and TW performed the observation and collected data. All authors contributed to the writing-reviewing and editing.
Funding
This work was founded by the Third Xingjiang Expedition and Research (2021xjkk030503), China Postdoctoral Science Foundation (2021M703466), the Natural Science Foundation of Gansu Province, China (20JR10RA231), the Science and Technology Research and Development Program of China Railway Corporation (2017G004-E), and the Science and Technology Research Project of China Railway First Survey and Design Institute Group Co., Ltd. (2019-10).
Conflict of Interest
The authors declare that the research was conducted in the absence of any commercial or financial relationships that could be construed as a potential conflict of interest.
Publisher’s Note
All claims expressed in this article are solely those of the authors and do not necessarily represent those of their affiliated organizations, or those of the publisher, the editors and the reviewers. Any product that may be evaluated in this article, or claim that may be made by its manufacturer, is not guaranteed or endorsed by the publisher.
References
Arens, S. M., van Boxel, J. H., and Abuodha, J. O. Z. (2002). Changes in Grain Size of Sand in Transport over a Foredune. Earth Surf. Process. Landforms 27 (11), 1163–1175. doi:10.1002/esp.418
Chen, W., Yang, Z., and Dong, Z. (1995). Vertical Distribution of Grain-Size Parameters of Drifting Particles during Sand Storms in the Taklamakan Desert, Central Asia. Phys. Geogr. 16 (6), 503–523.
Dong, Z., Liu, X., Wang, H., Zhao, A., and Wang, X. (2002). The Flux Profile of a Blowing Sand Cloud: a Wind Tunnel Investigation. Geomorphology 49 (s 3–4), 219–230.
Dong, Z., Qian, G., Luo, W., and Wang, H. (2006). Analysis of the Mass Flux Profiles of an Aeolian Saltating Cloud. J. Geophys. Res. Atmospheres 111 (D16), 1984–2012. doi:10.1029/2005jd006630
Dong, Z., Wang, H., Liu, X., and Wang, X. (2004). A Wind Tunnel Investigation of the Influences of Fetch Length on the Flux Profile of a Sand Cloud Blowing over a Gravel Surface. Earth Surf. Process. Landforms 29 (13), 1613–1626. doi:10.1002/esp.1116
Farrell, E. J., Sherman, D. J., Ellis, J. T., and Li, B. (2012). Vertical Distribution of Grain Size for Wind Blown Sand. Aeolian Res. 7, 51–61. doi:10.1016/j.aeolia.2012.03.003
Folk, R. L., and Ward, W. C. (1957). Brazos River Bar [Texas]; a Study in the Significance of Grain Size Parameters. J. Sediment. Res. 27 (1), 3–26. doi:10.1306/74d70646-2b21-11d7-8648000102c1865d
Greeley, R., Blumberg, D. G., and Williams, S. H. (1996). Field Measurements of the Flux and Speed of Wind-Blown Sand. Sedimentology 43 (1), 41–52. doi:10.1111/j.1365-3091.1996.tb01458.x
Lancaster, N., Nickling, W. G., and Gillies, J. A. (2010). Sand Transport by Wind on Complex Surfaces: Field Studies in the McMurdo Dry Valleys, Antarctica. J. Geophys. Res. 115 (F3), F03027. doi:10.1029/2009jf001408
Li, Z., Feng, D., Wu, S., Borthwick, A., and Ni, J. (2008). Grain Size and Transport Characteristics of Non-uniform Sand in Aeolian Saltation. Geomorphology 100 (3), 484–493. doi:10.1016/j.geomorph.2008.01.016
Liu, B., Wang, Z., Niu, B., and Qu, J. (2021). Large Scale Sand Saltation over Hard Surface: a Controlled experiment in Still Air. J. Arid Land 13 (6), 599–611. doi:10.1007/s40333-021-0104-3
Livingstone, I., and Warren, A. (1996). Aeolian Geomorphology: An Introduction. Addison Wesley Longman Ltd.
Martin, R. L., Barchyn, T. E., Hugenholtz, C. H., and Jerolmack, D. J. (2013). Timescale Dependence of Aeolian Sand Flux Observations under Atmospheric Turbulence. J. Geophys. Res. Atmos. 118 (16), 9078–9092. doi:10.1002/jgrd.50687
Namikas, S. L. (2003). Field Measurement and Numerical Modelling of Aeolian Mass Flux Distributions on a sandy beach. Sedimentology 50 (2), 303–326. doi:10.1046/j.1365-3091.2003.00556.x
Nield, J. M., and Wiggs, G. F. S. (2011). The Application of Terrestrial Laser Scanning to Aeolian Saltation Cloud Measurement and its Response to Changing Surface Moisture. Earth Surf. Process. Landforms 36 (2), 273–278. doi:10.1002/esp.2102
Qu, J., Huang, N., Ta, W., Lei, J., Dong, Z., Liu, X., et al. (2005). Structural Characteristics of Gobi Sand-Drift and its Significance. Adv. Earth Sci. 20 (1), 19–23.
Rice, M. A., Willetts, B. B., and McEwan, I. K. (1995). An Experimental Study of Multiple Grain-Size Ejecta Produced by Collisions of Saltating Grains with a Flat Bed. Sedimentology 42 (4), 695–706. doi:10.1111/j.1365-3091.1995.tb00401.x
Rotnicka, J. (2013). Aeolian Vertical Mass Flux Profiles above Dry and Moist sandy beach Surfaces. Geomorphology 187, 27–37. doi:10.1016/j.geomorph.2012.12.032
Sharp, R. P. (1964). Wind-driven Sand in Coachella valley, California. Geol. Soc. America Bull. 75 (9), 785–804. doi:10.1130/0016-7606(1964)75[785:wsicvc]2.0.co;2
Sherman, D. J., and Ellis, J. T. (2021). "Sand Transport Processes☆," in Reference Module in Earth Systems and Environmental Sciences. Elsevier).
Swann, C., Lee, D., Trimble, S., and Key, C. (2021). Aeolian Sand Transport over a Wet, sandy beach. Aeolian Res. 51, 100712. doi:10.1016/j.aeolia.2021.100712
Tan, L., An, Z., Zhang, K., Qu, J., Han, Q., and Wang, J. (2020). Intermittent Aeolian Saltation over a Gobi Surface: Threshold, Saltation Layer Height, and High‐Frequency Variability. J. Geophys. Res. Earth Surf. 125 (1), e2019JF005329. doi:10.1029/2019JF005329
Tan, L., Qu, J., Wang, T., Zhang, K., and An, Z. (2021). Field Observation Evidence for Kink Points in the Vertical Kinetic Energy Flux Profiles of Wind‐Blown Sand over Gobi and its Significance. Geophys. Res. Lett. 48 (3), e2020GL091224. doi:10.1029/2020GL091224
Tan, L., Zhang, W., Qu, J., Du, J., Yin, D., and An, Z. (2014). Variation with Height of Aeolian Mass Flux Density and Grain Size Distribution over Natural Surface Covered with Coarse Grains: A mobile Wind Tunnel Study. Aeolian Res. 15, 345–352. doi:10.1016/j.aeolia.2014.06.008
Tan, L., Zhang, W., Qu, J., Wang, J., An, Z., and Li, F. (2016). Aeolian Sediment Transport over Gobi: Field Studies Atop the Mogao Grottoes, China. Aeolian Res. 21, 53–60. doi:10.1016/j.aeolia.2016.03.002
Tan, L., Zhang, W., Qu, J., Zhang, K., An, Z., and Wang, X. (2013). Aeolian Sand Transport over Gobi with Different Gravel Coverages under Limited Sand Supply: A mobile Wind Tunnel Investigation. Aeolian Res. 11, 67–74. doi:10.1016/j.aeolia.2013.10.003
Van der Wal, D. (2000). Grain-size-selective Aeolian Sand Transport on a Nourished beach. J. Coastal Res., 896–908.
Wang, T., Qu, J., Tan, L., Gao, Y., Zhang, K., and Shi, B. (2022). Aeolian Sediment Transport over the Gobi with High Gravel Coverage under Extremely strong Winds in the Hundred Miles Windy Area along the Lanzhou-Xinjiang High-Speed Railway. J. Wind Eng. Ind. Aerodynamics 220, 104857. doi:10.1016/j.jweia.2021.104857
Williams, G. (1964). Some Aspects of the Eolian Saltation Load. Sedimentology 3 (4), 257–287. doi:10.1111/j.1365-3091.1964.tb00642.x
Xing, M. (2007). The Harmonious Character in Equilibrium Aeolian Transport on Mixed Sand Bed. Geomorphology 86 (3), 230–242. doi:10.1016/j.geomorph.2006.08.015
Yang, Y., Liu, L., Li, X., Shi, P., Zhang, G., Xiong, Y., et al. (2019). Aerodynamic Grain-Size Distribution of Blown Sand. Sedimentology 66 (2), 590–603. doi:10.1111/sed.12497
Zhang, K., Qu, J., Yu, Y., Han, Q., Wang, T., An, Z., et al. (2019). Progress of Research on Wind-Blown Sand Prevention and Control of Railways in China. Adv. Earth Sci. 34 (6), 573–583.
Zhang, W., Tan, L., Zhang, G., Qiu, F., and Zhan, H. (2014). Aeolian Processes over Gravel Beds: Field Wind Tunnel Simulation and its Application Atop the Mogao Grottoes, China. Aeolian Res. 15, 335–344. doi:10.1016/j.aeolia.2014.07.001
Zhang, Z., Dong, Z., and Qian, G. (2017). Field Observations of the Vertical Distribution of Sand Transport Characteristics over fine, Medium and Coarse Sand Surfaces. Earth Surf. Process. Landforms 42 (6), 889–902. doi:10.1002/esp.4045
Keywords: gobi, wind-blown sand, sand flux density, grain-size distribuition, saltation
Citation: Tan L, Zhang K, Wang H, An Z and Wang T (2022) Vertical Sand Flux Density and Grain-Size Distributions for Wind-Blown Sand Over a Gobi Surface in Milan, Southern Xinjiang, China. Front. Environ. Sci. 10:859631. doi: 10.3389/fenvs.2022.859631
Received: 21 January 2022; Accepted: 07 April 2022;
Published: 25 April 2022.
Edited by:
Brandon L. Edwards, New Mexico State University, United StatesReviewed by:
Liang Zhou, Jiangsu Normal University, ChinaHelena Granja, University of Minho, Portugal
Copyright © 2022 Tan, Zhang, Wang, An and Wang. This is an open-access article distributed under the terms of the Creative Commons Attribution License (CC BY). The use, distribution or reproduction in other forums is permitted, provided the original author(s) and the copyright owner(s) are credited and that the original publication in this journal is cited, in accordance with accepted academic practice. No use, distribution or reproduction is permitted which does not comply with these terms.
*Correspondence: Lihai Tan, dGFubGloYWkwOUBsemIuYWMuY24=
 Lihai Tan
 Kai Zhang
 Hongtao Wang1,2
 Zhishan An
 Tao Wang