 Elise Blondel
 Frans A. Buschman
- 1Allseas, Innovations Department, Delft, Netherlands
- 2Deltares, River Dynamics and Inland Shipping Department, Delft, Netherlands
Plastic litter transported in rivers may enter the marine environment. Due to the durability of plastic, the residence times in the aquatic environment are decades to millennia. Plastic litter items come in a wide variety. The density of the item and the flow velocity largely determine the vertical distribution of the plastic litter, although the litter shape and wind can also play a role in a river. Estimates of plastic transport in a river are usually based on observations of visible litter items in the near-surface layer alone. Only a very limited number of studies have observed the vertical distribution in rivers or estuaries. We have carried out 28 sampling surveys in a river bend located in the lower part of the Rhine-Meuse delta that is under the influence of tides. To observe the vertical distribution, we sampled with three nets simultaneously up to 5 m water depth, at both sides of the river bend. In total, almost 90% of the collected debris was organic matter. Plastic litter represented the large majority of the non-organic litter: about 80% by mass, having an average concentration of 0.5 mg/m3, and more than 90% by number. We observed that by mass and by number the plastic mass concentration in the middle net was generally lower than in the lower and upper nets. In total, more plastic litter was present in the two nets lower in the water column than in the surface net. A higher plastic concentration was found at the downwind side of the channel than at the upwind side of the fairway. It was found that the plastic litter mass concentrations were of the same order of magnitude during ebb than during flood tide. The litter size that contributed most to the mass concentration (around 65%) were items in between 25 and 500 mm, which were mostly soft plastics (i.e. foils). In the lower net, relatively more small hard plastic items were found. It was observed that these plastic items were sometimes entangled in organic matter. The plastic flux lower in the water column may follow the transport of organic matter like aquatic plants.
1 Introduction
Plastic waste has been accumulating in terrestrial and aquatic environments in the past decades (Thompson et al., 2004; Jambeck et al., 2015; Geyer et al., 2017; Lebreton et al., 2019). The same properties that contribute to the enormous utility of plastic namely durability and resistance to degradation, also result in long residence times (decades to millennia) when plastic is introduced into the aquatic environment (Andrady 2003). Plastic pollution is an emerging threat for the aquatic ecosystem and particularly microplastics can potentially be a hazard to human health (Derraik 2002; Teuten et al., 2007; Zalasiewicz et al., 2016; Barboza et al., 2018).
Rivers play an important role in transporting land-based plastic waste to the ocean, which is estimated from global modelling studies to range from 0.8 to 2.7 million tonnes per year (Lebreton et al., 2017; Meijer et al., 2021). Plastic litter in rivers can have negative effects, including a threat to the ecosystem, damage to ships and clogging of drains and thereby increasing flood risk (Honingh et al., 2020; van Emmerik and Schwarz 2020). Available observations suggest that most plastic waste may be retained in and around rivers (van Emmerik et al., 2022). Due to the long residence time in the river system, fragmentation of the retained macroplastics (≥5 mm) is a major source of microplastics (<5 mm). In order to understand these negative effects, it is crucial to gain better understanding in the transport, fate and impact of riverine plastic litter.
Monitoring the transport of plastic litter is complicated by large spatial and temporal heterogeneity (Ryan et al., 2009). Transport of plastic litter in rivers is considered complex due to the irregular and shallow geometry of rivers, the presence of structures that can lead to large temporal variations, large number of sources or falls of litter along the river and the interaction with river banks by stranding and remobilization (Liro et al., 2020; van Emmerik et al., 2022). Monitoring is crucial to assess the efficacy of measures implemented to reduce the abundance of plastic litter and to gain more understanding in the dynamics and fate of riverine plastic litter.
Plastic litter in rivers comes in a wide variety of forms and can originate from multiple sources, including mismanaged waste, littering and loss of fishing gear (Li et al., 2016; Bernardini et al., 2020). The size, density and shape of litter items affect how they are transported in the river (Schwarz et al., 2019) and what their fate is. Items with a density lower than that of water have the tendency to float. However, they can be dragged down in the water column due to turbulence in the flow or wind mixing (Kukulka et al., 2012; van Emmerik and Schwarz 2020). Zaat (2020) found from a laboratory study using HDPE items that with increasing flow velocity, the surface-share of the positive buoyant plastic items decreased from 95 to 25%. Similarly, plastic items that have a density that is somewhat higher than that of water (e.g. items of plastic types PS, nylon, PVC and PET), may be concentrated lower in the water column, whereas they can be brought up by the turbulent flow to the near-surface layer. Understanding the behavior of different categories plastic litter in the water column is important to predict pathways and their fate, and to establish the plastic load in rivers and its variation with conditions.
Most studies on the transport of macroplastics in rivers and estuaries are based on observations in the near-surface layer, where the items are visible from bridges (González-Fernández and Hanke 2017; van Emmerik et al., 2018). The estimates of the plastic load are usually based on these visual observations from bridges, although some of these studies performed additional sampling observations at several depths to extrapolate that distribution over time (e.g. Van der Wal et al., 2015; van Emmerik et al., 2019). It has been observed in the river Thames that a considerable amount of plastic was flowing at deeper layers (Morrit et al., 2014). In Mekong river tributaries, near-surface transport of plastic dominated, and mixing of plastic litter was observed well down in the water column (Haberstroh et al., 2021). Perhaps, the litter concentration lower in the water column may vary differently in time than the concentration in the near-surface layer. In other words, the peak in plastic litter transport lower in the water column may occur during different conditions than for the litter transport in the near-surface layer.
Other monitoring studies describe methods how to carry out a survey to study the vertical distribution. These studies all use nets to obtain plastic concentration, except for Broere et al. (2021) that used an echo sounder to detect plastic items, showing the potential to estimate underwater plastic concentration. Liedermann et al. (2018) shows a method to sample microplastics with three-layered nets in the Danube. Lenaker et al. (2019) sampled microplastics at four to five depths in the water column in the Milwaukee river basin (United States), showing that microplastics with a polymer density <1.1 g/cm3 were present in the whole water column and primarily near the water surface. Microplastics with a polymer density >1.1 g/cm3 were often found in the sediment, whereas fibers and lines were often transported in suspension At the interface of the ocean and rivers, in estuaries, flow is usually bidirectional and a gravity circulation occurs. Sadri and Thompson (2014) showed that it is challenging to obtain the net transport from sampling during ebb and flood tide in the Tamar estuary in the United Kingkom, although their study was conclusive about differences during spring tide and during neap tide.
The objective of this study is to investigate the vertical and horizontal distribution of various types of macroplastics and to investigate the variation with changing tidal flow and wind conditions. We report results of 28 sampling surveys distributed over 17 days that were carried out between 30/01/2018 and 10/07/2018 in a bend of the Nieuwe Maas, a branch of the river Rhine affected by tides. Vriend et al. (2020) estimated the annual floating plastic flux in this river branch based on 3 days of observations from bridges during ebb tide supported with data from a plastic capture device. In this paper we present the results of these surveys to get insight in the abundance and composition and their variation with tides and wind.
2 Regional Setting
2.1 Channel Network
Sampling surveys were carried out in a bend of the Nieuwe Maas (in Rotterdam, the Netherlands), which is one of the river branches that connects the Rhine and Meuse rivers with the North Sea (Figures 1, 2). The Nieuwe Maas is 24 km long and merges with the Oude Maas into the artificial Nieuwe Waterweg, which normally conveys the majority (about 60%) of the river discharge to the North Sea. Only during exceptional storm conditions at sea or during system tests has the Maeslant barrier in the Nieuwe Waterweg been closed. A closure did not occur during the sampling surveys.
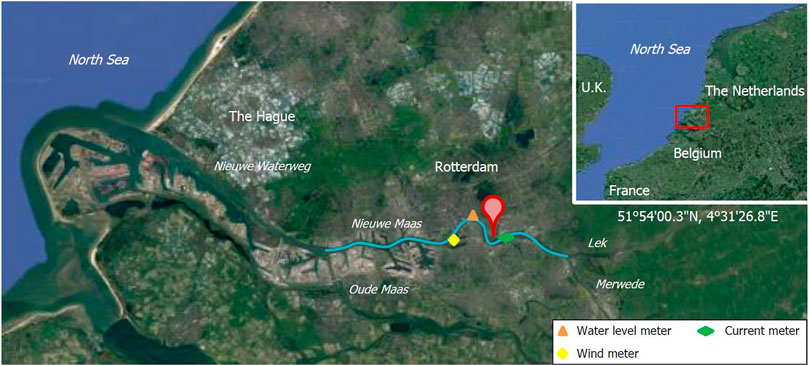
FIGURE 1. The regional topographic setting, showing the northern part of the Rhine-Meuse delta and the bend where the sampling surveys were performed (red pin). Source Google Maps.
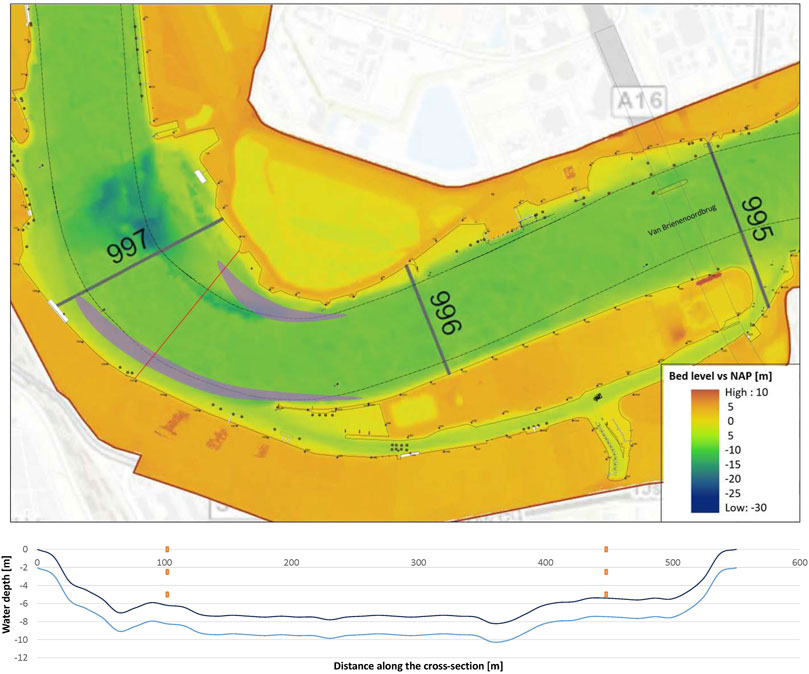
FIGURE 2. [top] The bathymetry in the bend of the Nieuwe Maas (colors) with the shipping lanes (black dotted lines), three river kilometer lines and the areas in which static and dynamic sampling was carried out in both the inner and outer bend (grey shading) indicated; [bottom] a cross-section in the bend with the net locations indicated at low tide (black) and at high tide (blue). Sources Rijkswaterstaat (monitoring data 2020) for bed level and Port of Rotterdam for navigation map.
The Nieuwe Waterweg and Nieuwe Maas are part of the Port of Rotterdam, and the shipping traffic is dense. Approximatively 30,000 sea-going vessels and 110,000 ships for inland transport sail through the Nieuwe Maas every year. Several harbours and factories are situated along the river banks of the Nieuwe Maas, which may be a source of plastics in the river (Vriend et al., 2020).
The sampling surveys were carried out west from the Van Brienenoordbrug (De Veranda area), outside of the shipping lanes (Figures 1, 2). In order to study the horizontal distribution, sampling was carried out subsequently in the inner and in the outer bend. In this river bend, the river is approximatively 410 m wide and the maximal depth at the center of the river cross-section is 8 m at low tide and 10 m at high tide (Figure 2 bottom). Both inner and outer river banks bend have a progressive slope and have been stabilized with stones.
2.2 Conditions
The flow at the bend in the tidal river is determined by the tides, river discharge and wind. The tides in the estuary are determined by the tides at the mouth of the Nieuwe Waterweg (Hook of Holland), where the tidal range is 1.2 m at mean neap tide and 2.0 m at mean spring tide (De Nijs et al., 2009). The tides are semidiurnal with a diurnal inequality, resulting in two ebb periods and two flood periods within 24.8 h. The maximum tidal flow velocities exceed 1 m/s. In the Nieuwe Maas the tides result in a duration of ebb being typically 8.7 h, whereas the duration of flood is typically 3.7 h. When the river discharge is lower than average, the ebb period is longer than at high river discharge.
The river discharge in the Nieuwe Maas is determined by the Rhine and Meuse river discharge, but mostly controlled (for more than 80%) by the Rhine discharge. At the average discharge of the Rhine and Meuse (2,182 and 327 m3/s, respectively), the Nieuwe Maas conveys 727 m3/s (Cox et al., 2021). Since there is no direct measurement of the Nieuwe Maas discharge, we used the Rhine discharge measured at Lobith as an indication for the Nieuwe Maas discharge during the sampling surveys (Supplementary Table S1). During the days that sampling surveys were carried out, the Rhine river discharge was within the range 1,235–6,061 m3/s and was within 10% from the average river discharge for most surveys. This variation did not have a significant impact on the amounts of litter found. Under average river discharge conditions, salt water rarely intrudes up to the river bend. Without stratification and vertical density circulation, flow velocity measured at one height can be used to obtain flow velocity in the entire depth using the assumption of a logarithmic velocity profile. In an average year (2017) at the Van Brienenoordbrug (Figure 1), the ebb tide lasts for about 8.5 h with an average current speed of 0.45 m/s, whereas the flood tide lasts for about 3.5 h with an average current speed of 0.43 m/s. The peak flow velocity magnitude is normally around 1.0 m/s for both ebb and flood tide.
Considering the average wind conditions, prevailing winds originate from West South West, with an average speed of 4.8 m/s at 10 m + NAP at the station indicated in Figure 1. This prevailing wind direction is from the outer towards the inner bend.
3 Material and Methods
3.1 Sampling
In 2018, 28 sampling surveys were carried out in the river bend using a sampling device manufactured for this purpose (Figure 3). Between the two hulls of a catamaran, a steel frame was mounted supporting three nets. Thanks to an electric winch, the frame was rotated up or down for sailing or sampling. Each net had a rectangular opening of 1.4 m (width) × 0.5 m (height) and was 2 m long to avoid being affected or get stuck in the propeller of the push boat. The mesh size of the nets was 3 mm × 4 mm, aiming to capture macroplastics. During the sampling surveys, the surface net was skimming the water surface up to a depth of 20–30 cm below the surface, while the middle and deeper nets sampled suspended solids at 2.5 m (center line of the middle net) and 5 m (center liner of the deeper net) below the water surface respectively.

FIGURE 3. [left] schematic of the sampler when sampling and [right] photo of the sampler navigated by the baby lady on the Nieuwe Maas.
A two-axis electromagnetic flow sensor (Valeport 803M) was installed in front of the surface net at a depth of 0.6 m below the water surface to monitor the speed over water. This speed was used to obtain the filtered volume for all three nets. In order to avoid that the lower net was touching the bed, the water depth was monitored by the crew. The water depth was measured using a Raymarine DST800 installed on the boat and varied between 6 and 10.5 m. A GPS was mounted on the boat and logged the location, from which the navigation speed was obtained.
To study the horizontal distribution in the river bend, surveys were carried out in the inner or outer bend just outside the fairway. For half of the surveys, static sampling was used, which means that the sampler was kept at a fixed position (approximatively at 10 m from the river bank) against the current by means of anchors. This type of sampling was used when the current was too strong and did not allow for dynamic sampling. Dynamic sampling was used for the other half of the surveys. For these surveys, the sampler was pushed by an aluminum workboat (Alunautic WB550 equipped with a 25 HP diesel engine) in the zones indicated in Figure 2, along an 8-shaped trajectory following the recommendations from Van der Wal et al. (2015).
The surveys were carried out either at flood tide or at ebb tide, and not in the period of 1 h before and 1 h after slack tide. Hence, the litter concentrations are representative for either ebb or flood tide. For each survey, the sampling time was recorded as soon as the nets were lowered down into the river and stopped when the nets were brought back above the water. The duration of an observation was in between 0.25 and 2.5 h, depending on the filling rates of the net.
3.2 Sorting and Counting
The litter collected in each net was spread out on separate surfaces for drying for about 2 weeks prior sorting. Then the organic matter was separated from the rest of the litter and weighed with a Soehnle Purista scale for weights up to 5 kg or a Balanzza Mini luggage scale for weights larger than 5 kg. Next, the litter was sorted into the material types: processed wood, paper/cardboard, textile, glass, metal, plastics and unidentified litter. For each material type, the litter was subdivided into the size classes: <5 mm, 5–25 mm, 25–500 mm and >500 mm, as in Van der Wal et al. (2015).
The plastic litter was further subdivided into readily recognized categories hard, soft and foam. Hard plastics are hard pieces of plastic, soft plastics mostly consist of pieces of plastics sheets, food wrappers and foamed plastics usually have a density that is much smaller than the density of water. These categories were inspired on marine litter sorting (e.g. Galgani et al., 2013). Their net category was changed to the category soft plastic. The choice for these three categories was also motivated by the sortability and recyclability of the plastics: hard plastics from packages and larger than 25 mm (or larger depending on the installation of the sorting facility) are more easily sorted and recycled than soft plastics or foam.
Each category of litter was finally counted and weighed by means of a balance (Kern PFB-300–3 with 1 mg precision) and photographed. Note that due to the mesh size, microplastics (<5 mm) could slip through the nets. Although microplastics were found in the residue, our recorded amount could lead to an underestimation of the concentration of microplastics in the Nieuwe Maas since our nets were not designed to capture microplastics. However, since Vriend et al. (2020) also included captured microplastics for this river, we show the sampled microplastics as well.
3.3 Presentation of the Results
Per sampling survey and per category, the concentration by number and by mass was determined from the number of items and their mass divided by the volume of water that was filtered. The filtered volume of water was calculated using the net opening, the boat speed over water and the survey duration. For the surface net only, the filtered volume was determined from the skimmed surface, excluding the part of the net that was above the water. The distance of the leading edge of the surface net to the water surface was measured and varied between 0.1 and 0.3 m during the sampling surveys.
Since the resulting concentrations were non-normally distributed, the results are presented in box plots, which present the locality, spread and skewness over the 28 surveys. Based on the observed mass concentrations, the yearly transport of plastic litter (i.e. the plastic litter load) to the North Sea was estimated, using the same method as Van der Wal et al. (2015) to extrapolate the observations to the river cross-section. The plastic litter load was calculated by adding the transport near the surface to the transport of plastic litter in suspension lower in the water column.
4 Results
4.1 Composition Debris
A total of 71.7 kg of material was collected in the nets, of which almost 90% was organic matter (branches, leaves, reed and fragments hereof). All non-organic litter was sorted and represented 4,056 items. Plastic was the largest share of litter, having a concentration averaged over the 3 nets and over the 28 surveys of 0.5 mg/m3. The plastic litter concentration was generally significantly higher than the concentration of other litter, which consisted primarily of textile/cloth and rubber. Figure 4 presents the vertical distribution of the organic matter, plastic litter and other litter for the three nets. In order to be able to read the median and interquartile ranges, we left out the outliers in the box plots (Supplementary Table S2 shows the results for all surveys). Considering the plastic litter concentrations, outliers occurred up to 0.01 g/m3 in the surface net, up to 0.003 g/m3 in the middle net and up to 0.039 g/m3 in the lower net. The median plastic mass concentration is highest for the surface net (Figure 4), whereas the average over all surveys was higher for the lower net. Both median and average mass concentrations are lowest for the middle net. The box plot of the plastic mass concentration shows that the interquartile range at the level of the deep and at the surface net are similar, whereas this range extends to a substantially smaller concentration at the level of the middle net (Figure 4).
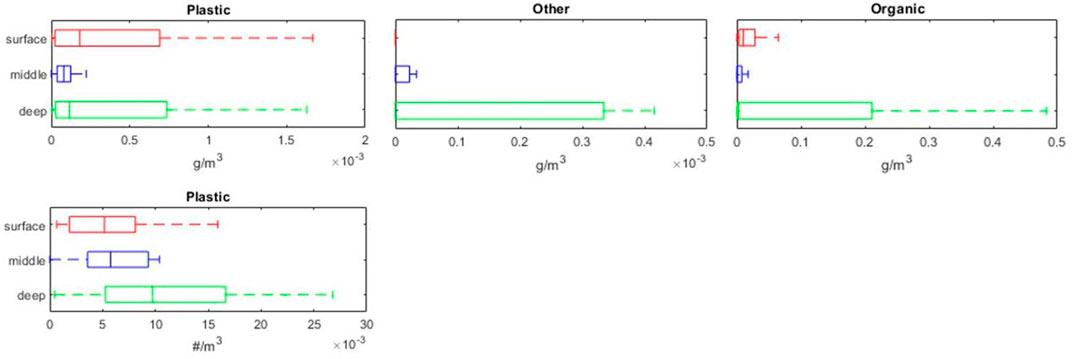
FIGURE 4. The mass concentration at the three net levels based on all 28 sampling surveys for plastic, organic matter and other materials (A box denotes the 25–75% percentile; in the box the median is plotted; whiskers go from the end of the interquartile range to the furthest observation within the whisker length). [Lower left] Only for plastic litter also the number of items per water volume is presented.
The concentration of organic matter was usually highest at the level of the lower net. The maximum organic matter concentration was found in the lower net on 18 June 2018 (19 g/m3). During that survey also the maximum concentration for plastic litter was obtained (0.039 g/m3 at the level of the lower net). That particular residue consisted of vegetation (mostly small fragments of branches and reed) with plastic items trapped in it. Some of the plastic items (category soft) were identified to be buoyant, meaning that they would normally be transported near the surface. Since these items were trapped in the vegetation, they were transported at the level of the lower net. Several other surveys showed both an elevated organic matter concentration and an elevated plastic litter concentration, especially for the lower net. The interaction of plastic litter with organic matter may be relevant for the vertical distribution of plastic litter.
A remark is made that the presented concentrations (Figure 4) may be underpredicted at 2.5 m and 5 m below the water surface. In order to determine the volume of water that was filtered, we used the velocity measured near the water surface for all three nets. The flow velocity is likely to be lower at the net levels lower in the water column. During the sampling surveys with lowest water depth (6 m) and assuming a logarithmic flow velocity profile, this may have resulted in about 25% overprediction of the flow velocity at the level of the lower net, and hence an equal underprediction of the concentration for the lower net.
4.2 Composition Plastic Litter
The type of plastic litter mostly found by mass and number was soft plastic (68% of the mass and 91% of the amount of plastic debris), then hard plastics (25% of the mass and 6% of the amount of plastic debris) and the last type of plastic that was determined was foam (7% of the mass and 3% of the amount of plastic debris). Most of these soft plastic items were pieces or fragments of plastic packaging, plastic sheets or food wrapping. These are results of lumping all 28 surveys in the three nets together. Although generally most of the plastic litter was soft plastic, the residue in the lower net consisted by mass mainly of hard plastics (Figure 5 top). Qualitatively, the higher proportion of hard plastics in the lower net can be explained by their relatively high density: many of the hard plastic litter items are made out of PS, PVC or PET, which are more dense than fresh water and therefore have the tendency to sink. The size fraction mostly found in the plastic litter was 5–25 mm, and second most 25–500 mm (Figure 5 bottom). Although microplastics can pass the nets, the third size fraction by mass contribution was <5 mm, consisting mainly of nurdles. By combining the data on category and the size classes, we noted that small (<25 mm) soft plastic items were distributed similarly over the three nets, whereas larger items (>25 mm) were more abundant in suspension (in the middle or lower net) than near the surface.
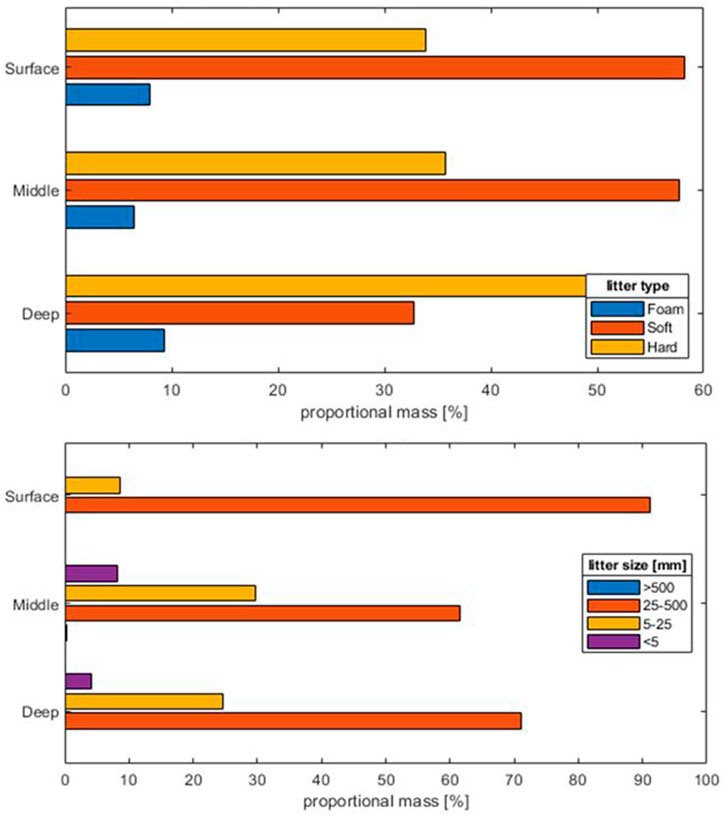
FIGURE 5. The composition of the plastic litter averaged over the 28 surveys, showing [top] the distribution over the plastic categories and [bottom] the distribution over the four size fractions.
4.3 Effect of Tides
In order to study the effect of conditions on the vertical distribution, we have compared subsets of the 28 surveys. Before we did this, we verified that the vertical distribution and composition are similar for the two methods of sampling that were used, i.e. static and dynamic sampling. We have not determined substantial differences in the results between the two methods. During 6 days sampling, surveys were both carried out during ebb (outgoing) and during flood tide (incoming). Generally, the concentration of plastic litter is lower during flood tide than during ebb tide (Figure 6). Averaged over these six ebb sampling periods the flow velocity was 0.49 m/s at the Van Brienenoordbrug and averaged over the flood sampling periods 0.28 m/s. Possible explanations for the higher concentrations during ebb are the widening of the channel (network) going seaward and trapping of items in harbor channels in the Rotterdam area, and the on average lower water levels than during flood.
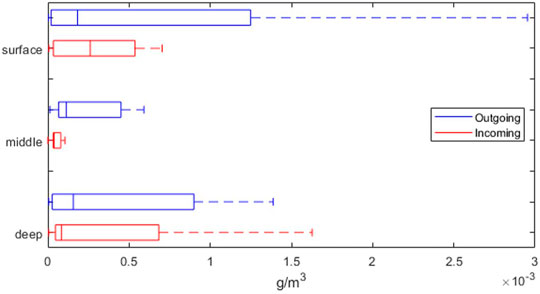
FIGURE 6. Box plot of the plastic concentration observed at the 3 net levels during the 6 days when surveys were carried out during both ebb and flood tide.
4.4 Effect of Wind on Horizontal Distribution
The hypothesis is that wind pushes litter at the surface towards the lee side of the river bend. With a wind direction around south-west (between WNW and SSE), litter at the surface is blown towards the inner side of the river bend, whereas with wind from a north to east direction it is blown to the outer bend. On six survey days, samples were taken successively at the inner side and at the outer side of the river bend. The weather conditions for each set of 2 surveys were similar (i.e. same flow direction, same wind direction and similar wind speed in between 4–14 kts). Figure 7 shows that for 5 out of 6 days more litter was collected in the surface net at the lee side of the wind and that for 3 days the difference was more than a factor 3. This distribution can generally not be explained from the spiral flow in the relatively sharp river bend. Spiral flow in a bend shows as a near-surface flow towards the outer bend and a flow near the bed towards the inner bend. When litter is not dragged down near the outer bend, spiral flow can result in accumulation of litter in the outer bend. Averaged over the 5 days, the plastic litter mass was about 73% higher at the lee side of the river bend. Although this analysis is based on a limited number of surveys, and relatively mild wind conditions (4–14 kts), wind seems to be more important for the horizontal distribution of near-surface plastic litter than the spiral flow. Wind is likely to play a significant role in the plastic transport near the surface.
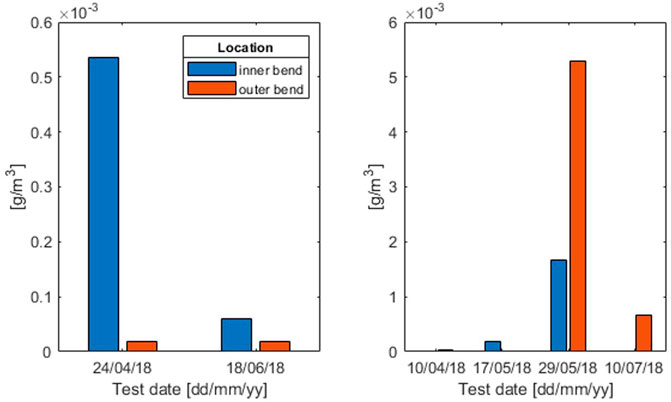
FIGURE 7. Concentration of plastic litter at the surface both at the inner and outer bend for wind directions (left) from around south-west, and (right) from around north-east. Note the difference in scale.
5 Discussion
5.1 Sampling Method
In this study a mobile floating sampler with three nets was used. Advantages are that it allows for great flexibility in the choice of the monitoring location and that both static and dynamic sampling are possible. However, monitoring from a floating device also has limitations: if used on a tidal river, the vertical position of the nets with respect to the river bed is not fixed but varies with the water level. Particularly for sampling in a shallow part of the river, the distance from the bed to the lower net can vary from 0.5 to 2.5 m in case of the Nieuwe Maas. This may have resulted in relatively high concentrations at lower water levels. Waves generated by passing vessels can also have an effect on the vertical position of the nets or bring the surface net out of the water, leading to a bias in the of litter found.
The sampling period was long enough to collect a substantial amount of litter and short enough to ensure that conditions during the sampling survey were similar. The mesh size and size of the nets was practically feasible. Generally, the sampling method is recommended for future campaigns. As an example, to monitor the variation of the litter concentration during a tidal cycle and further explain the higher concentrations during ebb, the dynamic sampling method can be repeated several times during a tidal cycle.
5.2 Near-Surface Versus Near-Bed
The results of the sampling surveys reveal that generally the concentration by mass and by number was substantially lower in the middle net than in the upper or lower net. A second conclusion is that near the water surface plastic litter is generally larger than in the lower net, having a share of the dominant large size class (25–500 mm) of about 90 and 70%, respectively. By number, more plastic items were collected in the lower net, which were sometimes entangled in organic matter. Collas et al. (2021) performed observations in a branch of the river Rhine about 80 km upstream of the location of our 28 surveys, similarly using three nets to monitor the vertical variation and using the size categories meso- and macroplastics. In line with our results, they found the highest concentration of macroplastics in the upper net and the highest concentration of mesoplastics in the lower net, whereas relatively few items were collected in the middle net. Although two monitoring campaigns in one river cannot be generalized, it is remarkable that these conclusions are qualitatively in line.
The sampling surveys show that the mass concentration of the largest plastic items is relatively high near the water surface. By releasing floating bottles with GPS trackers in the lower Seine, Tramoy et al. (2020) found that their trajectories show a succession of stranding/remobilization episodes in combination with alternating upstream and downstream transport in the estuary. Different physical phenomena interact, such as ebb and flood tides, spring and neap tides and seasonal river discharge variation. As a result, the transport and fate of floating plastic debris in estuaries is highly unpredictable (Tramoy et al., 2020). Other studies also found that the share of floating plastic litter transported to the sea is small. In the Jakarta catchment only 3% of the litter was transported to the sea (van Emmerik et al., 2019) and in three German rivers this percentage ranged from 0.001 to 0.76% (Schöneich-Argent et al., 2020). Meijer et al. (2021) estimated that globally less than 2% of the mismanaged plastic waste on land enters the sea via rivers.
It is likely that most plastic litter with the tendency to sink is situated lower in the water column close to the river bed, where the influence of wind is limited. The plastic litter transport near the bed may be entangled in aquatic plants, and if so, it may follow a seasonal cycle as the plastic item is transported when plants die (on land close to the river banks or in the water), reach the river bed where they are further transported. Furthermore, the temporal variation of the flow velocity is likely to be different, resulting in a substantially different temporal variation of the plastic flux near the bed in comparison with the flux near the surface. Therefore, monitoring efforts aiming to obtain the total transport of plastic litter in a river should best include observations of plastic litter both near the bed and near the water surface. A recommendation for future studies is to determine the density per item (class) as well, such that the relation density and vertical position in the water column can be established.
5.3 Plastic Litter Load
We found that the total plastic litter transport is dominated by the suspension transport. The total plastic litter load was estimated between 9.1 and 31.8 tonnes/y. Van der Wal et al. (2015) estimated that 20–31 tonnes/y of plastic litter are transported to the North Sea via the river Rhine, whereas Vriend et al. (2020) found a lower transport ranging from 0.5 to 3.5 tonnes/y. Vriend et al. (2020) suggested that their transport was lower, due to the low river discharge when they did the 3 days visual counting. Another explanation may be that the main size category of items (5–25 mm) reported in this study could not be seen from the bridge, even when they were floating at the water surface.
Since we found a substantial effect of a mild wind on the litter distribution at the surface across the channel, we have a recommendation for the commonly used method to estimate plastic load using visual counting from bridges (González-Fernández and Hanke 2017; van Emmerik et al., 2018). They define a track width over which the counting is carried out. We recommend defining the track width as the entire width to estimate the plastic flux in the surface layer, in order to avoid erroneous extrapolation to the whole river width. In case the track width needs to be smaller than the river width for practical reasons, the track width should be selected such that it includes not only the main flow channel, but also the zones close the river bank where floating litter concentration may be affected by the wind. Possibly, the visual counting methods can further be improved by including this criterion for the selection of the track width that is visually monitored. This recommendation on the horizontal variation of the plastic litter flux holds also for methods that use video cameras and deep learning techniques to estimate the plastic flux in the near-surface layer of a river. However, to obtain a reliable plastic litter load, the presented vertical distribution of plastic litter (Figure 4) suggests that minimally the plastic litter flux both near the water surface and near the bed should be monitored.
Data Availability Statement
The original contributions presented in the study are included in the article/Supplementary Material, further inquiries can be directed to the corresponding author.
Author Contributions
EB and colleagues from Allseas Engineering BV conceived the sampler used in this study as well as the sampling nets, performed the actual tests and analyzed the data. FB and EB elaborated on the data analysis and wrote the manuscript.
Conflict of Interest
The authors declare that the research was conducted in the absence of any commercial or financial relationships that could be construed as a potential conflict of interest.
Publisher’s Note
All claims expressed in this article are solely those of the authors and do not necessarily represent those of their affiliated organizations, or those of the publisher, the editors and the reviewers. Any product that may be evaluated in this article, or claim that may be made by its manufacturer, is not guaranteed or endorsed by the publisher.
Supplementary Material
The Supplementary Material for this article can be found online at: https://www.frontiersin.org/articles/10.3389/fenvs.2022.861457/full#supplementary-material
References
Barboza, L. G. A., Dick Vethaak, A., Lavorante, B. R. B. O., Lundebye, A.-K., and Guilhermino, L. (2018). Marine Microplastic Debris: An Emerging Issue for Food Security, Food Safety and Human Health. Mar. Pollut. Bull. 133, 336–348. doi:10.1016/j.marpolbul.2018.05.047
Bernardini, G., McConville, A. J., and Castillo, A. C. (2020). Macro-plastic Pollution in the Tidal Thames: An Analysis of Composition and Trends for the Optimization of Data Collection. Mar. Policy 119, 104064. <Go to ISI>://WOS:000564688100007. doi:10.1016/j.marpol.2020.104064
Broere, S., van Emmerik, T., González Fernández, D., Luxemburg, W., de Schipper, M., Cózar Cabañas, A., et al. (2021). Towards Underwater Macroplastic Monitoring Using Echo Sounding.
Collas, F. P. L., Oswald, S. B., and Verberk, W. C. E. P. (2021). Plastic in de waterkolom van de Boven-Rijn, Waal en IJssel, Report. (in Dutch). Institute for Water and Wetland Research, Radboud University, 71. Available at: https://zwerfafval.rijkswaterstaat.nl/kennisbibliotheek/@248354/plastic-waterkolom-boven-rijn-waal-ijssel/.
Cox, J. R., Huismans, Y., Knaake, S. M., Leuven, J. R. F. W., Vellinga, N. E., van der Vegt, M., et al. (2021). Anthropogenic Effects on the Contemporary Sediment Budget of the Lower Rhine‐Meuse Delta Channel Network. Earth's Future, 22. doi:10.1029/2020EF001869
De Nijs, M. A. J., Winterwerp, J. C., and Pietrzak, J. D. (2009). On Harbour Siltation in the Fresh-Salt Water Mixing Region. Cont. Shelf Res. 29, 175–193. doi:10.1016/j.csr.2008.01.019
Derraik, J. G. B. (2002). The Pollution of the Marine Environment by Plastic Debris: a Review. Mar. Pollut. Bull. 44, 842–852. doi:10.1016/s0025-326x(02)00220-5
Galgani, F., Hanke, G., Werner, S., Oosterbaan, L., Nilsson, P., Fleet, D., et al. (2013). Guidance on Monitoring of Marine Litter in European Seas. Institute for Environment and Sustainability (Joint Research Centre), MSFD Technical Subgroup on Marine Litter Group. JRC83985 EUR 26113 EN. doi:10.2788/99816;10.2788/99475ISSN 1831-9424
Geyer, R., Jambeck, J. R., and Law, K. L. (2017). Production, Use, and Fate of All Plastics Ever Made. Sci. Adv. 3, e1700782. doi:10.1126/sciadv.1700782
González-Fernández, D., and Hanke, G. (2017). Toward a Harmonized Approach for Monitoring of Riverine Floating Macro Litter Inputs to the Marine Environment. Front. Mar. Sci. 4, 86. doi:10.3389/fmars.2017.00086
Haberstroh, C. J., Arias, M. E., Yin, Z., Sok, T., and Wang, M. C. (2021). Plastic Transport in a Complex Confluence of the Mekong River in Cambodia. Environ. Res. Lett. 16 (9), 095009. doi:10.1088/1748-9326/ac2198
Honingh, D., van Emmerik, T., Uijttewaal, W., Kardhana, H., Hoes, O., and van de Giesen, N. (2020). Urban River Water Level Increase through Plastic Waste Accumulation at a Rack Structure. Front. Earth Sci. 8, 28. doi:10.3389/feart.2020.00028
Jambeck, J. R., Geyer, R., Wilcox, C., Siegler, T. R., Perryman, M., Andrady, A., et al. (2015). Plastic Waste Inputs from Land into the Ocean. Science 347, 768–771. doi:10.1126/science.1260352
Kukulka, T., Proskurowski, G., Morét-Ferguson, S., Meyer, D. W., and Law, K. L. (2012). The Effect of Wind Mixing on the Vertical Distribution of Buoyant Plastic Debris. Geophys. Res. Lett. 39. doi:10.1029/2012GL051116
Lebreton, L. C. M., van der Zwet, J., Damsteeg, J.-W., Slat, B., Andrady, A., and Reisser, J. (2017). River Plastic Emissions to the World's Oceans. Nat. Commun. 8, 15611. doi:10.1038/ncomms15611
Lebreton, L., Egger, M., and Slat, B. (2019). A Global Mass Budget for Positively Buoyant Macroplastic Debris in the Ocean. Sci. Rep. 9, 12922. doi:10.1038/s41598-019-49413-5
Lenaker, P. L., Baldwin, A. K., Corsi, S. R., Mason, S. A., Reneau, P. C., and Scott, J. W. (2019). Vertical Distribution of Microplastics in the Water Column and Surficial Sediment from the Milwaukee River Basin to Lake Michigan. Environ. Sci. Technol. 53, 12227–12237. doi:10.1021/acs.est.9b03850
Li, W. C., Tse, H. F., and Fok, L. (2016). Plastic Waste in the Marine Environment: A Review of Sources, Occurrence and Effects. Sci. Total Environ. 566-567, 333–349. doi:10.1016/j.scitotenv.2016.05.084
Liedermann, M., Gmeiner, P., Pessenlehner, S., Haimann, M., Hohenblum, P., and Habersack, H. (2018). A Methodology for Measuring Microplastic Transport in Large or Medium Rivers. Water 10, 414. doi:10.3390/w10040414
Liro, M., Emmerik, T. V., Wyżga, B., Liro, J., and Mikuś, P. (2020). Macroplastic Storage and Remobilization in Rivers. Water 12 (7), 2055. doi:10.3390/w12072055
Meijer, L. J. J., van Emmerik, T., van der Ent, R., Schmidt, C., and Lebreton, L. (2021). More Than 1000 Rivers Account for 80% of Global Riverine Plastic Emissions into the Ocean. Sci. Adv. 7, eaaz5803. doi:10.1126/sciadv.aaz5803
Morritt, D., Stefanoudis, P. V., Pearce, D., Crimmen, O. A., and Clark, P. F. (2014). Plastic in the Thames: A River Runs through it. Mar. Pollut. Bull. 78 (1-2), 196–200. doi:10.1016/j.marpolbul.2013.10.035
Ryan, P. G., Moore, C. J., van Franeker, J. A., and Moloney, C. L. (2009). Monitoring the Abundance of Plastic Debris in the Marine Environment. Phil. Trans. R. Soc. B 364, 1999–2012. doi:10.1098/rstb.2008.0207
Sadri, S., and Thompson, R. (2014). On the Quantity and Composition of Floating Plastic Debris Entering and Leaving the Tamar Estuary, Southwest England. Mar. Pollut. Bull. 81, 55–60. doi:10.1016/j.marpolbul.2014.02.020
Schöneich-Argent, R. I., Dau, K., and Freund, H. (2020). Wasting the North Sea? – a Field-Based Assessment of Anthropogenic Macrolitter Loads and Emission Rates of Three German Tributaries. Environ. Pollut. 263, 114367. doi:10.1016/j.envpol.2020
Schwarz, A. E., Ligthart, T. N., Boukris, E., and van Harmelen, T. (2019). Sources, Transport, and Accumulation of Different Types of Plastic Litter in Aquatic Environments: A Review Study. Mar. Pollut. Bull. 143, 92–100. doi:10.1016/j.marpolbul.2019.04.029
Teuten, E. L., Rowland, S. J., Galloway, T. S., and Thompson, R. C. (2007). Potential for Plastics to Transport Hydrophobic Contaminants. Environ. Sci. Technol. 41 (22), 7759–7764. doi:10.1021/es071737s
Thompson, R. C., Olsen, Y., Mitchell, R. P., Davis, A., Rowland, S. J., John, A. W. G., et al. (2004). Lost at Sea: where Is All the Plastic? Science 304, 838. doi:10.1126/science.1094559
Tramoy, R., Gasperi, J., Colasse, L., Silvestre, M., Dubois, P., Noûs, C., et al. (2020). Transfer Dynamics of Macroplastics in Estuaries - New Insights from the Seine Estuary: Part 2. Short-Term Dynamics Based on GPS-Trackers. Mar. Pollut. Bull. 160, 111566. doi:10.1016/j.marpolbul.2020.111566
Van der Wal, M., van der Meulen, M., Tweehuijsen, G., Peterlin, M., Palatinus, A., Virsek, K., et al. (2015). Identification and Assessment of Riverine Input of (Marine) Litter. Final Report for the European Commission DG Environment under Framework Contract No ENV.D.2/FRA/2012/0025. Bristol, United Kingdom, 186.
van Emmerik, T., and Schwarz, A. (2020). Plastic Debris in Rivers. WIREs Water 7 (1). doi:10.1002/wat2.1398
van Emmerik, T., Kieu-Le, T.-C., Loozen, M., van Oeveren, K., Strady, E., Bui, X.-T., et al. (2018). A Methodology to Characterize Riverine Macroplastic Emission into the Ocean. Front. Mar. Sci. 5, 372. doi:10.3389/fmars.2018.00372
van Emmerik, T., Loozen, M., van Oeveren, K., Buschman, F., and Prinsen, G. (2019). Riverine Plastic Emission from Jakarta into the Ocean. Environ. Res. Lett. 14 (8), 084033. doi:10.1088/1748-9326/ab30e8
van Emmerik, T., Mellink, Y., Hauk, R., Waldschläger, K., and Schreyers, L. (2022). Rivers as Plastic Reservoirs. Front. Water 3, 212. doi:10.3389/frwa.2021.786936
Vriend, P., van Calcar, C., Kooi, M., Landman, H., Pikaar, R., and van Emmerik, T. (2020). Rapid Assessment of Floating Macroplastic Transport in the Rhine. Front. Mar. Sci. 7. doi:10.3389/fmars.2020.00010
Zaat, L. (2020). Below the Surface: A Laboratorial Research to the Vertical Distribution of Buoyant Plastics in Rivers. Technical University Delft. Master thesis.
Keywords: sampling, river bend, plastic pollution, macroplastic, rhine river, nieuwe maas, plastic flux
Citation: Blondel E and Buschman FA (2022) Vertical and Horizontal Plastic Litter Distribution in a Bend of a Tidal River. Front. Environ. Sci. 10:861457. doi: 10.3389/fenvs.2022.861457
Received: 24 January 2022; Accepted: 19 April 2022;
Published: 30 May 2022.
Edited by:
Sergi Sabater, University of Girona, SpainReviewed by:
Tim van Emmerik, Wageningen University and Research, NetherlandsSeung-Buhm Woo, Inha University, South Korea
Copyright © 2022 Blondel and Buschman. This is an open-access article distributed under the terms of the Creative Commons Attribution License (CC BY). The use, distribution or reproduction in other forums is permitted, provided the original author(s) and the copyright owner(s) are credited and that the original publication in this journal is cited, in accordance with accepted academic practice. No use, distribution or reproduction is permitted which does not comply with these terms.
*Correspondence: Frans A. Buschman, RnJhbnMuQnVzY2htYW5AZGVsdGFyZXMubmw=