 Narendra Kumar Lenka1*
 Bharat Prakash Meena1
 Rattan Lal2
 Abhishek Khandagle1
 Sangeeta Lenka1*Abhay Omprakash Shirale1
- 1Indian Institute of Soil Science, Bhopal, India
- 2CFAES Rattan Lal Center for Carbon Management and Sequestration, The Ohio State University, Columbus, OH, United States
The usefulness of the soil quality index (SQI) as a tool to evaluate management options has mostly been studied within the boundaries of a crop or experimental field, calling for the need to enhance its utility in regional-scale soil health assessment. Thus, four quantitative approaches for computing the SQI were evaluated with samples collected from 0 to 15 and 15 to 30 cm depths at 156 points from the Trans-Gangetic Plains of North India. Principal component analysis (PCA) and soil function (SF)-based approaches were used to select the minimum dataset from 18 soil parameters and assign weights to key indicators. In both approaches, two different data transformation methods were followed: 1) routine method with maximum or minimum values of indicator parameters and 2) percentile method with the 90th or 10th percentile value as the denominator or numerator for “more is better” and “less is better” scoring functions, respectively. The PCA output with factor loadings from the varimax rotation showed six principal components accounting for 75% of the total variance, with PC1 explaining the highest variance (26.8%) followed by PC2 (16%). The SF-based approach was better than PCA in terms of a higher correlation of SQI with rice and wheat yields. The percentile method showed a higher correlation in both PCA and SF methods. The SQI computed from 0 to 30 cm soil data did not show any superiority over that from 0 to 15 cm soil. Thus, the soil function–based approach with the percentile method of data transformation proved better to compute the SQI and establish a relationship with production function.
1 Introduction
Globally, soil-based production systems are showing signs of fatigue with an ever-increasing need for production intensification as most of the growth in agricultural production has to come from enhanced productivity from existing or shrinking agricultural land resources (Shah and Wu, 2019). The need to produce more food for a burgeoning population puts tremendous pressure on our production systems and natural resource base. Thus, scientific management for maintaining soil quality remains the key to ensuring global food security (Subba Rao and Lenka, 2020; Çelik et al., 2021; Janků et al., 2022). The soil quality index (SQI) approach has been used as a quantitative tool to establish linkage between soil health encompassing physical, chemical, and biological properties of soil and a management goal (Andrews et al., 2002; Abdollahi et al., 2015; Nakajima et al., 2015; Haney et al., 2018; Vasu et al., 2021). However, the usefulness of SQI as a tool to evaluate management options has mostly been studied within the boundaries of a crop or experimental field (Sharma et al., 2005; Masto et al., 2007; Stott et al., 2011; Vasu et al., 2021). A few studies are available where the SQI approach has been used on a regional scale (Vasu et al., 2016).
As there is no direct method to measure soil quality, its assessment is attempted only through monitoring changes in specific soil quality indicators over time or comparing them over best management practices (Mukherjee and Lal, 2014; Nakajima et al., 2015; Zeraatpisheh et al., 2020; Çelik et al., 2021; Janků et al., 2022). Among the several soil quality evaluation procedures, the soil quality assessment framework (Andrews et al., 2004) involving normalization techniques and linear or non-linear scoring procedures has been used to evaluate the effect of management on soil health. In this framework, identifying soil quality indicators and assigning weights to each indicator parameter are critical in developing a robust SQI that can correlate well with a specific soil function (Amorim et al., 2020). Techniques such as expert opinion or statistical tools such as principal component analysis (PCA) have often been used to form a minimum database.
The SQI computed employing the PCA approach suffers from a significant limitation that only the principal components explaining at least 5% of the variation in the data and with eigenvalue > 1.0 are taken into account. In this process, some critical and vital parameters for a given management goal are sometimes excluded (Vasu et al., 2016). Next, the PCA-derived indicators change with time, and the weights of each indicator may be different in different management zones. On the contrary, a soil function–based approach involving expert opinion can be a less tedious and more reliable approach for use on a regional scale provided the computed SQI is validated with the parameter defined for the specific management goal (Fernandes et al., 2011).
In either of these methods, data transformation is done using linear or non-linear scoring techniques. Most of the indexing methods have used three scoring functions, viz., “more is better,” “less is better,” or “optimum is better,” as per the type of indicator parameter and its importance to the soil function under study (Karlen et al., 2013; Lenka et al., 2014; Nakajima et al., 2015; Vasu et al., 2021). In this method, the maximum or minimum of the parameter value is taken as the denominator or numerator, respectively, to transform the parameter values to unitless scores as per the scoring function chosen (more is better, less is better, or optimum is better). A single value of maximum or minimum to transform the data is suitable in small experimental field studies. However, when the SQI is used on a regional scale, the values of maxima or minima for data transformation can be exceptionally high or low and thus may bring in error in the computation of indicator scores. Instead, the 90th percentile value for “more is better” and the 10th percentile value for “less is better” type of indicator can more appropriately represent the highest or lowest class of the indicator parameter. However, all previous attempts to compute the SQI are based on the maximum or minimum value for data transformation. No study has been available showing the parameter values of the highest or the lowest group being used for data transformation. Furthermore, it is argued that the SQI computed using soil profile data (0–30 cm or 0–60 cm depth) may be better correlated with crop yield than that calculated from the surface soil data (Mukherjee and Lal, 2014; Vasu et al., 2016). However, some other studies report a different trend of results (Karlen et al., 2013).
Keeping the above in view, the objectives of this study were 1) to compare the PCA-based approach with the soil function–based approach for the computation of SQI on a regional scale, 2) to compare the two data transformation procedures, viz., the routine method vs. the percentile method, and 3) to compare the SQI computed from the surface soil (0–15 cm soil depth) data with that computed from the 0–30 cm data. This study is based on the following three hypotheses: the computed SQI would be more relevant and better correlate with the production goal 1) if the parameters of the MDS adequately represent the soil functions, 2) if the data transformation procedure is not based on a single extreme parameter value, rather than based on a class of values, and 3) if soil data of a profile or greater depth is used than the surface layer or 0–15 cm depth data.
2 Materials and Methods
2.1 Study Region
The Udham Singh Nagar district, with a geographical area of 3,055 km2 in the state of Uttarakhand, India, is the study region. The district is a part of the Trans-Gangetic Plains of India and is intensively cultivated (cropping intensity of about 212%), with rice (Oryza sativa) and wheat (Triticum aestivum) being the major crops. It is one of India’s highest chemical fertilizer–consuming regions per the Fertilizer Use Statistics (Fertilizer Association of India, 2017), with an average consumption of 545 kg ha−1 of N + P2O5 + K2O. The district is considered the food bowl of the Uttarakhand state and lies between 28°43′ N and 31°27′ N latitude and between 77°34′ E and 81°02′ E longitude. The climate of the study district is sub-tropical sub-humid with 1,433 mm of annual average rainfall. The annual maximum temperature goes up to 42°C during the summer months, and the minimum temperature varies between 1°C and 4°C. Inceptisols and Entisols are the major soil types, with Udifluventic Ustochrepts, Typic Ustipsamments, Udic Ustochrepts, Udic Haplusterts, and Typic Ustochrepts being the major soil classes (Soil Survey Staff, 2014).
2.2 Soil Sampling and Analysis
Georeferenced soil samples were collected during the months of May to June in the year 2019 from 0 to 15 cm and 15 to 30 cm depths after the harvest of the winter season crop. From the study district, samples were collected at 10 km grid points. For identifying grid points, the Toposheet of Survey of India was used. Each grid point represented either one village or a village cluster within a 5 km distance. From each grid village or village cluster, 2–4 farmers representing a small/medium and a large farmer category were selected. Soil samples were collected by making composite samples from 5 to 7 auger points from each sampling farmer. In total, samples were collected from 156 locations. The samples were air-dried and sieved for laboratory analysis for 18 parameters, including physical, chemical, and biological soil properties. The sample passing through a 0.5 mm sieve was used for estimating organic carbon. In contrast, soil samples passing through 2 mm sieves were used for the remaining soil quality parameters. The physical parameters were bulk density and soil moisture retention at 33 and 1,500 kPa in Pressure Plate Apparatus, and chemical parameters were pH, electrical conductivity (EC), available N (N), available P (P), available K (K), cation exchange capacity (CEC), available sulfur (S), KMnO4 oxidizable carbon, and the soil organic carbon fractions (very labile, labile, and less labile fractions distinguished on the basis of the chemical oxidation method). The biological parameters were the dehydrogenase assay (DHA), fluorescein diacetate (FDA), soil respiration, and acid phosphatase activity. Standard analytical protocols Lenka et al. (2019) were used for estimating the 18 soil quality parameters (Supplementary Table S1).
Yield data of rice and wheat crops for the five previous years were collected from individual farm holders through a questionnaire. The average of five-year yield data was used for regressing with SQI values.
2.3 Minimum Dataset Selection
2.3.1 Principal Component Analysis Method
The PCA method is a dimension reduction approach in which the number of variables of the dataset is reduced by retaining most of the original variability in the dataset. Principal components (PCs) with high eigenvalues are considered best representatives explaining the variability (Mukherjee and Lal, 2014; Zeraatpisheh et al., 2020). The PCA in this study was carried out for the 18 soil parameters. The PCs with eigenvalues ≥ 1 were selected, as they described more data variability. The retained PCs were subjected to varimax rotation to maximize the correlation between each PC and soil properties by distributing the variance. Under each PC, highly weighted variables were selected as critical soil quality indicators for the computation of SQI. Multivariate correlation coefficients were used to check for redundancy and correlation between the variables. If the variables are well-correlated (r ≥ 0.70), then the variable having the highest factor loading (absolute value) was retained as an indicator among the well-correlated variables. In case of a non-significant correlation between the highly weighted variables, reflecting their independent functioning, all the variables were retained in the minimum dataset (Vasu et al., 2016). The variables selected from this procedure formed the MDS and were termed the “key indicators” and were considered for computation of SQI.
2.3.2 Soil Function–Based Approach
In this approach, primary soil functions were defined based on expert opinion with regard to their established role in the soil production function, similar to the “Soil Management Assessment Framework” suggested by Andrews et al. (2004) and Wienhold et al. (2009). Indicators under the four soil functions, viz., 1) soil structure and water storage, 2) nutrient supply function, 3) soil biological activity, and 4) soil basic characteristics having the potential to limit soil use for production, were selected based on expert opinion, previous literature, and facts about the edaphic conditions of the study area (Table 1). The appropriate scoring functions for each parameter are shown in Table 1.
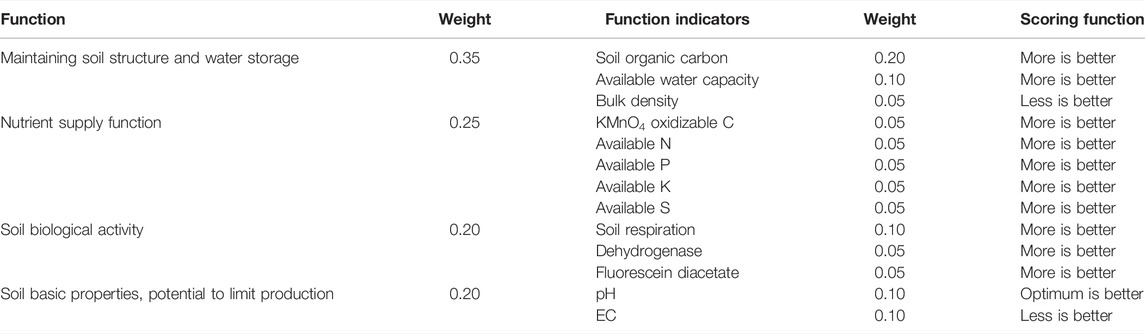
TABLE 1. Soil functions, their indicators, and assigned weights.
2.4 Data Transformation
2.4.1 Linear Scoring With a Single Value of Maximum or Minimum
The selected indicators in the MDS in both PCA and SF approaches were transformed into dimensionless values ranging from 0 to 1 using the linear scoring method (Stott et al., 2011; Amorim et al., 2020). Indicators were ranked in ascending or descending order depending on whether a higher value was considered “good” or “bad” in terms of soil function. For “more is better” indicators, each indicator value was divided by the highest value (maximum) such that the highest value received a score of 1.0. For “less is better” indicators, the lowest value (minima) was divided by the indicator value such that the lowest value received a score of 1.0. The “optimum is better” function was considered for some indicators like pH. The “more is better” function was considered up to a threshold range (pH of 6.5–7.5), after which the “lower is better” function was used as described above (Sharma et al., 2005; Zeraatpisheh et al., 2020). The indicator score was calculated as per the following formula:
2.4.2 Linear Scoring With Percentile Value as Maximum or Minimum
In this method, the 90th percentile value of a particular indicator parameter was considered the maximum value for the “more is better” type of indicator, whereas the 10th percentile value of the indicator parameter was taken as the minimum value for the “less is better type” of parameter. The other procedures were similar to those described in Section 2.4.1. If the computed score was higher than 1.0, it was restricted to a maximum value of 1.0. The indicator score was calculated using the following formula:
2.5 Assigning Weights
The next step in SQI calculation was assigning weights to each indicator parameter selected under the MDS. In the PCA approach, the selected indicators in the MDS were given weights using the PCA output. Each PC explained a certain percentage of variability in the total dataset. The percentage of variance explained by each indicator under a particular PC, when divided by the cumulative percentage of variance explained by all PCs with eigenvectors > 1, gave the weight for the indicator(s) selected under a given PC.
In the SF-based approach, weights were assigned first to the major soil functions (Table 1). In the second level, the weights of each soil function were further sub-divided to the indicator parameters as per the relative importance of the particular indicator, assessed by expert opinion and as per the literature survey (Fernandes et al., 2011; Vasu et al., 2016).
2.6 SQI Calculation
The indicators were assigned weights so that the sum of weights of all factors is unity. The weighted MDS indicator scores for each observation were summed up using the following function:
where Wi = weight assigned to each selected indicator and Si = score of each indicator.
The SQI, as discussed above, was computed using the soil data of two different depths, viz., 0–15 cm and 0–30 cm data.
2.7 Statistical Analysis
The dimension reduction of the data was performed through principal component analysis to select the minimum dataset. The normality of the data was checked by the Shapiro–Wilk test at p < 0.05, and the data were found to be normally distributed. Pearson’s correlation coefficient was used as the indicator to evaluate the statistical correlation between the SQI and the crop yield. The significance of the correlation was tested by Student’s t-test at p < 0.05. The statistical analysis was carried out using the statistical software SPSS Version 21.0.
3 Results
3.1 Descriptive Statistics of Soil Properties
The soil samples were analyzed for 18 parameters covering important physical, chemical, and biological properties. The data on soil properties (Table 2) showed soils of the study region were mostly neutral in reaction with the average pH of 7.26 (varying from 5.39 to 8.54). The soils were mostly non-saline (average EC of 0.17 dS m−1), good in soil organic carbon content (average SOC of 0.80%), and moderate in AWC (average value of 28.84%) despite variations in the samples. The average CEC was 15.25 cmol (p+) kg−1, BD was 1.45 Mg m−3, soil respiration was 4.94 mg CO2/100g/day, and KMnO4 oxidizable C was 564 mg kg−1. The data indicated higher lability of SOC as observed from the values of very labile fraction and the KMnO4 oxidizable C. The physical parameters were less variable with a lower coefficient of variation (CV) value than chemical and biological parameters. The most variable parameters (CV > 0.35) were available P, K, and S, CEC, EC, FDA, soil respiration, and the carbon fractions (labile, less labile, and very labile) (Wilding, 1985). Compared to the carbon fractions, SOC and KMnO4 oxidizable carbon showed less variability. In terms of available nutrients, the plant available N was mostly in the low range (average of 226 kg ha−1), but available P and K were in the range of high availability (average values of P and K were 67 and 238 kg ha−1, respectively). The moderately variable (CV, 0.15–0.35) parameters were available N, AWC, SOC, dehydrogenase, and acid phosphatase. However, pH and BD were the least variable (CV < 0.15) parameters. The skewness of most of the parameters was within the range of −0.5 to + 0.5, indicating a reasonably symmetrical distribution. Data of available K and less labile C fraction were positively skewed. The data distribution of available K and less labile C fraction was leptokurtic with kurtosis values greater than 3.0, indicating more outliers. However, distributions of other monitored parameters were platykurtic with kurtosis values lower than 3.0 and indicating fewer extreme values (Table 2).
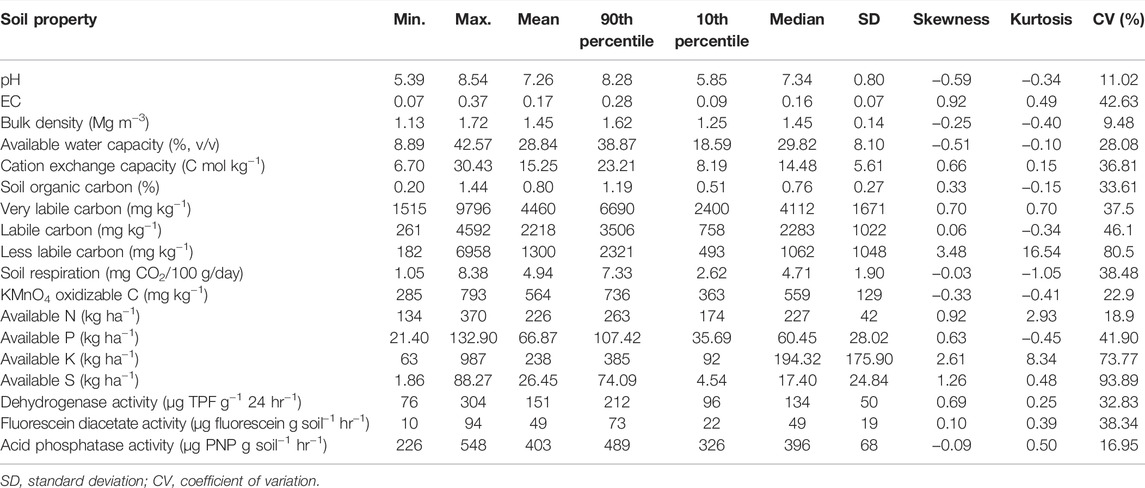
TABLE 2. Descriptive statistics of soil properties of 0–15 cm depth used for soil quality assessment (n = 156).
3.2 Principal Component Analysis
The PCA output showed six PCs with eigenvalue >1, accounting for 75% of the variance (Table 3). PC1 explained the highest variance (26.76%) followed by PC2 (16%), PC3 (10%), PC4 (8.7%), PC5 (7.2%), and PC6 (5.95%). The factor loadings resulting from the varimax rotation showed SOC, very labile C, labile C, available N, and available K to be the factors under PC1. However, multiple regression indicated SOC was highly correlated with labile C and very labile C (Supplementary Table S2). Hence under PC1, SOC, available N, and available K were retained as the indicator parameters for MDS. Under PC2, higher values of factor loadings were for EC and available P. The multiple correlation values showed EC and available P to be weakly correlated (Supplementary Table S3). Hence, both EC and available P were retained under PC2 for MDS formation. Similarly, BD was retained under PC3 (Supplementary Table S4). For PC4, PC5, and PC6, only single parameters showed factor loadings greater than 0.60. Hence, pH, available S, and soil respiration were included for MDS under PC4, PC5, and PC6, respectively.
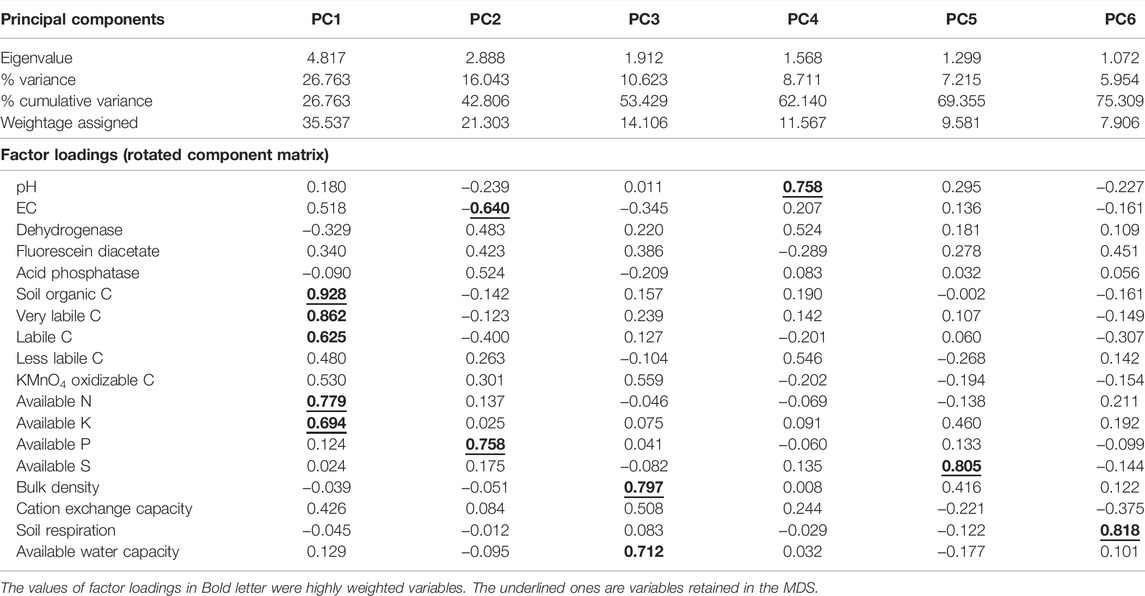
TABLE 3. Output of principal component analysis with eigenvalue, variance, and factor loadings of component matrix variables (n = 156).
3.3 Indicator Weights and Weighted Scores
In the PCA approach, weights were assigned to the nine selected indicators as per the percentage of variance explained by selected indicators in each PC (Table 3). For instance, the variance explained by PC1 was divided among three indicators, viz., SOC, available N, and available K. Thus, SOC, available N, and available K received a weight of 11.8% each. The bulk density (BD) was the only physical parameter under the MDS and received a score of 14%. In contrast, soil respiration (SR) was the only biological parameter and received a score of 8%. The average weighted scores were higher when the percentile values were used as numerators or denominators than when the routinely used maximum or minimum values were used (Supplementary Figure S1). Among parameters, the weighted score was higher for SOC and BD. Despite an equal weight assigned to SOC, available N, and available K, the average weighted score of available N and available K was lower than that of SOC in both the scoring techniques (PCA and PCA–percentile). This trend was observed due to uniformly distributed parameter values in SOC compared to the maximum or 90th percentile values. On the contrary, due to high fertilizer application in the study region, few values were much higher than their corresponding population in the case of nutrient elements such as available N, P, and K, thus reducing their weighted scores.
In the SF method, 13 parameters were selected covering physical, chemical, and biological properties (Table 1). SOC was given a score of 20%, considering its role in multiple soil functions. The physical parameters, viz., BD and AWC, were jointly assigned a score of 15%. Like the PCA method, the average weighted scores were higher when the percentile values were used as numerators or denominators than when the routinely used maximum or minimum values were used (Supplementary Figure S2).
3.4 Soil Quality Index
The average SQI values computed using the four methods for the two sets of soil data (0–15 cm and 0–30 cm) are shown in Figure 1. In both the datasets, the SQI value in the PCA method was the lowest (Figure 1), whereas the highest SQI values were observed in the SF–percentile method. When percentile values were used as numerators or denominators for transforming data to unitless scores, the computed SQI values increased in the PCA and SF methods. The average SQI values of the 0–15 cm soil were 0.587, 0.631, 0.689, and 0.722 under PCA, PCA–percentile, SF, and SF–percentile methods (Figure 1; Supplementary Table S5). In all the indexing methods, SQI values of the 0–30 cm soil were similar to the corresponding SQI of the 0–15 cm soil. The SQI of the 0–15 cm soil varied from 0.44 to 0.73 under PCA, 0.46 to 0.77 under SF, 0.52 to 0.82 under PCA–percentile, and 0.51 to 0.88 under SF–percentile methods (Supplementary Table S5). The range of SQI in the 0–30 cm soil was slightly higher than that in 0–15 cm soil.
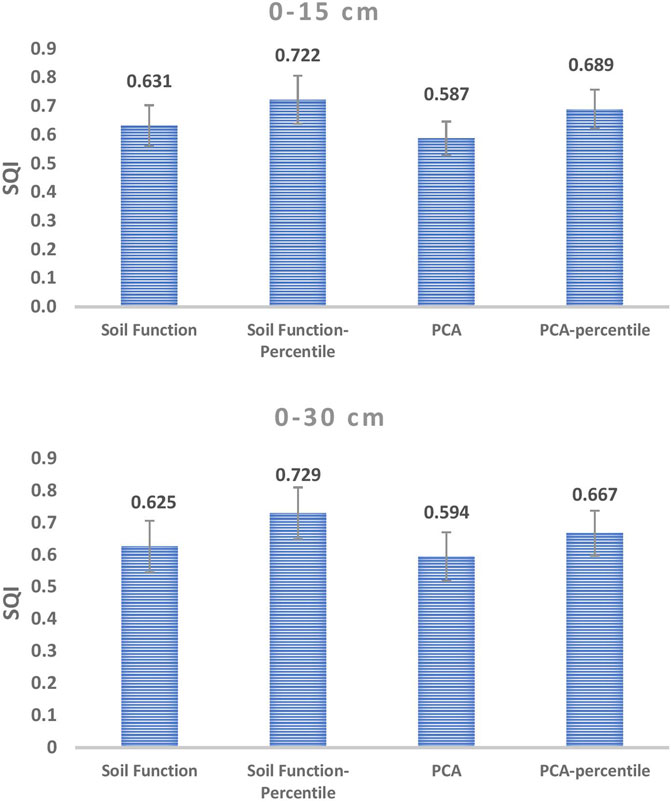
FIGURE 1. Soil quality index (SQI) of 0–15 cm and 0–30 cm soil under four indexing procedures (n = 156). Error bars indicate standard deviation.
3.5 Regression of SQI With Crop Yield
The SQI computed using the four methods was correlated with rice and wheat yield (Figure 2; Supplementary Figure S3). In all cases, the correlation was significant between SQI and crop yield at p < 0.05. In both the crops and in both the computing methods (PCA and SF), the correlation (r2) values were higher in the percentile technique. Furthermore, for any data transformation technique, the r2 values were higher in the SF than in the PCA method. The SQI correlated better with rice yield (Figure 2) than with wheat yield (Supplementary Figure S3). For any crop and indexing method, the correlation between SQI and yield was better when the SQI was computed using soil data from 0 to 15 cm soil depth than that from 0 to 30 cm soil data. For instance, the r2 value between SQI and rice yield in the PCA method was 0.47 when the SQI was computed using the 0–15 cm soil data (Figure 2). However, a lower correlation (r2 = 0.39) was observed when the soil data of 0–30 cm (average of 0–15 and 15–30 cm depths) were used (Figure 2).
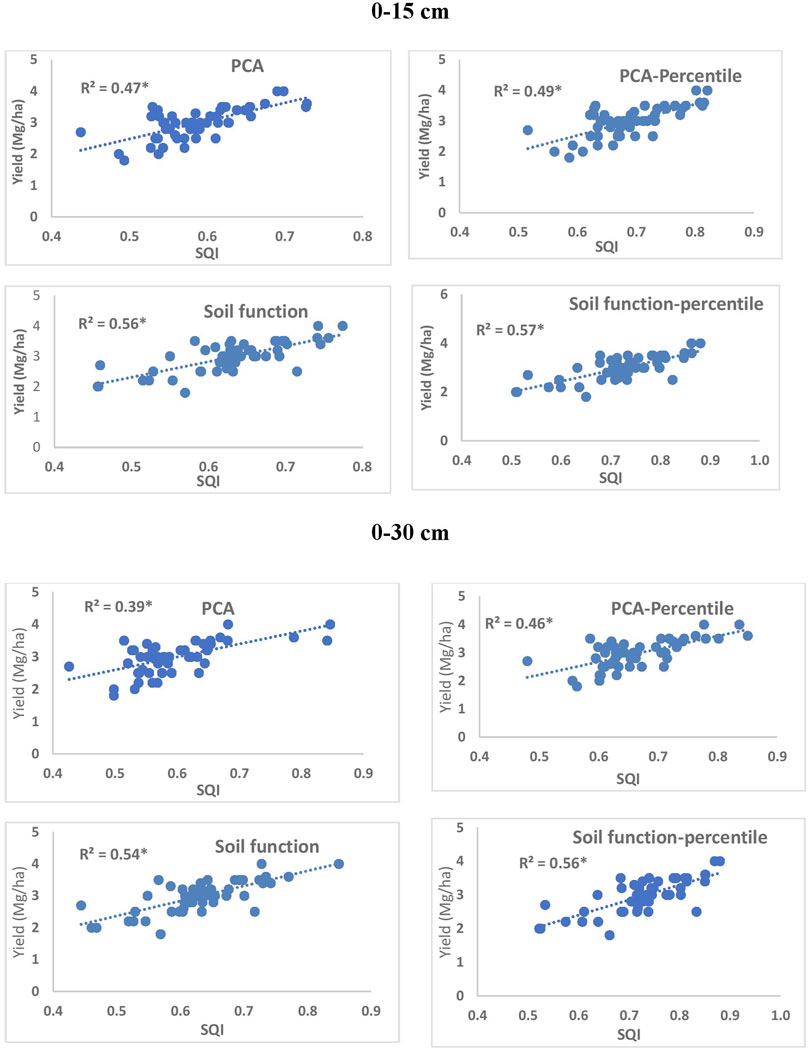
FIGURE 2. Correlation of soil quality index (SQI) derived from the soil data of 0–15 cm and 0–30 cm with rice yield under the four different indexing methods (n = 52).
4 Discussion
4.1 Method for Selection of Indicators: PCA vs. SF (Expert Opinion) Approach
Our results showed that the soil function–based approach (based on expert opinion and representing the major soil functions) resulted in a better correlation of SQI with yields of both the test crops (rice and wheat), thus indicating the first hypothesis set in this study. We termed it the “soil function–based method” in place of “expert opinion” to highlight the role of soil functions in deciding the management goal. One of the reasons for higher correlation under the SF-based approach was the inclusion of representative variables in the MDS covering physical, chemical, and biological parameters. The indicators chosen under the SF-based approach covered the four major soil functions, viz., soil structure and water storage, nutrient supply, soil biological activity, and the basic soil properties limiting production (Table 1). Also under these broad soil functions, key parameters were considered as per expert opinion. On the contrary, nine indicators were part of the MDS in the PCA method where only single parameters were covered under physical (BD) and biological (soil respiration) properties. Similar to our study, Gelaw et al. (2015) included SOC, water stable aggregation, total porosity, total N, microbial biomass carbon, and CEC as the parameters covering four soil functions, viz., 1) accommodating water entry, 2) facilitating water movement and availability, 3) resisting degradation, and 4) supplying nutrients for plant growth and estimating SQI using a soil management assessment framework for four land uses in smallholder farm situations in Ethiopia. Such an approach based on soil functions was also attempted by Fernandes et al. (2011) for soil quality evaluation under different tillage practices in Brazil. Amorim et al. (2020) took seven soil quality indicators and evaluated the effect of long-term conservation cropping on soil quality using a linear scoring technique. On a regional scale similar to our study, Vasu et al. (2016) reported the SQI computed by the expert opinion method to be better correlated with crop yield than PCA one.
4.2 Data Transformation Procedure
As expected, the percentile method of data transformation showed a higher correlation in both the test crops (Figure 2; Supplementary Figure S3) and in both the SF and PCA methods than the routinely followed method, thus conforming to the second hypothesis. Most studies on the SQI have used linear scoring techniques for data transformation to unitless scores (Andrews et al., 2004; Masto et al., 2007; Mukherjee and Lal, 2014; Klimkowicz-Pawlas et al., 2019; Amorim et al., 2020). The routinely followed procedure has been to divide the parameter value by the highest parameter value of the dataset (maximum) in the “more is better” type of indicator, such as SOC. In the “less is better” type of indicator such as BD, the lowest value (minimum) is used as the numerator and the parameter value as the denominator. However, as previously explained, this procedure is beset with a good chance of error when we go for SQI assessment on a regional scale, as few outlier values of maxima or minima in the entire dataset can alter the score of the individual parameters. Thus, the approach of taking the 90th percentile value as the maximum and the 10th percentile value as the minimum for data transformation as designed in this study is the first of its kind in the SQ assessment research. The higher weighted scores (Supplementary Figures S1, S2) and higher SQI values (Figure 1) in the percentile method resulted from minimization of error and reduction of chance of extremity, otherwise caused when a maximum or minimum value is used. Therefore, the percentile method is more suitable to broad-base the utility of SQI in regional-scale soil quality assessment and defining management goals.
4.3 Role of Soil Sampling Depth in SQI Computation
This study compared the SQI computed from 0 to 15 cm soil data with that computed from mean data of 0–15 cm and 15–30 cm (0–30 cm) soil data. The results showed the former better correlated with crop yield than the latter (Figure 2; Supplementary Figure S3), which was against our set hypothesis. The range (minimum to maximum) of SQI values was higher in the 0–30 cm soil dataset (Supplementary Table S5) due to masking of extreme values in either depth during averaging of parameter values. The average SQI values of both the datasets (0–15 cm and 0–30 cm) were similar (Figure 1). This indicates crop yield is more regulated by the parameters of the surface soil layer. Our findings conform to those of Amorim et al. (2020). The SQI values of the surface layer are expected to be higher than those of the 15–30 cm soil layer, primarily due to better SOC and associated physical and fertility parameters such as lower BD, better aggregation, and higher nutrient availability in the surface layer. The surface soil layer or the plow layer is the dynamic layer primarily contributing to plant nutrition. In their study, Amorim et al. (2020) reported soil quality at 0–15 and 15–30 cm soil depths corresponding to 74.7 and 64% of their potential, respectively. A similar observation was also made by Karlen et al. (2013) from a study in Central Iowa, United States, showing near-surface soil functioning at 82–85% of potential and at a lower capacity at lower depths. Thus, when the SQI is computed from the data averaged over soil depth (in this case, an average of 0–15 and 15–30 cm soil data), the correlation between SQI and crop yield was lower. However, our findings are in contrast to the reports of Vasu et al. (2016), where the SQI from 0 to 100 cm soil data provided better correlation than the SQI computed from the 0 to 15 cm soil layer. Such different trends might be possible due to a semiarid climate and rainfed situation in their study region, where root growth might be deeper, and thus, deeper layer soil conditions regulate the crop growth. On the contrary, our study was undertaken in an alluvial soil characterized by highly intensive cropping, heavy chemical fertilizer application, and provision of good irrigation, which might have restricted the root growth zone to upper layers of soil.
Conclusion
The utility of soil quality indexing as a tool for soil health monitoring and to evaluate land management practices needs to go beyond the farm plots and experimental fields to a broader regional scale. This study provided a new approach for data transformation when the SQI is used on a regional scale. As suggested in this study, the percentile method for data transformation proved better in terms of correlation with yields of rice and wheat crops. Secondly, the dataset of 0–15 cm soil depth can provide optimum information for routine soil quality monitoring, which thus can save resources by avoiding sampling from deeper soil layers. Thirdly, the superiority of the soil function–based approach over PCA implied that an agro-ecological region–specific minimum dataset could be formed for long-term soil health monitoring on a regional or country scale to maintain optimum soil productivity.
Data Availability Statement
The original contributions presented in the study are included in the article/Supplementary Material, further inquiries can be directed to the corresponding author.
Author Contributions
NL and SL conceived the study. BM carried out the sampling. NL, AK, SL, and AS carried out the laboratory analysis and data analysis. NL and RL prepared the manuscript. All authors checked and approved the manuscript.
Funding
This research was funded by a competitive extramural research grant from the Science and Engineering Research Board (SERB) under the Department of Science and Technology, Government of India, vide Grant No. EMR/2017/005542.
Conflict of Interest
The authors declare that the research was conducted in the absence of any commercial or financial relationships that could be construed as a potential conflict of interest.
Publisher’s Note
All claims expressed in this article are solely those of the authors and do not necessarily represent those of their affiliated organizations, or those of the publisher, the editors, and the reviewers. Any product that may be evaluated in this article, or claim that may be made by its manufacturer, is not guaranteed or endorsed by the publisher.
Acknowledgments
The cooperation by farmers of the study region in providing crop and nutrient management information and soil samples is duly acknowledged.
Supplementary Material
The Supplementary Material for this article can be found online at: https://www.frontiersin.org/articles/10.3389/fenvs.2022.865473/full#supplementary-material
Supplementary Figure S1 | (A) Parameter weights as derived from the PCA output and the weighted scores of parameters under (B) routinely followed and (C) percentile methods of data transformation in the PCA method.
Supplementary Figure S2 | (A) Parameter weights and the weighted scores of parameters under (B) routinely followed and (C) percentile methods of data transformation in the soil function (SF) method.
Supplementary Figure S3 | Correlation of soil quality index (SQI) derived from the soil data of 0–15 cm and 0–30 cm with wheat yield under the four different indexing methods (n = 52).
References
Abdollahi, L., Hansen, E. M., Rickson, R. J., and Munkholm, L. J. (2015). Overall Assessment of Soil Quality on Humid Sandy Loams: Effects of Location, Rotation and Tillage. Soil Tillage Res. 145, 29–36. doi:10.1016/j.still.2014.08.009
Amorim, H. C. S., Ashworth, A. J., Wienhold, B. J., Savin, M. C., Allen, F. L., Arnold, M., et al. (2020). Soil Quality Indices Based on Long-Term Conservation Cropping Systems Management. Agrosystems, Geosciences Environ. 3, e20036. doi:10.1002/agg2.20036
Andrews, S. S., Karlen, D. L., and Cambardella, C. A. (2004). The Soil Management Assessment Framework: A Quantitative Soil Quality Evaluation Method. Soil Sci. Soc. Am. J. 68, 1945–1962. doi:10.2136/sssaj2004.1945
Andrews, S. S., Karlen, D. L., and Mitchell, J. P. (2002). A Comparison of Soil Quality Indexing Methods for Vegetable Production Systems in Northern California. Agric. Ecosyst. Environ. 90, 25–45. doi:10.1016/s0167-8809(01)00174-8
Çelik, İ., Günal, H., Acir, N., Barut, Z. B., and Budak, M. (2021). Soil Quality Assessment to Compare Tillage Systems in Cukurova Plain, Turkey. Soil Tillage Res. 208, 104892. doi:10.1016/j.still.2020.104892
Fernandes, J. C., Gamero, C. A., Rodrigues, J. G. L., and Mirás-Avalos, J. M. (2011). Determination of the Quality Index of a Paleudult under Sunflower Culture and Different Management Systems. Soil Tillage Res. 112, 167–174. doi:10.1016/j.still.2011.01.001
Fertilizer Association of India (2017). Fertilizer and Agriculture Statistics – Northern Region. New Delhi: FAI House.
Gelaw, A., Singh, B., and Lal, R. (2015). Soil Quality Indices for Evaluating Smallholder Agricultural Land Uses in Northern Ethiopia. Sustainability 7, 2322–2337. doi:10.3390/su7032322
Haney, R. L., Haney, E. B., Smith, D. R., Harmel, R. D., and White, M. J. (2018). The Soil Health Tool-Theory and Initial Broad-Scale Application. Appl. Soil Ecol. 125, 162–168. doi:10.1016/j.apsoil.2017.07.035
Janků, J., Kosánová, M., Kozák, J., Herza, T., Jehlička, J., Maitah, M., et al. (2022). Using of Soil Quality Indicators to Assess Their Production and Ecological Functions. Soil Water Res. 17, 45–58. doi:10.17221/146/2021-SWR
Karlen, D. L., Cambardella, C. A., Kovar, J. L., and Colvin, T. S. (2013). Soil Quality Response to Long-Term Tillage and Crop Rotation Practices. Soil Tillage Res. 133, 54–64. doi:10.1016/j.still.2013.05.013
Klimkowicz-Pawlas, A., Ukalska-Jaruga, A., and Smreczak, B. (2019). Soil Quality Index for Agricultural Areas under Different Levels of Anthropopressure. Int. Agrophys. 33, 455–462. doi:10.31545/intagr/113349
Lenka, N. K., Mandal, D., and Sudhishri, S. (2014). Permissible Soil Loss Limits for Different Physiographic Regions of West Bengal. Curr. Sci. 107, 665–670.
Lenka, N. K., Thakur, J. K., and Lenka, S. (2019). Soil Health Analysis. New Delhi: New India Publication Agency, 112.
Masto, R. E., Chhonkar, P. K., Singh, D., and Patra, A. K. (2007). Soil Quality Response to Long-Term Nutrient and Crop Management on a Semi-Arid Inceptisol. Agric. Ecosyst. Environ. 118, 130–142. doi:10.1016/j.agee.2006.05.008
Mukherjee, A., and Lal, R. (2014). Comparison of Soil Quality Index Using Three Methods. PLoS ONE 9 (8), e105981. doi:10.1371/journal.pone.0105981
Nakajima, T., Lal, R., and Jiang, S. (2015). Soil Quality Index of a Crosby Silt Loam in Central Ohio. Soil Tillage Res. 146, 323–328. doi:10.1016/j.still.2014.10.001
Shah, F., and Wu, W. (2019). Soil and Crop Management Strategies to Ensure Higher Crop Productivity within Sustainable Environments. Sustainability 11, 1485. doi:10.3390/su11051485
Sharma, K. L., Mandal, U. K., Srinivas, K., Vittal, K. P. R., Mandal, B., Grace, J. K., et al. (2005). Long-Term Soil Management Effects on Crop Yields and Soil Quality in a Dryland Alfisol. Soil Tillage Res. 83, 246–259. doi:10.1016/j.still.2004.08.002
Soil Survey Staff (2014). Keys to Soil Taxonomy. 12th ed. Washington, DC, USA: USDA-Natural Resources Conservation Service.
Stott, D. E., Cambardella, C. A., Tomer, M. D., Karlen, D. L., and Wolf, R. (2011). A Soil Quality Assessment within the Iowa River South Fork Watershed. Soil Sci. Soc. Am. J. 75, 2271–2282. doi:10.2136/sssaj2010.0440
Subba Rao, A., and Lenka, N. K. (2020). Developments on Soil Health Management in India as Mirrored through Sustained Researches and Policy Interventions. Indian J. Fert. 16, 1230–1242.
Vasu, D., Singh, S. K., Ray, S. K., Duraisami, V. P., Tiwary, P., Chandran, P., et al. (2016). Soil Quality Index (SQI) as a Tool to Evaluate Crop Productivity in Semi-Arid Deccan Plateau, India. Geoderma 282, 70–79. doi:10.1016/j.geoderma.2016.07.010
Vasu, D., Tiwari, G., Sahoo, S., Dash, B., Jangir, A., Sharma, R. P., et al. (2021). A Minimum Data Set of Soil Morphological Properties for Quantifying Soil Quality in Coastal Agroecosystems. Catena 198, 105042. doi:10.1016/j.catena.2020.105042
Wienhold, B. J., Karlen, D. L., Andrews, S. S., and Stott, D. E. (2009). Protocol for Indicator Scoring in the Soil Management Assessment Framework (SMAF). Renew. Agric. Food Syst. 24, 260–266. doi:10.1017/s1742170509990093
Wilding, L. P. (1985). “Spatial Variability: its Documentation, Accommodation, and Implication to Soil Surveys,” in Soil Spatial Variability. Editors D.R. Nielsen, and J. Bouma (Netherlands: Wageningen).
Keywords: soil quality index, soil management assessment framework, soil productivity, soil ecosystem services (ES), quantification of soil functions, soil capital, regenerative agriculture
Citation: Lenka NK, Meena BP, Lal R, Khandagle A, Lenka S and Shirale AO (2022) Comparing Four Indexing Approaches to Define Soil Quality in an Intensively Cropped Region of Northern India. Front. Environ. Sci. 10:865473. doi: 10.3389/fenvs.2022.865473
Received: 29 January 2022; Accepted: 07 March 2022;
Published: 31 March 2022.
Edited by:
Jörg Luster, Swiss Federal Institute for Forest, Snow and Landscape Research (WSL), SwitzerlandReviewed by:
Ruhollah Taghizadeh, University of Tübingen, GermanyMojtaba Zeraatpisheh, Henan University, China
Agnieszka Klimkowicz-Pawlas, Institute of Soil Science and Plant Cultivation, Poland
Copyright © 2022 Lenka, Meena, Lal, Khandagle, Lenka and Shirale. This is an open-access article distributed under the terms of the Creative Commons Attribution License (CC BY). The use, distribution or reproduction in other forums is permitted, provided the original author(s) and the copyright owner(s) are credited and that the original publication in this journal is cited, in accordance with accepted academic practice. No use, distribution or reproduction is permitted which does not comply with these terms.
*Correspondence: Narendra Kumar Lenka, bmtsZW5rYTc0QGdtYWlsLmNvbQ==; Sangeeta Lenka, c2FuZ2VldGFfMkByZWRpZmZtYWlsLmNvbQ==