 Luca Salerno1*
 Álvaro Moreno-Martínez2
 Emma Izquierdo-Verdiguier3Nicholas Clinton4
 Annunziato Siviglia5
 Carlo Camporeale1
- 1Department of Environment, Land and Infrastructure Engineering, Politecnico di Torino, Turin, Italy
- 2Image Processing Laboratory (IPL), Universitat de València, València, Spain
- 3Institute of Geomatics, University of Natural Resources and Life Science (BOKU), Wien, Austria
- 4Google, Inc., Mountain View, CA, United States
- 5Department of Civil, Environmental and Mechanical Engineering, Università degli studi di Trento, Trento, Italy
An assessment of river regulation impact on floodplain vegetation is crucial to developing a modern watershed management approach in the Neotropics aimed at mitigating alterations of the floodplain environment. Floodplain forest monitoring requires high–resolution mapping, as vegetation dynamics are in the narrow area at the interface between terrestrial and aquatic systems. The existing satellite images that afford land observations have limitations due to coarse resolution or gaps in data caused by the extreme cloudiness of tropical regions. This study provides a new framework for high-resolution mapping and monitoring of a large-scale tropical forest in the aquatic-terrestrial zone of an Amazon basin. The main aim is to assess the vegetation status and the environmental degradation in a highly altered fluvial setting. To achieve the goal, a remote sensing processing chain, which couples hydrologic and vegetation data, was developed. A map of high-resolution traditional vegetation indices and their non-linear generalization was derived from the high-resolution gap-free reflectance data obtained by combining Landsat and MODIS data, through the HISTARFM algorithm. Subsequently, hydrological modification within these areas was assessed by using a global water surface dataset. In addition, the impact of river regulation on riverine forest carbon cycling was assessed through the analysis of interannual variability of the gross primary production of floodplain vegetation. The framework was applied to analyze the last 2 decades of changes in the floodplain forest of Uatum
1 Introduction
Floodplain forests represent about 14% of the Amazon Basin area (Flores et al., 2017) and are highly productive riverside areas, heavily influenced by both terrestrial and fluvial dynamics (Junk et al., 1989). The seasonal pattern of precipitation over the Amazon catchments drives a predictable mono-modal annual flood pulse in the unaltered large rivers (Junk et al., 1989; Schöngart and Junk, 2007; Junk et al., 2014).
The natural annual cycle of rising, high, and low water levels, has a strong impact on floodplain forest dynamics acting as a filter that selects a wide variety of flood-adapted species tolerating up to 6–8 months with flooding and up to 10 m of water depth (Junk et al., 1989; Junk, 1997; Lewis et al., 2000; Wittmann et al., 2004; Wittmann et al., 2010). Moreover, the tree endemic species that populate the different topographic levels of floodplains, synchronize their phenology with periodic flood events, water levels, and sedimentation cycles (Worbes, 1997; Junk, 1997; Ferreira et al., 2010; Parolin and Wittmann, 2010; da Rocha et al., 2019).
These complex interactions between water and vegetation life-cycle make the floodplain forests extremely sensitive to hydrological changes due to anthropogenic and natural disturbances. Any kind of alterations in the original hydro-geological drivers can represent a strong stress for riparian species. Long-term negative environmental consequences range from forest degradation, changes in the floristic composition, and reduction of biodiversity, up to the ecological regime shifts in the worst cases (Tockner et al., 2010). Among the anthropic alterations of the riverine environment, the modifications of flood pulse due to hydropower dams may be particularly severe. Many studies have unraveled the impacts of hydroelectric dams (Kahn et al., 2014; Almeida et al., 2019; Kuriqi et al., 2021), highlighting the social, economic and environmental negative repercussions (Nilsson and Berggren, 2000; Fearnside, 2002; Poff and Hart, 2002; Fearnside and Pueyo, 2012; Fearnside, 2014; Castello and Macedo, 2016; Assahira et al., 2017; Cochrane et al., 2017; Timpe and Kaplan, 2017; Agostinho et al., 2018). Furthermore, the consequences of large damming are not only limited nearby the infrastructure, but also affect floodplains downstream and the estuarine environment at large scales (Andersson et al., 2000; Merritt and Wohl, 2006; Tealdi et al., 2011; Castello and Macedo, 2016; Latrubesse et al., 2017). The Amazon basin has a very large number of existing dams 151) with 358 dams planned and under-construction (Zarfl et al., 2015); this makes the amazonian floodplains one of the most threatened ecosystems in the world (Kahn et al., 2014; Lees et al., 2016; de Resende et al., 2020).
The hydroelectric damming may alter the natural flood pulse and disrupt river connectivity (Grill et al., 2019), with serious repercussions on floodplain vegetation (de Resende et al., 2019; da Rocha et al., 2019; Assahira et al., 2017). da Rocha et al. (2019) found that in areas with a drastic reduction of flooding, upland forest species started competing with endemic species by encroaching the floodplains, while in the areas with extreme prolonged flooding the establishment of any species was impeded. Recent studies (Assahira et al., 2017; de Resende et al., 2019) on a regulated river of the Amazonas state (Uatum
Moreover, dams reduce sediment supply causing the rearrangement of the river planform (e.g. reduction of lateral migration (Constantine et al., 2014), channel degradation), inhibiting the rejuvenation process of the riparian vegetation (Camporeale et al., 2013; Vesipa et al., 2017) and promoting vegetation encroachment.
The modification of vegetation species composition, not only jeopardizes several environmental services (de Sousa Lobo et al., 2019), but also may impact the floodplain carbon cycle. In the upper areas of the floodplain, the accumulation of dead biomass is likely to increase the greenhouse gas emissions of these areas. Root mats and litter matter, no longer recruited by floods and bank erosion, remain and increase the vulnerability of areas to fire during droughts (De Almeida et al., 2016; Flores et al., 2017; de Resende et al., 2019).
Moreover, the encroachment of species from the upland forest and the decay of the poorly flood-tolerant species in topographically depressed regions of the floodplain (de Resende et al., 2019; Schöngart et al., 2021) cause a change in gross primary production (GPP) of such areas. These additional impacts on the global carbon cycle, caused by dams, require further investigations and should be added to the budget of known greenhouse gases emissions produced by anaerobic biomass degradation in reservoirs (Kemenes et al., 2011; Deemer et al., 2016; Prairie et al., 2018; Calamita et al., 2021), in order to better assess the carbon footprint of river regulation in the Neotropics.
Although the threats that the large dams represent for the tropical floodplain forest are well known in the literature (Latrubesse et al., 2017), the long-term consequences and the extent of environmental alteration remain only partially understood (Fearnside, 2016). The poor accessibility of tropical floodplains makes field monitoring and measurement campaigns very expensive, challenging and limited to a few spots. In contrast, to better understand and predict the evolution shift of the ecological regime of floodplain forests, an extensive assessment of vegetation is needed. It is crucial to understand if the whole ecosystem resilience is enough for assuring an adaptation to the hydrological changes (Shilpakar et al., 2021) or whether environmental degradation and catastrophic and irreversible shift of the ecosystems are unavoidable (Tockner et al., 2010; Shilpakar et al., 2021). In particular, as the main vegetation dynamics occur in a narrow area, at the interface between terrestrial and aquatic systems, a high spatial and temporal resolution of the data is needed for their analysis.
Remote sensing offers practical and efficient techniques to estimate biochemical and biophysical parameters and to analyze their evolution over time, even for very remote, wide and poorly accessible areas such as tropical floodplains. Although the vegetation index analysis is widely used in floodplain forest monitoring of temperate regions (Sims and Colloff, 2012; Lafage et al., 2014; Nallaperuma and Asaeda, 2020), it is poorly explored in tropical areas where the extreme cloudiness and presence of aerosols do not allow to obtain historical series with adequate spatial and temporal resolution. According to Kobayashi and Dye (2005), the normalized difference vegetation index (NDVI) data from the Advanced Very High–Resolution Radiometer (AVHRR) over the amazonian region show a seasonality mostly caused by variations in atmospheric conditions associated with biomass-burning aerosols and cloudiness. Furthermore, the coarse resolution of NDVI by AVHRR, makes it useless for the analysis of riparian forests. The present study aims to evaluate the impact of dam regulation on floodplain vegetation through a high-resolution satellite-based operative framework. More specifically, we couple temporal evolution analysis of vegetation indices and gross primary production with hydrological transitions data, in order to disentangle the role of river regulation on the floodplain forest alteration. The developed framework was applied to the floodplain of the Uatum
2 Material and Methods
Through a remote sensing analysis of satellite data developed on the free-access cloud computing platform Google Earth Engine (GEE) (Gorelick et al., 2017), we have combined forest changes detection with an analysis of the hydrological transitions and the assessment of the annual GPP, in order to assess the impact of dam alteration on floodplain environment in the last 2 decades (2001–2019).
2.1 Study Area
The developed framework was applied to the floodplain of the Uatum
River discharges and water stages have been highly affected by the Balbina hydro-power dam, wich was built between 1983 and 1987. The formation of a vast reservoir, upstream the dam, induced the rapid decay of almost 3,000 km2 submerged forest and the formation of more than 3,500 isolated islands (Benchimol and Peres, 2015; Schöngart et al., 2021). Downstream of the dam, the discharge regulation enforced by the hydropower plant management caused alterations in the hydrological cycle, with several consequences on vegetation, that are not completely understood yet (Fearnside, 1989; de Resende et al., 2019; de Resende et al., 2020).
An increase in the floodplain tree mortality for certain species was documented as early as the first flow regulation during dam construction (1983–1987), with a peak in the first decade of dam operations (1994–1997) (Schöngart et al., 2021). The study region (∼3,000 km2) comprises the Uatum
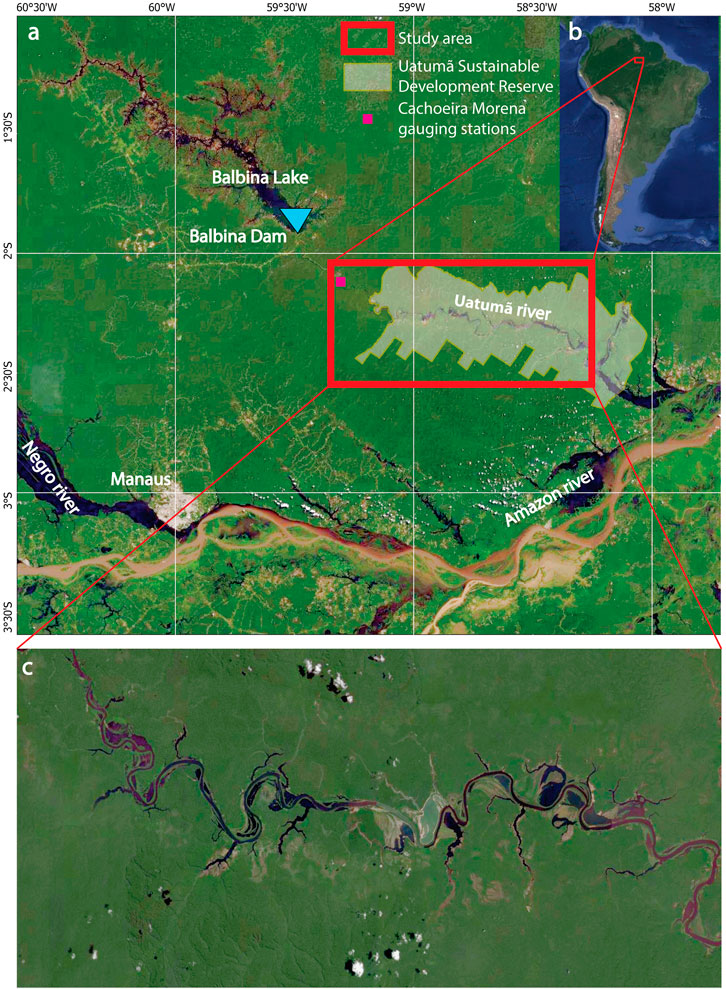
FIGURE 1. Map of study region. (A) Uatum
According to the analysis by Assahira et al. (2017), the time series of the unique gauge station that is present downstream of the dam (Cachoeira da Morena, Figure 2), shows that the uninomodal flood pulse pattern—very common in the Amazon basin and characteristic of the Uatum
2.2 Satellite Data
Since the vegetation affected by river dynamics populates a narrow area at the interface between the terrestrial and aquatic system, high spatial resolution data are necessary for mapping and monitoring. Landsat-like optical data at 30 m spatial resolution are suitable for the detection of specific changes in land cover. Nevertheless, the extreme cloudiness of the Neotropics adversely affects the optical satellite land surface observations.
To obtain gap-filled high spatial resolution reflectance data, Landsat surface reflectance data with a temporal resolution of 16 days and 30 m spatial resolution, and daily MODIS acquisitions at 500 m were combined by the HISTARFM algorithm. The algorithm was implemented by Moreno-Martínez et al. (2020) on the GEE cloud computing platform. HISTARFM filters out random noise and reduces the bias of Landsat spectral reflectances based on Bayesian estimations and Kalman filter. The former estimates the Landsat reflectance values for a given time by combining historical Landsat time series and MODIS and Landsat fused values. The latter corrects the bias of the reflectance product by the previous estimation (for further information, see Moreno-Martínez et al. (2020)).
In this way, gap-filled reflectance data (GFHR) at 30 m spatial resolution was generated from 2001 to 2019 over the whole study area. Then, the high–resolution products of the normalized difference vegetation index (NDVI), its nonlinear version (kNDVI), and the enhanced vegetation index (EVI), were derived from the GFHR data. The indices NDVI and EVI have been widely and commonly adopted in satellite-based vegetation monitoring. In particular, NDVI has been considered an indicator of photosynthetic activity (Weier and Herring, 2000) whereas the EVI is optimized for high biomass regions and mainly focuses on the canopy structure and is less sensitive to atmospheric alterations (Huete et al., 2002). The kNDVI has been recently proposed as a novel alternative to NDVI that improves the performance with respect to saturation, bias, and complex phenological cycles (Camps-Valls et al., 2021). Formal spectral definitions of the three indices are reported in the Supplementary Material.
2.3 Data Masking
A mask for the water bodies was generated to exclude from the analysis the areas perennially flooded and to avoid misclassification in vegetation changes. The Modified Normalized Difference Water Index (MNDWI) calculated from the GFHR temporal series was used in an unsupervised classification approach, consisting of the Canny edge filter and the Otsu thresholding (Donchyts et al., 2016) in order to obtain the optimum threshold.
Monthly water surface maps between 2001 and 2019 were obtained through the classification of GFHR data. The pixel probability of water presence was obtained for all the pixels of GFHR temporal series. The probability was calculated by dividing the number of water occurrences in the temporal series by the total number of years. Pixels with a water probability value higher than 0.8 (i.e. 80%) were excluded from the vegetation change detection. Further details on the identification of areas with vegetation loss or gain are provided in the Supplementary Presentation (section Identification of Regions of Interest).
2.4 Vegetation Change Detection
The time series of each index was analyzed separately, through a set of segmentation algorithms (LandTrendR, see Kennedy et al. (2018)). The algorithms aim to identify breakpoints in the time series separating periods of durable changes or stability in temporal evolution of the vegetation index. The results of segmentation provide a simplified representation of index history of a pixel as segment lines whose vertex are the breakpoints, identified by year and spectral index value (details are reported in Kennedy et al. (2018) and are recalled in Supplementary Figure S1 of the Supplementary Material). Since the algorithms require that the input collection must include only one observation per year, monthly GFHR-based vegetation maps were used to derive the time series of the median annual vegetation index for each pixel. The segmentation process was set up to exclude vegetation changes with a recovery time of 1 year, which are not consistent with vegetation dynamics and are likely due to noise. Moreover, a maximum number of six segments was imposed to avoid excessive fragmentation of the time series. The possible identified variations were either a loss or a gain of vegetation. These variations were further filtered so that when more than one change of the same type (loss/gain) was detected in the same pixel only the greatest was reported, indicating the year that changes occurred and its magnitude.
2.5 Assessment of the Gross Primary Production (GPP)
To assess the impact of vegetation alteration on the carbon storage of the fluvial corridor, the inter-annual variability of gross primary production was analyzed. The annual GPP was assessed through a Vegetation Photosynthesis Model (VPM) optimized for broad-leaf seasonally moist tropical evergreen forest, proposed by Xiao et al. (2005). The model divides forest canopy into photosynthetically active vegetation and non-photosynthetically active vegetation. GPP is expressed as
where PAR is the photosynthetically active radiation [MJ/m2], FAPAR is the fraction of radiation absorbed by chloroplasts (photosynthetically active part of vegetation), ϵ0 is the maximum light use efficiency [kg C/MJ] and Wf, Tf, Pf are downregulating stress factors of water, temperature and phenology for light use efficiency, respectively. Following Xiao et al. (2005) the FAPAR is approximated as
and the effect of air temperature on the optical energy utilization is
where Tmin, Tmin, Topt are the minimum, maximum and optimal temperature for photosynthesis, respectively. For tropical conditions they are assumed to be equal to 2 , 48 and 28 °C (Xiao et al., 2005).
The water stress factor Wf depends on soil moisture and/or vapor pressure deficit, and has been derived through a simple approach using the Land Surface Water Index (LSWI, see Supplementary Material and Xiao et al. (2004b,a, 2005))
with LSWImax being the maximum LSWI during the growing season for each pixel.
The role of phenological stress factor, accounting for the influence of leaf age on photosynthesis at canopy level, can be neglected as a first approximation (i.e., Pf = 1), since the canopy of evergreen broadleaf tropical forest is composed of green leaves at various ages (Xiao et al., 2005). GPP was assessed at hourly time step and then cumulated in order to obtain annual values. The procedure for the parameter estimation of the VPM model is reported in the Supplementary Material.
2.6 Region of Interest Analysis
The fundamental unit of this analysis was the Region of Interest (ROI, for definition and further detail refer to Supplementary Presentation). Every ROI was analyzed in order to investigate the nature of vegetation change, the impact on GPP, and any alterations of hydrological status (Figure 3). To describe the evolution of a vegetation index within a ROI over the whole considered time period, a series of monthly representative values of the vegetation index was assessed by spatially aggregating the GFHR-based map within the ROI’s domain. Two sub-series were divided—from 2001 to the yC (i.e., the year in which the change occurred) and from yC to 2019—in order to analyze the response of the vegetation to the change itself. To detect a trend in the sub-series, a linear regression analysis of the smoothed data (with a 6-months centered moving average) was performed. The average amplitude of oscillations of both sub-series was defined as the mean of the absolute difference between the original signal and its moving average.
Due to the paucity of hydrologic data to perform a statistically robust analysis of the impacts of the dam on the floodplain, we adopted a remote sensing approach. The hydrological alterations that occurred in Uatum
The effects of the vegetation changes on the carbon cycle were evaluated through the analysis of the annual spatial distribution of GPP. In each ROI, the annual time series of the spatial median (GPPm(t)) and the variance (GPPσ(t)) was calculated and analyzed (see Supplementary Material) in order to detect trends in both parameters.
3 Results
In this section we present the results obtained with each of the three vegetation indices: kNDVI, NDVI and EVI. The results will be shown separately, and hereinafter, they will be reported with a triplet of values, using the same order.
The total area of detected vegetation loss was 53.70, 27.60 and 13.23 km2 (Table 1). The kNDVI was the most sensitive index in vegetation loss detection with area and number of ROIs nearly double and quadruple the one identified by NDVI and EVI (Table 1). The area of vegetation loss common to all the three indices was 11.36 km2 and represents the 86% of EVI-based detected forest loss.
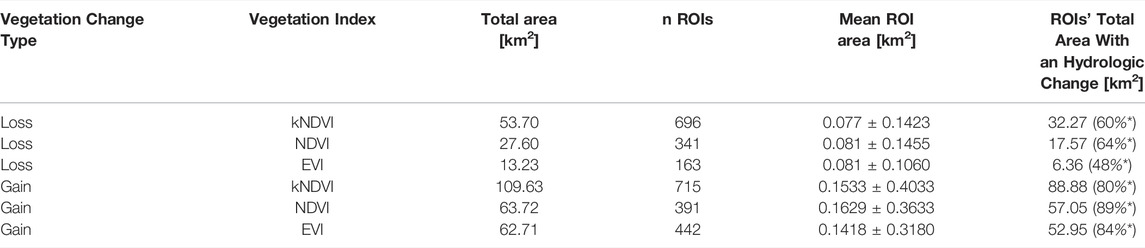
TABLE 1. Spatial extension of loss and gain with the three indices. The asterisk refers to the percentage of ROIs’ total area with a hydrologic change.
3.1 Vegetation Changes
Vegetation loss that occurred during the first decade of the analysis period (2001–2010) accounts for 61, 69, and 69% of the totality, with most of this due to a gradual decreasing of the vegetation index (see Figure 4). During the second decade (2011–2019) the loss was concentrated in the year 2015 (Figure 4). This peak coincides with the occurrence of a severe drought induced by ENSO oscillations (2015–2016) that affected especially the higher elevations of the region. Furthermore, the highest lands are rich in the sandy fraction (Schöngart et al., 2021), implying less water retention. The disappearance of the flooding in those zones, a lowering in the rainfall and in water table increase the severity of drought periods (Parolin and Wittmann, 2010). The distribution of (normalized) change in the vegetation index for the ROIs with a loss is bell-shaped, with the mean, median, and mode values very close to each other (see Figure 5).
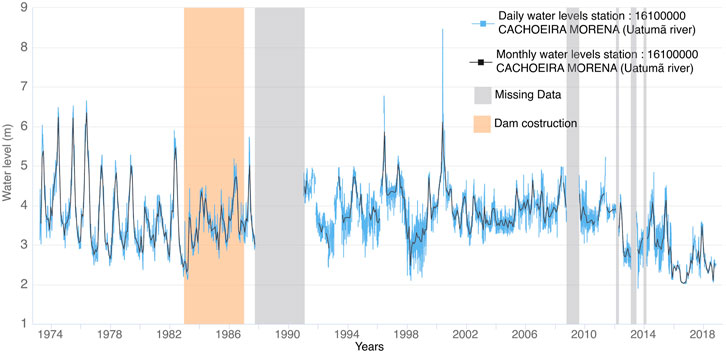
FIGURE 2. Water levels in gauge station Cachoeira Morena.
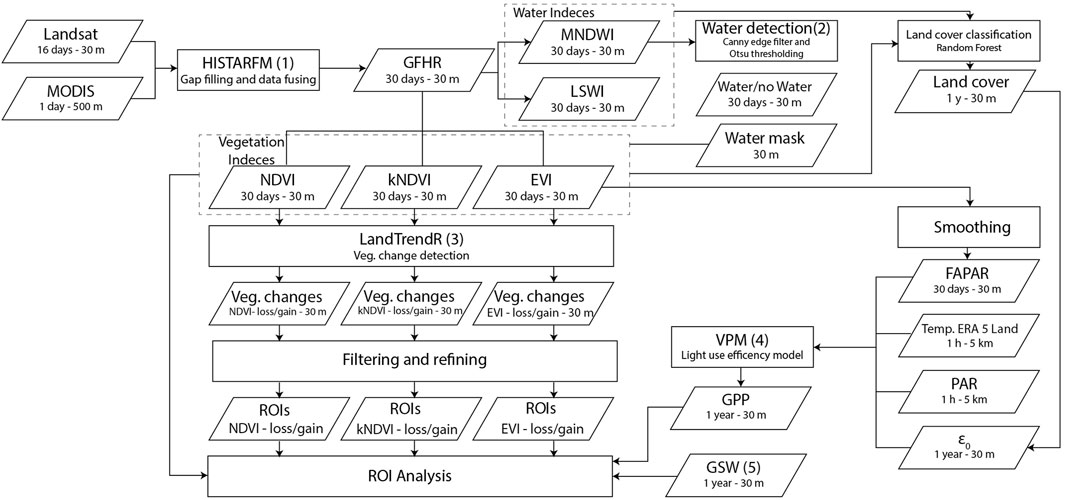
FIGURE 3. Flowchart of the framework used for the vegetation analysis. (1) Moreno-Martínez et al. (2020), (2) Donchyts et al. (2016) (3) Robinson et al. (2017), (4) Xiao et al. (2005), (5) Pekel et al. (2016).
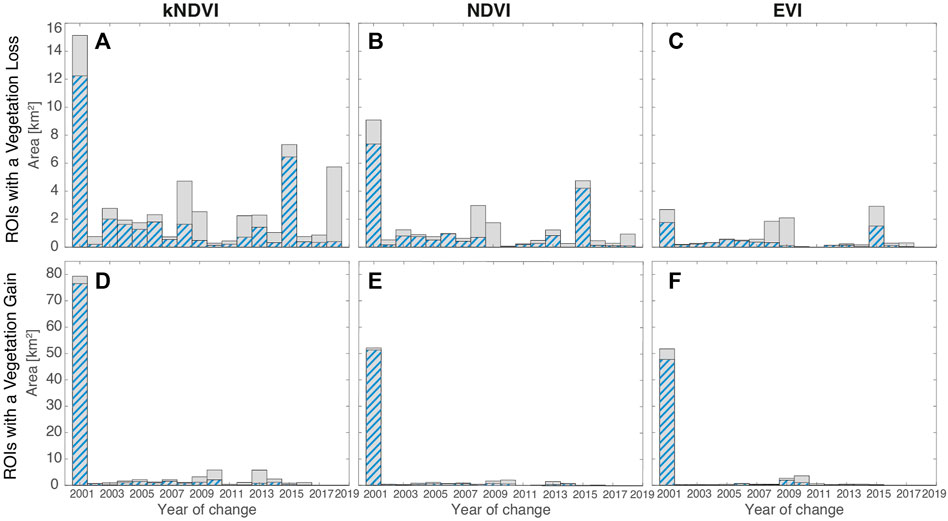
FIGURE 4. Distribution of the year of change. The blue-dashed portion of the distributions refers to the subset of ROIs wherein an hydrological alteration also occurred. (A)–(C) distributions of the year of change for the ROIs with a vegetation loss detected through kNDVI, NDVI and EVI, respectively. (D)–(F) distributions of the year change for the ROIs with a vegetation gain detected through kNDVI, NDVI and EVI respectively. It is conventionally assumed that all changes caused by a monotonous increase or decrease in the vegetation index occurred in the first year of the analysis (yC = 2001).
Concerning the ROIs in the floodplain performing a vegetation gain, they involve a surface much larger than the ROIs with a loss. The interested area of vegetation gain amounts to 109.63, 63.72, 62.71 km2, as detected by kNDVI, NDVI or EVI, respectively (Table 1). The overall area for vegetation gain commonly detected by all the indices is 41.16 km2 (amounting to 65% of the area detected by EVI). The vegetation gain is mainly comprised by gradual monotonous increase in the index (72, 82 and 82% of the overall gain, see Figure 4), and this was due to natural tree growth. It was conventionally assumed that all monotonic increases or decreases in the vegetation index occurred in the first year of analysis (yC = 2001, see Figure 4).
The reduction in the oscillation amplitude occurred after the year of change yC for the majority of the ROIs having a vegetation gain (specifically, 71, 84, 91%, see Figures 6D–F). This suggests a change in the phenology and/or a change in species populating the floodplain in favor of a terrestrialization of the forest community. In contrast, loss of vegetation is markedly associated to an increase in the oscillation amplitude (65, 67, 77%, see Figure 6A–C).
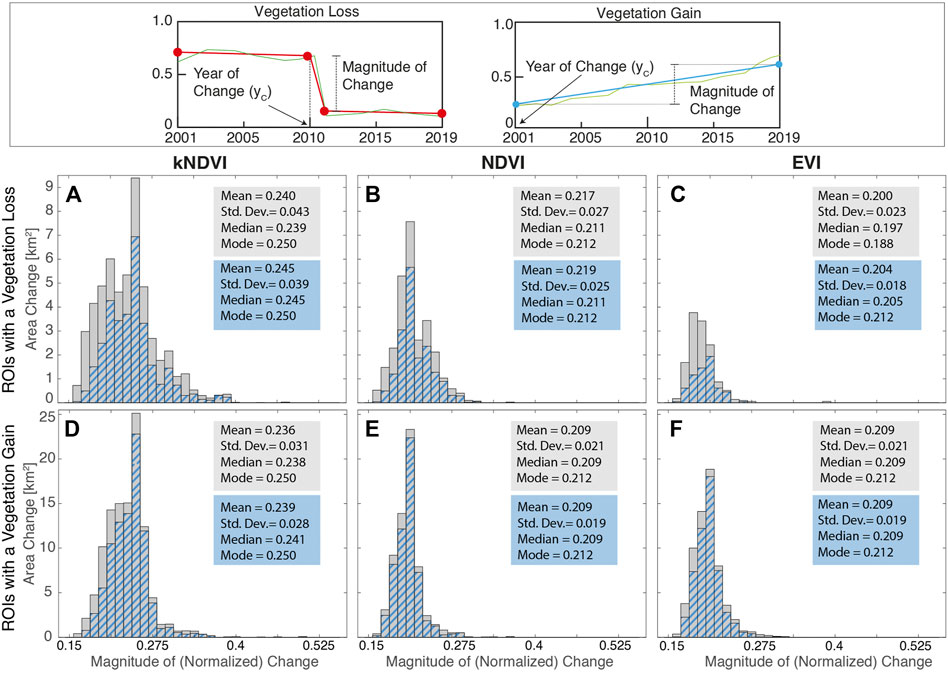
FIGURE 5. Distribution of the (ROI-averaged) magnitude of (normalized) change. The top panel explains how this quantity has been evaluated for a single pixel. Distributions in (A)–(F) refer to spatial mean values of the magnitude within each ROI. The blue-dashed portion of the distributions refers to the subset of ROIs wherein an hydrological alteration also occurred. (A)–(C) refer to the ROIs with a loss whereas (D)–(F) refer to ROIs with a gain. Features of the distributions are reported in the boxes.
The linear regression of the vegetation index time series shows a positive trend, after the change, for more than 95% of ROI with a gain (Figures 7D–F). This indicates that the increase in the index did not stop after the year of the change but is still in progress. On the other hand, for nearly 60% of areas with a vegetation loss, a slight recovery followed after the change (Figures 7A–C). Such trends, along with the increase in the oscillation amplitude are probably due to the growth of grassy-like species. Furthermore, for 40% of ROIs with a vegetation loss the index continued to decline after the year of change, thus suggesting a decay towards an unvegetated condition (Figures 7A–C).
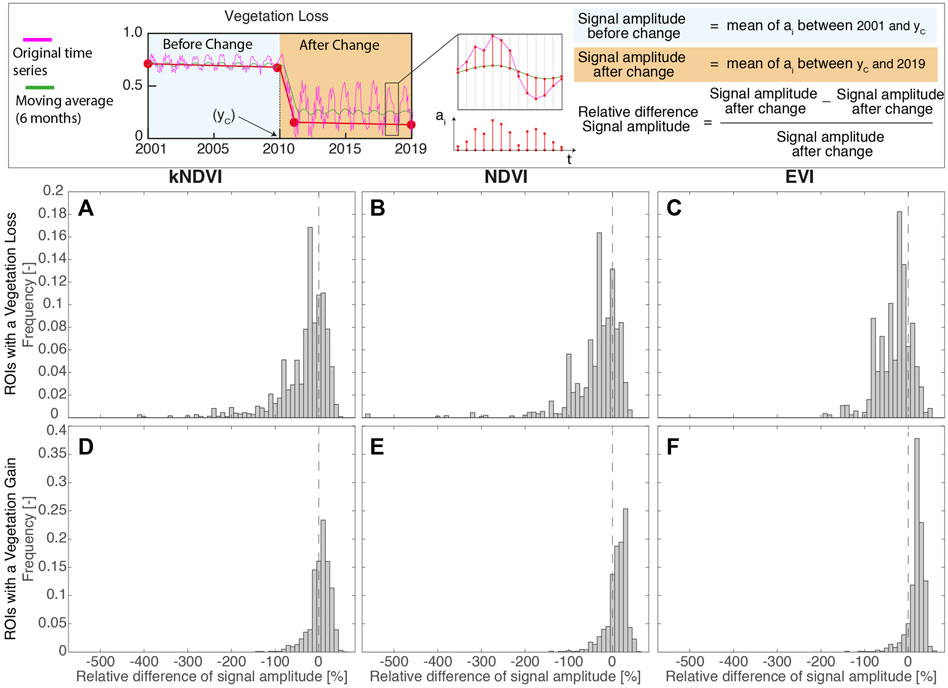
FIGURE 6. Distribution of the (ROI-averaged) relative difference in the amplitude of intra-annual oscillation of the vegetation index, before and after the change within ROIs. The top panel explains how this quantity has been evaluated for a single pixel. (A)–(C) Forest loss (D)–(F) Forest gain.
3.2 Hydrological Changes
The global map of the water surface developed by Pekel et al. (2016) provides precious information about the spatio-temporal distribution of water surface of the last 3 decades, with related statistics. Furthermore, Pekel et al. (2016) developed a map capturing the transitions in the hydrological behavior. More specifically, Pekel et al. (2016) identified eight transition classes of change in seasonality (see definition in the caption of Figure 8) between the three classes of not water, seasonal water, and permanent water (see the original paper for further details about the transition classes). The datasets are annually updated, and the current version (v.1.3) analyzes the global water surface from 1984 to 2020. In the study area of the Uatum
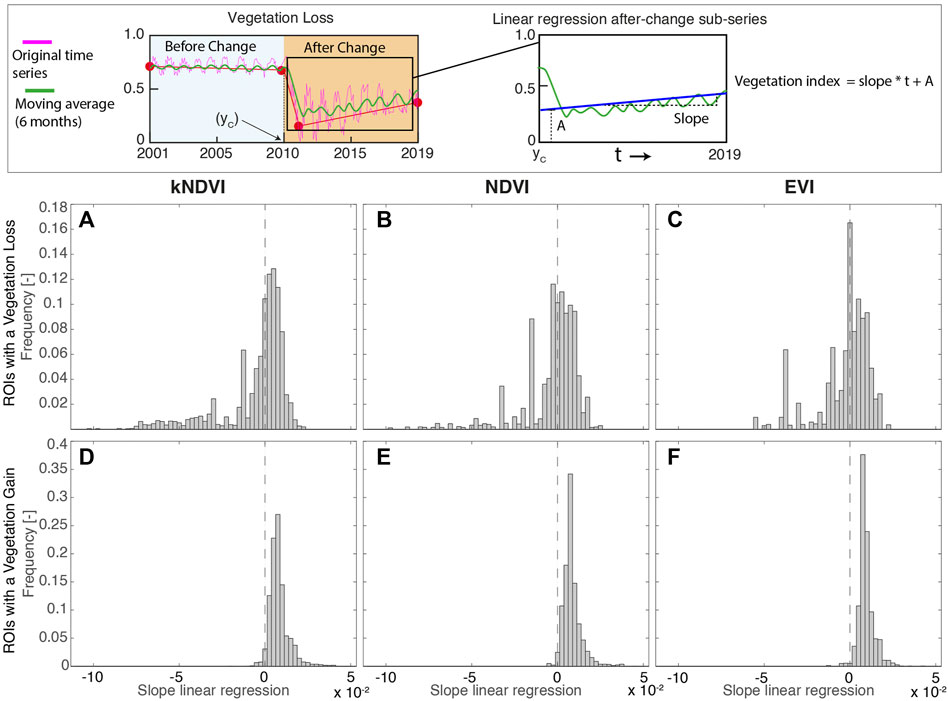
FIGURE 7. Distribution of the (ROI-averaged) slope of the linear regression of the index time series within ROIs after year of change. The top panel explains how this quantity has been evaluated for a single pixel. (A)–(C) Forest loss (D)–(F) Forest gain. The vegetation changes are detected through kNDVI ((A),(D)), NDVI ((B),(E)) and EVI((C),(F)).
3.3 Hydrological Impact on Vegetation
By comparison of water transition maps with the above results, we were able to identify the hydrological transitions that occurred within the ROIs after dam construction. The results show that vegetation loss or gain are affected by different kinds of hydrological alterations (see Supplementary Figure S10). The 60, 64, 48% of loss (Figure 5 and Table 1) occurred in areas interested by river dynamics, namely areas flooded quite regularly. More than half of these areas (53.8, 55.8, 61.5%) consist of land areas in which a seasonal flooding regime has been established after dam construction (Supplementary Figure S9A,C, transition class E). Nearly one-fifth (specifically, 19.8, 14.5, 22.9%) of such a hydrologically-induced vegetation loss occurred in areas where an ephemeral seasonal regime was established and subsequently disappeared (Supplementary Figure S9A,C, transition class J). The remaining vegetation loss occurred in areas that remained permanently or seasonally inundated despite of dam regulation (Supplementary Figure S9A,C, transition classes A and D).
As shown in Figures 5A–C, the vegetation loss that occurred in areas interested by river dynamics (see blue-dashed bars) represents almost 70% of high-magnitude vegetation changes (i.e., magnitude values higher than the mode). The remaining 30% can be partly due to anthropic use (forest logging, agriculture use, etc.) of the floodplain permitted in the Uatum
3.4 Changes in the Gross Primary Production
The forest changes induced by the Balbina dam construction have generated a complex vegetation redistribution of the Uatum
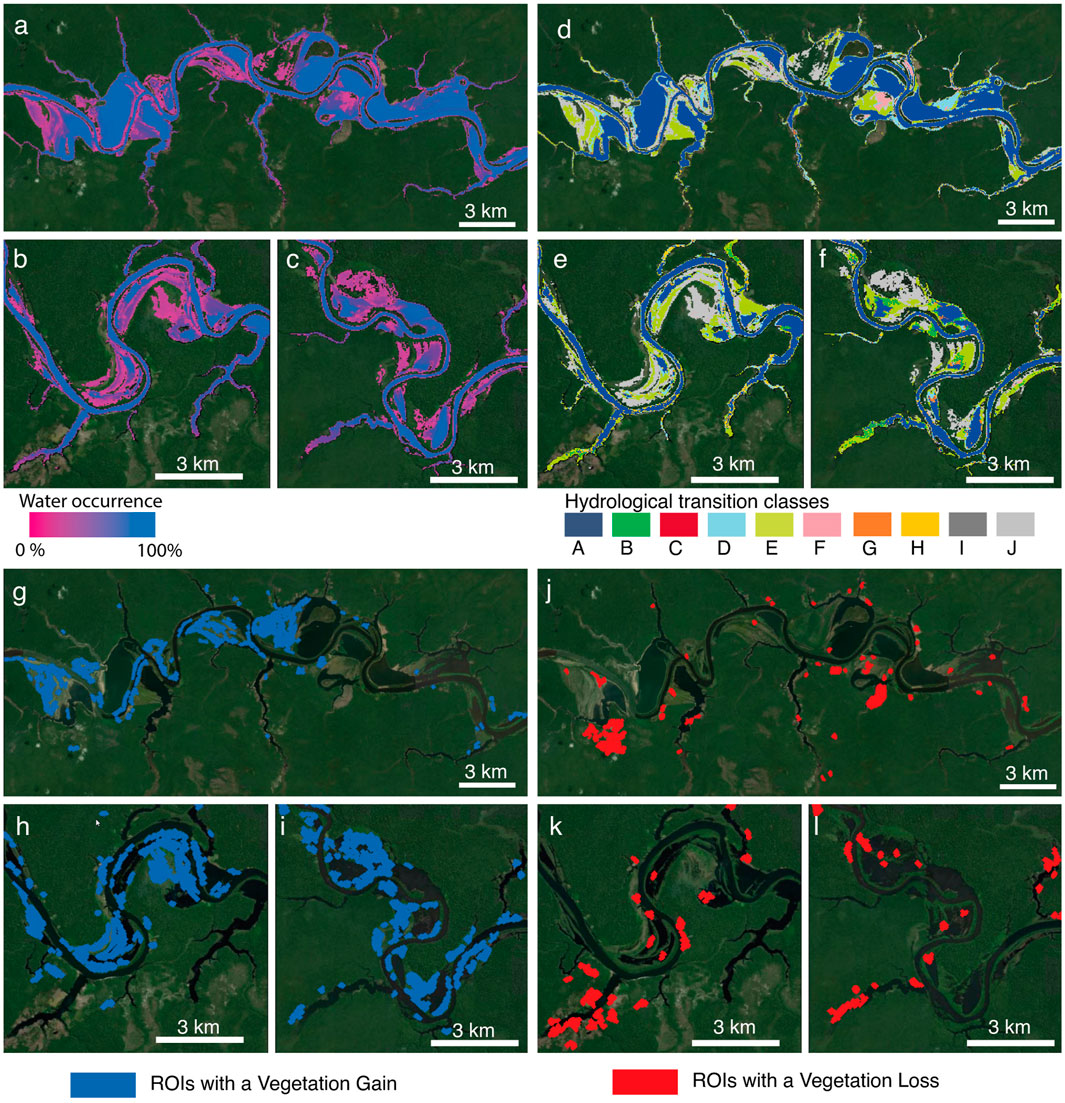
FIGURE 8. Alteration in the hydrological conditions of study area. a-c Frequency of water presence from 1984 to 2020. d-f Maps of hydrological transition occurred between 1984 and 2020; (A): unchanging permanent water surfaces; (B): new permanent water surfaces (conversion of land into permanent water); (C): lost permanent water surfaces (conversion of permanent water into land); (D): unchanging seasonal water surfaces; (E): new seasonal water surfaces (conversion of land into seasonal water); F: loss of seasonal water surfaces (conversion of a seasonal water into land); (G): the conversion of seasonal water into permanent water; (H): conversion of permanent water into seasonal water; (I): ephemeral permanent water (land replaced by permanent water that subsequently disappears) J: ephemeral seasonal water (land replaced by seasonal water that subsequently disappears). For further details about frequency of water presence and definition of hydrological transition classes refer to Pekel et al. (2016). (G-I) ROIs with a vegetation gain detected by using NDVI index. (J-L) ROIs with a vegetation loss detected by using NDVI index. For graphical reasons, only the some reaches of the area of study are here reported. The whole region and results of all vegetation indices are reported in the Supplementary Figure S3-S8.
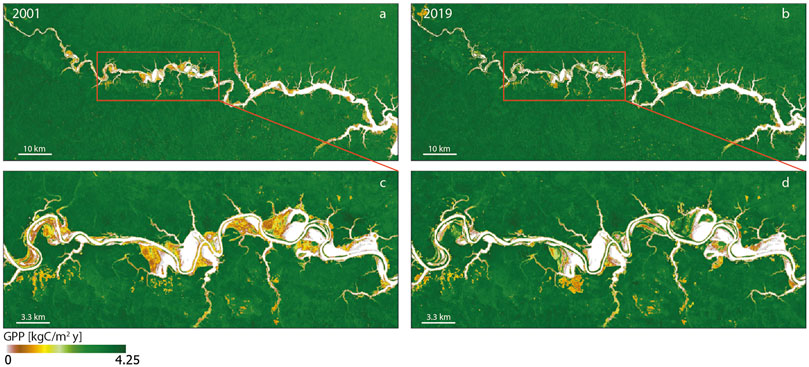
FIGURE 9. Comparison between annual gross primary production maps (30 m resolution) of Uatum
More generally, the results reported in Figure 10 show how the ROIs characterized by a vegetation loss were largely associated to a reduction of GPP in the period 2001–2019 (see Figures 10A–C, further details are in the Supplementary Material). About a third of these cases are associated with a decrease in the heterogeneity of the land cover within the ROI, which could indicate bare soil formation or uniformly distributed vegetated areas with low GPP (e.g. grassland). The remaining two-thirds experienced an increase in land heterogeneity, suggesting a vegetation loss with a leopard-spot pattern. A considerable amount of forest gain (82, 89 and 77%) was associated to an increase in both the median value of GPP and land cover heterogeneity (Figures 10D–F). According to the field survey made by da Rocha et al. (2019), it is reasonable to suppose that this is due to the encroachment of land forest species in the floodplain forest.
The increase in the heterogeneity suggests a shifting condition, with a patchy distribution, that is far from a stable mature forest. Nevertheless, in at least 17, 25 and 28% of cases, a first increase followed by a decrease in the variance may suggest that the change is in an advanced state, because a first reorganization of the community structure (increase in heterogeneity) was followed by a homogenization of the patch (Supplementary Figure S1). Although the behavior of GPP spatially-average values within the entire river corridor is similar to that of the adjacent forest, the analysis of the ROIs shows a different story. Some large areas are overcoming an increase in GPP, while others a decrease in primary production. More specifically, the greatest changes are concentrated in a stretch of floodplain about 45 km long, that is 50 km from the dam (see red box Figure 9), where the presence of ROIs and hydrological alterations are concentrated.
4 Discussion
4.1 The Framework
The framework proposed in this study aims to assess the alterations in a tropical floodplain forest induced by river regulation due to damming. The main outcomes of the present approach are the: 1) detection and characterization, through a high-resolution analysis, of vegetation changes, in terms of phenology, trajectory of the change, and GPP estimation and the 2) identification of the relation of the changes detected with the local alteration in the hydrologic regime.
The vegetation analysis is based on four pivotal aspects: 1) The analysis of the floodplains with a resolution consistent with the scales of the process; 2) The adoption of different vegetation indices in order to capture the wider range of vegetation alteration states in a robust way; 3) The development of monthly gap-free land observations along the whole study period that allows obtaining information about the vegetation phenology; 4) Identification of the site where vegetation change occurs and their analysis at the site-scale in contrast to floodplain-averaged lumped analysis, as previously made in the literature. The high resolution of reflectance dataset has a crucial role in detecting the changes that interested the narrow aquatic-terrestrial transitional zone. In the considered case, our estimates from the comparison between the maximum extension of flooding and the median width of the river active channel in the last 3 decades (through global water surface dataset) show that river dynamics involve about 600 m of the floodplain width. The effects of dam regulation on vegetation are mostly concentrated in this riparian belt, therefore it deserves to be scrutinized with adequate resolution. Although monitoring approaches based on moderate spatial resolution data (e.g. MODIS Zhang et al. (2003)) can compensate the issue of cloud-induced gaps with a high temporal resolution, they provide a too low spatial resolution in the riparian area (1 or two pixels per active riparian width). The GFHR data, used herein, instead provides a much higher resolution (about 20 pixels per width of the riparian belt) allowing for precise identification of the areas affected by vegetation changes (see Figure 8).
de Resende et al. (2019) developed a high–resolution mapping of dead trees in the Uatum
Many of the current vegetation indices based on high-resolution monitoring systems of Amazonian forest (e.g. PRODES-INPE) are constrained to the availability of reflectance data during the annual free-cloud period (July to September) (Shimabukuro and Ponzoni, 2018). Since the data always refer to the same season of the year (only three or 4 months of dry period), it is not possible to evaluate changes in intra-annual behavior and therefore in the phenology of forest species. These approaches aimed to detect deforestation (clearings accumulated up to the previous year) focusing on changes between forest and non-forest status, i.e. vegetation that is not characterized by a forest structure (Shimabukuro and Ponzoni, 2018). Therefore they are poorly suited to monitoring changes in plant species or identifying stress conditions in the vegetation.
In our study, the use of HISTARFM fusing algorithm allows the availability of year-round gap-free data and furthermore to analyze vegetation phenology changes. This is very important in interpreting the type of vegetation change that has occurred. Figure 6 shows that vegetation loss and gain are widely associated with phenology. In the case of a vegetation loss, an increase in the amplitude of oscillation associated with a sharp decrease in the average value suggests that, after the change, grassy or shrub species have settled in the ROI. On the other hand, in the case of vegetation gain, a phenology behavior similar to that of the nearby land forest was often found, suggesting an invasion of this type of vegetation in the floodplain area.
The ROI-scale analysis clearly identifies the location where severe forest reshuffling occurred. On the contrary, a spatially averaged lumped analysis along the whole floodplain may not completely identify the actual modification of the forest, since vegetation losses and gains might compensate each other. Although there are many studies concerning the impact of damming that are based on an average-scale analysis of the entire floodplain, those studies usually aim to evaluate the morphological alterations Nallaperuma and Asaeda (2020), and cannot assess whether a reorganization of the plant community is taking place in the floodplain. Therefore, those approaches risk underestimating the environmental impact in the area. It is possible to see this effect also by observing what we obtained from the analysis of the GPP trajectories. Although the averaged analysis over the whole floodplain does not show significant GPP changes compared to what has been observed in the nearby forest, a detailed analysis of the individual ROI shows that profound changes are occurring within the floodplains (see Figures 9, 10).
The assessment of the hydrological alterations, based on the Global Water Surface dataset from 1984 to 2020 enabled us to perform a large-scale analysis of the floodplain. The 37 years of data made it possible to go back to pre-dam conditions, and thus investigate the consequences of the dam-induced changes in the hydrologic regime on the evolution of the vegetation during the last 20 years. Since the dataset provides data at a global scale, the analysis of hydrological alteration can also be performed upon others non-instrumented watercourses for which insufficient flow data is available. More specifically, the analysis is well suited to detect the wide variations of the flooded area caused by the alterations of natural flood pulse in the unconfined fluvial systems of the Amazon basin.
4.2 Strength and Weaknesses of the Procedure
The proposed framework is exportable to other different locations. It is based on the processing of satellite products freely available on GEE (Landsat, MODIS, ERA5-Land, Global water Surface) and does not require special calibration. Moreover, it is completely implemented on GEE, thus significantly reducing computational cost and storage space.
Although the HISTARFM algorithm showed remarkable efficiency in removing gaps and noise from the signal, the extreme cloud contamination of the Amazonian area cause the presence of residual artifacts. This is due to a non-perfect identification of clouds and their shadows, the paucity of uncontaminated data, and the presence of noise–induced by water (Moreno-Martí nez et al., 2020). To reduce the impact of such artifacts on the floodplain analysis, a post-processing filtering operation on vegetation index time series was performed, and all the unrealistic oscillations were removed.
The threshold used for the definition of vegetation loss/gain is the result of an iterative visual inspection and comparison between the map of changes and high-resolution GEE images. Nevertheless, this choice can be further refined through future field validations. The results of the vegetation change detection show differences, depending on the index adopted. The use of three different indices has the purpose of capturing the widest possible range of alterations in the vegetation (photosynthetic activity, structure of the canopy vegetation density of which the indices are proxies). Although, 70% of the areas of change detected with the EVI were also detected by the other two indices, the kNDVI identifies wider additional areas. Further analysis and comparison with field data are needed to define whether this discrepancy is due to the non–linearity of the index (see Supplementary Material) and the definition of the threshold value for change detection or its sensitivity to particular types of alterations not found with EVI and NDVI.
Since the framework is fundamentally based on the reflectance data of the HISTARFM algorithm, the time interval analysis is linked to the availability of MODIS data, namely after 2000.
The annual high–resolution GPP maps were developed through a VPM model (Xiao et al., 2005). Although the model was designed for broad-leaf seasonally moist tropical evergreen forest, it was used to assess the GPP also in flooded spots wherein vegetation is subjected to complex interactions with river dynamics. The sedimentary processes involved and the hydrologic regime induce different responses for different species, thus giving rise to an extremely complex scenario. During the dry period, some species of floodplain forest experience an increase in the rate of CO2 assimilation due to new flushed leaves (more photosynthetically efficient) and soil aeration (Schöngart et al., 2002; Fonseca et al., 2019; Green et al., 2020). Instead, during long floods, the metabolic activities are reduced to a minimum up to a dormancy status as a survival strategy (Fonseca et al., 2019). However, several studies show that other species (Schöngart et al., 2002) (e.g., evergreen trees in igapó forest) does not completely arrest physiological processes during flooding but they either remain photosynthetically active or flush new leaves and produce flowers and fruits taking energy from carbohydrate reserves through anaerobic metabolism (Schöngart et al., 2002; Schöngart et al., 2005). Generally speaking, even though different species act in a different way to survive a long period of flood due to the reduction of oxygen in the soil, they reduce or completely stop the GPP. This justifies the choice, as a first approximation, to consider null the GPP in the flooded spots for flood events longer than a month. Nevertheless, the maximum light use efficiency of the flooded forest during the dry period was assumed equal to the one of the land forest. This choice is justified because, the purpose of the work is not to calculate the precise amount of the GPP in each point, but to evaluate its trajectory over time in order to detect the changes. Nevertheless, a future calibration of the model with field data might enhance the GPP accuracy.
4.3 Floodplain Alteration
We used Uatum
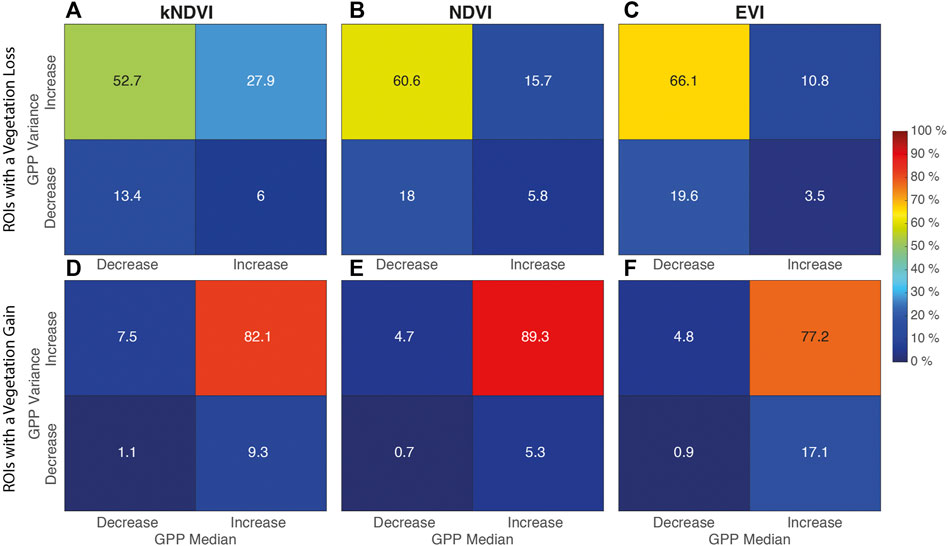
FIGURE 10. Percentage distribution of combinations of increase/decrease in the GPP spatial median/variance within the ROIs. (A)–(C) Rois with vegetation loss. (D)–(F) Rois with vegetation gain.
Despite the high tolerance to flooding, igapó forest species are very sensitive to alterations in the flood pulse. The Balbina dam has modified the monomodal alternation of wet/dry periods which characterized the pre-dam natural conditions, thus inducing an increase in low-water regimes and a reduction in high-water flows (Assahira et al., 2017). The extremely long flooding period and the loss in the terrestrial period that characterized some areas of the lower lands (up to 300 days per year of wet conditions) have induced a selection of a limited number of species able to adapt to this regime (de Resende et al., 2019; Schöngart et al., 2021). Some areas experienced a new flooding condition from 2000 without interruption for more than 8 years, inducing massive mortality of M. acaciifolium, one of the most common species in igapó (Assahira et al., 2017; Schöngart et al., 2021). In addition, the peak of forest loss observed in 2005 (Figure 4), coincident with a severe drought following a Niño event, highlights how the dam amplifies the effects of natural disturbances.
The consequences of the hydrological changes are not limited to tree mortality induced by the anoxic conditions of long flooded areas (de Resende et al., 2019), but also include the redistribution of plant species (da Rocha et al., 2019). The suppression of high flow conditions reduces the amplitude of oscillation of the water stage, preventing the floods from reaching the highest elevations of the floodplain (Assahira et al., 2017). The lack of a seasonal inundation at the highest elevations prevents the selection of flood-adapted species and allows for the colonization of invasive species from land forests, and therefore the disappearance of the igapó community (Assahira et al., 2017; de Sousa Lobo et al., 2019; da Rocha et al., 2019). Our analysis of vegetation changes and phonological modifications shows that almost 77 km2 of the floodplain (Figure 6D and Table 1) have undergone a vegetation gain that can be partly associated to a progressive transition from igapó to upland or secondary forest. Although this ecological transition is accompanied by an increase in GPP (Figure 10), it causes a reduction in biodiversity and a modification in ecosystem functioning (de Sousa Lobo et al., 2019; da Rocha et al., 2019), which is a threat to several environmental services (de Sousa Lobo et al., 2019).
In addition, the disappearance of flooding from the upper floodplain partially or completely inhibits the exchange of organic matter and nutrients between the river and the land and worsens the effect of drought events, making the area vulnerable to wildfire (de Resende et al., 2019).
4.4 Multi-Decadal Effects of the Dam on the Forest: A System Still far From Ecological Equilibrium
The Igapó floodplain forest is particularly sensitive to both natural and human-induced changes in hydrology (de Resende et al., 2020). Nevertheless, recent studies using modern radiocarbon techniques have observed that the mortality of some igapó vegetation species in the case of Uatum
Damming caused a complex entanglement of terrestrial phase suppression in the lower floodplain region, increasing the alternation between water deficit and anoxic conditions, and the suppression of the aquatic phase in the upper floodplain region. The effects of these disturbances are manifold and still not fully understood. According to Schöngart et al. (2021) the consequences range from the reduction of biodiversity with a loss of ecosystem services, to the increase of greenhouses gasses. Since the high-flow conditions are inhibited, the dead trees remain in the lower part of the floodplain and are exposed to decomposition. The estimates provided by de Resende et al. (2019) predicted that 354 GgC could be potentially emitted from the degradation of dead vegetation downstream of the dam. In addition, a lack of carbon sequestration by vegetation in the remaining unvegetated or highly degraded areas should be considered. Our results show that about 47 km2 of floodplain experienced a decrease in GPP in the last 2 decades. Finally, in the upper regions of the floodplain, emissions from the degradation of root mats and litter, no longer recruited by flooding and levee erosion, and emissions from wildfires represent other sources of greenhouse gases caused by the dam. All these additional emissions worsen the still very high levels of emissions attributed to the dam. The total amount of CH4 and CO2 released from the decomposition of vegetation in the upstream reservoirs, from turbines, and from diffuse sources in the water immediately downstream of the dams, is 2.9 MgC-eq per MWh of energy generated, almost ten times that of the coal-fired thermal power plant (Kemenes et al., 2011).
The Uatum
5 Conclusion
This study provides an operative framework for the evaluation of the impact of river regulation on floodplain vegetation based on the assessment of vegetation indices changes, hydrological alterations, and the modification of the forest gross primary production. The GFHR data was fundamental to study the extreme cloudy tropical area of the Amazon basin. The high spatial and temporal resolution analysis of floodplain forest allowed for the detection of modifications of vegetation behavior in terms of both inter- and intra-annual variability, even along the narrow aquatic-terrestrial transitional zone. The analysis of vegetation indices, not only in terms of variation of the annual mean of vegetation index, but also about the magnitude of the change and variation in phenology (amplitude of oscillation), guided the detection of vegetation species transitions. Our results suggest a deep reorganization in species populating the floodplain of Uatum
Our approach is based on the identification and analysis of regions where vegetation changes are concentrated rather than a study of the average behavior of the entire floodplain, allowing very accurate identification of the most degraded or threatened area. The extreme heterogeneity of the forest ecosystems populating the tropical floodplain makes it difficult to generalize what is the response of these ecosystems to alterations in the hydrological regime. At the same time, the increasing number of dams under construction in the Neotropics makes urgent the availability of more accurate procedures for monitoring impacts. Our framework is a practical tool that could be potentially applied to map and monitor floodplain forests, guiding the assessment of the vegetation status and the identification of threatened areas.
Data Availability Statement
The original contributions presented in the study are included in the article/Supplementary Material, further inquiries can be directed to the corresponding author.
Author Contributions
LS, AM-M, EI-V, AS, CC contributed to conceptualization; LS, AM-M, EI-V contributed to methodology and software; LS, AS, CC contributed to investigation work; LS contributed to visualization, data curation, formal analysis, validation and writing—original draft; AM-M, EI-V, AS, CC contributed to review and editing; NC contributed to computing resources; AS, CC contributed to supervision. All authors approved the submitted version.
Funding
LS was supported by the Joint Projects grant funded by Compagnia di San Paolo Fundation. This research was partly funded by the ERC under the ERC-SyG-2019 USMILE project (grant agreement 855187).
Conflict of Interest
Author NC was supported by the company Google, Inc.,
The remaining authors declare that the research was conducted in the absence of any commercial or financial relationships that could be construed as a potential conflict of interest.
Publisher’s Note
All claims expressed in this article are solely those of the authors and do not necessarily represent those of their affiliated organizations, or those of the publisher, the editors and the reviewers. Any product that may be evaluated in this article, or claim that may be made by its manufacturer, is not guaranteed or endorsed by the publisher.
Acknowledgments
Credit for base map in Figure 1A–C, Figure 8 and Supplementary Figure S3–S8: Esri, DigitalGlobe, GeoEye, i-cubed, USDA FSA, USGS, AEX, Getmapping, Aerogrid, IGN, IGP, swisstopo, and the GIS User Community.
Supplementary Material
The Supplementary Material for this article can be found online at: https://www.frontiersin.org/articles/10.3389/fenvs.2022.871530/full#supplementary-material
References
Agostinho, A. A., Thomaz, S. M., and Gomes, L. C. (2018). Threats for Biodiversity in the Floodplain of the Upper Paraná River: Effects of Hydrological Regulation by Dams. Ecohydrol. Hydrobiol. 4 (3), 267–280.
de Almeida, D. R., Nelson, B. W., Schietti, J., Gorgens, E. B., Resende, A. F., Stark, S. C., et al. (2016). Contrasting Fire Damage and Fire Susceptibility between Seasonally Flooded forest and upland forest in the central Amazon Using Portable Profiling Lidar. Remote Sensing Environ. 184, 153–160. doi:10.1016/j.rse.2016.06.017
Almeida, R. M., Shi, Q., Gomes-Selman, J. M., Wu, X., Xue, Y., Angarita, H., et al. (2019). Reducing Greenhouse Gas Emissions of Amazon Hydropower with Strategic Dam Planning. Nat. Commun. 10, 4281–4289. doi:10.1038/s41467-019-12179-5
Andersson, E., Nilsson, C., and Johansson, M. E. (2000). Effects of River Fragmentation on Plant Dispersal and Riparian flora. Regul. Rivers: Res. Mgmt. 16, 83–89. doi:10.1002/(sici)1099-1646(200001/02)16:1<83::aid-rrr567>3.0.co;2-t
Assahira, C., Piedade, M. T. F., Trumbore, S. E., Wittmann, F., Cintra, B. B. L., Batista, E. S., et al. (2017). Tree Mortality of a Flood-Adapted Species in Response of Hydrographic Changes Caused by an Amazonian River Dam. For. Ecol. Manage. 396, 113–123. doi:10.1016/j.foreco.2017.04.016
Benchimol, M., and Peres, C. A. (2015). Edge-mediated Compositional and Functional Decay of Tree Assemblages in Amazonian forest Islands after 26 Years of Isolation. J. Ecol. 103, 408–420. doi:10.1111/1365-2745.12371
Bertagni, M. B., Perona, P., and Camporeale, C. (2018). Parametric Transitions between Bare and Vegetated States in Water-Driven Patterns. Proc. Natl. Acad. Sci. U.S.A. 115, 8125–8130. doi:10.1073/pnas.1721765115
Calamita, E., Siviglia, A., Gettel, G. M., Franca, M. J., Winton, R. S., Teodoru, C. R., et al. (2021). Unaccounted Co2 Leaks Downstream of a Large Tropical Hydroelectric Reservoir. Proc. Natl. Acad. Sci. U S A. 118, e2026004118. doi:10.1073/pnas.2026004118
Camporeale, C., Perucca, E., Ridolfi, L., and Gurnell, A. M. (2013). Modeling the Interactions between River Morphodynamics and Riparian Vegetation. Rev. Geophys. 51, 379–414. doi:10.1002/rog.20014
Camps-Valls, G., Campos-Taberner, M., Moreno-Martínez, Á., Walther, S., Duveiller, G., Cescatti, A., et al. (2021). A Unified Vegetation index for Quantifying the Terrestrial Biosphere. Sci. Adv. 7, eabc7447. doi:10.1126/sciadv.abc7447
Castello, L., and Macedo, M. N. (2016). Large-scale Degradation of Amazonian Freshwater Ecosystems. Glob. Change Biol. 22, 990–1007. doi:10.1111/gcb.13173
Cochrane, S. M. V., Matricardi, E. A. T., Numata, I., and Lefebvre, P. A. (2017). Landsat-based Analysis of Mega Dam Flooding Impacts in the Amazon Compared to Associated Environmental Impact Assessments: Upper Madeira River Example 2006-2015. Remote Sensing Appl. Soc. Environ. 7, 1–8. doi:10.1016/j.rsase.2017.04.005
Constantine, J. A., Dunne, T., Ahmed, J., Legleiter, C., and Lazarus, E. D. (2014). Sediment Supply as a Driver of River Meandering and Floodplain Evolution in the Amazon basin. Nat. Geosci. 7, 899–903. doi:10.1038/ngeo2282
da Rocha, M., de Assis, R. L., Piedade, M. T. F., Feitosa, Y. O., Householder, J. E., Lobo, G. d. S., et al. (2019). Thirty Years after Balbina Dam: Diversity and Floristic Composition of the Downstream Floodplain forest, central Amazon, brazil. Ecohydrology 12, e2144. doi:10.1002/eco.2144
Deemer, B. R., Harrison, J. A., Li, S., Beaulieu, J. J., DelSontro, T., Barros, N., et al. (2016). Greenhouse Gas Emissions from Reservoir Water Surfaces: a New Global Synthesis. BioScience 66, 949–964. doi:10.1093/biosci/biw117
Donchyts, G., Schellekens, J., Winsemius, H., Eisemann, E., and Van de Giesen, N. (2016). A 30 M Resolution Surface Water Mask Including Estimation of Positional and Thematic Differences Using Landsat 8, Srtm and Openstreetmap: a Case Study in the murray-darling basin, australia. Remote Sensing 8, 386. doi:10.3390/rs8050386
Fearnside, P. M. (1989). Brazil's Balbina Dam: Environment versus the Legacy of the Pharaohs in Amazonia. Environ. Manag. 13, 401–423. doi:10.1007/bf01867675
Fearnside, P. M. (2002). Greenhouse Gas Emissions from a Hydroelectric Reservoir (brazil’s Tucuruí Dam) and the Energy Policy Implications. Water Air Soil Pollut. 133, 69–96. doi:10.1023/a:1012971715668
Fearnside, P. M. (2014). Impacts of Brazil's Madeira River Dams: Unlearned Lessons for Hydroelectric Development in Amazonia. Environ. Sci. Pol. 38, 164–172. doi:10.1016/j.envsci.2013.11.004
Fearnside, P. M., and Pueyo, S. (2012). Greenhouse-gas Emissions from Tropical Dams. Nat. Clim. Change 2, 382–384. doi:10.1038/nclimate1540
Fearnside, P. M. (2016). Tropical Dams: To Build or Not to Build? Science 351, 456–457. doi:10.1126/science.351.6272.456-b
Ferreira, C. S., Piedade, M. T. F., Wittmann, A. d. O., and Franco, A. C. (2010). Plant Reproduction in the central Amazonian Floodplains: Challenges and Adaptations. AoB Plants 2010, plq009. doi:10.1093/aobpla/plq009
Flores, B. M., Holmgren, M., Xu, C., Van Nes, E. H., Jakovac, C. C., Mesquita, R. C. G., et al. (2017). Floodplains as an Achilles' Heel of Amazonian forest Resilience. Proc. Natl. Acad. Sci. U.S.A. 114, 4442–4446. doi:10.1073/pnas.1617988114
Fonseca, L. D. M., Dalagnol, R., Malhi, Y., Rifai, S. W., Costa, G. B., Silva, T. S. F., et al. (2019). Phenology and Seasonal Ecosystem Productivity in an Amazonian Floodplain forest. Remote Sensing 11, 1530. doi:10.3390/rs11131530
Gorelick, N., Hancher, M., Dixon, M., Ilyushchenko, S., Thau, D., and Moore, R. (2017). Google Earth Engine: Planetary-Scale Geospatial Analysis for Everyone. Remote Sensing Environ. 202, 18–27. doi:10.1016/j.rse.2017.06.031
Green, J. K., Berry, J., Ciais, P., Zhang, Y., and Gentine, P. (2020). Amazon Rainforest Photosynthesis Increases in Response to Atmospheric Dryness. Sci. Adv. 6, eabb7232. doi:10.1126/sciadv.abb7232
Grill, G., Lehner, B., Thieme, M., Geenen, B., Tickner, D., Antonelli, F., et al. (2019). Mapping the World's Free-Flowing Rivers. Nature 569, 215–221. doi:10.1038/s41586-019-1111-9
Huete, A., Didan, K., Miura, T., Rodriguez, E. P., Gao, X., and Ferreira, L. G. (2002). Overview of the Radiometric and Biophysical Performance of the Modis Vegetation Indices. Remote Sensing Environ. 83, 195–213. doi:10.1016/s0034-4257(02)00096-2
Junk, W. J., Bayley, P. B., and Sparks, R. E. (1989). The Flood Pulse Concept in River-Floodplain Systems. Can. Spec. Publ. Fish. Aquat. Sci. 106, 110–127.
Junk, W. J. (1997). “General Aspects of Floodplain Ecology with Special Reference to Amazonian Floodplains,” in The Central Amazon Floodplain (Berlin, Germany: Springer), 3–20. doi:10.1007/978-3-662-03416-3_1
Junk, W. J., Piedade, M. T. F., Lourival, R., Wittmann, F., Kandus, P., Lacerda, L. D., et al. (2014). Brazilian Wetlands: Their Definition, Delineation, and Classification for Research, Sustainable Management, and Protection. Aquat. Conserv: Mar. Freshw. Ecosyst. 24, 5–22. doi:10.1002/aqc.2386
Junk, W. J., Piedade, M. T. F., Schöngart, J., Cohn-Haft, M., Adeney, J. M., and Wittmann, F. (2011). A Classification of Major Naturally-Occurring Amazonian Lowland Wetlands. Wetlands 31, 623–640. doi:10.1007/s13157-011-0190-7
Junk, W. J., Wittmann, F., Schöngart, J., and Piedade, M. T. F. (2015). A Classification of the Major Habitats of Amazonian Black-Water River Floodplains and a Comparison with Their White-Water Counterparts. Wetlands Ecol. Manage. 23, 677–693. doi:10.1007/s11273-015-9412-8
Kahn, J., Freitas, C., and Petrere, M. (2014). False Shades of Green: the Case of Brazilian Amazonian Hydropower. Energies 7, 6063–6082. doi:10.3390/en7096063
Kemenes, A., Forsberg, B. R., and Melack, J. M. (2011). Co2 Emissions from a Tropical Hydroelectric Reservoir (Balbina, Brazil). J. Geophys. Res. Biogeosciences 116, G03004. doi:10.1029/2010jg001465
Kennedy, R., Yang, Z., Gorelick, N., Braaten, J., Cavalcante, L., Cohen, W., et al. (2018). Implementation of the Landtrendr Algorithm on Google Earth Engine. Remote Sensing 10, 691. doi:10.3390/rs10050691
Kobayashi, H., and Dye, D. G. (2005). Atmospheric Conditions for Monitoring the Long-Term Vegetation Dynamics in the Amazon Using Normalized Difference Vegetation index. Remote Sensing Environ. 97, 519–525. doi:10.1016/j.rse.2005.06.007
Kuriqi, A., Pinheiro, A. N., Sordo-Ward, A., Bejarano, M. D., and Garrote, L. (2021). Ecological Impacts of Run-Of-River Hydropower Plants-Current Status and Future Prospects on the Brink of Energy Transition. Renew. Sustain. Energ. Rev. 142, 110833. doi:10.1016/j.rser.2021.110833
Lafage, D., Secondi, J., Georges, A., Bouzillé, J.-B., and Pétillon, J. (2014). Satellite-derived Vegetation Indices as Surrogate of Species Richness and Abundance of Ground Beetles in Temperate Floodplains. Insect Conserv. Divers. 7, 327–333. doi:10.1111/icad.12056
Latrubesse, E. M., Arima, E. Y., Dunne, T., Park, E., Baker, V. R., d’Horta, F. M., et al. (2017). Damming the Rivers of the Amazon basin. Nature 546, 363–369. doi:10.1038/nature22333
Lees, A. C., Peres, C. A., Fearnside, P. M., Schneider, M., and Zuanon, J. A. S. (2016). Hydropower and the Future of Amazonian Biodiversity. Biodivers. Conserv. 25, 451–466. doi:10.1007/s10531-016-1072-3
Lewis, W. M., Hamilton, S. K., Lasi, M. A., Rodríguez, M., and Saunders, J. F. (2000). Ecological Determinism on the Orinoco Floodplain. BioScience 50, 681–692. doi:10.1641/0006-3568(2000)050[0681:edotof]2.0.co;2
Lobo, G. d. S., Wittmann, F., and Piedade, M. T. F. (2019). Response of Black-Water Floodplain (Igapó) Forests to Flood Pulse Regulation in a Dammed Amazonian River. For. Ecol. Manage. 434, 110–118. doi:10.1016/j.foreco.2018.12.001
Lopes, A., Crema, L. C., Demarchi, L. O., Ferreira, A. B., Santiago, I. N., Ríos-Villamizar, E. A., et al. (2019). Herbáceas aquáticas em igapós de água preta dentro e fora de unidades de conservaçao no estado Do amazonas. Biodiversidade Brasileira 9, 45–62. doi:10.37002/biobrasil.v9i2.769
Melack, J. M., and Hess, L. L. (2010). “Remote Sensing of the Distribution and Extent of Wetlands in the Amazon basin,” in Amazonian Floodplain Forests (Dordrecht: Springer), 43–59. doi:10.1007/978-90-481-8725-6_3
Merritt, D. M., and Wohl, E. E. (2006). Plant Dispersal along Rivers Fragmented by Dams. River Res. Applic. 22, 1–26. doi:10.1002/rra.890
Moreno-Martínez, Á., Izquierdo-Verdiguier, E., Maneta, M. P., Camps-Valls, G., Robinson, N., Muñoz-Marí, J., et al. (2020). Multispectral High Resolution Sensor Fusion for Smoothing and gap-filling in the Cloud. Remote Sensing Environ. 247, 111901. doi:10.1016/j.rse.2020.111901
Nallaperuma, B., and Asaeda, T. (2020). The Long‐Term Legacy of Riparian Vegetation in a Hydrogeomorphologically Remodelled Fluvial Setting. River Res. Applic. 36, 1690–1700. doi:10.1002/rra.3665
Nilsson, C., and Berggren, K. (2000). Alterations of Riparian Ecosystems Caused by River Regulation. BioScience 50, 783–792. doi:10.1641/0006-3568(2000)050[0783:aorecb]2.0.co;2
Parolin, P., and Wittmann, F. (2010). “Tree Phenology in Amazonian Floodplain Forests,” in Amazonian Floodplain Forests (Dordrecht: Springer), 105–126. doi:10.1007/978-90-481-8725-6_5
Pekel, J.-F., Cottam, A., Gorelick, N., and Belward, A. S. (2016). High-Resolution Mapping of Global Surface Water and Its Long-Term Changes. Nature, 540 (7633), 418–422. doi:10.1038/nature20584
Poff, N. L., and Hart, D. D. (2002). How Dams Vary and Why it Matters for the Emerging Science of Dam Removal. BioScience 52, 659–668. doi:10.1641/0006-3568(2002)052[0659:hdvawi]2.0.co;2
Prairie, Y. T., Alm, J., Beaulieu, J., Barros, N., Battin, T., Cole, J., et al. (2018). Greenhouse Gas Emissions from Freshwater Reservoirs: What Does the Atmosphere See? Ecosystems 21, 1058–1071. doi:10.1007/s10021-017-0198-9
Resende, A. F. d., Schöngart, J., Streher, A. S., Ferreira-Ferreira, J., Piedade, M. T. F., and Silva, T. S. F. (2019). Massive Tree Mortality from Flood Pulse Disturbances in Amazonian Floodplain Forests: The Collateral Effects of Hydropower Production. Sci. Total Environ. 659, 587–598. doi:10.1016/j.scitotenv.2018.12.208
Resende, A. F., Piedade, M. T. F., Feitosa, Y. O., Andrade, V. H. F., Trumbore, S. E., Durgante, F. M., et al. (2020). Flood‐pulse Disturbances as a Threat for Long‐Living Amazonian Trees. New Phytol. 227, 1790–1803. doi:10.1111/nph.16665
Robinson, N., Allred, B., Jones, M., Moreno, A., Kimball, J., Naugle, D., et al. (2017). A Dynamic Landsat Derived Normalized Difference Vegetation index (Ndvi) Product for the Conterminous United States. Remote Sensing 9, 863. doi:10.3390/rs9080863
Schöngart, J., and Junk, W. J. (2007). Forecasting the Flood-Pulse in Central Amazonia by Enso-Indices. J. Hydrol. 335, 124–132. doi:10.1016/j.jhydrol.2006.11.005
Schöngart, J., Piedade, M. T. F., Ludwigshausen, S., Horna, V., and Worbes, M. (2002). Phenology and Stem-Growth Periodicity of Tree Species in Amazonian Floodplain Forests. J. Trop. Ecol. 18, 581–597. doi:10.1017/s0266467402002389
Schöngart, J., Piedade, M. T. F., Wittmann, F., Junk, W. J., and Worbes, M. (2005). Wood Growth Patterns of Macrolobium Acaciifolium (Benth.) Benth. (Fabaceae) in Amazonian Black-Water and White-Water Floodplain Forests. Oecologia 145, 454–461. doi:10.1007/s00442-005-0147-8
Schöngart, J., Wittmann, F., Faria de Resende, A., Assahira, C., Sousa Lobo, G., Rocha Duarte Neves, J., et al. (2021). The Shadow of the Balbina Dam: A Synthesis of over 35 Years of Downstream Impacts on Floodplain Forests in Central Amazonia. Aquat. Conserv: Mar Freshw Ecosyst 31, 1117–1135. doi:10.1002/aqc.3526
Shilpakar, R. L., Thoms, M. C., and Reid, M. A. (2021). The Resilience of a Floodplain Vegetation Landscape. Landscape Ecol. 36, 139–157. doi:10.1007/s10980-020-01127-0
Shimabukuro, Y. E., and Ponzoni, F. J. (2018). Spectral Mixture for Remote Sensing: Linear Model and Applications. Basel, Switzerland: Springer.
Sims, N. C., and Colloff, M. J. (2012). Remote Sensing of Vegetation Responses to Flooding of a Semi-Arid Floodplain: Implications for Monitoring Ecological Effects of Environmental Flows. Ecol. Indicators 18, 387–391. doi:10.1016/j.ecolind.2011.12.007
Targhetta, N., Kesselmeier, J., and Wittmann, F. (2015). Effects of the Hydroedaphic Gradient on Tree Species Composition and Aboveground Wood Biomass of Oligotrophic Forest Ecosystems in the Central Amazon Basin. Folia Geobot. 50, 185–205. doi:10.1007/s12224-015-9225-9
Tealdi, S., Camporeale, C., and Ridolfi, L. (2011). Modeling the Impact of River Damming on Riparian Vegetation. J. Hydrol. 396, 302–312. doi:10.1016/j.jhydrol.2010.11.016
Timpe, K., and Kaplan, D. (2017). The Changing Hydrology of a Dammed Amazon. Sci. Adv. 3, e1700611. doi:10.1126/sciadv.1700611
Tockner, K., Pusch, M., Borchardt, D., and Lorang, M. S. (2010). Multiple Stressors in Coupled River-Floodplain Ecosystems. Freshw. Biol. 55, 135–151. doi:10.1111/j.1365-2427.2009.02371.x
Vesipa, R., Camporeale, C., and Ridolfi, L. (2017). Effect of River Flow Fluctuations on Riparian Vegetation Dynamics: Processes and Models. Adv. Water Resour. 110, 29–50. doi:10.1016/j.advwatres.2017.09.028
Weier, J., and Herring, D. (2000). “Measuring Vegetation (Ndvi & Evi),” in NASA Earth Observatory. Washington, DC: NASA Earth Observatory, 20.
Wittmann, F., Junk, W. J., and Piedade, M. T. F. (2004). The Várzea Forests in Amazonia: Flooding and the Highly Dynamic Geomorphology Interact with Natural Forest Succession. For. Ecol. Manage. 196, 199–212. doi:10.1016/j.foreco.2004.02.060
Wittmann, F., Schöngart, J., and Junk, W. J. (2010). “Phytogeography, Species Diversity, Community Structure and Dynamics of Central Amazonian Floodplain Forests,” in Amazonian Floodplain Forests (Dordrecht: Springer), 61–102. doi:10.1007/978-90-481-8725-6_4
Worbes, M. (1997). “The Forest Ecosystem of the Floodplains,” in The Central Amazon Floodplain (Berlin, Germany: Springer), 223–265. doi:10.1007/978-3-662-03416-3_11
Xiao, X., Hollinger, D., Aber, J., Goltz, M., Davidson, E. A., Zhang, Q., et al. (2004a). Satellite-Based Modeling of Gross Primary Production in an Evergreen Needleleaf Forest. Remote Sensing Environ. 89, 519–534. doi:10.1016/j.rse.2003.11.008
Xiao, X., Zhang, Q., Braswell, B., Urbanski, S., Boles, S., Wofsy, S., et al. (2004b). Modeling Gross Primary Production of Temperate Deciduous Broadleaf Forest Using Satellite Images and Climate Data. Remote Sensing Environ. 91, 256–270. doi:10.1016/j.rse.2004.03.010
Xiao, X., Zhang, Q., Saleska, S., Hutyra, L., De Camargo, P., Wofsy, S., et al. (2005). Satellite-Based Modeling of Gross Primary Production in a Seasonally Moist Tropical Evergreen Forest. Remote Sensing Environ. 94, 105–122. doi:10.1016/j.rse.2004.08.015
Zarfl, C., Lumsdon, A. E., Berlekamp, J., Tydecks, L., and Tockner, K. (2015). A Global Boom in Hydropower Dam Construction. Aquat. Sci. 77, 161–170. doi:10.1007/s00027-014-0377-0
Keywords: tropical riparian vegetation, floodplain monitoring, regulated rivers, satellite image analysis, dam regulation, vegetation indeces, gross primary production
Citation: Salerno L, Moreno-Martínez Á, Izquierdo-Verdiguier E, Clinton N, Siviglia A and Camporeale C (2022) Satellite Analyses Unravel the Multi-Decadal Impact of Dam Management on Tropical Floodplain Vegetation. Front. Environ. Sci. 10:871530. doi: 10.3389/fenvs.2022.871530
Received: 08 February 2022; Accepted: 18 March 2022;
Published: 10 May 2022.
Edited by:
Edoardo Daly, Monash University, AustraliaReviewed by:
Neil Sims, Commonwealth Scientific and Industrial Research Organisation (CSIRO), AustraliaAlban Kuriqi, Universidade de Lisboa, Portugal
Copyright © 2022 Salerno, Moreno-Martínez, Izquierdo-Verdiguier, Clinton, Siviglia and Camporeale. This is an open-access article distributed under the terms of the Creative Commons Attribution License (CC BY). The use, distribution or reproduction in other forums is permitted, provided the original author(s) and the copyright owner(s) are credited and that the original publication in this journal is cited, in accordance with accepted academic practice. No use, distribution or reproduction is permitted which does not comply with these terms.
*Correspondence: Luca Salerno, bHVjYS5zYWxlcm5vQHBvbGl0by5pdA==