 Fan Yang
 Yongrok Choi
 Hyoungsuk Lee
 Jahira Debbarma
- 1Program in Industry Security Governance, Inha University, Incheon, South Korea
- 2Graduate School of Energy and Environment (KU-KIST Green School), Korea University, Seoul, South Korea
Regulatory policies are indispensable to efficiently curbing anthropogenic CO2 emissions and sustainably producing emission-intensive goods. Though previous modelling practice has studied the cost and benefit of different regulatory policies, such as command-and-control (CAC) and emission trading scheme (ETS), little is known about that for overlapped emission regulation policies. Here, we built up a Data Envelopment Analysis model to study the losses and gains from the overlapped implementation of CAC and ETS for Korean coal-fired power plants during 2011–2015. We showed that the initial phase of CAC in 2012 caused a sudden loss in power plants’ output, but that the loss was gradually eliminated in 2013 and 2014. Upon promulgation in 2015, ETS is expected to increase only 0.990% of output compared to CAC, yet it largely failed to deliver the potential benefit in its first year. The overlapped implementation of CAC and ETS contributes to a small share (5.567%) of the unrealized benefit. Nonetheless, we showed that implementing CAC and ETS in parallel tends to disproportionately affect less efficient power plants by restricting their strategies to meet regulatory measures. Therefore, we suggest that the integration of CAC and ETS can be a transitory measure as ETS provides only marginal welfare benefits, but ETS must be fully adopted and strengthened in the near future to economically and equitably mitigate CO2 emissions.
Introduction
CO2 emissions regulation spurs green technology innovation, which subsequently induces economy-wide energy savings and productivity growth (Magazzino et al., 2022; Shahzad et al., 2022; Song et al., 2022). For emissions regulation, command-and-control (CAC) system has been a predominant instrument pursued by industrial economies in the 1980s, where firms are required to limit their emissions below an authorized maximum emission level (Opschoor and Vos, 1989). Alternatively, for CO2 emissions regulation, carbon pricing and emission trading (ET) have prevailed ever since its advent in the Kyoto Protocol, due to their cost-effectiveness. Theoretically, any emission controls, no matter CAC or ET, will pose economic costs to regulated entities as they will have to pay for additional efforts to regulate emissions. However, ET creates tradable emission permits and an emission trading market to allow emission-controlling entities to sell or buy emission permits such that they can comply with a centrally authorized emission controlling target. It is capable of equalizing marginal abatement of anthropogenic CO2 emissions across all carbon emitters, so that lower overall cost of emission regulation. The mechanism contrasts with CAC policy instruments, where administrative measures are directly posed to emission-heavy entities to mandate their emission upper bound, causing staggered cost to different firms (Tietenberg and Tietenberg, 1985; Stavins, 2003).
A number of studies have attempted to estimate costs of CAC emission regulations and savings from alternative ET programs. For example, Yang et al. (2021) studied the cost of CAC regulation on Chinese transport sector, and found that the regulation has cost China around 2000 billion RMB during 2013–2017. Zhang and Xie (2015) found that CAC regulation on Chinese information technology industry could potentially cost China up to 29.3 billion RMB. Some have focused on the savings of ET. Brännlund et al. (1998) estimated the potential gains of the Swiss pulp industry from oxygen-demanding substance emission trading in 1989 to be 6%. Färe et al. (2013) studied potential gains from air pollutant ET in the US and found that spatial trading of air pollutants potentially increased the profits of all coal-fired power plants by 3–6%. Later works concentrated on CO2 emissions, the primary cause of global warming and climate change. Wang et al. (2016) estimated potential CO2 emission abatement cost savings in the context of the Chinese national emission trading market. They suggested that implementing national CO2 emission trading would save 10.78% of GDP losses from emission mitigation in China over 2006–2010. Subsequently, Xian et al. (2019) estimated that the abatement cost savings with ET in China would be 13% on average during 2011–2015.
Existing papers have mostly pitted ET against CAC regulations, frequently claiming ET is more or less superior to CAC regulations. However, they have rarely paid enough attention to the interaction of emission trading and command-and-control. Yet, there are a number of examples being displayed in real-world policy experiments. For example, Korea has been implementing its CAC-style emission controlling strategy (Target Management System, TMS) in parallel to ET (Park and Hong, 2014). In Europe, a number of direct emission regulation policies are also simultaneously implemented despite the existence of the EU ETS (Braathen, 2011). A variety of considerations are in place when mixing ET and CAC. For example, ET may lead to carbon leakage in some specific sectors (Zhou et al., 2020), transaction costs involved in ET may be cost-prohibitive for small emitters (JaraitĖ et al., 2011; Park and Lee, 2020), and the like. Only few have studied the interaction of different emission regulation mechanism. For instance, Goulder and Stavins (2010) conducted an ex-ante explorative analysis of the interaction between state policies and federal policies, where impact of the interaction was found depends on specific designs, such as coverage, stringency, of policies at different levels. So far, there remains insufficient empirical studies on the cost and benefit of mixing the two regulatory mechanisms, raising concerns over the inefficiency of such a hybrid policy setting (Stavins, 2021).
Furthermore, the distributional effect of emission regulations is of tremendous concern. As put forward by Eskeland and Jimenez (1992), distributional effect analysis could inform government alternative policies that may gain the largest political support. Commonly, CAC policy instruments, which set a common emission standard for technologically heterogeneous firms, are often deemed inequitable as they restrain factor mobility and pose a disproportionally high financial burden on technologically unprepared entities (Stavins, 2003). In contrast, ET equalizes marginal abatement costs—the additional costs incurred by one incremental emission reduction—through emission permit transactions (Montgomery, 1972). In this way, firms with lower abatement costs will take action first and render emission allowances surplus. Firms with higher abatement costs will buy additional allowances from those low-abatement-cost firms. Thus, the systemic cost of all market participants is at its lowest level. The argument underlies the thriving emission trading market globally. However, empirical evidence shows that those regulations tend to be regressive (Ohlendorf et al., 2020). Big companies with an increasing return of scale tend to participate in the emission trading market more proactively and enjoy much more benefit from ET compared with their smaller counterparts, thus rendering exacerbated inequality among participating entities compared with CAC (JaraitĖ et al., 2011). This aligns with the empirical evidence by (Heindl, 2012), who found an scale effect on transaction costs among firms participating in EU ETS. Therefore, the policy practice of mixing ET and CAC steps in. Beyond this, there has been a lack of an appropriate model quantifying the distributional effect of mixing CAC and ET.
This paper contributes to existing literature by building an operational model to analyze the cost and benefit of CAC and ET, and that in the overlapped scenario. This paper is a step forward from our previous paper (Yang et al., 2021). Here, we can not only analyze the costs and benefits of CAC, but also that of ET, and the mix of ET and CAC. Another strength of our model is that it is capable of conducting cost-benefit analysis at firm or utility levels, in contrast to previous models that adopt macroeconomic data (Choi et al., 2017). It can therefore provide a more granular cost-benefit estimate at a sub-sector level. We take emission regulation of coal-fired power plants in South Korea (hereafter, Korea) as a case study and examine the costs and benefits of the Korean target management system (TMS), a CAC emission regulation mechanism, and the Korean ETS, a cap-and-trade system, as well as the distributional effect of implementing ET and CAC in parallel.
Our paper is organized as follows: theoretical models to quantify the costs and benefits of different emission regulations are presented in Section 2; the Korean policy background of emission regulation and data for calculation are presented in Section 3; empirical results are presented in Section 4; and discussions on potential extensions and limitations of our theoretical models and empirical findings are presented in Section 5.
Theoretical Model
We start by constructing a homogenous environmental production technology set, T. We denote exogenous inputs,
where, in the Data Envelopment Analysis (DEA) formulation,
No Emission Regulation
Based on the DEA formulation of environmental production technology, we can first simulate maximum potential economic output if the technical inefficiency of each decision-making unit (DMU) is eliminated, considering undesirable output as freely disposable, which is a scenario for unregulated environmental technology (Färe and Grosskopf, 1983; Wang and Feng, 2014; Färe et al., 2016).
DMUs can freely dispose of their undesirable outputs under the current model specification. The assumption of non-negativity for the intensity variables,
Command-And-Control
In addition, if we assume null-jointness and weak disposability for desirable and undesirable outputs:
1) For
2) For
Then, we can simulate production activities under emission regulation with command-and-control policies (Färe et al., 2013; Zhang and Zhang, 2018; Yang et al., 2021; Zhao et al., 2022). Considering N decision making units (DMUs) with I inputs, S undesirable outputs, and one desirable output. For each DMU n, the maximum output under command-and-control policies can be expressed as:
The equality constraints,
Under the current specification, each DMU can maximize its desirable output,
Emission Trading
We can further extend the operational model to simulate emission trading. Consider a central regulator that inspects the emissions of all the participating entities. The total emissions from all the entities must comply with the upper limit set by the regulator, while those entities can freely trade their emissions at no transactional cost. We formulate a centralized DEA model as follows to estimate the cost and benefit of participating DMUs in the emission trading scenario:
s. t.
…
In Equation 4,
It should be noted that Equation 4 models the maximum gains that any cap-and-trade programs can reap, i.e., a perfect market where trading is allowed without any barriers or transaction costs. It mimics the condition in which an overall emission cap is enforced by the central regulator while no cap is set for market participants. This market design can, therefore, be interpreted as emission trading with auctioning in the market. Efficient bargaining is achieved under the current model specification, where each entity can attain an efficient level of emission allowance (Cramton and Kerr, 2002).
Integrating Emission Trading and Command-And-Control
A common practice in emission trading or cap-and-trade programs is the free allocation of a portion of emission allowances to individual trading entities in the emission trading market, which existed in the initial phase of ETS to lower political barriers for its implementation (Helm, 2010). However, to regulate the overall emission cap, emission trading is often implemented in parallel to command-and-control regulation. In this scenario, binding caps are often set for each regulating entity, usually at a ratio of its historical emissions. Based on the emission trading model, we can further extend the integration of emission trading and command-and-control as follows:
s. t.
…
The model features a variation of the emission trading model by Färe et al. (2013). First, a common practice is that market regulators may retain a certain percentage of the total emission allowance for the purpose of market stabilization (Park and Hong, 2014). Hence, the total amount of cap emissions,
Again, due to the fact that the current work considered only CO2 emissions, no additional constraints were posed to DMUs on other undesirable outputs. But the model can be easily extended to a case where data for multiple undesirable outputs is available. Furthermore, the model can also be easily generalized to an inter-temporal and inter-spatial model, similar to the case of Färe et al. (2013), which simulates an emission trading scheme where borrowing and banking are allowed (Boemare and Quirion, 2002). We leave it to future research.
Policy Background and Data
Policy Background
Korea announced its national CO2 emission abatement target in 2008, which aimed at cutting 30% of CO2 emissions by 2020 compared to a business-as-usual scenario. Therefore, in 2010, a presidential decree ratified the target and established the TMS, a command-and-control policy setting that was initiated in 2011 and formally began to operate in 2012, which directly enforced firms’ compliance with emission reduction targets (Park and Hong, 2014). Major energy producers were all included in TMS. Following the enactment of TMS, there was the promulgation of the Act on the Allocation and Trading of Greenhouse Gas Emission Allowances (ETS Act) in 2012, which began its trading in 2015, 3 years after TMS. The two regulatory schemes operate in parallel but cover mostly different categories of entities. The ETS act covers the major emitters of CO2, while TMS complements it with smaller but still relatively large (or medium-sized) emitters as well as public organizations that cannot be easily workable in ETS. Nonetheless, there are still chances for any DMU to overlap in this parallel system. For example, the company may participate in ETS as a major player, while one of the facilities of the company may be located under TMS. From the managerial perspective, therefore, strategic consideration may happen in these overlapping cases, and all the other companies may consider this kind of by-passing way between ETS and TMS, resulting in the integrated, yet parallel governance of the emission management policies. The Korean government may consider the TMS as a complementary mechanism to support higher abatement of ETS, but in reality, it allows the participating companies in ETS to enter the TMS. Nonetheless, TMS has a different condition as an additional target of energy consumption, which is not in the ETS, resulting in a very complicated, yet complex alleyway between these two measures.
The first commitment period of the ETS system is designated to begin on 1 January 2015 (Oh et al., 2016). For the initial allowance allocation, 100% of the previous year’s emissions were retained as the total allowance, with an additional 3% of the total allowances being set aside as a reserve for market stabilization. For the second allowance period between 2018 and 2020, 97% of the allowance was freely allocated to each entity, with a 3% abatement target to be tradable in the ETS market. ETS entered the third stage in 2021, with 90% of the free allowance and a 10% abatement target to be tradable in the market. In the year 2021, the initial year of the third stage, the participating entities in ETS will be 684, with a total allowance of 2.9 billion CO2. Among those abatement targets, 18.2 million tons are allocated as tradable allowances, implying that 10.8 million tons, or 62.8% of total allowances, are reserved for the government. As a parallel measure, the entities under TMS comprise 403 members in the private sector and 837 entities in the public sector in the year 2021.
Data
From the year 2011 till the year 2015, we collected and used only data for coal-fired power plants in Korea. This data fits the homogeneity assumption of environmental production technology. Therefore, there is no need to consider heterogeneity in the modelling of the production technology. The sample period includes the first year of no regulation, the three following consecutive years of command and control regulation, and the latest year of emission trading. In total, 258 observations were collected. The observations consist of two inputs (unit capacity in kW and energy usage in kcal), one desirable output (net electricity generation in MWh), and one undesirable output (CO2 emissions in tons). The data was obtained from Statistics of Electric Power in Korea (2016). CO2 emissions were calculated using IPCC emission factors, provided by Zhang and Choi (2013). Table 1 reports descriptive statistics for inputs and outputs in the study period.

TABLE 1. Descriptive statistics of data for Korean coal-fired power plants from 2011 to 2015.
Results
Overall Effect of Different Emission Regulation Strategies
Figure 1 shows the cumulative desirable output—electricity generation—of all the coal fired power plants in each year under different environmental regulation scenarios. Depending on the regulatory strategy of the scenarios, the implications of the results vary.
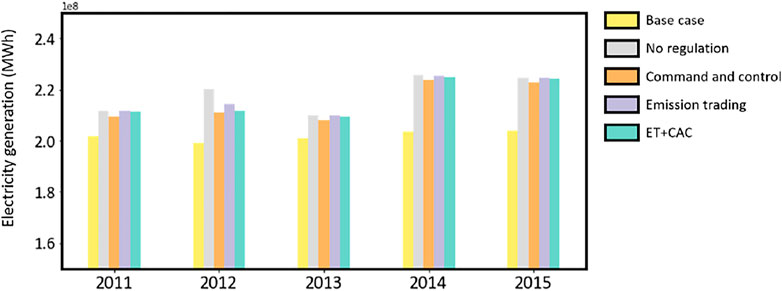
FIGURE 1. Total electricity generation of Korean coal-fired power plants under different emission regulation scenarios. The base case scenario represents real electricity generation for power plants; the no regulation scenario stands for eliminating technical efficiency for power plants without emission regulation; the command and control scenario represents a scenario where technical efficiency is eliminated but emissions must be restricted to the current level; the emission trading scenario stands for the case where overall emissions of all power plants are restricted to the current level but emissions are tradable; and ET + CAC refers to the scenario where emission trading and command-and-control are implemented in parallel.
If no environmental regulations were posed (Korea in 2011), Equation 2 calculates the maximum potential output each coal power plant can attain under current input constraints. Thus, its difference with the base case represents the maximum electricity production of Korean coal-fired power plants if technical inefficiency is eliminated. The difference between Equation 3 and 2 is the opportunity cost each power plant may bear to implement CAC regulation on their emissions and restrict them to the observed level. The difference between equation 4 and 2 is the potential costs and benefits an emission trading system brings about for these power plants. While the difference between Equation 5 and 2 is the potential cost of additional CAC regulation combined with the ETS.
If environmental regulation has already been forced on those coal-fired power plants (Korea from 2012 to 2014), the difference between Equation 3 and 2 implies potential gains from rescinding current environmental regulations. The cost and benefit of rescinding existing regulations can be substantially different from implementing a new regulation (Evans et al., 2021). When rescinding an existing regulation, compliance costs have already sunk. No immediate benefit will be paid to entities that comply. Besides, upon the elimination of a regulation, market conditions and technologies have already changed. Previously profitable operational conditions may not be viable at the time of rescinding the regulation. The difference between Equation 4 and 3 is the maximum potential economic benefit the whole trading system can reap by mobilizing productive factors in these environmentally regulated power plants. And the difference between Equation 5 and 3 is the gains the trading system as a whole can reap with additional binding on the emission cap of each power plant.
Furthermore, if an ETS has already been implemented (Korea in 2015), the difference between Equation 4 and 3 explains the foregone benefits of emission trading. The foregone benefits, different from the potential benefits in a no emission trading setting, explain potentially existing transactional barriers, e.g., transaction costs rendered by collecting information, bargaining and deciding, and monitoring and enforcement, that prohibit a competitive market from exerting its full power to maximize factor allocation efficiency (Stavins, 1995). The difference between Equation 5 and 4 represents potential costs—the emission abatement costs and market efficiency losses—with the overlap of command-and-control regulation and emission trading.
As shown in Figure 1, the potential output increase from eliminating technical inefficiency in power plant operations is on average 7.434% (no regulation case). Upon implementing command-and-control CO2 emission regulation, an increase in technical inefficiency can be seen in 2012 (9.548%), which is largely due to the curtailment of existing coal-fired power plants to meet the CO2 emission target (201.8 TWh of electricity generation in 2011 versus 199.3 TWh of electricity generation in 2012). While the sudden increase (9.706%) of technical inefficiency from 2013 to 2014 is due to the installation of a new megawatt-scale power generation unit.
We then compare the difference between the no regulation scenario and with the command-and-control scenario. In 2011, no CO2 emission regulations were posed to Korean coal-fired power plants, and thus the difference between these two models represents the potential cost of implementing emission regulations. The potential cost in 2011 is estimated to be only 0.969% at the time of implementing CAC (TMS). However, as the TMS regulation was implemented in 2012, the potential benefit of rescinding the policy was raised to 4.386% of total electricity generation, revealing that the emission regulation policy presents a major hurdle to power plants’ production activities. However, the potential benefit of rolling back emission regulation shrank to 0.757% in 2014, suggesting that power plants rapidly reflected the command-and-control regulation and substantially improved their environmental technology to comply with the emission standard, such that the negative effect of emission regulation was alleviated. Furthermore, the potential benefits of rescinding emission regulation are the lowest in 2015, suggesting that emission trading has effectively lowered the overall cost of compliance.
In addition, we can see that emission trading has the potential to increase output by 0.990% on average in those power plants during the TMS regulation period (2012–2014). However, most of the promised benefits have not materialized. In 2015, the ETS was implemented in Korea. Yet, the potential output under the emission-trading model (emission trading with no trading friction) is still 0.861% higher than the command-and-control model. The persistent gap between the command-and-control model and the emission-trading model suggests that little or no efficiency increase is achieved through the first-year of emission trading at least. In contrast, over 85% of the promised efficiency increase by emission trading has not been realized. Färe et al. (2013) suggest that the gap—the foregone benefit in the emission trading scheme—represents the upper limit of transaction costs involved in emission trading, which impedes participating entities from sufficient trades in the allowance market to reach an efficient status. The results indicate that the transaction cost in the Korean emission trading market is on a non-negligible scale. Efforts must be made to alleviate this huge cost so it boosts the potential of emission trading more effectively.
Furthermore, the integration of command-and-control and emission trading requires a cap that restrains plants’ emissions at their observed levels. In this way, we can distinguish the effect of binding emission caps on the foregone emission trading benefit, which can be accounted for as a regulatory cost when integrating command-and-control and emission trading. Our results show that electricity generation under the integrated model in 2015 was about 224.5 TWh, compared to 224.6 TWh for the emission trading model and 222.7 TWh for the command-and-control model. Command-and-control regulation deviates emission trading from its efficient level, accounting for only 5.567% of the total unrealized gains under emission trading in 2015.
Another concern is marginal abatement cost under different emission regulation schemes. The marginal abatement cost could dictate the policy-making over emission mitigation (Wu and Ma, 2018). Besides, marginal abatement cost curves is a widely accepted tool to characterize the overall cost if a certain level of abatement is to be achieved (Kesicki and Strachan, 2011). Figure 2 presents the marginal abatement cost curve—abatement cost denominated by electricity generation losses under different levels of binding emission cap setting—for Korean coal power. Interestingly, electricity output reduction does not linearly respond to a tighter emission cap, indicating a diminishing rate of increase in the marginal abatement costs at a certain point. The marginal cost of reducing the first 1% of emissions (cap from 100 to 99%) under the emission trading and cap mechanism is 0.098% of electricity generation decreased; while the last 1% of emissions reduction (cap from 2 to 1%) costs as much as 2.18% of electricity generation. If policymakers were to regulate emissions levels with the current level (the 2015 level) of electricity generation (minimizing undesirable output while keeping the current desirable output), an emission cap and trading scheme could cut about 46% of CO2 emissions.
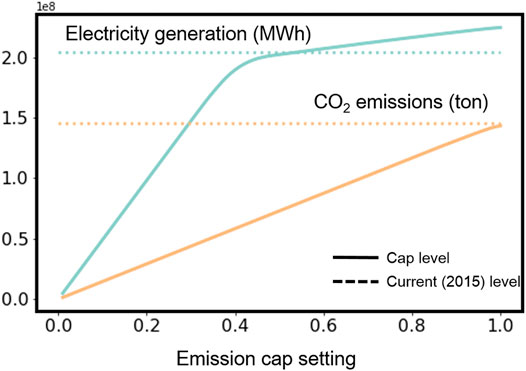
FIGURE 2. Electricity generation and CO2 emissions under different levels (1–100% of 2015 power plant emission level) of emission cap settings with mixed emission trading (ET) and command-and-control (CAC) policy. The cyan solid line indicates the maximum electricity generation under different CAC cap settings. The orange solid line indicates CO2 emissions at the level of the CAC cap setting. The dot lines indicate the current levels (in 2015) of electricity generation and CO2 emissions.
Distributional Effect of Different Emission Regulation Strategies
This distributional effect of an emission regulation policy is also of paramount importance to policy makers. A progressive emission regulation policy would prevail and is politically more tenable, since it delivers the good to the larger (Eskeland and Jimenez, 1992). Figure 3 presents the distribution of output gains (or losses) by power plants from emission trading. Detailed results are shown in Appendix Supplementary Table A1. In the emission trading scenario, Korean coal-fired power plants could, in total, increase electricity output by 1.934 TWh of potential electricity output without increasing CO2 emissions. All the participating units will at least be better off in the emission trading scenario. Five power plants reap a dominant share of the total gains. They will increase their electricity output by 1.333 TWh in the emission trading scenario compared with the command-and-control scenario, equivalent to 68.9% of the total benefit from ET.
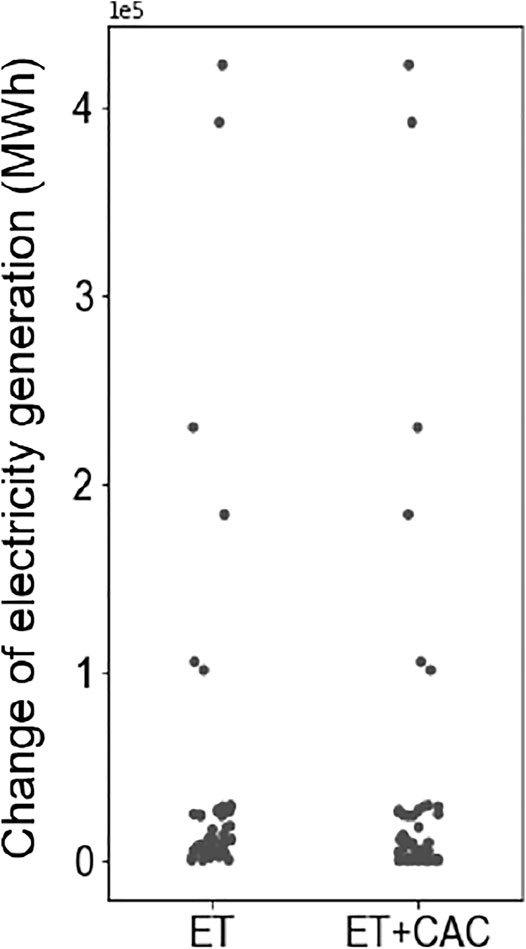
FIGURE 3. Changes of each power plant in electricity generation under the emission trading scenario and the mixed emission trading and command-and-control (ET + CAC) scenario.
Upon integrating CAC with ET, those that reap the dominant gains of ET tend not to be affected by additional CAC. But there are another 15 power plants whose welfare will be disproportionately affected. In total, these 15 power plants generated 71.95 TWh of electricity in 2015 (equivalent to 38.9% of total electricity generation). In the emission trading scenario, their total gains are 0.108 TWh, which is barely 8.10% of the total gains from emission trading. In the CAC + ET scenario, their potential gains are reduced to zero. This is due to the fact that the CAC restricts their strategies to response to emission mitigation compliance. In the emission trading scenario, they may buy residual emission allowances left by those efficient producers so that they can expand their production capacity. Under the ET + CAC scenario, fewer emission allowances will be available in the market due to the restriction of CAC. Those efficient producers will retain their additional un-used allowances. Finally, those less efficient producers acquire a smaller number of allowances, thus bearing the cost of CAC. Therefore, the implementation of ET + CAC may result in disproportionately high costs for a part of the market due to the invalidation of abatement cost equalization by CAC.
Discussions and Policy Implications
Large-scale rollbacks of US environmental regulation by the Trump administration (Popovich et al., 2020) in late 2020 raised concerns over the potential costs and benefits of the back-and-forth of environmental regulation around the globe. In this paper, we built a framework to retrospectively measure the costs and benefits of different emission regulation mechanisms, including CAC emission regulation, ET, and the integration of CAC and ET. In this framework, we are able to quantify the potential costs and benefits of not only implementing but also rescinding an emission regulation scheme. By operationalizing coal power plants in the DEA model, we can further analyze the distributional effect of those emission regulation schemes. Using CO2 emission regulation in Korean coal-fired power plants as a case study, our empirical findings are as follows.
First, CAC emission regulation in the initial phase caused a heavy loss to Korean coal power plants, leading to a substantial technical efficiency drop. However, along with the enforcement of CAC during 2012–2014, power plants were able to advance their production technologies and operate at a higher-efficiency status while complying with the emission regulation. Therefore, the cost of CAC emission regulation diminished over time. We concluded that the benefit of rescinding the existing emission regulation is trivial. The Korean government should not consider following US practice and rolling back current regulations (the TMS system). Instead, policymakers may advance emission regulations based on the TMS to boost its benefits. An ongoing practice is moving those participating entities into the ETS group.
Second, we found that the potential gains from emission trading in Korean coal-power plants were quite marginal—only a 0.990% of output increase in the ET scenario. This is much lower than in the United States (Färe et al., 2013), China (Xian et al., 2019), and Switzerland (Brännlund et al., 1998). Furthermore, although ETS has been implemented in Korea since 2015, it has not brought about the promised efficiency increase. One critical reason is that institutional designs impede trade in emission allowance trading market (Stavins, 1995). In particular, we examined whether integrating ET with CAC, as a currently existing policy practice by Korea government, would cause substantial output losses. We show that implementing ET and CAC in parallel contributes to only 5.567% of the total electricity output loss. Hence, we suggest that integrating TMS and ETS in Korea is advisable due to its negligible efficiency loss. Lessons learned from the simultaneous implementation of EU ETS and direct regulation in Europe could be used to improve the integration of Korean TMS and ETS (Boemare and Quirion, 2002).
Third, though ET leads to a redistribution of welfare among these power plants, our results show that all the entities in the emission trading market will get better off. Nonetheless, efficient entities will reap many more benefits from emission trading schemes because of their high allocative efficiency. Proper market design must also take into account the distributional effect of emission trading. We also show that ET + CAC does not provide more benefit to inefficient power plants. Instead, CAC will disproportionately affect those low-efficiency power plants, as it restricts the strategy of those power plants to a response to the emission mitigation mandate. Therefore, we suggest Korea gradually abandon CAC and transit to a complete ETS for the purpose of not only economically reducing emissions but also providing equitable opportunities to those inefficient entities to benefit from emission trading.
A limitation of our model is that it does not fully cover participating entities in the Korean TMS and ETS emission regulation schemes. The first-year (2015) implementation of the ETS covered around 573 Mt of CO2 emissions (Oh et al., 2016), yet our current data covered only coal-fired power plants with 149 Mt of CO2 emissions. One step forward from our current model is to include both coal-fired power plants and non-coal-fired (such as renewable energy) power plants in emission trading. However, the modelling framework must take into consideration the technological heterogeneity of different types of power plants. To do these, the meta-frontier centralized data envelopment analysis model may be considered (Choi et al., 2020a; Choi et al., 2020b; Li and Wei, 2021).
Some elements in CO2 emission regulation policies have been neglected in the modelling, one of which is transaction cost (Färe et al., 2013). The existence of transaction costs shifts the equilibrium of emission trading, which could explain some of the unrealized gains in emission trading. The significance of transaction cost in determining the effectiveness of emission trading schemes for Korean power plants requires further research (McCann et al., 2005).
Besides, our current study may be subject to data scarcity of other production factors. Electricity generation in coal-fired power plants generates an array of harmful pollutants simultaneously. Including constraints on other emissions has mixed effects on final outcomes (Färe et al., 2014; Ma and Hailu, 2016). To avoid the balloon effect, a more detailed study should incorporate all kinds of emissions as undesirable outputs in modelling practice. Labor is also not included due to a lack of data. It is desirable to include labor data so as to study the effect of labor mobility on emission trading behaviors of power plants (Färe et al., 2013).
Data Availability Statement
Interested readers may retrieve codes and data through FY’s Github repository at https://github.com/panday1995/2021_Korean_Emission_trading.
Author Contributions
FY, HL and YC contributed to conception and design of the study. FY and HL organized the database. FY performed the statistical analysis. FY wrote the first draft of the manuscript. All authors contributed to manuscript revision, read, and approved the submitted version.
Conflict of Interest
The authors declare that the research was conducted in the absence of any commercial or financial relationships that could be construed as a potential conflict of interest.
Publisher’s Note
All claims expressed in this article are solely those of the authors and do not necessarily represent those of their affiliated organizations, or those of the publisher, the editors and the reviewers. Any product that may be evaluated in this article, or claim that may be made by its manufacturer, is not guaranteed or endorsed by the publisher.
Supplementary Material
The Supplementary Material for this article can be found online at: https://www.frontiersin.org/articles/10.3389/fenvs.2022.877823/full#supplementary-material
References
Boemare, C., and Quirion, P. (2002). Implementing Greenhouse Gas Trading in Europe: Lessons from Economic Literature and International Experiences. Ecol. Econ. 43, 213–230. doi:10.1016/s0921-8009(02)00213-6
Braathen, N. A. (2011). Interactions Between Emission Trading Systems and Other Overlapping Policy Instruments. OECD, Paris: General Distribution Document, Environment Directorate. Available at: www.oecd.org/env/taxes.
Brännlund, R., Chung, Y., Färe, R., and Grosskopf, S. (1998). Emissions Trading and Profitability: the Swedish Pulp and Paper Industry. Environ. Resource Econ. 12, 345–356.
Choi, Y., Lee, H., and Debbarma, J. (2020a). Are Global Companies Better in Environmental Efficiency in India? Based on Metafrontier Malmquist CO2 Performance. Sustainability 12, 8359. doi:10.3390/su12208359
Choi, Y., Liu, Y., and Lee, H. (2017). The Economy Impacts of Korean ETS with an Emphasis on Sectoral Coverage Based on a CGE Approach. Energy Policy 109, 835–844. doi:10.1016/j.enpol.2017.06.039
Choi, Y., Yang, F., and Lee, H. (2020b). On the Unbalanced Atmospheric Environmental Performance of Major Cities in China. Sustainability 12, 5391. doi:10.3390/su12135391
Cramton, P., and Kerr, S. (2002). Tradeable Carbon Permit Auctions. Energy Policy 30, 333–345. doi:10.1016/s0301-4215(01)00100-8
Eskeland, G. S., and Jimenez, E. (1992). Policy Instruments for Pollution Control in Developing Countries. World Bank Res. Obs 7, 145–169. doi:10.1093/wbro/7.2.145
Evans, M., Palmer, K., Aldy, J., Fowlie, M., Kotchen, M., and Levinson, A. (2021). The Role of Retrospective Analysis in an Era of Deregulation: Lessons from the US Mercury and Air Toxics Standards. Rev. Environ. Econ. Pol. 15, 163–168. doi:10.1086/712887
Färe, R., Grosskopf, S., and Pasurka, C. A. (2014). Potential Gains from Trading Bad Outputs: The Case of U.S. Electric Power Plants. Resource Energ. Econ. 36, 99–112. doi:10.1016/j.reseneeco.2013.11.004
Färe, R., Grosskopf, S., and Pasurka, C. A. (2013). Tradable Permits and Unrealized Gains from Trade. Energ. Econ. 40, 416–424. doi:10.1016/j.eneco.2013.07.015
Färe, R., Grosskopf, S., and Pasurka, C. (2016). Technical Change and Pollution Abatement Costs. Eur. J. Oper. Res. 248, 715–724. doi:10.1016/j.ejor.2015.07.040
Goulder, L. H., and Stavins, R. N. (2010). Interactions between State and Federal Climate Change Policies. Discussion Paper 2009-17. Cambridge, MA: Harvard Environmental Economics.
Heindl, P. (2012). Transaction Costs and Tradable Permits: Empirical Evidence from the EU Emissions Trading Scheme. ZEW Discussion Papers 12-021. ZEW - Leibniz Centre for European Economic Research.
Helm, D. (2010). Government Failure, Rent-Seeking, and Capture: the Design of Climate Change Policy. Oxford Rev. Econ. Pol. 26, 182–196. doi:10.1093/oxrep/grq006
JaraitĖ, J., Convery, F., and Di Maria, C. (2011). Transaction Costs for Firms in the EU ETS: Lessons from Ireland. Clim. Pol. 10, 190–215. doi:10.3763/cpol.2009.0659
Kesicki, F., and Strachan, N. (2011). Marginal Abatement Cost (MAC) Curves: Confronting Theory and Practice. Environ. Sci. Pol. 14, 1195–1204. doi:10.1016/j.envsci.2011.08.004
Li, Y., and Wei, Y. (2021). Estimating the Potential Co2 Emission Reduction in 97 Contracting Countries of the Paris Agreement. Clim. Change Econ. 12, 2150004. doi:10.1142/s2010007821500044
Ma, C., and Hailu, A. (2016). The Marginal Abatement Cost of Carbon Emissions in China. Energ. J. 37, 111–127. doi:10.5547/01956574.37.si1.cma
Magazzino, C., Mele, M., Schneider, N., and Shahzad, U. (2022). Does export Product Diversification spur Energy Demand in the APEC Region? Application of a New Neural Networks experiment and a Decision Tree Model. Energy and Buildings 258, 111820. doi:10.1016/j.enbuild.2021.111820
McCann, L., Colby, B., Easter, K. W., Kasterine, A., and Kuperan, K. V. (2005). Transaction Cost Measurement for Evaluating Environmental Policies. Ecol. Econ. 52, 527–542. doi:10.1016/j.ecolecon.2004.08.002
Montgomery, W. D. (1972). Markets in Licenses and Efficient Pollution Control Programs. J. Econ. Theor. 5, 395–418. doi:10.1016/0022-0531(72)90049-x
Oh, H., Hyon, J., and Kim, J.-O. (2016). Korea's Approach to Overcoming Difficulties in Adopting the Emission Trading Scheme. Clim. Pol. 17, 947–961. doi:10.1080/14693062.2016.1213696
Ohlendorf, N., Jakob, M., Minx, J. C., Schröder, C., and Steckel, J. C. (2020). Distributional Impacts of Carbon Pricing: A Meta-Analysis. Environ. Resource Econ. 78, 1–42. doi:10.1007/s10640-020-00521-1
Opschoor, J. P., and Vos, H. (1989). The Application of Economic Instruments for Environmental Protection in OECD Member Countri. Paris: Organization for Economic Cooperation and Development.
Park, H., and Hong, W. K. (2014). Korea׳s Emission Trading Scheme and Policy Design Issues to Achieve Market-Efficiency and Abatement Targets. Energy Policy 75, 73–83. doi:10.1016/j.enpol.2014.05.001
Park, H., and Lee, M. (2020). Factors Determining Firms' Trading Decision in the Korea ETS Market. Environ. Econ. Pol. Stud 23, 557–580. doi:10.1007/s10018-020-00281-8
Popovich, N., Alebeck-ripka, L., and Pierre-louis, K. (2020). The Trump Administration Rolled Back More than 100 Environmental Rules. New York: New York Times.
Shahzad, U., Ferraz, D., Nguyen, H.-H., and Cui, L. (2022). Investigating the Spill Overs and Connectedness between Financial Globalization, High-Tech Industries and Environmental Footprints: Fresh Evidence in Context of China. Technol. Forecast. Soc. Change 174, 121205. doi:10.1016/j.techfore.2021.121205
Song, M., Peng, L., Shang, Y., and Zhao, X. (2022). Green Technology Progress and Total Factor Productivity of Resource-Based Enterprises: A Perspective of Technical Compensation of Environmental Regulation. Technol. Forecast. Soc. Change 174, 121276. doi:10.1016/j.techfore.2021.121276
Stavins, R. N. (2003). Experience with Market-Based Environmental Policy Instruments. Handbook Environ. Econ. 1, 355–435. doi:10.1016/s1574-0099(03)01014-3
Stavins, R. N. (2021). Lessons Learned from Sub-National Emissions Trading Systems. Cambridge, MA: Harvard Project on Climate Agreements.
Stavins, R. N. (1995). Transaction Costs and Tradeable Permits. J. Environ. Econ. Manag. 29, 133–148. doi:10.1006/jeem.1995.1036
Tietenberg, T. H., and Tietenberg, T. (1985). Emissions Trading, an Exercise in Reforming Pollution Policy. Washington, DC: Resource for the Future.
Wang, K., Wei, Y.-M., and Huang, Z. (2016). Potential Gains from Carbon Emissions Trading in China: A DEA Based Estimation on Abatement Cost Savings. Omega 63, 48–59. doi:10.1016/j.omega.2015.09.011
Wang, Z., and Feng, C. (2014). The Impact and Economic Cost of Environmental Regulation on Energy Utilization in China. Appl. Econ. 46, 3362–3376. doi:10.1080/00036846.2014.929629
Wu, J., and Ma, C. (2018). The Convergence of China's Marginal Abatement Cost of CO2: An Emission-Weighted Continuous State Space Approach. Environ. Resource Econ. 72, 1099–1119. doi:10.1007/s10640-018-0240-1
Xian, Y., Wang, K., Wei, Y.-M., and Huang, Z. (2019). Would China's Power Industry Benefit from Nationwide Carbon Emission Permit Trading? an Optimization Model-Based Ex Post Analysis on Abatement Cost Savings. Appl. Energ. 235, 978–986. doi:10.1016/j.apenergy.2018.11.011
Yang, F., Choi, Y., and Lee, H. (2021). Life-cycle Data Envelopment Analysis to Measure Efficiency and Cost-Effectiveness of Environmental Regulation in China's Transport Sector. Ecol. Indicators 126, 107717. doi:10.1016/j.ecolind.2021.107717
Zhang, N., and Choi, Y. (2013). A Comparative Study of Dynamic Changes in CO2 Emission Performance of Fossil Fuel Power Plants in China and Korea. Energy Policy 62, 324–332. doi:10.1016/j.enpol.2013.07.060
Zhang, N., and Xie, H. (2015). Toward green IT: Modeling Sustainable Production Characteristics for Chinese Electronic Information Industry, 1980-2012. Technol. Forecast. Soc. Change 96, 62–70. doi:10.1016/j.techfore.2014.10.011
Zhang, N., and Zhang, W. (2018). Can Sustainable Operations Achieve Economic Benefit and Energy Saving for Manufacturing Industries in China? Ann. Oper. Res. 290, 145–168. doi:10.1007/s10479-018-2955-3
Zhao, X., Mahendru, M., Ma, X., Rao, A., and Shang, Y. (2022). Impacts of Environmental Regulations on green Economic Growth in China: New Guidelines Regarding Renewable Energy and Energy Efficiency. Renew. Energ. 187, 728–742. doi:10.1016/j.renene.2022.01.076
Keywords: cost-benefit analysis, emission regulation, command and control, emission trading, data envelopment analysis, activity analysis, CO2 emission, distributional effect
Citation: Yang F, Choi Y, Lee H and Debbarma J (2022) Sustainability of Overlapped Emission Trading and Command-And-Control CO2 Regulation for Korean Coal Power Production: A DEA-Based Cost-Benefit Analysis. Front. Environ. Sci. 10:877823. doi: 10.3389/fenvs.2022.877823
Received: 17 February 2022; Accepted: 04 March 2022;
Published: 05 April 2022.
Edited by:
Lianbiao Cui, Anhui University of Finance and Economics, ChinaReviewed by:
Pingfan Xia, National University of Singapore, SingaporeFeiyang Cheng, Tianjin University, China
Copyright © 2022 Yang, Choi, Lee and Debbarma. This is an open-access article distributed under the terms of the Creative Commons Attribution License (CC BY). The use, distribution or reproduction in other forums is permitted, provided the original author(s) and the copyright owner(s) are credited and that the original publication in this journal is cited, in accordance with accepted academic practice. No use, distribution or reproduction is permitted which does not comply with these terms.
*Correspondence: Yongrok Choi, eXJjaG9pQGluaGEuYWMua3I=; Hyoungsuk Lee, bGhzMjMwM0Brb3JlYS5hYy5rcg==