 Lingyan Qi1,2
 Ailing Xiong1,2Fengwen Wu1,2Junfeng Gao3*Cai Jia1,2*Junjun Zhi1,2Wangbing Liu4Jian Wang4Changli Hou4Lin Zhang4Bing Xu4
- 1School of Geography and Tourism, Anhui Normal University, Wuhu, China
- 2Engineering Technology Research Center of Resources Environment and GIS, Wuhu, China
- 3Key Laboratory of Watershed Geographic Sciences, Nanjing Institute of Geography and Limnology, Chinese Academy of Sciences, Nanjing, China
- 4Key Laboratory of JiangHuai Arable Land Resources Protection and Eco-Restoration, Ministry of Natural Resources, Anhui Province Institute of Land Surveying and Planning, Hefei, China
Aquatic ecological health is a global challenge due to its significant impacts, and a real-time method to accurately assess the ecological health is therefore particularly useful. Based on the hydrological, water quality, meteorological, and topographic data collected from field observations and organizations, this study developed a process-based hydrodynamic and water quality model using an environmental fluid dynamics code (EFDC) model of Lake Poyang to simulate the spatiotemporal variations in water levels and the total nitrogen (TN), total phosphorus (TP), and chlorophyll a (Chl a) contents. Compared with the measured values, the models were confirmed to be reliable and acceptable. Then, to achieve a real-time assessment, the simulated results were calculated and transformed into five ordinal rating categories by using a lake ecosystem health assessment framework. Our research revealed the following results: (1) the highest and lowest 10-day water level statuses indicated that the hydrological conditions of this lake were at “good” or “excellent” levels. (2) The health levels of TN were mostly at the “fair” level or below, and most of the real-time assessment health curves of lake zones were close to the single peak type. (3) The TP contents were often at “good” levels, and the health assessment curves of the lake zones exhibited downward trends during the periods of rapid rise or retreat. (4) A fluctuating characteristic was found in the health assessment of Chl a with at least two declining peaks in all lake zones. This study demonstrated the high value of physics-based models for assessing the ecological health of aquatic ecosystems in a robust and accurate manner.
1 Introduction
Lake ecosystems have played an important role during the development of human civilizations, owing to their high irrigation and drainage efficiency, flood regulation, and value for multiple uses, including drinking, fishing, and washing (Frissell and Bayles, 1996; Chen et al., 2019; Huang et al., 2019). However, in recent decades, lake ecosystems have suffered from eutrophication and significant declines in water quality and aquatic community diversity (Cheng and Li, 2006; Gao et al., 2014; Huang et al., 2020). Quantifying the real-time aquatic ecological health status can identify the main perturbations that are responsible for impaired conditions, and timely regulations and recommendations can be proposed to achieve ecosystem recovery (Langhans et al., 2014).
However, the traditional assessments are not able to reflect the real-time health status of ecosystems. Most studies have used the ecological integrity index (EII) to evaluate the ecological health status of lake ecosystems, which is defined as the preferred state of ecosystems that have been modified by human activity (Flotemersch et al., 2016; Huang et al., 2016). The EII is a comprehensive indicator system that includes physical, chemical, biological, and service functions to assess whether an ecosystem is in “the state of being whole, entire or undiminished” (Richter et al., 2003), or whether the compositional and structural diversities and natural functions of the affected ecosystem are maintained (Xu et al., 2001). The ease in understanding the EII has helped it to be widely adopted in the Great Lakes in North America (USEPA, 2020), Lake Poyang (Zhang et al., 2016; Qi et al., 2018a; Qi et al., 2018b), Lake Taihu (Huang et al., 2016), Lake Chaohu (Xu et al., 2001), and Lake Doting (Wang X. et al., 2015). Such an evaluation method is convenient and provides many valuable indicators but is limited to the spatiotemporal resolution of the sampling data, which thus reflects the local or current health status.
There is a growing need to indicate a lake’s real-time health status by integrating process-based models into traditional assessments. The environmental fluid dynamics code (EFDC) model is a physics-based, quantitative, and scientific method for analyzing the hydrodynamic processes and biochemical conditions in water bodies (Qi et al., 2019). It has been widely applied in study areas, including Lake Poyang (Huang et al., 2014; Wang P. et al., 2015; Huang et al., 2017; Huang et al., 2018), Lake Tai (Lu et al., 2013), and Lake Chaohu (Qian et al., 2021), to simulate the continuous variations in the lake level, water velocity, water clarity, and nitrogen, phosphorus, and phytoplankton concentrations. These studies have suggested that mechanistic models are efficient and practical tools for simulating and investigating the hydrodynamic and biochemical processes (Wang Y. et al., 2014). As mentioned earlier, EFDC has been frequently used in Lake Poyang (Li et al., 2014; Wu et al., 2014; Wang et al., 2015; Liu et al., 2016; Huang et al., 2017); therefore, the model parameters of Lake Poyang have been calibrated repeatedly and provide a valuable reference for the hydrodynamic and water quality modeling conducted in this study. However, the previous studies have usually used models to predict the spatiotemporal distributions due to the lack of ecological assessment knowledge, and they seldom calculate the health status or health score of indicators from the perspective of model application or estimate whether an indicator exceeds the health threshold and issue an alarm.
In view of the abovementioned scientific challenges, this study aimed to provide a real-time assessment of aquatic ecological health by using a process-based model and using an example from Lake Poyang, China. The high-resolution spatiotemporal distributions of the hydrodynamic, water quality and phytoplankton indicators were accurately simulated and scientifically assessed to understand the more elaborate ecological health status and current threats and management challenges for Lake Poyang. This study provided the first downscaling perspective to assess the aquatic ecological health and to assist policy-makers and researchers in better understanding and restoring the environmental and ecological values of lake wetlands.
2 Materials and Methods
2.1 Study Area
Lake Poyang (N28°24′-29°46′, E115°49′-116°46′), the largest freshwater lake in China, is located in northern Jiangxi province at the junction of the south bank of the Yangtze River. It has a mean hydraulic retention time of 20.9 days (Lai et al., 2014) and a subtropical monsoon climate with a mean annual precipitation of 1,542 mm and evaporation of 1,170 mm. For a monsoonal system, the inner-annual precipitation is unevenly distributed, and approximately, 44% of the annual rainfall occurs from April to June. Lake Poyang is a throughput type of lake and is mainly recharged from five main inflows, namely, the Xiushui River, Ganjiang River, Fuhe River, Xinjiang River, and Raohe River and one outflow that is connected to the Yangtze River via a narrow channel (Figure 1). Influenced by inflows and the Yangtze River, its water level significantly fluctuates, which induces inner-annual variations in the lake area from 146 km2 to 4,070 km2. In addition, Lake Poyang has recently suffered from increasing eutrophication and water quality degradation with significantly increasing phosphorus and nitrogen levels (Zhang and Werner, 2015; Qi et al., 2019).
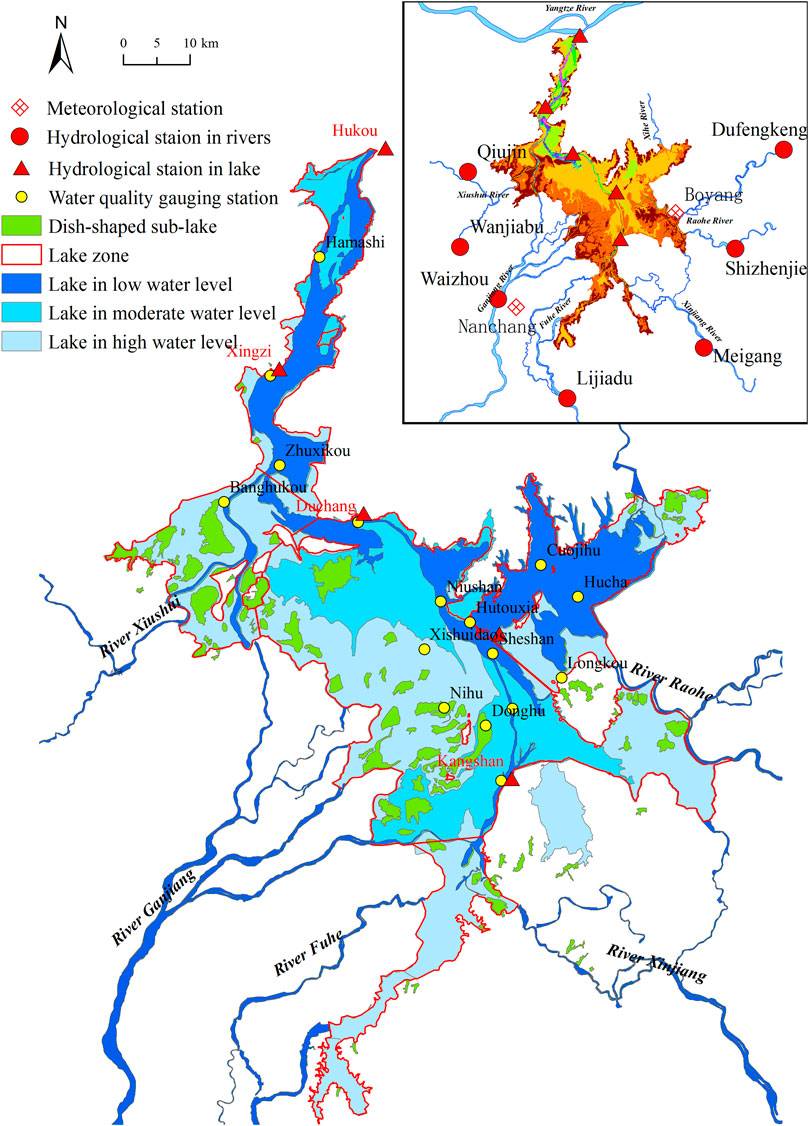
FIGURE 1. Locations of Lake Poyang, river networks, meteorological stations, hydrological stations in lake and rivers, water quality gauging stations, and the division of lake zones.
2.2 Data Sources
Table 1 presents the basic descriptions of the hydrological, water quality, meteorological, and topographic data that were collected from January 1 to 31 December 2015. These data were used to develop hydrodynamic and water quality (including phytoplankton) models for Lake Poyang.
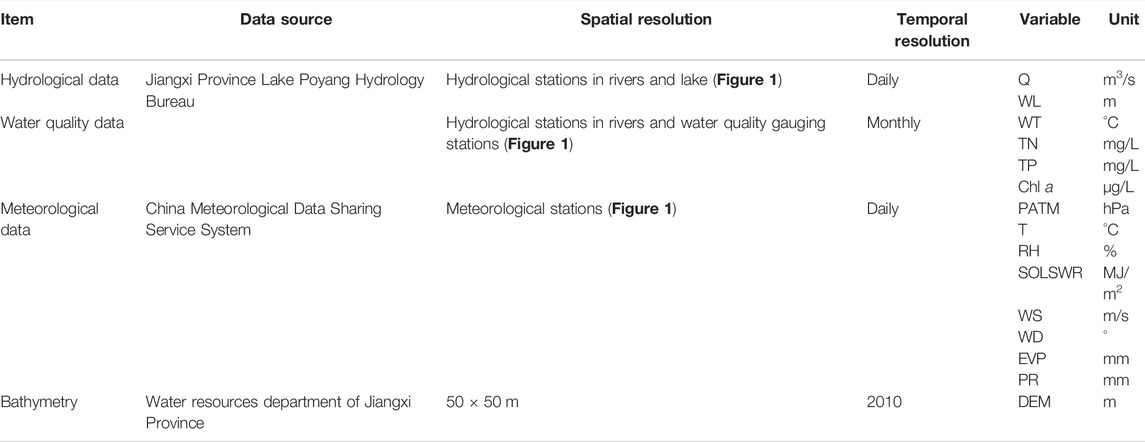
TABLE 1. Data used in hydrodynamic and water quality modeling.
The hydrological data included the discharges (Q, m3/s) of the five main inflows and one outflow (Hukou hydrological gauging station). These inflow discharge data were recorded at various hydrological gauging stations, namely, Wanjiabu and Qiujin (Xiushui River), Waizhou (Ganjiang River), Lijiadu (Fuhe River), Meigang (Xinjiang River), and Dufengkeng and Shizhenjie (Raohe River). The water level (WL, m) values were obtained from five hydrological gauging stations in Lake Poyang, namely, Hukou, Xingzi, Duchang, Tangyin, and Kangshan (Figure 1). The water quality data were collected monthly from sixteen gauging stations located in the lake and from seven hydrological gauging stations located in the inflows (Figure 1). Four indicators were considered, namely, water temperature (WT, °C), total nitrogen concentration (TN, mg/L), total phosphorus concentration (TP, mg/L), and chlorophyll-a concentration (Chl a, µg/L), which indicated the biomass of blue algae. The Boyang (No. 58519) and Nanchang (No. 58606) stations from the National Meteorological Center reported the meteorological conditions for Lake Poyang. Eight indicators were considered, namely, atmospheric pressure (PATM, hPa), dry bulb temperature (T, °C); relative humidity (RH, %), incident solar shortwave radiation (SOLSWR, MJ/m2), wind speed (WS, m/s), wind direction (WD, °), evaporation (EVP, mm), and precipitation (PR, mm). The bathymetry of Lake Poyang was defined by a digital elevation model (DEM, m) that was acquired by the Water Resources Department of Jiangxi Province in 2010. This DEM was resampled from its initial 50 m × 50 m resolution to 250 m × 250 m resolution for hydrodynamic and water quality modeling.
2.3 Research Methods
2.3.1 Model Description
EFDC is a process-based modeling system for surface water hydrodynamics and water quality simulations that has been applied in many water bodies and satisfies environmental assessment, management, and regulatory requirements (Park et al., 2005). EFDC was originally developed in 1988 by Dr. John M. Hamrick at the Virginia Institute of Marine Science (VIMS) and the College of William and Mary School of Marine Science. The momentum and continuity equations in the EFDC model are listed in (Eq. 1–7) (Hamrick and Mills, 2000; Wang et al., 2015; Qi et al., 2017).
where
The generic transport equation in the EFDC model for a dissolved or suspended constituent C can be written as follows:
where
2.3.2 Hydrodynamic and Water Quality Modeling
The boundary conditions represent the driving forces of lake hydrodynamics and biochemical processes. The daily discharges and monthly TN, TP, and Chl a concentrations were monitored by the inflow hydrological stations (Figure 1; Table 1), whereas the water levels and water qualities collected from the Hukou hydrological station were configured as the upstream and downstream hydrodynamic and water quality boundary conditions. The atmospheric boundary conditions included daily precipitation, evaporation, and relative humidity (Table 1). Additionally, the kriging interpolation method was used to obtain the initial conditions of the water level and water quality concentrations instead of using uniform values in the modeling.
A 2-D model based on EFDC was developed to simulate a vertically averaged hydrodynamic and biochemical process of Lake Poyang because of the shallow depth and uniform mixing. In addition, as a river-dominated lake, inflows and outflows are the primary water currents; therefore, greater variations in the hydrodynamic parameters were observed in the horizontal direction than in the vertical direction (Du et al., 2018). Thus, the vertical stratification could be neglected and the parameter, KC, which represents the number of layers, was set to 1. A total of 47,575 square grids with a resolution of 250 m were used to discretize the lake area. Due to the strong fluctuations in inner-annual lake levels, a dry/wet facility was enabled to deal with the moving boundaries (Zhang et al., 2015). Two associated parameters, namely, HDRY and HWET, were set to 0.05 and 0.1 m, respectively, to manage the reactivation of cells during dry and wet cycles. The dynamic time step was set from 5 to 30 s.
The water quality (including phytoplankton) model was coupled with a hydrodynamic model. The model adopted the preheat starting method, which stored and started from the spatial distribution of water quality during the training period as the preheat starting files to improve the model efficiency and stability. The model required activating the water temperature, water quality, and algae (CHG switch) modules. The calculated TN and TP values were the concentrations obtained by summing the simulated results of the various forms of nitrogen and phosphorus. Finally, the simulation was visualized by using the spatiotemporal visualization component in iLake (Huang et al., 2015).
2.3.3 Aquatic Ecological Health Assessment
An aquatic ecological health assessment consists of the following steps: indicator selection, reference condition definition, indicator standardization, and categorization (Huang et al., 2016). Given the implications for ecosystem health (Richter et al., 2003), the characteristics of Lake Poyang, and those from previous assessments (Huang et al., 2014; Qi et al., 2018a; Qi et al., 2018b), this study quantified the lake ecological health from physical, chemical, and biological perspectives. The water level in Lake Poyang varies considerably, and the drying and wetting process has significant influences on the growth and structure of wetland plants (Hu et al., 2015), which leads to difficulties in feeding migratory birds and spawning fish (Hu et al., 2014). Therefore, the highest and lowest 10-day water levels were used to determine the physical conditions. Phosphorus and nitrogen are the chemical indicators and drivers of eutrophication that lead to disastrous occurrences of harmful algal blooms. Phytoplankton (Chl a) is the primary producer and responds quickly to the water chemistry and environmental quality (Wu et al., 2017).
The reference conditions are increasingly used to describe the standard or benchmark against which current conditions are compared. The reference and impaired conditions for water level, TN and TP, and Chl a are defined by national standards for the surface water environmental quality (GB3838-2002); the least disturbed conditions are ideally described by evaluating the data collected from sites that are selected according to a set of explicit criteria that define those that are least disturbed by human activities and by expert opinions (Qi et al., 2018).
Considering the different ranges of the raw values of the selected indicators, each indicator was rescaled and standardized to a score between 0 and 1 by using upper (the values under the reference conditions) and lower anchors (the values under the impaired conditions) (Qi et al., 2018). Finally, the health scores were divided into five health conditions: excellent (≥0.8), good (0.6–0.8), fair (0.4–0.6), poor (0.2–0.4), and bad (<0.2). Additional implementation details can be found in previous studies (Qi et al., 2018a; Qi et al., 2018b).
3 Results
3.1 Calibration and Validation of the Models
Due to the robust abilities of the hydrodynamic model, the water level was used as the downstream boundary, so there is no need to separately calibrate the hydrodynamic parameters. The measured and simulated water levels at Xingzi, Duchang, Tangyin, and Kangshan stations (Figure 1) were selected for model verification Supplementary Figure S1. The mean absolute error (MAE), root mean square error (RMSE), determination coefficient (R2), and mean relative error (MRE) values throughout the validation period ranged between 0.27 and 0.70, 0.37 and 0.82, 0.98 and 0.99, and 0.02 and 0.04 (Supplementary Figure S1), respectively, which indicated that the adopted hydrodynamic model reasonably reflected the changes in water levels and hydrodynamic conditions in Lake Poyang.
It is worth noting that parameter calibration plays an important role in water quality (including phytoplankton) models. Through a sensitivity analysis, the parameters with higher sensitivity are selected and continuously adjusted to find the global optimal solution by repeatedly running the model, so that the differences between the simulated values and observed values are minimized (Wang et al., 2014). The primary parameters and calibration values of the water quality (including phytoplankton) model are shown in Supplementary Table S1.
Supplementary Figures S2, S3 show that the model performed well and that the validated results of the TN and TP concentrations can effectively reflect the fluctuations and variations in the measured concentrations. It is worth noting that some stations lack a monthly complete observational dataset because of inaccessibility and high cost. Supplementary Figure S4 also shows that the simulated results of the Chl a concentrations can generally reflect the changing process of the measured values. The error indicators of the Chl a concentrations at each water quality gauging station are also shown in Supplementary Figure S4. The ranges of MAE, RMSE, and MRE are 0.75–9.62, 1.11–13.54, and 0.14–1.00, respectively. The simulation results also showed that the peak algae concentration often occurred in summer and autumn (Figure 1). When the dry period began in autumn, the water surface area decreased sharply, which resulted in increased nutrient concentrations; the average water temperature at this time was 21–22°C, and algae life activities could still be maintained. Therefore, the second peak in the Chl a concentrations might have occurred, which was similar to the results obtained by seasonal monitoring of algae by Qian et al. (2016) and the remote sensing interpretation described by Wang J. et al. (2014).
3.2 Spatiotemporal Variation Characteristics of Ecological Health Indicators
The spatiotemporal distributions of the water levels that were simulated by the hydrodynamic model of Lake Poyang are shown in Figure 2. From January to February, there were obvious spatial differences (the maximum was 6.27 m), and the water depths in most areas including the southeastern lake bay and the dish-shaped lake were very low. Then, from March to May, the water levels rose rapidly, and the spatial differences gradually decreased. From June to July, the lake maintained a high water level, the entire lake area was approximately horizontal, and spatial differences were not obvious. The spatial distribution of the water depth was directly affected by the elevation of the lake bottom and exhibited an increasing trend from upstream to downstream, especially in the deep-water channel connected to the Yangtze River where the water depth was greatest (e.g., more than 20 m). After August, the water level rapidly decreased. The ANOVA (analysis of variance) results showed that except for the continuous high-water levels in June and July, the water level changes at the hydrological stations in the lake were significant.
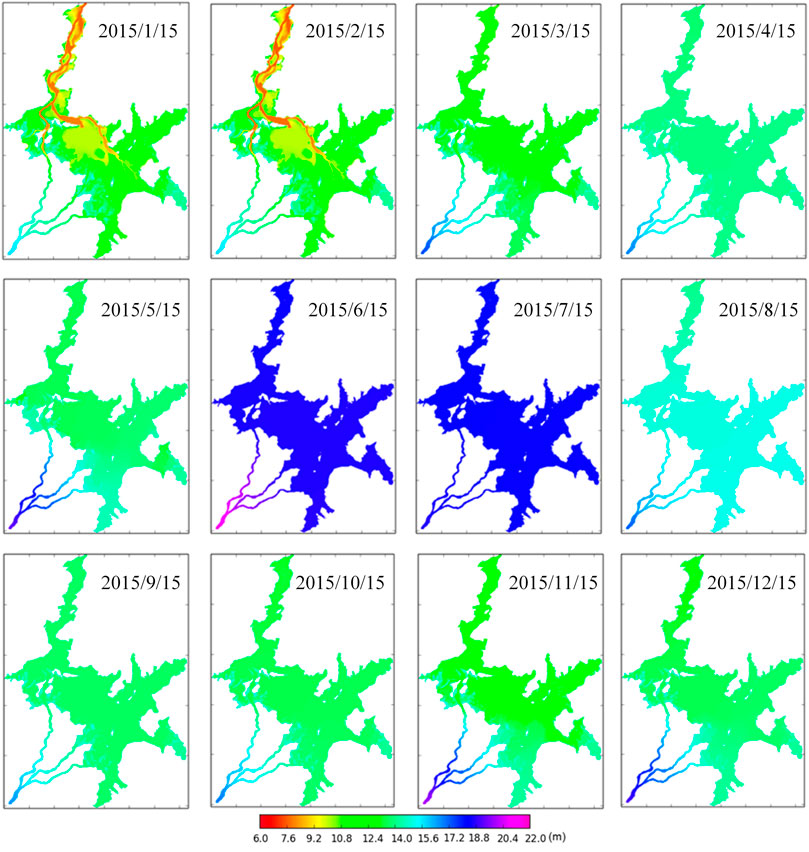
FIGURE 2. Spatiotemporal distributions of the simulated water levels of Lake Poyang in 2015.
The TN concentrations in Lake Poyang during the high-water period were significantly lower than those during the low-water period (Figure 3). The average TN concentration in the dry season (from December to February) was calculated to be 1.147 ± 0.646 mg/L, 1.063 ± 0.503 mg/L during the rise period (from March to May), 1.111 ± 0.340 mg/L during the flood period (from June to August), and 1.035 ± 0.613 mg/L during the fall period (from September to November). From January to May, the TN concentrations were generally high and exhibited clear spatial differences, especially in the entrances of the Ganjiang River and Raohe River, which was probably due to the abundant mineral resources and large mining enterprises located along these rivers. From June to August, the lake maintained a high water level (Figure 2) with decreasing TN concentrations, and the spatial differences were not obvious. During the high-water period, the flow velocities decreased, and the physical self-purification abilities weakened, but the biological self-purification abilities due to wetland vegetation absorption greatly increased. After September, the TN concentrations gradually increased and reached a peak in November, and there were significant differences, which were mainly affected by the pollutants carried by the inflows; the pollutants were gradually diluted and degraded along the direction of the main water channel (Liu et al., 2014). Additionally, during the low-water period, the water volume rapidly decreased, which directly resulted in increased pollutant concentrations.
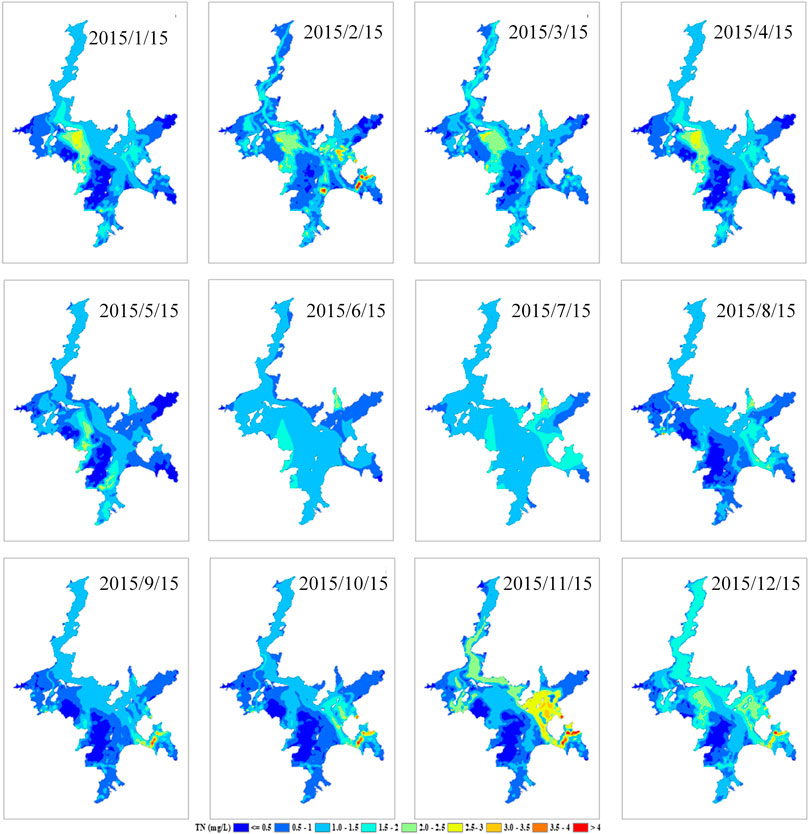
FIGURE 3. Spatiotemporal distributions of the simulated TN concentrations in Lake Poyang in 2015.
The average TP concentration in the dry season for Lake Poyang was 0.037 ± 0.025 mg/L, 0.054 ± 0.027 mg/L during the rise period, 0.053 ± 0.028 mg/L during the flood period, and 0.049 ± 0.030 mg/L during the fall period. These values showed an upward trend followed by a downward trend. From January to March, the TP concentrations were generally low and were mostly below 0.01 mg/L (Figure 4). From April to June, the water level rose rapidly (Figure 2), and the TP concentrations also showed an increasing trend, which was most likely because runoff carried large amounts of nonpoint source pollutants into the lake when rain occurred (Liu et al., 2014). From July to August, the water levels were high, and the TP concentrations decreased because of dilution. After September, the TP concentrations began to rise again. The TP concentrations exhibited obvious spatial differences, and the high zones were consistent with the distribution of suspended solids that were produced by Hu et al. (2011) and with the locations of the main sand mining areas. Such sand dredging activities caused strong stirring disturbances to the sediment and increased the release of pollutants from the sediment (Xiaoling et al., 2013).
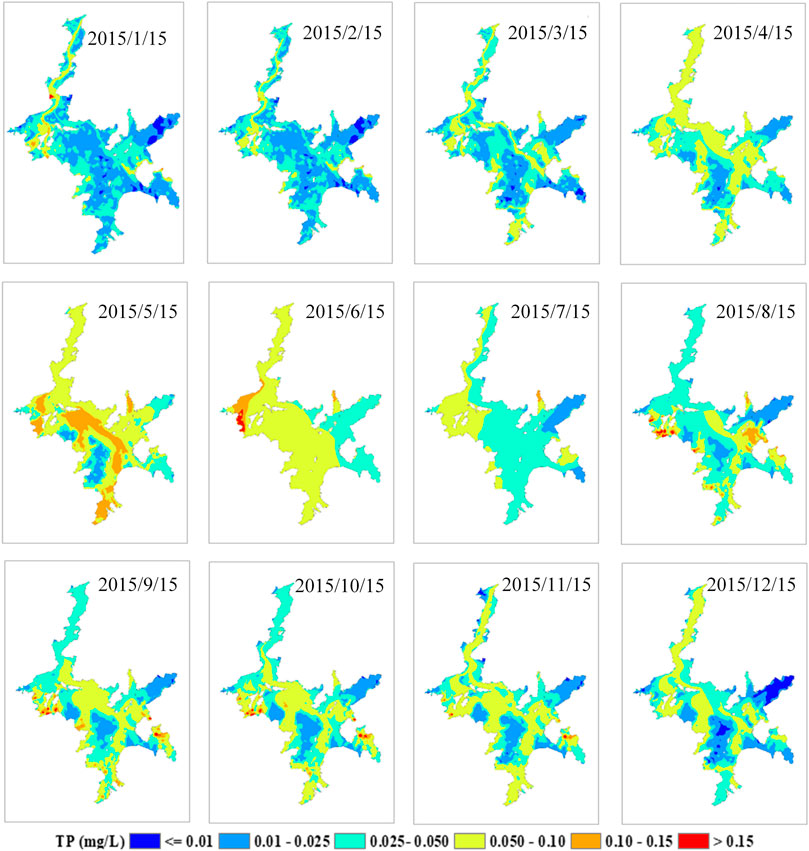
FIGURE 4. Spatiotemporal distributions of the simulated TP concentrations in Lake Poyang in 2015.
There were two peaks (around May and September) during the variations of Chl a. From January to April, the Chl a concentrations were generally low, and the spatial differences were not significant (Figure 5). However, as one of the largest dish-shaped sub-lakes in Lake Poyang, Lake Banghu (Figure 1) exhibited high Chl a concentrations, which were affected by the high nutrient concentrations (the annual average TN concentration was 1.14 mg/L, and the average TP concentration was 0.06 mg/L), which directly promoted algal growth. From May to August, the first peak occurred, and increased spatial differences in the Chl a concentrations gradually appeared. Wu et al. (2013) concluded that single algae or mixed algae, low water velocities, and small disturbances were beneficial to the growth and aggregation of algae, and environments with rapid flows erode the growth and aggregation of algae. The high concentrations were located in the southeastern lake bay due to the poor fluidity. At the same time, the water velocities in the deep-water channel connected to the Yangtze River are high, and the Chl a concentrations are lower. Algal accumulation occurs occasionally in some periods and is affected by the lake flows containing algae. Until September, the Chl a concentrations in most areas reached their second peak and then decreased gradually with the lower temperature.
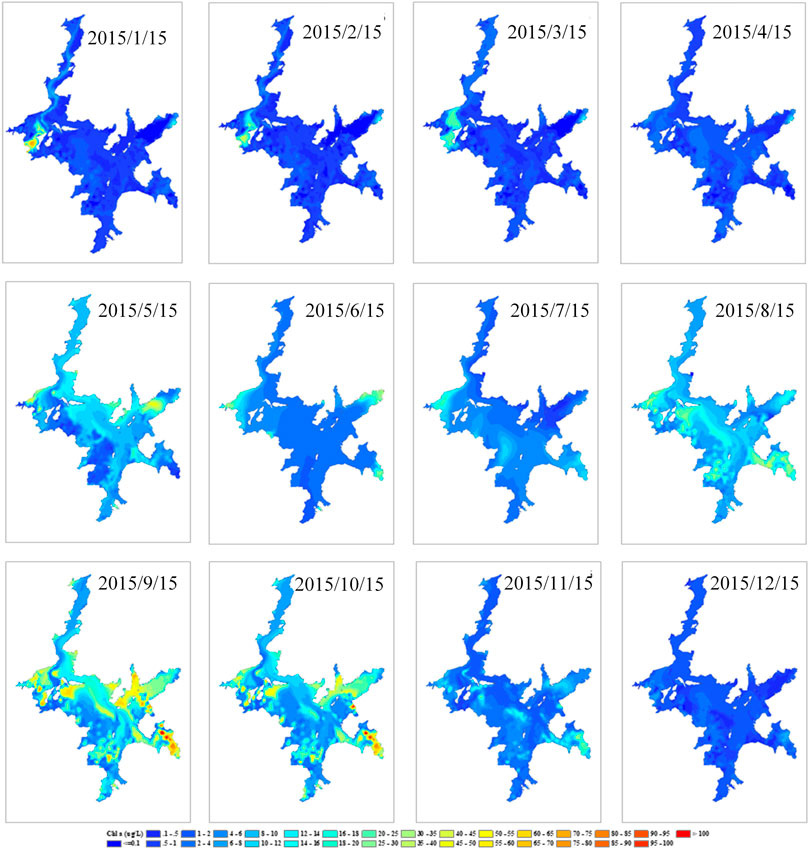
FIGURE 5. Spatiotemporal distributions of the simulated Chl a concentrations in Lake Poyang in 2015.
3.3 Real-Time Assessment of Aquatic Ecological Health
Based on the abovementioned simulations, a real-time assessment of the aquatic ecological health of Lake Poyang was conducted. The highest and lowest 10-days water levels were used to determine the physical health status of Lake Poyang (Qi et al., 2018). Because of the large spatial differences in water levels, the Hukou station was selected to identify the exact dates of the highest and lowest levels. Figures 6A,B show that the health status of high water only in the area near the Hukou station was “excellent” and that of most areas of the lake was “good”. At the same time, the assessment of the lowest 10-day water level showed that the health status was “excellent”. (Figures 6C,D). The water levels of most lake areas that exceeded 10.25 m (the thresholds can be found in Qi et al., 2018) were not involved in the evaluation because these water surfaces changed to dry wetlands during the low-water level period.
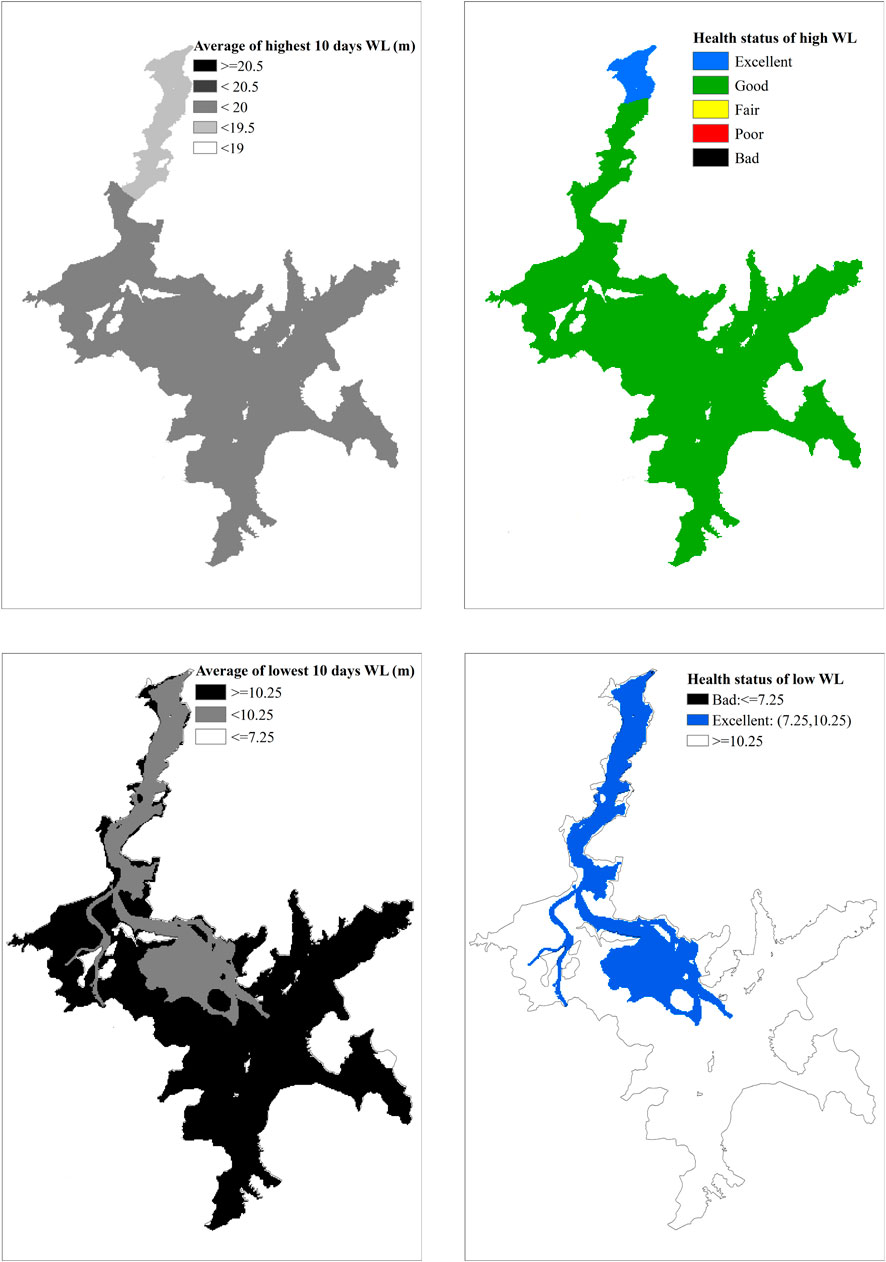
FIGURE 6. Aquatic ecological health assessment of the water levels of Lake Poyang in 2015. (A,C) Average of highest/lowest 10 days water level, (B,D) Health status of high/low water level.
From the real-time health assessment curves of TN (Figure 7A), lake zone I was “fair” or below this level for a long time, and the curve was close to the single peak type. The health levels were lowest around April, and the health levels improved to “fair” levels during the high-water period (from July to September). The health status of zone II was at the “fair” level at most times. During the low-water period from January to April, the health levels were low and were classified as “poor” or “bad”. The health levels improved when the water level was higher after June but again dropped to “poor” or “bad” after November. The health level of TN in zone III fluctuated greatly, and there were several large declines in January, August, and November. The health status of TN in area IV was mostly at “fair” or “poor” levels, and the health status in the high-water period was still better than that in the low water level period. Zone V was similar to zone IV and was mostly at “fair” or “poor” levels, and after the water level rose in June, the health level improved until the TN health status declined again in November. In general, the overall health statuses of TN in each lake zone were at “fair” or below levels, and the health statuses during the high-water periods were better than those during low-water periods, which were mainly due to the diluted nutrient concentrations. Zone III had fluctuations in the curve, which were likely to be caused by injections of polluted water from the Raohe River.
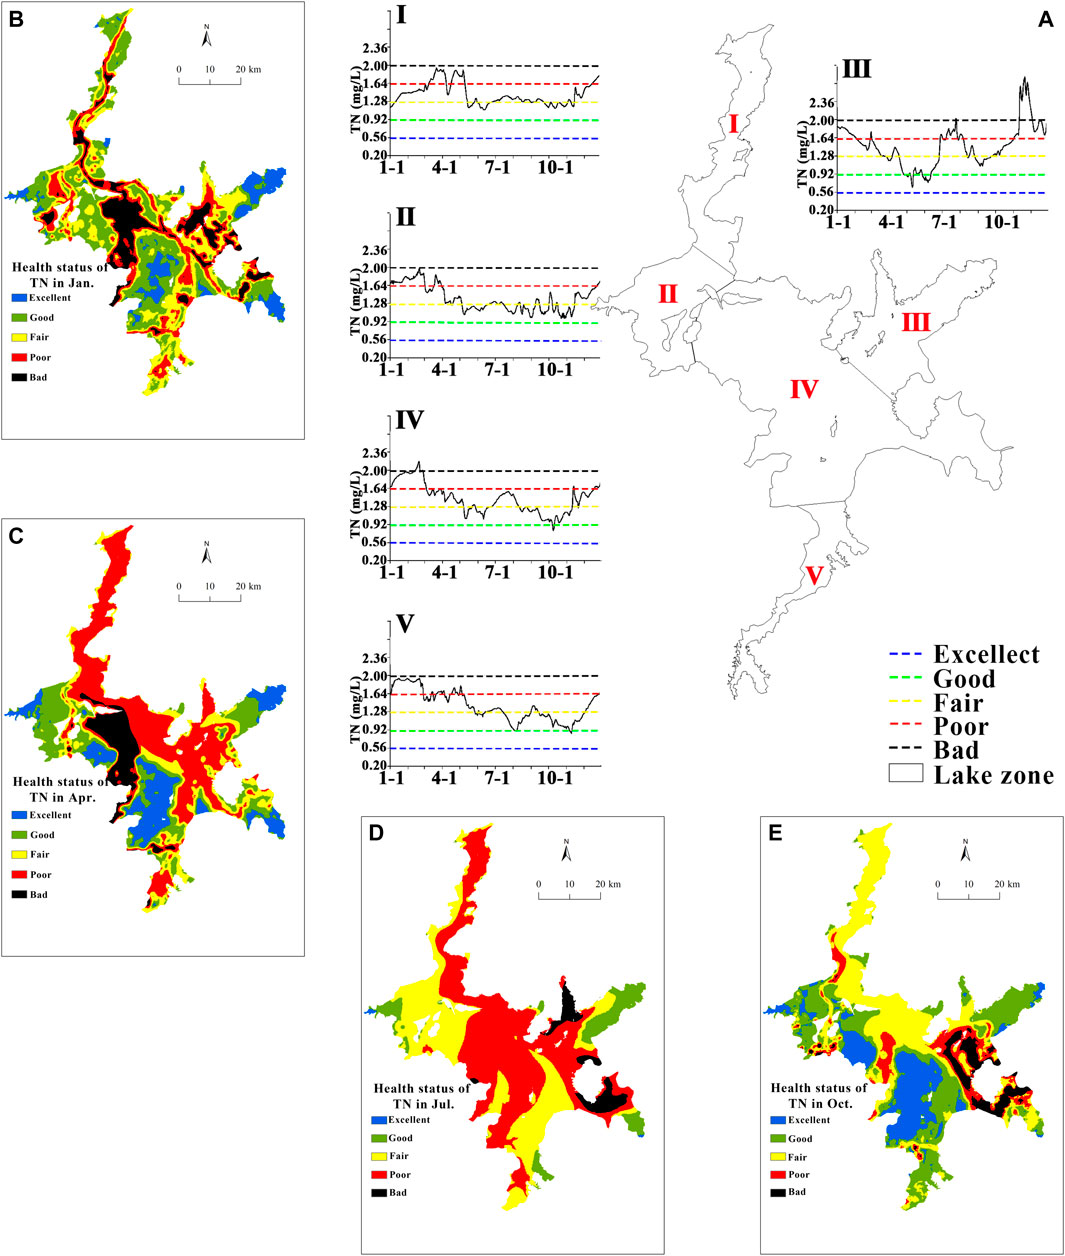
FIGURE 7. Real-time health assessment curves and spatiotemporal distributions of TN in the lake zones of Lake Poyang in 2015. (A) Real-time health assessment curves of TN, (B–E) Spatiotemporal distributions of TN in Jan.,Apr.,Jul.,Oct.
Quarterly health assessments were taken to illustrate the obvious spatial difference (Figures 7B–E). In January, the health statuses of the Eastern and Western channels and the deep-water channel connected to the Yangtze River and southeastern lake bay were “poor” or “bad”. This was mainly due to the water returning to the deep-water channels during the low-level period, which caused the nutrient concentrations to rise. The Ganjiang River and Raohe River were injected with large amounts of water with high pollutant concentrations, which resulted in the health levels of the two entrance areas being “bad”. However, most of the shallow water areas in the main lake area were in good health. The aquatic vegetation in the main lake area is luxuriant and has a strong self-purification ability, which is helpful for the absorption and dilution of nutrients (Zhang et al., 2015). In April, the water area expanded, and the health status of TN in most lake areas was mainly “poor”, but the entrance of the Ganjiang River still had a “bad” status. In July, the lake area reached its highest value, and the health levels of the main lake were generally “fair” or “poor”. The health levels of TN from the lakeshore to the inner lake gradually improved. This was mainly because the pollutants were gradually diluted and degraded along the lake flow direction (Liu et al., 2014). During the recession period in October, the lake area shrank, and the health levels of TN in the main lake area were better than those in the channels, while the Raohe River injected a large amount of “bad” water.
According to Figure 8A, the TP curve in the zone I was mostly at the “good” level and only dropped to “fair” during the rising water period around May. The health levels of TP in zone II fluctuated greatly and dropped rapidly to “fair” in May and November, and were “good” or above for the rest of the time. The health status of TP in zone III continued to fluctuate at “excellent” and “good” levels and exhibited an increasing trend. The health status of TP in zone IV was similar to that in zone I and zone II. The health status in zone IV was “fair” around May and was “good” or above at the other time. The health status in zone V decreased around May and September, and the rest time was classified as “good” or above. In general, the health levels of TP varied around the “good” level and exhibited a downward trend during rapid rise or retreat periods.
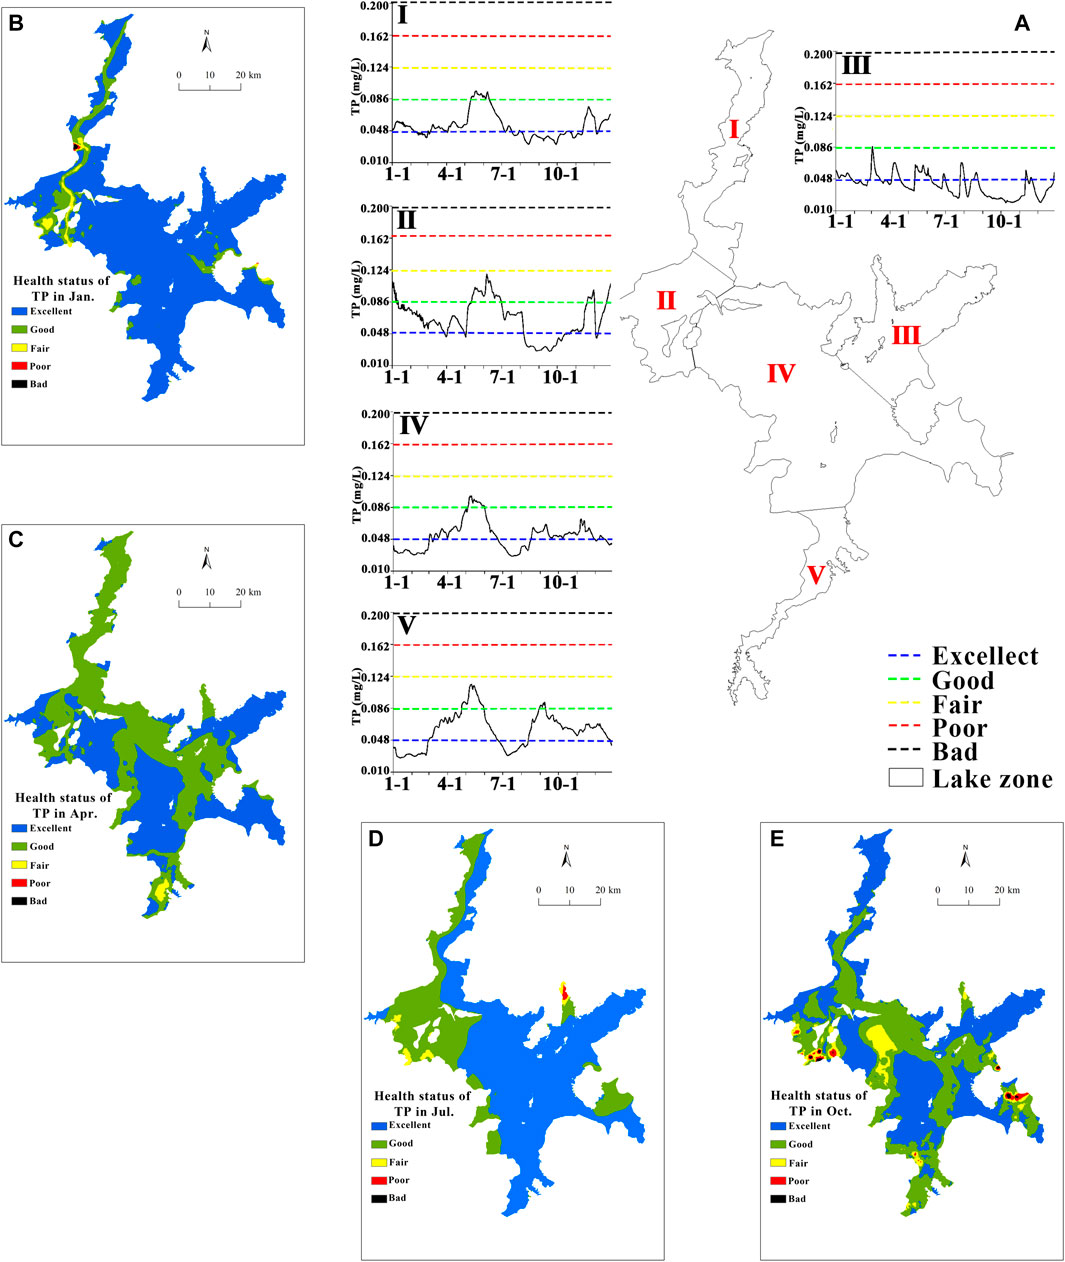
FIGURE 8. Real-time health assessment curves and spatiotemporal distributions of TP in the lake zones of Lake Poyang in 2015. (A) real-time health assessment curves of TP, (B–E) spatiotemporal distributions of TP in Jan.,Apr.,Jul.,Oct.
Figures 8B–E illustrate that the health levels of TP were generally good and were at “excellent” or “good” levels, while there were spatial and temporal differences. In January, the health level of TP was “excellent”, except for the western water channel and deep-water channel connected to the Yangtze River. During the rapid flood period in April, the “good” area increased, and most of this area was located in channels, while the other areas were still in the “excellent” category. The TP health characteristics in July were similar to those in January, and only the western water channel and deep-water channel connected to the Yangtze River were “good”. During October, the TP health levels dropped again, and “good” or “fair” levels appeared in the entrances of inflows, while they remained at “excellent” levels. In conclusion, the TP health levels in the main lake area were better than those in the deep-water channels and decreased during the rapid flood (April) or retreat periods (October). This was mainly due to the frequent exchange of water in the upper and lower layers during the rise or retreat periods, which resulted in the churning of the bottom layer and the release of large amounts of phosphorus, which resulted in declines in TP health levels.
According to the real-time health assessment curves of Chl a shown in Figure 9A, there were two peaks in zone I in May and October, that is, the health status decreased to “poor” or “bad”. The curve for zone II exhibited several peaks, and the health level decreased to “bad” around February, March, May, and October, while “fair” or above levels remained for the rest of the year. The levels in zone III were similar to those in zone I, with obvious double peaks, which decreased to “bad” around May and October and approached the “excellent” level in other periods. The health level of Chl a in zone IV also decreased to “bad” around May and October and remained at “excellent” or “good” levels for the rest of the year. Zone V was similar to zone I, zone III, and zone IV, with two peak characteristics, and the health statuses at the peak moments (e.g., May and October) reached “poor” and “bad”, but the health levels were slightly better than those of the other lake zones. In summary, the Chl a health levels fluctuated significantly during the year, with at least two peaks occurring in all lake areas.
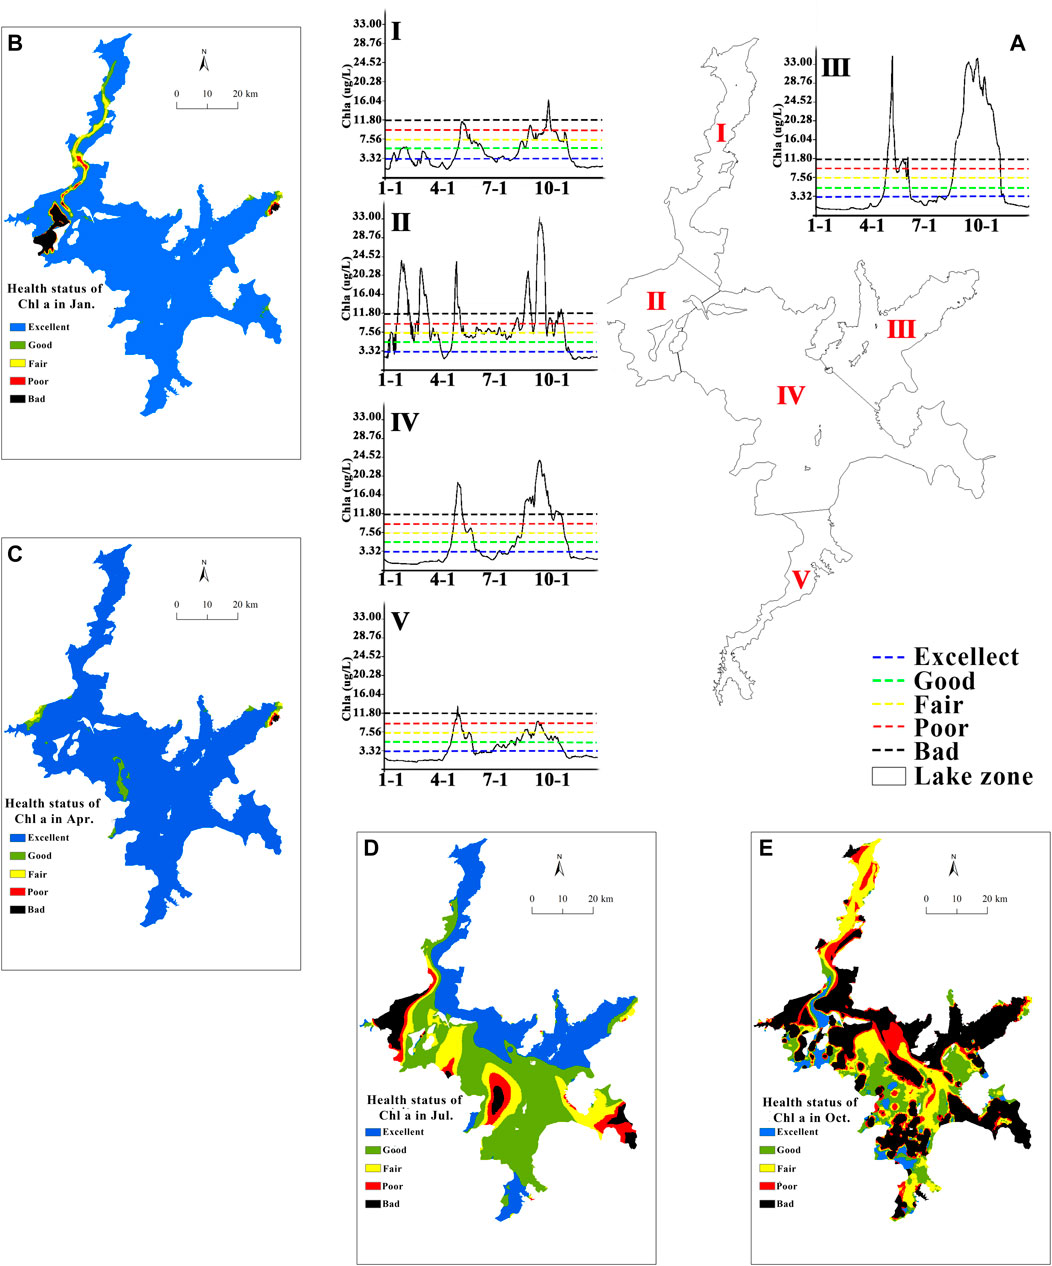
FIGURE 9. Real-time health assessment curves and spatiotemporal distributions of Chl a in the lake zones of Lake Poyang in 2015. (A) Real-time health assessment curves of Chl a, (B–E) spatiotemporal distributions of Chl a in Jan.,Apr.,Jul.,Oct.
Figures 9B–E shows that the health levels of Chl a exhibited clear temporal and spatial differences. The health levels in January and April were significantly better than those in July and October, as algae growth peaks appear in summer and autumn. In January, the health levels of Chl a only in the Western Water Channel and deep-water channel connected to the Yangtze River had a “bad” status, and the rest of the lake area had an “excellent” status. In April, nearly the entire lake had an “excellent” status. Then, the health levels of Chl a declined in July, and there were significant spatial differences. At the entrance of the Xiuhe River, the main branch of the Ganjiang River, and Raohe River, areas with algal accumulations appeared. The health levels of Chl a increased from the lakeshore to the inner lake area. This result might show that there were large amounts of algal input upstream, and the concentrations gradually decreased due to the dilution by lake flow and vegetation purification. In October, the health levels of Chl a decreased rapidly to below “fair”, and “bad” water bodies appeared in southeastern lake bay, the entrance of the Raohe River, and in other areas.
4 Discussion
4.1 Reliability of Hydrodynamic and Water Quality Modeling
The validation results indicated that the performance of the hydrodynamic and water quality models was reliable and acceptable (Supplementary Figures S1–S4). However, to further decrease the model uncertainties, some strategies could be used. First, the parameter uncertainties that are involved in the water quality model require long-term monitoring data, and it is difficult for existing measured data to provide effective support. Therefore, a sufficient measured data will be required in the future by some new methods, such as remote sensing. Moreover, the data from two weather stations named Nanchang and Boyang were used to represent the meteorological status of Lake Poyang. However, for such a large lake with spatial heterogeneity, more data from other meteorological stations might be collected. Finally, a square grid with a spatial resolution of 250 m was applied to discretize the lake domain. Although such a spatial resolution is not lower than that adopted in previous hydrodynamic modeling studies (typically ranging from 0.1 to 2 km), the grids still differed from the actual bathymetry, especially around Kangshan station, where the elevations change intensively (Lai et al., 2014). For this case, improving the accuracy of the modeling results still remains a challenge that must be addressed by using highly detailed grids in parts of the complicated regions and long-term measured data to support effective validations.
4.2 Reliability of the Real-Time Assessment of Aquatic Ecological Health
A real-time assessment of aquatic ecological health of Lake Poyang using the process-based model from the hydrodynamics, nutrition, and phytoplankton aspects was constructed in the study. Although the establishment of mechanism models is time-consuming and labor-intensive, this study described a valuable exploration, and it breaks through the limitations to the spatiotemporal resolutions of traditional ecological health evaluations and can provide more accurate and continuous assessment results. As the largest freshwater lake in China and as one of seven globally important wetlands, Lake Poyang has a series of complicated hydrological and biochemical characteristics. The water levels and the nitrogen, phosphorus, and chlorophyll-a concentrations might not perfectly reflect the overall health status of Lake Poyang, but it is helpful to describe an initial quantitative conclusion regarding the health status. In the future, the observations and knowledge could be improved, more modules could be coupled into the hydrodynamic and water quality models, and more precise real-time simulations and evaluations could be achieved.
5 Conclusion
This study aimed to assess the real-time aquatic ecological health conditions based on a process-based model, EFDC. The models were successfully constructed and validated to simulate the variations and fluctuations in water levels and in TN, TP, and Chl a concentration in Lake Poyang in 2015. Moreover, according to the aquatic ecological health assessment method, real-time health assessment curves and spatiotemporal distributions of Chl a in the lake zones were calculated and classified into five ordinal rating categories. The results showed that the highest and lowest 10-day water level statuses reached “good” or “excellent”, the health level of TN was poor, which was mostly at “fair” or below levels, and the health levels of TP were generally good at “excellent” or “good” levels. At the same time, intensely fluctuating characteristics were found in the Chl a real-time health assessment curves. Obvious spatial and temporal differences were also observed in these assessments. This study described a valuable exploration and breaks through the limitations to the spatiotemporal resolutions of traditional ecological health evaluations, and the results increased our understanding of the health management, restoration, and conservation of the lake ecosystem.
Data Availability Statement
The original contributions presented in the study are included in the article/Supplementary Material; further inquiries can be directed to the corresponding authors.
Author Contributions
Conceived the ideas: LQ, JG, and CJ. Analysis and interpretation of data: LQ, AX, FW, and JZ. Drafting of the manuscript: LQ. Critical revision of the manuscript for important intellectual content: LQ, WL, JW, CH, LZ, and BX. All authors contributed to the manuscript revision, read, and approved the submitted version.
Funding
This study was financially supported by the National Natural Science Foundation of China (42001087), the Youth Natural Science Foundation of Anhui Province (1908085QD151), and the Foundation of Anhui Normal University (751847), and the Foundation of Jiangxi Province (202224ZDKT22).
Conflict of Interest
The authors declare that the research was conducted in the absence of any commercial or financial relationships that could be construed as a potential conflict of interest.
Publisher’s Note
All claims expressed in this article are solely those of the authors and do not necessarily represent those of their affiliated organizations, or those of the publisher, the editors, and the reviewers. Any product that may be evaluated in this article, or claim that may be made by its manufacturer, is not guaranteed or endorsed by the publisher.
Acknowledgments
We acknowledge Jiangxi Province Lake Poyang Hydrology Bureau for providing the hydrological data. The original meteorological data were collected by the China Meteorological Data Sharing Service System. We acquired the latest bathymetry data from the Water Resources Department of Jiangxi Province.
Supplementary Material
The Supplementary Material for this article can be found online at: https://www.frontiersin.org/articles/10.3389/fenvs.2022.881335/full#supplementary-material
References
Chen, W., He, B., Nover, D., Lu, H., Liu, J., Sun, W., et al. (2019). Farm Ponds in Southern China: Challenges and Solutions for Conserving a Neglected Wetland Ecosystem. Sci. Total Environ. 659, 1322–1334. doi:10.1016/j.scitotenv.2018.12.394
Cheng, X., and Li, S. (2006). An Analysis on the Evolvement Processes of Lake Eutrophication and Their Characteristics of the Typical Lakes in the Middle and Lower Reaches of Yangtze River. Chin. Sci. Bull. 51, 1603–1613. doi:10.1007/s11434-006-2005-4
Du, Y., Peng, W., Wang, S., Liu, X., Chen, C., Liu, C., et al. (2018). Modeling of Water Quality Evolution and Response with the Hydrological Regime Changes in Poyang Lake. Environ. Earth Sci. 77 (7), 265–281. doi:10.1007/s12665-018-7408-4
Flotemersch, J. E., Leibowitz, S. G., Hill, R. A., Stoddard, J. L., Thoms, M. C., and Tharme, R. E. (2016). A Watershed Integrity Definition and Assessment Approach to Support Strategic Management of Watersheds. River Res. applic. 32, 1654–1671. doi:10.1002/rra.2978
Frissell, C. A., and Bayles, D. (1996). Ecosystem Management and the Conservation of Aquatic Biodwersity and Ecological Integrity. J. Am. Water Resour. Assoc. 32, 229–240. doi:10.1111/j.1752-1688.1996.tb03447.x
Gao, J. H., Jia, J., Kettner, A. J., Xing, F., Wang, Y. P., Xu, X. N., et al. (2014). Changes in Water and Sediment Exchange between the Changjiang River and Poyang Lake under Natural and Anthropogenic Conditions, China. Sci. Total Environ. 481, 542–553. doi:10.1016/j.scitotenv.2014.02.087
Hamrick, J. M., and Mills, W. B. (2000). Analysis of Water Temperatures in Conowingo Pond as Influenced by the Peach Bottom Atomic Power Plant Thermal Discharge. Environ. Sci. Policy 3 (S1), 197–209. doi:10.1016/s1462-9011(00)00053-8
Hu, C. H., Zhou, W. B., and Lu, L. (2011). Research on Planning of Sandmining Region of Poyang Lake Based on GIS Platform. Yangtze River 42 (4), 8–11.
Hu, Z. P., Ge, G., and Liu, C. L. (2014). Response of Wintering Migratory Birds to Hydrological Processes in Poyang Lake. J. Natl. Resour. 29, 1770–1778. doi:10.11849/zrzyxb.2014.10.012
Hu, Z. P., Ge, G., and Liu, C. L. (2015). Cause Analysis and Early Warning for Wetland Vegetation Degradation in Poyang Lake. Resour. Environ. Yangtze Basin 23, 381–386. (In Chinese).
Huang, J., Gao, J., Hörmann, G., and Fohrer, N. (2014). Modeling the Effects of Environmental Variables on Short-Term Spatial Changes in Phytoplankton Biomass in a Large Shallow Lake, Lake Taihu. Environ. Earth Sci. 72 (9), 3609–3621. doi:10.1007/s12665-014-3272-z
Huang, J., Gao, J., and Zhang, Y. (2015). Combination of Artificial Neural Network and Clustering Techniques for Predicting Phytoplankton Biomass of Lake Poyang, China. Limnology 16 (3), 179–191. doi:10.1007/s10201-015-0454-7
Huang, Q., Gao, J. F., Zhang, Y. H., Yan, R. H., Wang, Y., and Cai, Y. J. (2016). Aquatic Ecological Integrity Assessment of Four Large Lakes in the Middle-To-Lower Reaches of the Yangtze River, China. China. Acta Ecol. Sin. 36, 118–126. doi:10.5846/stxb201410101992
Huang, J., Qi, L., Gao, J., and Kim, D.-K. (2017). Risk Assessment of Hazardous Materials Loading into Four Large Lakes in China: A New Hydrodynamic Indicator Based on EFDC. Ecol. Indic. 80, 23–30. doi:10.1016/j.ecolind.2017.04.051
Huang, J., Zhang, Y., Huang, Q., and Gao, J. (2018). When and where to Reduce Nutrient for Controlling Harmful Algal Blooms in Large Eutrophic Lake Chaohu, China? Ecol. Indic. 89, 808–817. doi:10.1016/j.ecolind.2018.01.056
Huang, J., Zhang, Y., Arhonditsis, G. B., Gao, J., Chen, Q., Wu, N., et al. (2019). How Successful are the Restoration Efforts of China's Lakes and Reservoirs? Environ. Int. 123, 96–103. doi:10.1016/j.envint.2018.11.048
Huang, J., Zhang, Y., Arhonditsis, G. B., Gao, J., Chen, Q., and Peng, J. (2020). The Magnitude and Drivers of Harmful Algal Blooms in China's Lakes and Reservoirs: A National-Scale Characterization. Water Res. 181, 115902. doi:10.1016/j.watres.2020.115902
Lai, X., Liang, Q., Jiang, J., and Huang, Q. (2014). Impoundment Effects of the Three-Gorges-Dam on Flow Regimes in Two China's Largest Freshwater Lakes. Water Resour. Manage 28 (14), 5111–5124. doi:10.1007/s11269-014-0797-6
Langhans, S. D., Reichert, P., and Schuwirth, N. (2014). The Method Matters: A Guide for Indicator Aggregation in Ecological Assessments. Ecol. Indic. 45, 494–507. doi:10.1016/j.ecolind.2014.05.014
Li, Y., Zhang, Q., Yao, J., Werner, A. D., and Li, X. (2014). Hydrodynamic and Hydrological Modeling of the Poyang Lake Catchment System in China. J. Hydrol. Eng. 19 (3), 607–616. doi:10.1061/(asce)he.1943-5584.0000835
Liu, F. G., Li, M., and Guo, Y. Y. (2014). Spatial-temporal Variation of Water Quality and Water Level Effect on Water Quality in Poyang Lake. J. China Hydrol. 34 (4), 37–43.
Liu, X., Teubner, K., and Chen, Y. (2016). Water Quality Characteristics of Poyang Lake, China, in Response to Changes in the Water Level. Hydrology Res. 47 (S1), 238–248. doi:10.2166/nh.2016.209
Lu, C., Zhang, F., Liu, Z., Hao, S., and Wu, Z. (2013). Three-dimensional Numerical Simulation of Sediment Transport in Lake Tai Based on EFDC Model. J. Food Agric. Environ. 11, 1343–1348.
Park, K., Jung, H.-S., Kim, H.-S., and Ahn, S.-M. (2005). Three-dimensional Hydrodynamic-Eutrophication Model (HEM-3D): Application to Kwang-Yang Bay, Korea. Mar. Environ. Res. 60 (2), 171–193. doi:10.1016/j.marenvres.2004.10.003
Qi, L. Y., Huang, J. C., Yan, R. H., Gao, J. F., Wang, S. G., and Guo, Y. Y. (2017). Modeling the Effects of the Streamflow Changes of Xinjiang Basin in Future Climate Scenarios on the Hydrodynamic Conditions in Lake Poyang, China. Limnology 18 (2), 175–194. doi:10.1007/s10201-016-0500-0
Qi, L., Huang, J., Huang, Q., Gao, J., Wang, S., and Guo, Y. (2018a). Assessing Aquatic Ecological Health for Lake Poyang, China: Part I Index Development. Water 10 (7), 943–958. doi:10.3390/w10070943
Qi, L., Huang, J., Huang, Q., Gao, J., Wang, S., and Guo, Y. (2018b). Assessing Aquatic Ecological Health for Lake Poyang, China: Part II Index Application. Water 10 (7), 909–923. doi:10.3390/w10070909
Qi, L., Huang, J., Gao, J., Cui, Z., and Cui, Z. (2019). Modelling the Impacts of Bathymetric Changes on Water Level in China's Largest Freshwater Lake. Water 11 (7), 1469–1485. doi:10.3390/w11071469
Qian, K. M., Liu, X., Qi, L. Y., and Chen, Y. W. (2016). Variation of Anabaena in the Transition Levels between River- and Lake-type of Lake Poyang. J. Lake Sci. 28 (3), 566–574. doi:10.18307/2016.0312
Qian, R., Peng, F. L., Xue, K., Qi, L. Y., Duan, H. T., Qiu, Y. G., et al. (2021). Assessing the Risks of Harmful Algal Blooms Accumulation at Littoral Zone of Large Lakes and Reservoirs: An Example from Lake Chaohu. Lake Sci. 34 (1), 49–60. doi:10.18307/2022.0103
Richter, B. D., Mathews, R., Harrison, D. L., and Wigington, R. (2003). Ecologically Sustainable Water Management: Managing River Flows for Ecological Integrity. Ecol. Appl. 13, 206–224. doi:10.1890/1051-0761(2003)013[0206:eswmmr]2.0.co;2
Wang J, J., Zhang, Y., Yang, F., Cao, X., Bai, Z., Zhu, J., et al. (2014). Spatial and Temporal Variations of Chlorophyll-A Concentration from 2009 to 2012 in Poyang Lake, China. Environ. Earth Sci. 73 (8), 4063–4075. doi:10.1007/s12665-014-3691-x
Wang Y, Y., Jiang, Y., Liao, W., Gao, P., Huang, X., Wang, H., et al. (2014). 3-D Hydro-Environmental Simulation of Miyun Reservoir, Beijin. J. Hydro Environ. Res. 8 (4), 383–395. doi:10.1016/j.jher.2013.09.002
Wang P, P., Lai, G. Y., and Li, L. (2015). Predicting the Hydrological Impacts of the Poyang Lake Project Using an EFDC Model. J. Hydrol. Eng. 20 (12), 5–19. doi:10.1061/(asce)he.1943-5584.0001240
Wang X, X., Zheng, B. H., Liu, L. S., and Wang, L. J. (2015). Development and Evaluation of the Lake Multi-Biotic Integrity Index for Dongting Lake, China. J. Limnol. 74, 594–605. doi:10.4081/jlimnol.2015.1186
Wu, S., Ge, J., Miao, W., Cheng, L., Ran, O., and Cao, H. (2013). Spatio-temporal Distribution of Epilithic Algal Chlorophyll a in Relation to the Physico-Chemical Factors of Gufu River in Three Gorges Reservoir. Acta Eco Sin. 33 (21), 7023–7034. doi:10.5846/stxb201207161009
Wu, Z., Lai, X., Zhang, L., Cai, Y., and Chen, Y. (2014). Phytoplankton Chlorophyllain Lake Poyang and its Tributaries during Dry, Mid-dry and Wet Seasons: A 4-year Study. Knowl. Manag. Aquatic Ecosyst. (412), 6–19. doi:10.1051/kmae/2013088
Wu, Z., Zhang, D., Cai, Y., Wang, X., Zhang, L., and Chen, Y. (2017). Water Quality Assessment Based on the Water Quality Index Method in Lake Poyang: The Largest Freshwater Lake in China. Sci. Rep. 7, 17999. doi:10.1038/s41598-017-18285-y
Xiaoling, C., Zhang, Y., Yuan, Z., Li, Z., Liqiong, C., and Jianzhong, L. (2013). Distribution Characteristic of Nitrogen and Phosphorus in Lake Poyang during High Water Period. J. Lake Sci. 25 (5), 643–648. doi:10.18307/2013.0504
Xu, F., Tao Dawson, S. R. W., Li, P. G., and Cao, J. (2001). Lake Ecosystem Health Assessment: Indicators and Methods. Wat. Res. 35, 3157–3167. doi:10.1016/s0043-1354(01)00040-9
Zhang, Q., and Werner, A. D. (2015). Hysteretic Relationships in Inundation Dynamics for a Large Lake-Floodplain System. J. Hydrol. 527, 160–171. doi:10.1016/j.jhydrol.2015.04.068
Zhang, C., Gao, X. P., Wang, L. Y., and Chen, X. J. (2015). Modelling the Role of Epiphyton and Water Level for Submerged Macrophyte Development with a Modified Submerged Aquatic Vegetation Model in a Shallow Reservoir in China. Ecol. Eng. 81, 123–132. doi:10.1016/j.ecoleng.2015.04.048
Keywords: aquatic ecological health, EFDC, Lake Poyang, real-time, modeling
Citation: Qi L, Xiong A, Wu F, Gao J, Jia C, Zhi J, Liu W, Wang J, Hou C, Zhang L and Xu B (2022) A Real-Time Assessment of Aquatic Ecological Health Using a Process-Based Model: An Example From Lake Poyang, China. Front. Environ. Sci. 10:881335. doi: 10.3389/fenvs.2022.881335
Received: 04 March 2022; Accepted: 10 May 2022;
Published: 29 June 2022.
Edited by:
Vinicius Fortes Farjalla, Federal University of Rio de Janeiro, BrazilReviewed by:
Yang Gao, Farmland Irrigation Research Institute (CAAS), ChinaYonghong Bi, Institute of Hydrobiology (CAS), China
Copyright © 2022 Qi, Xiong, Wu, Gao, Jia, Zhi, Liu, Wang, Hou, Zhang and Xu. This is an open-access article distributed under the terms of the Creative Commons Attribution License (CC BY). The use, distribution or reproduction in other forums is permitted, provided the original author(s) and the copyright owner(s) are credited and that the original publication in this journal is cited, in accordance with accepted academic practice. No use, distribution or reproduction is permitted which does not comply with these terms.
*Correspondence: Junfeng Gao, Z2FvanVuZkBuaWdsYXMuYWMuY24=; Cai Jia, NTE1NzY5MTMxQHFxLmNvbQ==