 Yuanjian Wang
 Ximin Cui
 Yuhang Che1
 Peixian Li
- 1School of Geoscience and Surveying Engineering, China University of Mining and Technology (Beijing), Beijing, China
- 2School of Environment Science and Spatial Informatics, China University of Mining and Technology, Xuzhou, China
Zhouqu has narrow terrain and steep mountains on both sides of the Bailong River. It is one of the most serious landslide disaster areas in China due to the fracture development of rock and complex geological conditions. To identify the slope active deformation areas (SADAs) in the region accurately, the Distributed Scatter Interferometric Synthetic Aperture Radar (DS-InSAR) technique was used based on the process of the sentinel ascending and descending orbit data. Deformation results of the region from January 2019 to February 2021 were obtained. A new method for automatically identifying SADA while accounting for radar geometric distortion was established to quickly and efficiently identify SADA from the large-scale deformation results in the region. The SADA identified by this method can eliminate the region affected by geometric distortion. Based on the method, 62 SADAs including 12 in the upstream and 50 in the downstream of Zhouqu County were identified. Compared with 12 typical landslide areas in the study area, 9 typical landslides match with the detected SADA. The SADA is mainly concentrated in the section from the downstream of Zhouqu County to Lianghekou, and statistical analysis showed that the vegetation coverage and topographic slope angle are two main reasons for this difference. At the same time, the analysis of the typical landslide time-series deformation reveals that the slope deformation activity mainly takes place during the rainy season. It has high correlation with precipitation. These results of the study provided an important reference for geological disaster prevention in the Zhouqu region.
1 Introduction
The process and phenomenon of slope geotechnical body sliding downward with a certain acceleration along the continuous penetrating damage surface is called landslide (Aleotti and Chowdhury 1999). As the global population continues to grow and the interaction between man and nature intensifies, the landslide has become one of the serious natural disasters threatening human survival and development, and especially under the influence of heavy rainfall and earthquake, the damage caused by landslide disaster is more serious (Schuster and Highland 2007; Zhang et al., 2020). The movement of landslides is sliding rather than tipping or rolling. Slow landslide movements last longer, usually not catastrophically and suddenly, and do not terminate the movement immediately (Sun et al., 2016; Kavoura et al., 2020; Novellino et al., 2021). Slope angle, height, rock weathering, fissures, geological structure, hydrogeological conditions, etc. are all factors that cause landslides (Dai et al., 2002; Vilímek et al., 2021). Quickly identifying the deformation of slope areas can provide help for landslide investigation and interpretation. The Zhouqu region is a typical geological disaster-prone area, and there have been many geological disaster events in the history of the area. Several large mudslide disasters occurred around the Zhouqu region in 1978, 1989, 1992, and 2010, which caused great loss of life and property (Zhang et al., 2018; Dai et al., 2021). The Xieliupo landslide, which was in the downstream of the county, has continued to deform, and a large landslide occurred in 1981, causing blockage of the river and inundation of villages (Sun et al., 2015). The Suoertou landslide located in the upstream of Zhouqu County, with its landslide volume of tens of millions of cubic meters, has been in the creeping slip deformation stage since the last century after the resurrection. On 8 August 2010, a mudslide formed in the northern mountainous area of the Zhouqu region due to heavy rainfall, causing most of the Zhouqu region to be destroyed and death of 1,765 people, and on 12 July 2018, a large-scale destabilization occurred in the landslide of Jiangdingya in Nanyu Township, blocking the Bailong River to form a weir, making the issue of landslide stability in the region once again attract great attention from all walks of life (Wang 2013; Zhang et al., 2016). Therefore, early identification of the SADA in the region is important to protect the lives and properties of local residents and infrastructure safety.
In the past decade, landslides in the Zhouqu region have become a hot spot for geological hazard research. Numerous scholars have conducted research from the perspectives of landslide genesis, hazard evaluation, and detection methods. Bai et al. (2012) evaluated the landslide susceptibility of the Zhouqu area using GIS and logistic regression models. Cui et al. (2013) studied the influence of complex topography and landscape on the scale of landslide and debris flow disasters in the Zhouqu region. Jiang et al. (2016) discussed the activity mechanism of the Xieliupo landslide using GPS monitoring data. Zhang et al. (2018) used InSAR technology to identify the slow landslides in the Zhouqu region and analyzed the patterns of the movements of typical landslides. Dai et al. (2021) used InSAR technology to identify landslides around Zhouqu county. InSAR is increasingly used by researchers in landslide monitoring, and although the technology is limited in sudden landslide monitoring, it has a promising future in the fields of wide-area potential landslide identification and slow landslide activity pattern research.
Traditional surface deformation monitoring techniques and means, such as level measurement and GPS measurement, are characterized by high monitoring accuracy and flexibility. However, with the increasing requirements of deformation monitoring, these point-based surface deformation monitoring techniques and means have the shortcomings of large workload, high cost, and low spatial sampling rate, which can hardly meet the requirements of a long-time and large-scale surface deformation monitoring. With the development of space geodesy technology, Interferometric Synthetic Aperture Radar (InSAR), which is an important method for deformation monitoring, has gradually matured and is widely used in deformation monitoring (Hilley et al., 2004; Zhao et al., 2012; Wild et al., 2018). The Differential InSAR (D-InSAR) is susceptible to the influence of atmospheric and spatio-temporal decoherence factors. In order to overcome the disadvantages of the D-InSAR technique, Ferretti et al. (2001) proposed the Persistent Scatterer InSAR (PS-InSAR) algorithm in 2001, which can effectively weaken the effects of atmospheric delay and spatio-temporal decoherence by detecting and calculating the features (such as buildings, concrete dikes, rocks, and artificial corner reflectors) that can maintain strong and stable characteristics to radar waves in long time sequences. Compared with persistent scatterers, the unstable phase of radar echoes of concrete, fields, and other surface features targets limits the PS-InSAR point target extraction and reduces the spatial sampling rate of deformation information. To compensate for the disadvantage of the PS-InSAR technique in the poorly coherent region with small point density, Ferretti et al. (2011)proposed a method to combine PS points and Distributed Scatter (DS) points for solving, which is based on the feature that similar DS points have the same statistical properties, and the density of points is increased by screening DS points with specific thresholds to obtain more detailed surface deformation information, which is suitable for natural scenes such as landslides in mountainous areas. InSAR technology can not only capture landslide signals on a large scale from the spatial scale but also orbit the movement of landslides in a longer period from the temporal scale, which has unique monitoring advantages such as long time, large range, fast acquisition, and accuracy.
In the high mountain canyon area, due to the characteristics of synthetic aperture radar and side-view imaging, SAR images inevitably show geometric distortion phenomena (including shadow, layover, and foreshortening), resulting in a decrease in the resolution, and the monitoring accuracy becomes low or even cannot be monitored (Cigna et al., 2014; Liu et al., 2018; Ren et al., 2021). Carrying out accurate qualitative and quantitative geometric distortion analysis can help to correctly judge the reliability of InSAR deformation monitoring results and improve the accuracy of SADA identification.
Conventional ground survey methods to identify potential landslides are time consuming and laborious, and numerous studies have been conducted using automatic and semi-automatic methods to identify Active Deformation Areas (ADAs) and then determine whether the target is a landslide. Barra et al. (2017) proposed a method to automatically identify ADA based on PS-InSAR results and update the geohazard database in real time; Luo et al. (2021) proposed a method for automatic identification and evaluation of geological hazards based on spatial and temporal characteristics of deformation. The automatic identification method can efficiently and accurately identify and separate potential landslide hazard areas from large-scale data.
In this study, the Sentinel-1A ascending and descending data covering the study area are processed by a time-series InSAR processing method that takes into account the DS points to obtain the deformation results of the study area. Based on previous studies, an automatic identification method of SADA based on InSAR deformation results and terrain visibility is proposed. The method not only considers the spatial distribution of deformation in the monitoring area but also takes into account the visibility of SAR satellites in the monitoring area, which improves the accuracy of potential SADA identification and judgment. Based on the results of automatic identification and optical images and other information, this study analyzes the spatial and temporal characteristics of deformation of typical landslides in the study area. This study will provide a reference for automatic identification of deformation areas and active landslide prevention in complex terrain.
2 Study Area
The Bailong River Basin is located in the transition zone between the first and second terraces of China’s landforms and is the intersection of three major geomorphic units: the Loess Plateau, the Sichuan Basin, and the Qinghai–Tibet Plateau. Affected by tectonic movements, concentrated rainfall, and human activities, landslides and mudslides are frequent and widespread in the basin, making it one of the four major geological disaster-prone areas in China (Ma et al., 2020). The Zhouqu region is located in the middle reaches of the Bailong River Basin in southern Gansu. The Bailong River enters from the northwest of the Zhouqu region and passes through the city in the southeast. The terrain is high in the west and low in the east. The elevation, slope, and aspect of the study area are shown in Figure 1. From the figure, it can be seen that the region has large mountains, deep ditches, and broken terrain, and the relative height difference between the valley peaks reaches more than 1,000 m, and the slope of the ditch is large, which is conducive to the development of gravity geological phenomena such as collapse (Zhang et al., 2016).
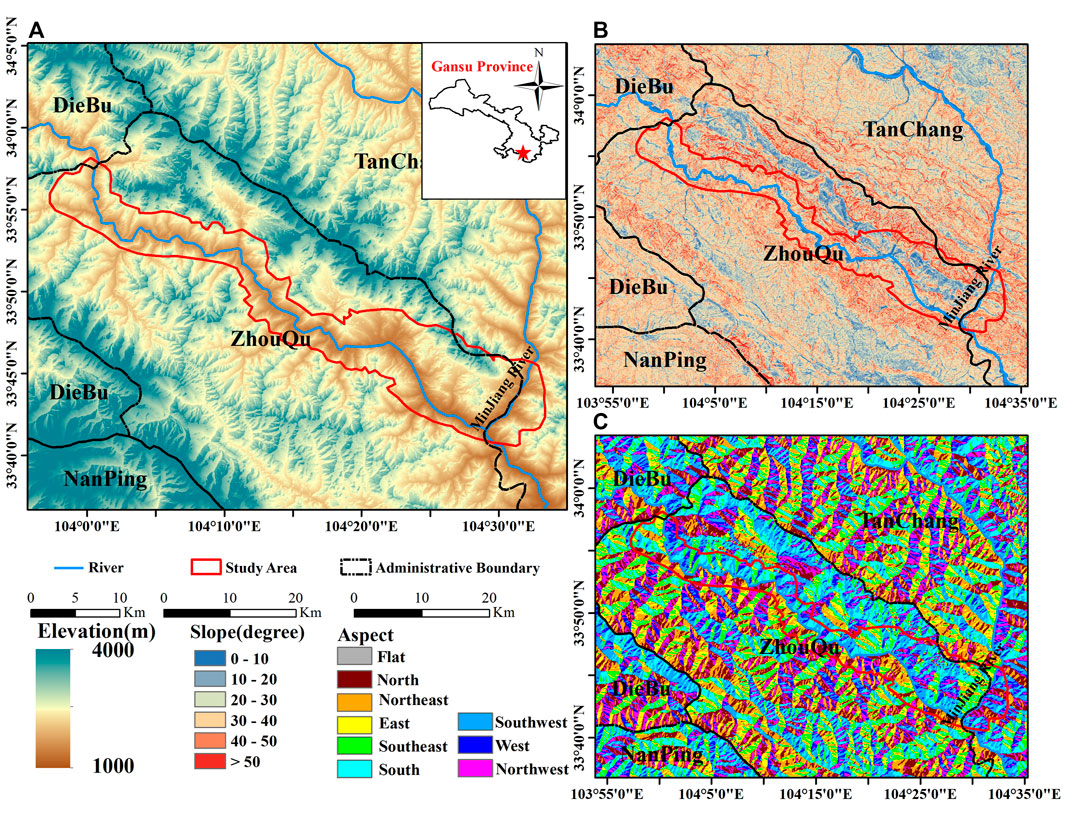
FIGURE 1. Location map of the study area. (A) Elevation map. (B) Slope angle map. (C) Aspect map.
The average annual precipitation in the study area is 434 mm, which is low, but because the rain falls mostly from May to September and the rainfall is mostly in the form of continuous rain and heavy rainfall, this concentrated rainfall provides hydrodynamic conditions for the formation of landslide and debris flow geological disasters (Zhang and Matsushima, 2016). At the same time, due to the loose geological structure in the area, engineering activities such as slope reclamation, water conservancy, highway construction, and hydroelectric power station construction directly destroy the rock structure of the slope and reduce the stability of the slope, even directly lead to landslides and landslides, coupled with the narrow terrain in the mountainous area, the unreasonable piling or random dumping of construction debris, etc., and deteriorate the already fragile ecological environment. In addition, the vegetation cover of the section from Zhouqu County to Lianghekou along the Bailong River is poor, and it is mainly debris landslides, most of which are rocky landslides re-activated, large in scale, mostly large and giant landslides, and large in number, mainly medium and deep landslides, which are the key areas of concern in this study.
3 Data and Methods
3.1 Data
This study uses the 45 Sentinel-1A ascending images and 43 Sentinel-1A descending images covering the study area from January 2019 to February 2021 for estimating the deformation rate in the study area, and the data coverage is shown in Figure 2. The external reference DEM is required for terrain phase removal, geocoding, during the InSAR data processing. The DEM is also required for terrain visibility calculation, and the ALOS 12.5 m DEM provided by JAXA is used in this study. The basic parameters of Sentinel-1A data used are shown in Table 1.
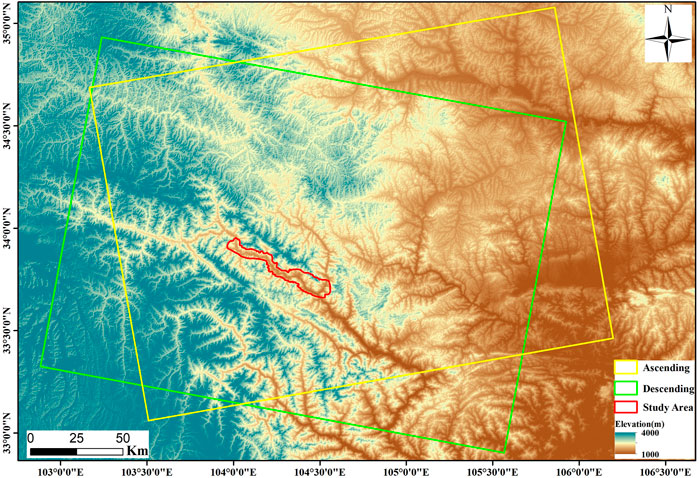
FIGURE 2. The spatial coverage of the images used in the study.

TABLE 1. SAR data parameters.
3.2 Data Process
3.2.1 DS-InSAR
Compared with other monitoring targets, the surface of the slope is mostly covered with natural features and fewer artificial structures. PS-InSAR mostly monitors man-made feature targets, which is suitable for urban ground settlement monitoring, and it is difficult to obtain detailed and accurate deformation information for the monitoring of distributed scatterer targets such as grass and bare ground with fewer points extracted. Because the DS-InSAR method can improve the distribution density of points and obtain richer and more reliable deformation information for targets such as landslides, we use this method.
The DS-InSAR method to obtain the deformation mainly consists of the following steps:
(1) Selecting a master image: the temporal and spatial baselines between all image pairs are calculated, a temporal and spatial baseline distribution map is generated, and an image with the centered temporal and spatial baseline is selected as the master image.
(2) Image coregistration: the SAR image is coregistered with the master image. The coregistration accuracy is greater than 0.001 pixels.
(3) Calculating the interferogram phase: all the coregistered images are combined with the master image in pairs according to the time series. The interferometric phase is calculated pixel by pixel to generate a time-series interferogram set.
(4) Selecting PS and DS: the selection of the DS consists of two main steps: homogeneous time dimensional filtering and phase optimization estimation. They are described in detail in the following.
(5) The flat earth phase and topographic phase are removed.
(6) From the differential interferometric phase, the spatio-temporal deformation is estimated and the time-series deformation phase of each point target is obtained.
(7) Deformation calculation: based on the radar wavelength parameters, the unwrapping phase is converted into millimeter-scale deformation variables in the line-of-sight direction.
Two key steps of the DS-InSAR technique are homogeneous pixel identification and phase reconstruction, respectively (Goel and Adam 2014; Fornaro et al., 2015; Cao et al., 2016). Distributed targets are usually represented as neighboring pixels with homogeneous scattering characteristics and obey the same statistical distribution on the time-series SAR magnitude images. Therefore, spatial adaptive filtering of the interferometric phase is generally performed first, and then, a statistical test is used to determine statistically homogeneous pixels for each pixel to extract distributed targets (Jiang et al., 2015). Since the spatial adaptive filtering causes the interferometric phases to not strictly satisfy the phase consistency, it is necessary to adopt a certain phase optimization algorithm to construct a set of single master image optimized phase values under the condition of phase consistency and obtain a set of best-fit phases after the adaptive multi-look process to minimize the effect of the decoherence phenomenon of the distributed targets.
In this study, spatial adaptive filtering based on the KS hypothesis testing method is used to identify homogeneous pixels, and phase triangulation is used to estimate the optimal phase. The KS hypothesis test is based on the cumulative distribution function and is used as a method to test whether a distribution conforms to a certain theoretical distribution or to compare whether two empirical distributions are significantly different from each other. In the time-series SAR image set, the backscattered intensity information of homogeneous pixels is similar in the time dimension, and when the test statistic of the intensity information in the time dimension of two pixels is less than the critical value at the significant level, the two pixels are considered to be homogeneous pixels. The DS-InSAR processing flow chart is shown in Figure 3.

FIGURE 3. DS-InSAR processing chain used in the study.
3.2.2 Decomposition of Deformation Along the Aspect
In mountainous areas with complex topography, the surface deformation information is complicated, and it is difficult to obtain accurate surface deformation using single orbit data, especially for slope areas, where the deformation has a high correlation with slope angle and aspect. Therefore, this study adopts a combination of ascending and descending orbits and external DEM to obtain the deformation information along the aspect in the Nanyu landslide, and the results can more truly reflect the motion of unstable slopes. The relationship between the line-of-sight (LOS) deformation (
where
Since the horizontal motion of a slope generally points along the aspect, it can be assumed that the deformation of a slope can be decomposed into two directions,
where
3.2.3 Automatic Identification Method of SADA
The method of automatic identification SADA is divided into four steps:
(1) The DS-InSAR deformation results are read in a shapefile format. The data are spatially filtered by sliding window point by point to remove outliers and isolated points from the data. The radius of the sliding window is set to two times the spatial resolution of the data, and 40 m is used. Z-score normalization is used to determine the outliers, and the outliers are determined when the normalized value of the deformation rate is greater than 3 or less than −3. If the number of adjacent points in the sliding window is less than one, it is considered as an isolated point.
(2) The absolute value of the deformation rate threshold is set to filter out the obvious deformation points. All deformation points are constructed into Delaunay triangulation irregular net, and edges larger than the radius of clustering are eliminated to form numerous isolated triangulation irregular net clusters. A recursive approach is used to cluster the deformation points and generate polygonal active deformation areas. Combined with the experience of previous studies, the absolute value of the rate threshold adopted is 15 mm/a, and the clustering radius is set to three times the image resolution, i.e., 60 m.
(3) Combined with the DEM data, the slope of each ADA is calculated, and the ADA with a slope greater than 10° is considered as SADA.
(4) The obtained SADA is overlaid with the terrain visibility map, and unreliable areas such as overlay and shadow areas are removed to obtain the final accurate SADA.
The abovementioned process involves the following main parameters:
(1) Denoising radius: this parameter is mainly used to remove noise points; when the number of PS + DS points in the radius of influence of a point is small, the point is deleted.
(2) Number of neighboring points: it is determined whether PS or DS points are isolated points; when the number in the influence radius is less than this value, they are isolated points.
(3) Rate threshold: this parameter is used to determine the points where deformation occurs. Unlike other studies where the rate threshold is determined based on the standard deviation of the rate, this method takes into account the monitoring accuracy of the conventional time-series InSAR method and the flexibility of the actual operation process and directly gives the upper and lower limits of the rate threshold, automatically extracts the deformation points with a certain step size several times, and generates multiple ADA results for judging potential landslides.
(4) Clustering radius: points within this radius are considered as the same deformation area.
(5) Minimum number of PS + DS points within the ADA: the number of PS + DS points within each ADA must be greater than this value; otherwise, it is not considered as an ADA.
(6) Slope angle: the slope angle of the ADA is greater than this threshold value, and then, it is considered as a SADA.
3.3 Terrain Visibility
The distortion on the SAR images is mainly of the types of layover, shadow, and foreshortening, depending on the geometric parameters of the radar satellite acquisition data, the angle of the LOS direction, and the slope angle and aspect of the terrain. Figure 4 shows the geometric distortion of radar side view imaging. When illuminated towards the satellite, foreshortening (c–d) occurs when the slope angle is less than or equal to
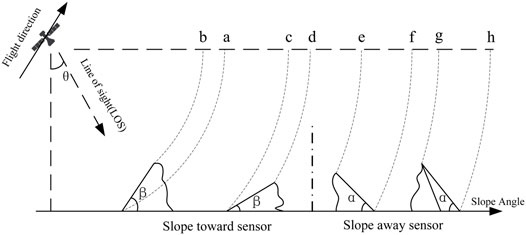
FIGURE 4. Geometric distortion diagram of radar side-view imaging. When illuminated towards the satellite, foreshortening (C–D) occurs when the slope angle is less than or equal to, and layover (B–A) occurs when the slope angle is greater than. When backward facing the satellite, shadowing (G–H) occurs when the slope angle is greater.
4 Results and Analysis
4.1 Deformation Identification Results
The LOS direction surface deformation results for the study area obtained using the DS-InSAR method are shown in Figure 5. The annual average deformation rate in the LOS direction of the ascending orbit ranges from −79 to 47 mm/a, and the absolute value of the large deformation rate exceeds 20 mm/a. The annual average deformation rate in the LOS direction of the descending orbit ranges from −66–79 mm/a. The larger deformation areas obtained from the descending orbit coincide with the ascending orbit, which are mainly distributed on both sides of the gully from Zhouqu County to Lianghekou.
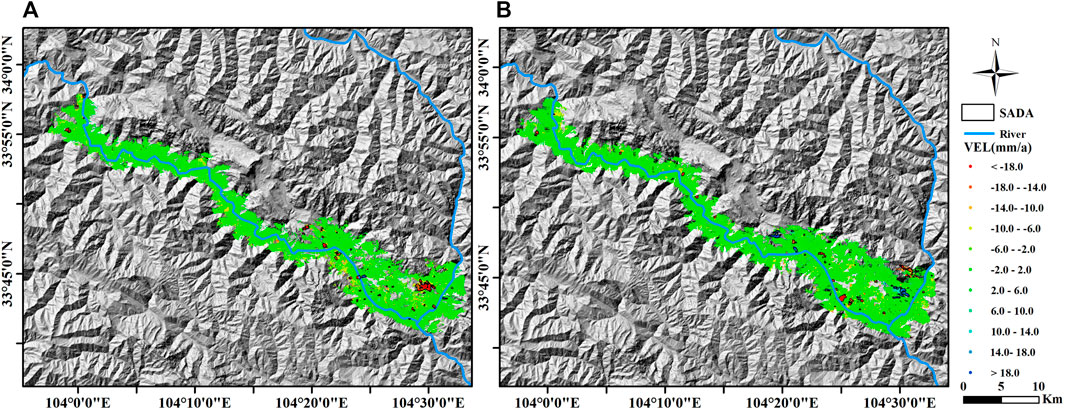
FIGURE 5. Average deformation velocities in the LOS direction are derived from (A) ascending images and (B) descending images. The black boundary is the extent of each SADA.
Based on the results of surface deformation in the study area, combined with previous research results and experience, the SADA was detected with the absolute value of deformation rate greater than 15 mm/a as the threshold value. Through the automatic identification program, 40 SADA were identified in the ascending orbit data, covering an area of about 5.37 km2, and 48 SADA were identified in the descending orbit data, covering an area of about 6.32 km2. Comparing the results of the ascending and descending orbit identification, a total of 16 SADA were found to overlap, but the specific extent was not exactly the same, and the results of the SADA identification for the ascending and descending orbits are shown in Figure 5.
4.2 Identifying the Results of SADA With Terrain Visibility
Due to the special of radar side view imaging, geometric distortion such as layover and shadow may be produced according to the angle of incidence and different terrain features. In mountainous areas with large topographic relief, the aspect and slope angle characteristics are decisive factors for generating geometric distortion, and the topography needs to be fully considered first. In this study area, there are several geometric distortions on SAR images along the undulating sides of the river. In order to improve the accuracy of identification, the relationship between the location of SADA and geometric distortion must be considered comprehensively, the areas that may be inaccurate are eliminated, and the results are refined. Based on the incidence angle, heading angle, and external DEM data of the satellite, the terrain visibility results of the ascending and descending orbit SAR satellites in the study area were obtained, and the results are shown in Figure 6. The percentage of each visibility type for ascending and descending orbits were counted, and the results are shown in Table 2. From the results, it can be seen that there are many geometric distortion areas in the single orbit data, among which the percentage of layover and shadow areas in the ascending orbit data is 12.0%, and the percentage of stacked and shadowed areas in the descending orbit data is 9.4%. For most of the layover and shadow areas, the ascending and descending orbit data can complement each other, and after the combination of ascending and descending orbit, the area of stacked and shadowed areas is only 0.2%.
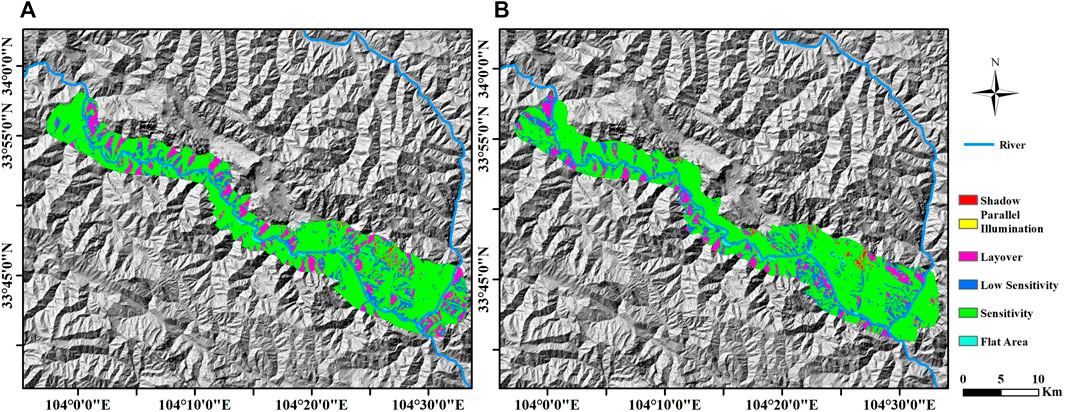
FIGURE 6. Visibility results of sentinel-1A from the (A) ascending orbit and (B) descending orbit.
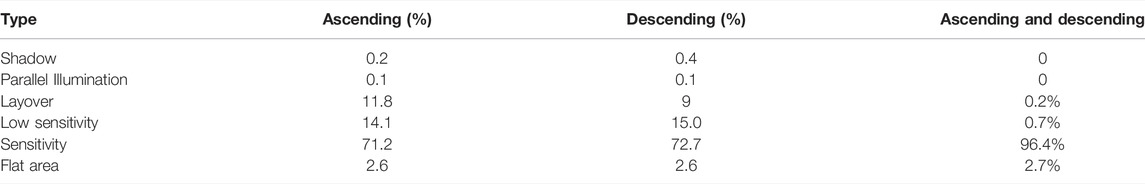
TABLE 2. SAR data observation information ratio.
As shown in Figure 7, based on the aboveobtained visibility results, geometric distortion analysis and verification were performed on the SADA identified from this study area, among which one SADA on the ascending orbit was located in the geometric distortion area, and three SADAs on the descending orbit were located in the geometric distortion area. It should be noted that the purpose of our automatic extraction method is to obtain the deformation area more efficiently, and the deformation area obtained after eliminating the geometric distortion area is the result we like to obtain, and the abovementioned process is automatic.
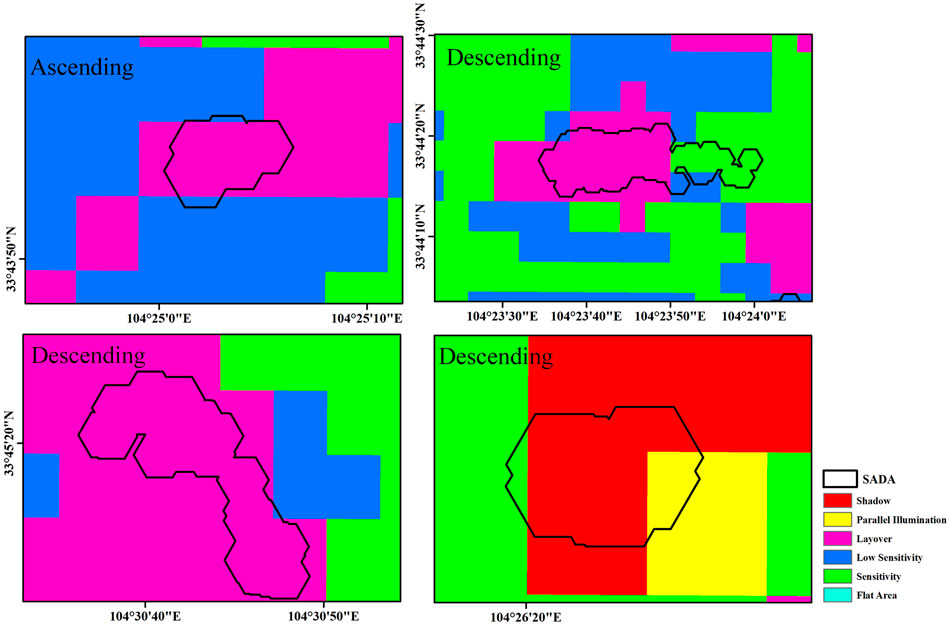
FIGURE 7. The distribution map of unreliable SADA. The image shows one SADA in the geometric distortion area from ascending data, and three SADA in the geometric distortion area from descending data.
To count the total number identified, optical images are needed to assist. For the same landslide, different parts of the deformation may be identified in the ascending and descending results, so it is necessary to combine the optical images to determine whether the identified deformation areas are located on the same slope to avoid double counting. After combining the integrated identify SADA with the GoogleEarth long time-series optical images and eliminating the unreliable areas located in geometric distortion, the final statistics obtained a total of 62 SADA found in this study area, and the study area was divided into two sections with the Zhouqu County as the boundary, of which there were 10 upstream and 52 downstream, and the final result of the SADA is shown in Figure 8A. By comparing with 12 typical landslides in the study area, 9 typical landslides match with the detected SADA, which indicates the high accuracy of this method. In addition, Sun et al. (2016) used InSAR to identify four typical deformation areas, all of which are located in the identified 62 SADAs. Dai et al. (2021) used SBAS-InSAR to detect 23 active landslides around Zhouqu County, which are highly consistent with the SADA obtained in this paper.
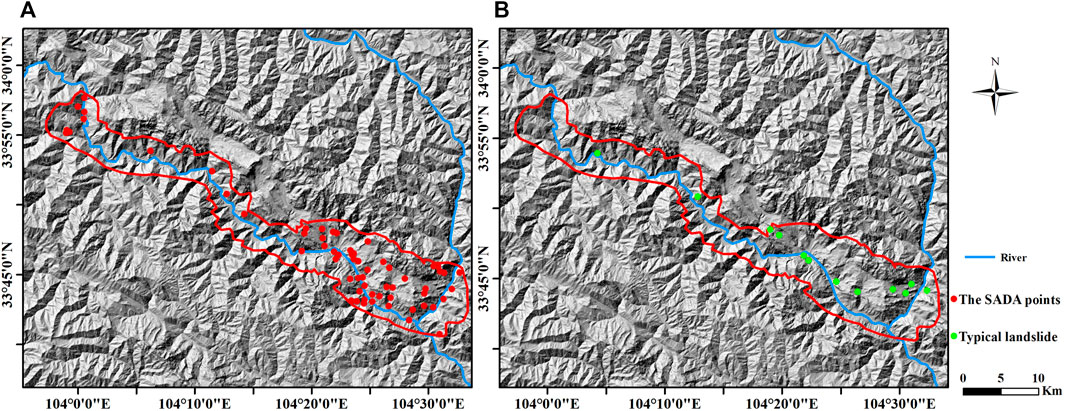
FIGURE 8. SADA and landslide maps. (A) Final result of the SADA distribute and (B) typical landslide distribute.
4.3 Nanyu Landslide Deformation Analysis
The Nanyu landslide is located on a large paleo-landslide body which includes two large landslides: the Nanyu landslide and the Jiangdingya landslide. Due to many repeated activities, the surface of the Nanyu landslide is undulating and part of the area has been artificially transformed into an arable land. The trailing edge of the landslide is steep, forming a chert ridge. The longitudinal gully of the landslide is developed, and the deep gully of erosion on the east and west sides is the boundary of the landslide (Zhang et al., 2018). The landslide body has a loose structure, and the main components are gravel and loess.
4.3.1 Spatial Characteristics of Deformation
As shown in Figure 9 and Figure 10, the deformation of the whole Nanyu landslide obtained from the descending orbit data and the deformation along the aspect obtained from the decomposition of the ascending and descending orbit are shown, respectively. From the monitoring results, it can be seen that there is obvious deformation of the Nanyu landslide located on the northwest side of the landslide body. From the aspect deformation rate diagram, the deformation rate of the top of the landslide is more than 70 mm/a, and the maximum can reach 102 mm/a, while the deformation rate of the middle and lower part is about 20 mm/a∼40 mm/a. The rate of the trailing edge of the landslide is much larger than the front edge, which indicates that the movement mode of the landslide is pushing type. The direction of movement of each point of the Nanyu landslide is shown in Figure 11. The landslide belongs to the overall decline, and the bottom of the slope slides into the river after the rapid decline, so there is no obvious siltation phenomenon on the slope.
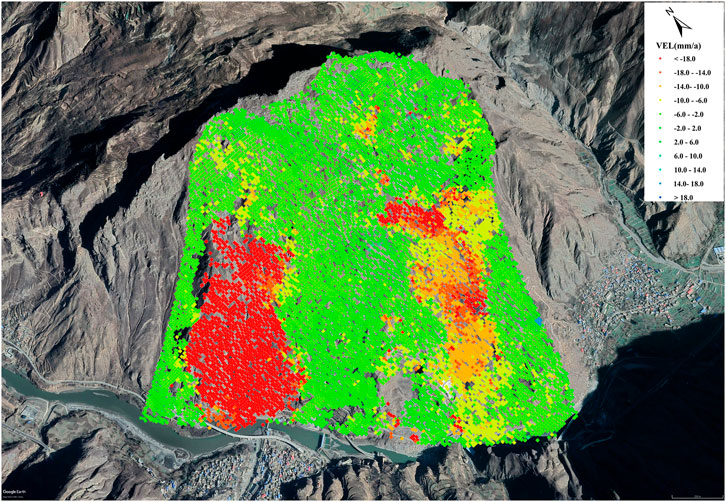
FIGURE 9. Deformation from the descending orbit data.
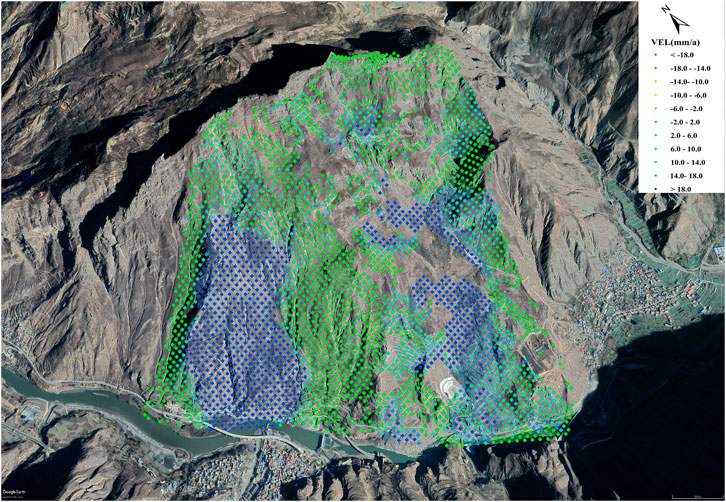
FIGURE 10. The deformation along the aspect.
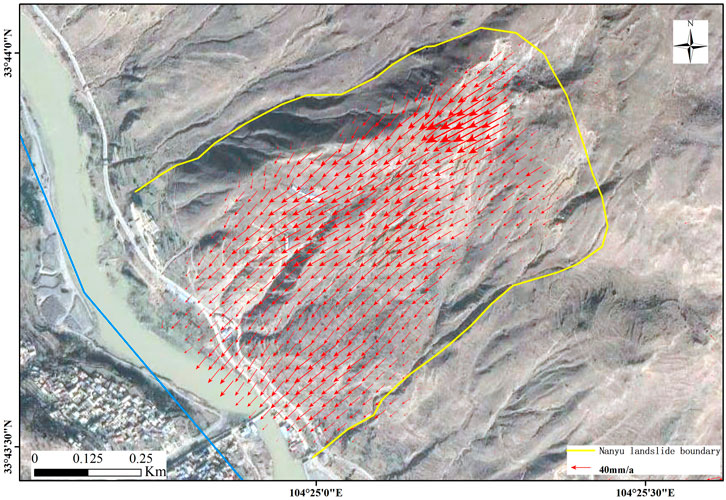
FIGURE 11. Motion direction map of Nanyu landslide.
4.3.2 Temporal Characteristics of the Deformation
As shown in Figure 12, to study the temporal characteristics of landslide deformation, the landslide body was divided into three parts, front, middle, and back, and the average deformation of each part was calculated separately. The calculation was carried out only for the points where the deformation rate was greater than 15 mm/a. The cumulative deformation curves of the three parts are shown in Figure 13. The average deformation rate of the front part is −21 mm/a, and the cumulative deformation is −44 mm; the average deformation rate of the middle part is −30 mm/a, and the cumulative deformation is −64 mm; the average deformation rate of the back part is −48 mm/a, and the cumulative deformation is −96 mm. During the monitoring time period, the deformation trend of the three parts is more consistent, and all of them show the deformation away from the satellite direction.
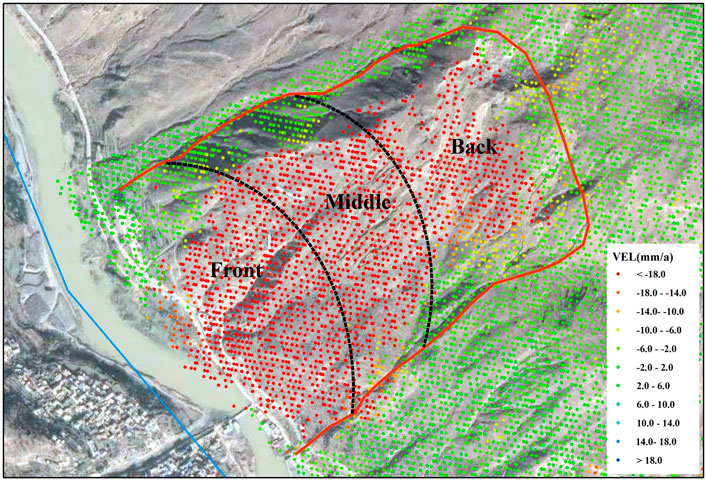
FIGURE 12. Landslide body division map.
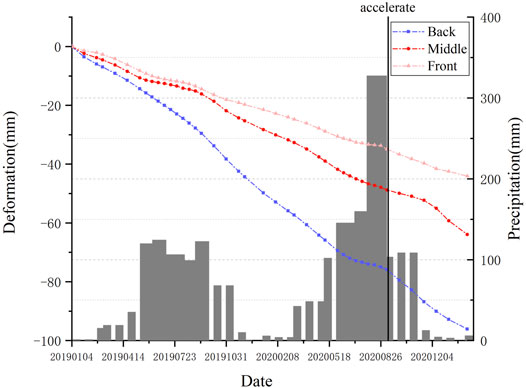
FIGURE 13. Time-series deformation and precipitation of three parts.
As shown in Figure 13, the landslide deformation did not accelerate immediately with the increase in precipitation at the beginning of the rainy season in June each year but began to accelerate when the precipitation reached its peak in August. This indicates that the accelerated deformation of the landslide is related to the high intensity of intensive precipitation. When the rainfall is not enough to make the landslide unstable, the accelerated deformation of the landslide body lags behind the rainfall, and the accelerated deformation of the landslide body continues after each cycle of rainfall. This phenomenon is highly consistent with the study results of Yang et al. (2014) and Ma et al. (2020). Significantly, the acceleration of landslide deformation in 2019 is less than in 2020, which correlates well with the magnitude of the rainfall peak, suggesting that more intense precipitation triggers faster deformation.
5 Discussion
Landslides occur as a result of coupled internal and external dynamics. Fault distribution, slope, vegetation coverage, precipitation, and human activities can all affect landslides.
5.1 Active Faults and Slope
Fault is the basic factor controlling the formation and development of landslides. Fault activity causes slope fragmentation and changes in the regional tectonic stress field so that landslides are distributed along major active fault zones. As shown in Figure 14A, the spatial distribution of the identified SADA is highly correlated with the distribution of active faults, which indicates that faults are one of the important factors affecting landslides in the area. As shown in Figure 14B, the slope of the SADA and the whole study area were counted separately, and the maximum frequency slope of the SADA area is 15°, which is smaller than the maximum frequency slope of the whole study area of 38°, which indicates that the landslides in this area are mostly developed on smaller slopes, which is consistent with the study of Zhang et al. (2018). The focus should be on the gentle slopes within the influence of faults in future disaster control.
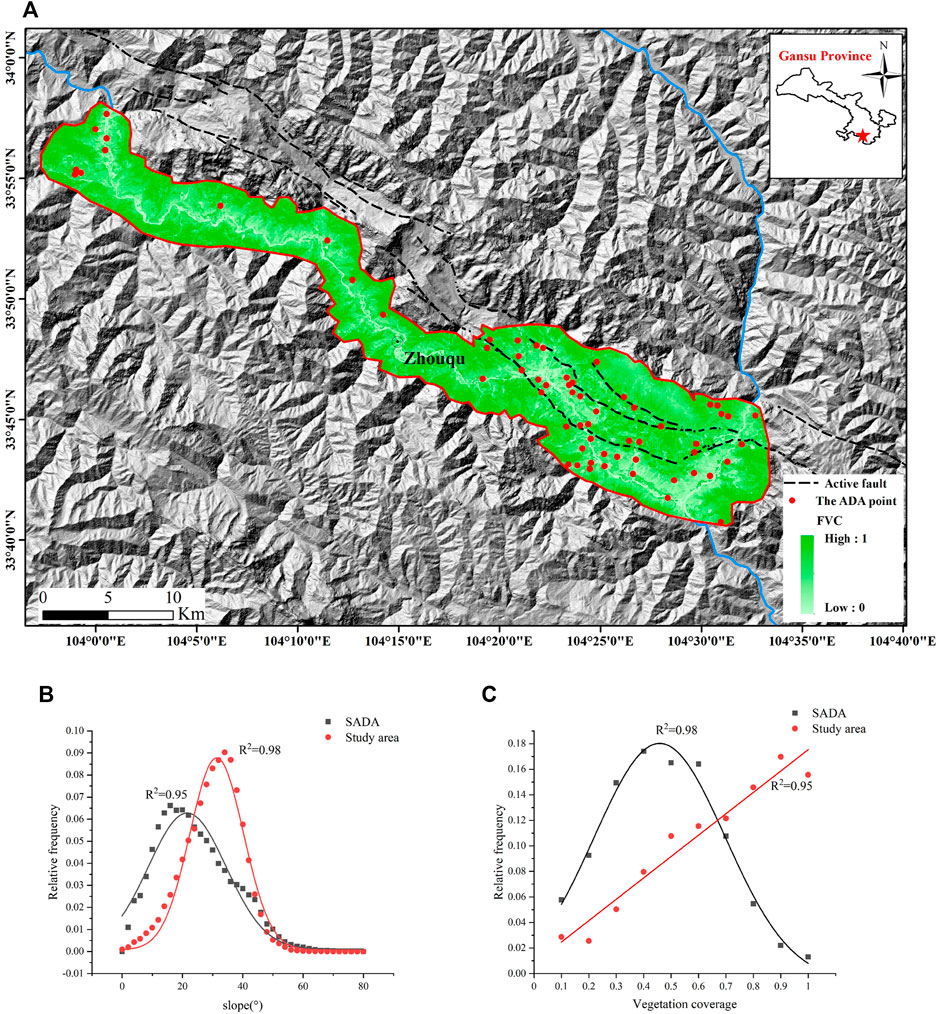
FIGURE 14. Factors influencing landslides. (A) Vegetation coverage and fault distribution map of study area, (B) relative frequency distributions of slope angle, (C) relative frequency distributions of vegetation coverage.
5.2 Vegetation Coverage
As an important factor in the surface evolution, vegetation is constantly influencing the surrounding soil evolution, hydrological evolution, and geomorphological evolution, which are all closely related to the formation of landslides. As shown in Figure 14A and Figure 14C, the vegetation coverage of the study area was calculated based on Landsat8 images. The vegetation coverage of SADA and the whole study area were counted separately, the average vegetation coverage of SADA was 0.42, and the average vegetation coverage of the whole study area was 0.66. The distribution of SADA in this study area was negatively related to the vegetation coverage, and the higher the vegetation coverage in this study area, the less likely landslides occurred.
5.3 Precipitation
Continuous and concentrated rainfall plays an important role in inducing landslide damage (Qiu et al., 2020). The spatial and temporal distribution of precipitation in the study area is uneven. As shown in Figure 13, 70% of precipitation is distributed from June to September, with more localized and concentrated heavy precipitation. Higher precipitation was seen in the southeastern part of the study area than in the northwestern part (Li et al., 2015). This precipitation characteristic leads to landslide susceptibility in the southeastern part of the study area.
5.4 Human Activities
The population in this study area is distributed along the river valley, and there is very little land available for development. Therefore, human activities that are not conducive to slope stability, such as excavating the foot of the slope and filling the ditch to create land, occur frequently. Figure 15 shows the presence of numerous traces of human activities on the Nanayu landslide. There are trails and roads on the landslide, which destroy the slope structure and reduce the stability of the landslide. In addition, most of the transportation routes were built along the river valleys, and human engineering activities were particularly intense (Ma et al., 2020).
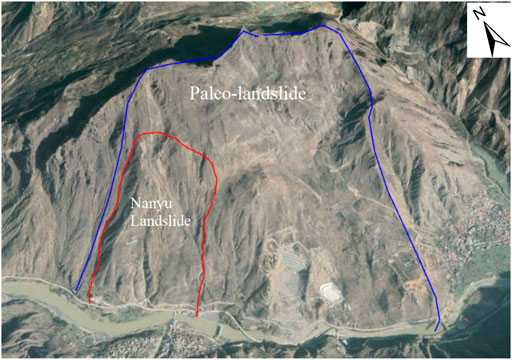
FIGURE 15. Optical image of Nanyu landslide.
In this study, the DS-InSAR technology is used to process SAR data, and the results monitored by different orbit data are slightly different, which is due to the fact that SAR satellites are side-view imaging systems, and the use of ascending and descending orbit data can play a complementary effect. Since the SAR satellite flies along the north–south direction, it is not sensitive to the deformation in the north–south direction for either the ascending or descending orbit data, so the subsequent introduction of Pixel Offset Tracking or Multiple Aperture InSAR methods can be considered to assist in the deformation area identification. Since C-band sentinel data are used in this study, compared with L-band SAR data, the penetration ability of this band is weaker for vegetation, which may lead to difficulties in obtaining valid and reliable observations on slopes partially covered with vegetation. Otherwise, for areas with more vegetation cover, it is necessary to use high-resolution optical images, stratigraphic lithology and other data, and ground investigation to make interpretations and judgments.
The proposed identification method relies on the validity of InSAR monitoring results, and for low-coherence regions, accurate InSAR monitoring results cannot be obtained, and the SADA cannot be identified by this method. In addition, it is worth noting that the accuracy of terrain visibility depends on the accuracy of DEM, which is also the limitation of the method.
6 Conclusion
Based on the DS-InSAR deformation monitoring results, this study proposes a method for automatic identification of SADA. Compared with previous studies, the method can identify SADA from large-scale deformation data efficiently and rapidly; also, the accuracy of identification can be improved by considering the influence of SAR image geometric distortion in the high mountain canyon area.
The method was used to identify the areas on both sides of the Bailong River in the Zhouqu region. The study showed that landslide hazard detection using single orbit radar satellite data could lead to the leakage of landslide hazards easily, and a total of 62 SADA were identified in the study area by integrating the deformation results obtained from ascending and descending orbit images and SAR visibility analysis results. It is proven that the results of deformation area identification have high accuracy.
The deformation of the Nanayu landslide began to accelerate when the precipitation reached its peak and lasted for a period of time. The deformation of this landslide has a high correlation with rainfall.
Data Availability Statement
The original contributions presented in the study are included in the article/Supplementary Material, further inquiries can be directed to the corresponding author.
Author Contributions
All authors listed have made a substantial, direct, and intellectual contribution to the work and approved it for publication.
Funding
This research was funded by the National Natural Science Foundation of China (51474217), the Ecological Smart Mine Joint Fund of the Natural Science Foundation of Hebei Province (E2020402086) and the Fundamental Research Funds for the Central Universities (2022YQDC01).
Conflict of Interest
The authors declare that the research was conducted in the absence of any commercial or financial relationships that could be construed as a potential conflict of interest.
Publisher’s Note
All claims expressed in this article are solely those of the authors and do not necessarily represent those of their affiliated organizations, or those of the publisher, the editors and the reviewers. Any product that may be evaluated in this article, or claim that may be made by its manufacturer, is not guaranteed or endorsed by the publisher.
Acknowledgments
The DEM, Sentinel-1 data, and Landsat8 images were provided by the Japan Aerospace Exploration Agency (JAXA), European Space Agency (ESA), and United States Geological Survey(USGS), respectively.
References
Aleotti, P., and Chowdhury, R. (1999). Landslide hazard Assessment: Summary Review and New Perspectives. Bull. Eng. Geol. Env 58, 21–44. doi:10.1007/s100640050066
Bai, S., Wang, J., Zhang, Z., and Cheng, C. (2012). Combined Landslide Susceptibility Mapping after Wenchuan Earthquake at the Zhouqu Segment in the Bailongjiang Basin, China. Catena 99, 18–25. doi:10.1016/j.catena.2012.06.012
Barra, A., Solari, L., Béjar-Pizarro, M., Monserrat, O., Bianchini, S., Herrera, G., et al. (2017). A Methodology to Detect and Update Active Deformation Areas Based on sentinel-1 SAR Images. Remote Sensing 9, 1002. doi:10.3390/rs9101002
Cao, N., Lee, H., and Jung, H. C. (2016). A Phase-Decomposition-Based PSInSAR Processing Method. IEEE Trans. Geosci. Remote Sensing 54, 1074–1090. doi:10.1109/TGRS.2015.2473818
Cigna, F., Bateson, L. B., Jordan, C. J., and Dashwood, C. (2014). Simulating SAR Geometric Distortions and Predicting Persistent Scatterer Densities for ERS-1/2 and ENVISAT C-Band SAR and InSAR Applications: Nationwide Feasibility Assessment to Monitor the Landmass of Great Britain with SAR Imagery. Remote Sensing Environ. 152, 441–466. doi:10.1016/j.rse.2014.06.025
Cui, P., Zhou, G. G. D., Zhu, X. H., and Zhang, J. Q. (2013). Scale Amplification of Natural Debris Flows Caused by Cascading Landslide Dam Failures. Geomorphology 182, 173–189. doi:10.1016/j.geomorph.2012.11.009
Dai, C., Li, W., Wang, D., Lu, H., Xu, Q., and Jian, J. (2021). Active Landslide Detection Based on sentinel-1 Data and InSAR Technology in Zhouqu County, Gansu Province, Northwest china. J. Earth Sci. 32, 1092–1103. doi:10.1007/s12583-020-1380-0
Dai, F. C., Lee, C. F., and Ngai, Y. Y. (2002). Landslide Risk Assessment and Management: an Overview. Eng. Geology. 64, 65–87. doi:10.1016/S0013-7952(01)00093-X
Dun, J., Feng, W., Yi, X., Zhang, G., and Wu, M. (2021). Detection and Mapping of Active Landslides before Impoundment in the Baihetan Reservoir Area (China) Based on the Time-Series InSAR Method. Remote Sensing 13, 3213. doi:10.3390/rs13163213
Ferretti, A., Fumagalli, A., Novali, F., Prati, C., Rocca, F., and Rucci, A. (2011). A New Algorithm for Processing Interferometric Data-Stacks: SqueeSAR. IEEE Trans. Geosci. Remote Sensing 49, 3460–3470. doi:10.1109/TGRS.2011.2124465
Ferretti, A., Prati, C., and Rocca, F. (2001). Permanent Scatterers in SAR Interferometry. IEEE Trans. Geosci. Remote Sensing 39, 8–20. doi:10.1109/36.898661
Fornaro, G., Verde, S., Reale, D., and Pauciullo, A. (2015). CAESAR: An Approach Based on Covariance Matrix Decomposition to Improve Multibaseline-Multitemporal Interferometric SAR Processing. IEEE Trans. Geosci. Remote Sensing 53, 2050–2065. doi:10.1109/TGRS.2014.2352853
Goel, K., and Adam, N. (2014). A Distributed Scatterer Interferometry Approach for Precision Monitoring of Known Surface Deformation Phenomena. IEEE Trans. Geosci. Remote Sensing 52, 5454–5468. doi:10.1109/TGRS.2013.2289370
Hilley, G. E., Bürgmann, R., Ferretti, A., Novali, F., and Rocca, F. (2004). Dynamics of Slow-Moving Landslides from Permanent Scatterer Analysis. Science 304, 1952–1955. doi:10.1126/science.1098821
Jiang, M., Ding, X., Hanssen, R. F., Malhotra, R., and Chang, L. (2015). Fast Statistically Homogeneous Pixel Selection for Covariance Matrix Estimation for Multitemporal InSAR. IEEE Trans. Geosci. Remote Sensing 53, 1213–1224. doi:10.1109/TGRS.2014.2336237
Jiang, S., Wen, B.-P., Zhao, C., Li, R.-D., and Li, Z.-H. (2016). Kinematics of a Giant Slow-Moving Landslide in Northwest China: Constraints from High Resolution Remote Sensing Imagery and GPS Monitoring. J. Asian Earth Sci. 123, 34–46. doi:10.1016/j.jseaes.2016.03.019
Kavoura, K., Konstantopoulou, M., Depountis, N., and Sabatakakis, N. (2020). Slow-moving Landslides: Kinematic Analysis and Movement Evolution Modeling. Environ. Earth Sci. 79, 1–11. doi:10.1007/s12665-020-8879-7
Li, Z. H., Wen, B. P., Jia, G. Y., Zhang, Y. J., Dong, K. J., and Yang, Y. B. (2015). Characteristics of the Landslide Distribution along the Bailongjiang River basin and its Controlling Factors. J. Lanzhou University(Natural Sciences) 51 (06), 768–776. doi:10.13885/j.issn.0455-2059.2015.06.002
Liu, X., Zhao, C., Zhang, Q., Peng, J., Zhu, W., and Lu, Z. (2018). Multi-Temporal Loess Landslide Inventory Mapping with C-, X- and L-Band SAR Datasets-A Case Study of Heifangtai Loess Landslides, China. Remote Sensing 10, 1756. doi:10.3390/rs10111756
Luo, S., Feng, G., Xiong, Z., Wang, H., Zhao, Y., Li, K., et al. (2021). An Improved Method for Automatic Identification and Assessment of Potential Geohazards Based on MT-InSAR Measurements. Remote Sensing 13, 3490. doi:10.3390/rs13173490
Ma, S., Qiu, H., Hu, S., Yang, D., and Liu, Z. (2020). Characteristics and Geomorphology Change Detection Analysis of the Jiangdingya Landslide on July 12, 2018, China. Landslides 18, 383–396. doi:10.1007/s10346-020-01530-3
Novellino, A., Cesarano, M., Cappelletti, P., Di Martire, D., Di Napoli, M., Ramondini, M., et al. (2021). Slow-moving Landslide Risk Assessment Combining Machine Learning and InSAR Techniques. Catena 203, 105317. doi:10.1016/j.catena.2021.105317
Qiu, H., Cui, Y., Pei, Y., Yang, D., Hu, S., Wang, X., et al. (2020). Temporal Patterns of Nonseismically Triggered Landslides in Shaanxi Province, China. Catena 187, 104356. doi:10.1016/j.catena.2019.104356
Ren, T., Ma, S., Bowa, V. M., Tang, H., Chen, J., and Zhao, F. (2021). An Improved R-Index Model for Terrain Visibility Analysis for Landslide Monitoring with InSAR. Remote Sensing 13, 1938. doi:10.3390/rs13101938
Schuster, R. L., and Highland, L. M. (2007). The Third Hans Cloos Lecture. Urban Landslides: Socioeconomic Impacts and Overview of Mitigative Strategies. Bull. Eng. Geol. Environ. 66, 1–27. doi:10.1007/s10064-006-0080-z
Sun, Q., Hu, J., Zhang, L., and Ding, X. (2016). Towards Slow-Moving Landslide Monitoring by Integrating Multi-Sensor InSAR Time Series Datasets: The Zhouqu Case Study, China. Remote Sensing 8, 908. doi:10.3390/rs8110908
Sun, Q., Zhang, L., Ding, X. L., Hu, J., Li, Z. W., and Zhu, J. J. (2015). Slope Deformation Prior to Zhouqu, China Landslide from InSAR Time Series Analysis. Remote Sensing Environ. 156, 45–57. doi:10.1016/j.rse.2014.09.029
Vilímek, V., Wang, F., and Strom, A. (2021). Catastrophic Landslides and Frontiers of Landslide Science. Landslides 18, 3733–3735. doi:10.1007/s10346-021-01765-8
Wang, G. L. (2013). Lessons Learned from Protective Measures Associated with the 2010 Zhouqu Debris Flow Disaster in China. Nat. Hazards 69, 1835–1847. doi:10.1007/s11069-013-0772-1
Wild, C. T., Marsh, O. J., and Rack, W. (2018). Unraveling InSAR Observed Antarctic Ice-Shelf Flexure Using 2-D Elastic and Viscoelastic Modeling. Front. Earth Sci. 6. doi:10.3389/feart.2018.00028
Yang, W. M., Huang, X., Zhang, C. S., and Si, H. B. (2014). Deformation Behavior of Landslides and Their Formation Mechanism along Pingding Huama Active Fault in Bailongjiang River Region. J. Jilin University(Earth Sci. Edition) 44 (02), 574–583. doi:10.13278/j.cnki.jjuese.201402201
Zhang, N., and Matsushima, T. (2016). Simulation of Rainfall-Induced Debris Flow Considering Material Entrainment. Eng. Geology. 214, 107–115. doi:10.1016/j.enggeo.2016.10.005
Zhang, Y., Meng, X., Chen, G., Qiao, L., Zeng, R., and Chang, J. (2016). Detection of Geohazards in the Bailong River basin Using Synthetic Aperture Radar Interferometry. Landslides 13, 1273–1284. doi:10.1007/s10346-015-0660-8
Zhang, Y., Meng, X., Jordan, C., Novellino, A., Dijkstra, T., and Chen, G. (2018). Investigating Slow-Moving Landslides in the Zhouqu Region of China Using InSAR Time Series. Landslides 15, 1299–1315. doi:10.1007/s10346-018-0954-8
Zhang, Y., Meng, X. M., Dijkstra, T. A., Jordan, C. J., Chen, G., Zeng, R. Q., et al. (2020). Forecasting the Magnitude of Potential Landslides Based on InSAR Techniques. Remote Sensing Environ. 241, 111738. doi:10.1016/j.rse.2020.111738
Zhao, C., Lu, Z., Zhang, Q., and de la Fuente, J. (2012). Large-area Landslide Detection and Monitoring with ALOS/PALSAR Imagery Data over Northern California and Southern Oregon, USA. Remote Sensing Environ. 124, 348–359. doi:10.1016/j.rse.2012.05.025
Keywords: DS-InSAR, slope active deformation areas, automatic identification, geometric distortion, temporal and spatial characteristics
Citation: Wang Y, Cui X, Che Y, Li P, Jiang Y and Peng X (2022) Automatic Identification of Slope Active Deformation Areas in the Zhouqu Region of China With DS-InSAR Results. Front. Environ. Sci. 10:883427. doi: 10.3389/fenvs.2022.883427
Received: 25 February 2022; Accepted: 30 March 2022;
Published: 28 April 2022.
Edited by:
Chen Yu, Newcastle University, United KingdomReviewed by:
Yang Liu, Wuhan University, ChinaFatma Canaslan Çomut, Ministry of Interior Disaster and Emergency Management Presidency, Turkey
Elena Nikolaeva, Serco (United Kingdom), United Kingdom
Copyright © 2022 Wang, Cui, Che, Li, Jiang and Peng. This is an open-access article distributed under the terms of the Creative Commons Attribution License (CC BY). The use, distribution or reproduction in other forums is permitted, provided the original author(s) and the copyright owner(s) are credited and that the original publication in this journal is cited, in accordance with accepted academic practice. No use, distribution or reproduction is permitted which does not comply with these terms.
*Correspondence: Ximin Cui, Y3htQGN1bXRiLmVkdS5jbg==