 Sabine Fritz
 Felix Grusdat 1
 Christoph Schneider
 - 1Geography Department, Humboldt-Universität zu Berlin, Berlin, Germany
- 2Denison University, Granville, OH, United States
The impact of airports on ambient air pollution is a major concern due to its impact on public health. This study analyzes the sub-micron total particle number concentration (PNC) as a proxy for ultrafine particles in the immediate vicinity of Berlin-Tegel Airport (TXL) based on a mobile measurement campaign in summer 2019. With predominantly westerly winds, 45 measurement runs took place along a 20–30 km route to the east of the airport. The highlights of the study are as follows: 1. Berlin-Tegel Airport had a distinct but a spatially limited impact on the residential areas to the east of the airport. 2. Particle number concentrations in the lee of the airport are significantly higher than the mean of the entire area. 3. Locations along the eastward extension of the runways are significantly more affected than those outside the approach corridor. 4. The impact of airport operations on PNC in the adjacent neighborhood is comparable to the combined impact of busy roads in the area. The closure of Berlin-Tegel Airport at the end of 2020 should have considerably improved the air quality in the residential areas in the close vicinity of the airport.
1 Introduction
Poor air quality is a major cause of premature death worldwide (WHO, 2019). Particulate matter in particular causes both short- and long-term health effects (Pope and Dockery, 2006; WHO, 2013). Among particulate air pollutants, sub-micron particles with a diameter of ≤1 µm are increasingly becoming a concern as their small size allows them to penetrate far into the body (HEI Review Panel on Ultrafine Particles, 2013). About 84% of the particle number concentration (PNC) of these small airborne particles are ultrafine particles with a diameter below 100 nm (Rahman et al., 2017).
In cities, the main parameter affecting PNC is road traffic (Kumar et al., 2014; Kukkonen et al., 2016). However, airport operations and air traffic are additional sources, especially near large airports. The study by Stafoggia et al. (2016) at Rome-Ciampino city airport shows that take-offs are the main source of ultrafine particles (UFPs) in the direct vicinity of an airport. These results are confirmed by Lorentz et al. (2019) for Frankfurt Airport, the largest airport in Germany. Their study concludes that aircraft engines account for the largest share of UFP emissions generated by airports. Taxiing is of particular relevance in their assessment. PNC from the airport affects the health of airport employees and residents living in the vicinity of an airport negatively (He et al., 2020; Lammers et al., 2020; Bendtsen et al., 2021). In addition, aircraft noise has been associated with cardiovascular health effects in people living near airports (Correia et al., 2013; Hansell et al., 2013).
The impact of airports on the surrounding areas has been investigated in previous studies, mainly at study sites with large bodies of water upwind of the airport like in Los Angeles (Hudda et al., 2014), Rome (Stafoggia et al., 2016) or Boston (Hudda et al., 2018), which minimizes variations in background concentrations. They found that activities at airports cause a PNC increase. That effect can be observed up to a distance of several kilometers downwind of the airfield (Hudda et al., 2014; Lorentz et al., 2019).
In contrast to them, our study area is located near Berlin-Tegel Airport (TXL), at the northwestern outskirts of the urban area of Berlin in the continental part of Germany. A large residential area is located to the east of the airport, downwind of the prevailing west and southwesterly winds at the airport. Our study analyzes spatial differences in the PNC to the east of TXL. The focus is on the two main sources of ultrafine particles, road traffic and airport operations. The study analyzes the impact of these two sources and compares them in three consecutive analysis steps.
First, we examine the impact of road traffic on air pollution by analyzing different traffic parameters. Then, the impact of the airport on PNC is investigated. Areas near the approach corridor are contrasted with those outside this area. Three zones of different sizes are defined as downwind of the airport to assess the range of impact (angle α in Figure 1). In the third step, the contributions of road traffic and airport operations are compared.
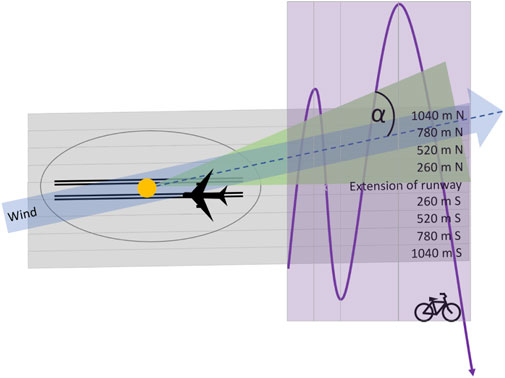
FIGURE 1. Green zone: area defined as downwind of the airport. For α, the three angles ±10°, ±20°, or ±45° are used. Angles are calculated in reference to the center of the airport (orange dot). Gray zone: area defined as within the flight path. Zones are named according to their distance north or south of the extension of the runway. Purple zone: area covering the transects of the measurement route perpendicular to the extension of the runways.
2 Methods
2.1 Study area
Observations were conducted east of TXL in summer 2019. At that time, TXL was the main commercial airport in Berlin with aircraft operations totaling 193,615 in 2019 (Flughafen Berlin Brandenburg GmbH, 2020). The airport shut down on 8 November 2020. The center of TXL is located at 13.287716 E and 52.55979 N. There are two runways, approximately in an east–west orientation and about 260 m apart. In the immediate vicinity of the airport, a motorway runs north–south east of the airfield; however, in the immediate east of TXL, the motorway passes through an underground tunnel (Figure 2).
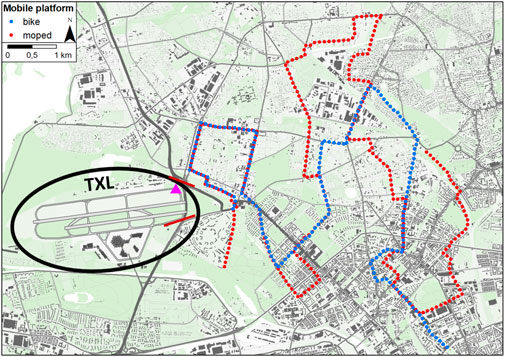
FIGURE 2. Study area; blue dots: route of bicycle measurements; red dots: route of moped measurements; Berlin-Tegel Airport (TXL) is marked with black ellipse. Between the two red lines, the highway (dark gray line) leads through an underground tunnel in the east of TXL. Pink triangle: weather station of Germany’s National Meteorological Service (DWD). Data basis: Environmental Atlas Berlin.
A mobile measurement campaign was carried out using both a bicycle and a moped as monitoring platforms. The measurement route is located in the east of the airfield site. In accordance with the study by Hudda et al. (2014), the route crosses the prevailing wind direction several times at different distances from the airport. The closest transect is at about 2,000 m from the center of the airport, which corresponds to a distance of 500 m from the end of the runway. The last transect was carried out at approximately 7,000 m from the center of the airfield. The campaign took place from 29 May 2019 to 11 July 2019 between 8 a.m. and 6 p.m. Per bicycle, 20 measurement runs were carried out on 14 days along a route of 20.2 km. Per moped, 25 runs took place on 14 days along a distance of 31 km. On average, one run lasted about 80 min per bike and 70 min per moped. In total, data amounting to 56 h were collected over more than 1,000 km. The measurements took place on precipitation-free days and focused on situations with southwesterly and westerly winds; however, six of the 45 runs were conducted with the measurement route upwind of the airport (i.e., during easterly winds).
2.2 Data
Total PNC was recorded using two TSI CPC 3007 condensation particle counters (CPCs) (TSI Incorporated, 2012). The particle size ranges from 10 to 1,000 nm, with an accuracy of 20% as specified by the manufacturer. The devices were calibrated against a GRIMM EDM 465 before and after the measurement campaign (GRIMM Aerosol Technik GmbH and Co, 2013). PNC was recorded with a 1-s resolution, with the air inlet at nose level. The devices were positioned in the top of a backpack with the air inlet facing the road. For the moped measurements, the backpack with the CPC was arranged with the air inlet as far away from the exhaust pipe as possible to avoid self-sampling. Flow checks were carried out before and after the campaign. Zero checks were performed before each run. Values of 1.67772 × 107 cm−3 were removed as this value is due to a device error that sometimes occurs when the device is switched on and off, and when the device is subjected to excessive shocks, for example, vibrations when driving over cobblestones. Concentrations above 100,000 cm−3 (less than 1% of the data for the moped campaign and none for the bicycle campaign) are set to 100,000 cm−3. The latter is the largest reliable measurement of the devices used here instead of other approaches as those proposed in Hankey and Marshall (2015) or Westerdahl et al. (2005). In any case, the exact values of very high measurements are of little importance in this study due to the use of the median for spatial averages.
Indoor (R2 = 0.94, p-value
The GPS data were continuously recorded using the smartphone app OsmAnd (OsmAnd app, 2019). They are combined with the PNC data of the CPCs via the attribute of time.
The wind data are provided by the official automatic weather station Berlin-Tegel, with the station number 430, which is operated by the German Weather Service (DWD) (DWD Climate Data Center, 2021). The station is located at TXL northeast of the runways (Figure 2) at 36 m ASL, with the wind sensors mounted at 10 m AGL. The data are available in hourly resolution. The directional information is based on a 36-part wind rose. The wind data are aggregated with the PNC data as mean wind speed and circular mean wind direction (Agostinelli and Lund, 2017) for each point, run, and campaign.
2.3 Data handling
To produce inter-route consistency, 100-m long road segments are generated along the measurement routes. This results in 190 segments along the bicycle route and 311 segments along the moped route. Each PNC measurement is assigned to the nearest track point, defined as the centroid of each 100 m route segment. The median PNC is calculated for each run and each 100 m track point (PNCtotal). Consequently, all measurement points are at a maximum distance of 100 m from the closest track point. Aggregating the data for each 100 m point results in an average number of four measurements per point for each bicycle route run and 13 data points for each location along a moped route run.
Spatial differences in PNC are the main focus of the study. To make them more prominent, we normalize the PNC for temporal variability between runs. Thus, the ratio PNCtotal/
Rank correlations according to Spearman and Kendall are performed instead of the Pearson product-moment correlation, since most data are not normally distributed. Moreover, these correlation forms not only resolve linear correlations but are also suitable for ordinal data and are more robust against outliers, which often occur in measurements of the PNC.
For hypothesis test statistics, asterisks show p-values with * for
2.4 Data analysis
The spatial variability along the measurement routes over all measurement runs is calculated as the arithmetic mean of PNCtotal/
Local PNC is used to account for temporal differences in background concentrations. The share φ of local PNC in total PNC is calculated as
Wind and pollutant roses are created with the package openair (Version 2.6–6, Carslaw and Ropkins, (2012)). The corresponding wind direction is divided into the angles of 45°. The frequency of counts per wind direction is calculated over all track points using wind speed for wind roses and PNCtotal, PNCbackground, PNCtotal/
To analyze the impact of road traffic, parameters are derived from spatial data provided by the Environmental Atlas Berlin. These data are linked to the track points via four buffers around each track point with the radii of 50, 100, 250, and 500 m. Spatial data are intersected per buffer size. The parameters have no temporal component and accordingly differ from point to point but not between measurement runs.
Table 1 gives an overview of the derived parameters, the obtained categories, and the methods used for processing the data and the data sources. Road types are provided in five categories, where the expected traffic volume is inversely proportional to the category number. Average daily traffic (ADT) is normalized to the length of the associated road segments. Road length is summed up per buffer size. The percentage of area covered by roads was chosen as an alternative to road length. Road traffic emission data and the evaluation of the emission quantities are based on measured and modeled traffic volumes as well as on the Motor Vehicle Traffic Emissions Registry for information on the typical vehicle fleet. These spatial data are provided for each road section, including additional information on emissions from tire and brake wear as well as typical driving speed and congestion. For road traffic emissions, only the pollutants NOx, PM10, PM2.5, and soot are included in the study. The four classes of the emission quantity evaluation are based on the percentiles of emission values in relation to the average emissions of the main traffic network of Berlin. Class one contains the lowest 30%, class two contains 31–70%, class three contains 71–90%, and class four contains the highest 10% of emission levels with respect to the absolute emissions in Berlin’s main road network. The evaluation of emission levels is based only on NOx and PM10 (SenStadtWohn, 2017). Therefore, for the assessment of the impact of road traffic on PNC, this official evaluation of the emission levels of the Berlin Senate is used. It offers the most comprehensive approach to capture all relevant variables of road traffic. For further analysis, this parameter is referred to as traffic evaluation and categorized into heavy traffic (classes 3 and 4) and light traffic (classes 1 and 2).
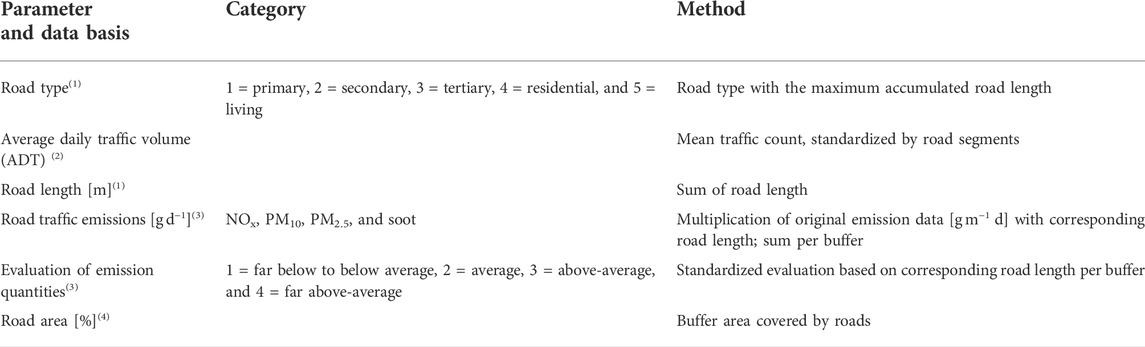
TABLE 1. Parameters derived from spatial data in combination with the four buffer radii. Data basis: Environmental Atlas Berlin, specific data sets: 1) Detailnetz Berlin (SenUVK, 2017), 2) traffic Volume 2014 (SenStadtUm, 2017), 3) traffic-related emissions 2015 (SenStadtWohn, 2017), and 4) ALKIS Berlin Gebäude (SenStadtWohn, 2015).
As the first explanatory variable for the analysis of the impact of the airport on spatial differences in the PNC in the surrounding area, the flight path is defined as the extension of the runway east of the airport into 10 categories (Figure 1). A rectangle encompassing the area of the two runways and extending beyond the area of the airfield to the end of the measurement route represents the eastward extension of the runway. This area is adjoined to the north and south by four further rectangles of the same width of 260 m, which extend the investigated area of potential impact of the flight path and airport both north and south. They are referred to as 260 m N to 1,040 m N for the areas north of the runway extension and correspondingly 260 m S to 1,040 m S in the south (Figure 1). Track points are either classified as inside one of the nine rectangles or as outside.
The distance and angle to the center of TXL are calculated for each track point on a spheroid, with the ArcGIS tool Near from the Analysis toolbox. In addition, the distance to the airport is categorized for each transect of the measurement route (purple area in Figure 1) with the extension of the runways (gray area in Figure 1). The angle is then converted to wind direction angles in degrees. For each track point, we determine whether it is downwind of the airport depending on the wind direction during the run (Figure 1). The lee is divided into three categories. All track points are classified as ±10°, ±20°, or ±45° downwind if they are either exactly downwind or within ±10°, ±20°, or ±45° of the wind direction in either direction. All other track points are classified as not downwind. The same type of classification is used for upwind situations.
The measurement route crosses the defined flight path four (bicycle) or five (moped) times. For the analysis of the relationship between the distance to the airport and the PNC, the average distances of all track points along the transect is calculated. The data are aggregated per transect. The corresponding wind direction is divided into opening angles of 45°. For each opening angle, the frequency of pollutant concentration counts at the track points is determined.
For the analysis of the effects of the flight path in downwind situations, the lee of the runway is calculated as ±10° for wind directions in the 250°–270° range, ±20° for winds from 240° to 280° and ±45° for wind directions 215°–305°, as the runways are at an angle of 260° or 80°. For each of these three categories, the track points are either assigned to the downwind category or considered as not downwind. Accordingly, track points are classified into three upwind categories (upwind ±10°, ±20° or ±45° for angles of track points to the airport center in the range of wind directions 70°–90°, 60°–100°, or 35°–125°). Points that lie outside these ranges are referred to as outside.
To distinguish road traffic from air traffic, the track points are classified on the basis of traffic emissions in their vicinity and their location in relation to the flight path. The track points are assessed according to the road traffic evaluation conducted by the Senate Department for Urban Development and Housing of Berlin (SenStadtWohn, 2017) and classified as either heavy traffic or light traffic as indicated earlier. Included is the area within a radius of 100 m around each track point. In addition, the study area is divided into areas within the flight path and those further away, including only those areas up to a distance of 520 m north and south of the outermost edges of the runways. Four categories are thus formed. Each track point is assigned to a specific category: 1) flight path, heavy traffic; 2) flight path, light traffic; 3) no flight path, heavy traffic; and 4) no flight path, light traffic.
For further analysis of the dependence on wind direction, the downwind conditions by opening angles are as explained previously. Accordingly, track points that do not fall into any of the three downwind categories are designated as not downwind.
We compare the impact of both road traffic and airport operations using a linear regression model. In a first step, we correlate all PNCtotal/
In a second step, we calculate the mean PNC for parameters categorized as described in the previous sections. Road traffic is divided into heavy traffic and light traffic, according to the traffic evaluation. The distance to the airport is calculated per north–south transect of the measurement route across the extension of the runway. The distance to the runway extension is categorized as shown in Figure 1. No distinction is made between distance to the south or north. Downwind angles are categorized as the angle α between the track points and the prevailing wind direction and are divided into four classes ≤10°, 10°–20°, 20°–45°, and 45°–90°.
3 Results
3.1 Total, local, and background PNC
The results in Table 2 show a range from 2,200 to 100,000 cm−3 of total PNC with a slightly lower median than the arithmetic mean. Local concentrations are, on average, about twice as high as background concentrations. Both measures of variability within the data show three times higher values for local concentrations than for background. The minima for the local concentrations as well as the share of local in total PNC are, by definition, 0. Similarly, the minima of total and background PNC must be the same. The lower value of the median compared to the mean shows the sensitivity of the arithmetic mean to particularly high outliers.
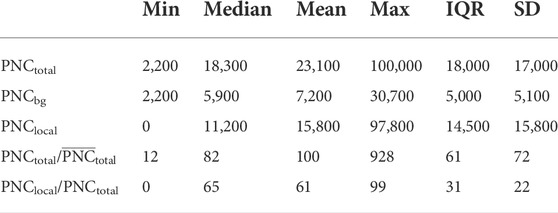
TABLE 2. Overview over all measurement data for PNCtotal [cm−3], background PNCbg [cm−3], and local concentrations PNClocal [cm−3] as well as the ratios PNCtotal/
Most of the measurements were taken for westerly or southwesterly winds (Figure 3). The highest wind speeds are observed in these prevailing wind directions, although there is little overall variation during the measurement period. A greater proportion of particularly high total PNC (
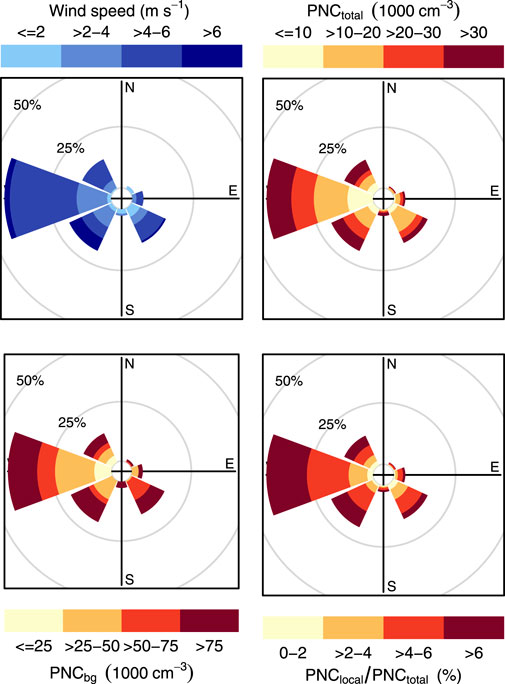
FIGURE 3. Wind rose and pollution rose plots. Pollution roses show the frequency distribution of PNCtotal, PNCbg, and PNClocal/PNCtotal by wind direction.
3.2 Impact of road traffic and traffic emissions
To distinguish road traffic impact from that of the airport, correlation analyses are performed for several variables representing road traffic (Figure 4). Of these variables, ADT and road type have the strongest correlation with PNC. The higher the traffic volume, the higher are the air pollution levels measured. Road types have a moderately negative correlation, as lower rank is generally associated with higher traffic volumes and speeds, and thus higher air pollution. For both ADT and road types, the correlations with PNC are strongest at the two smaller buffer sizes and steadily decrease with an increasing buffer size. At a buffer size of 500 m, not even the minimum p-value of 0.05 is reached. Road length and road area show a considerably lower correlation with the PNC and are therefore excluded from further analysis.
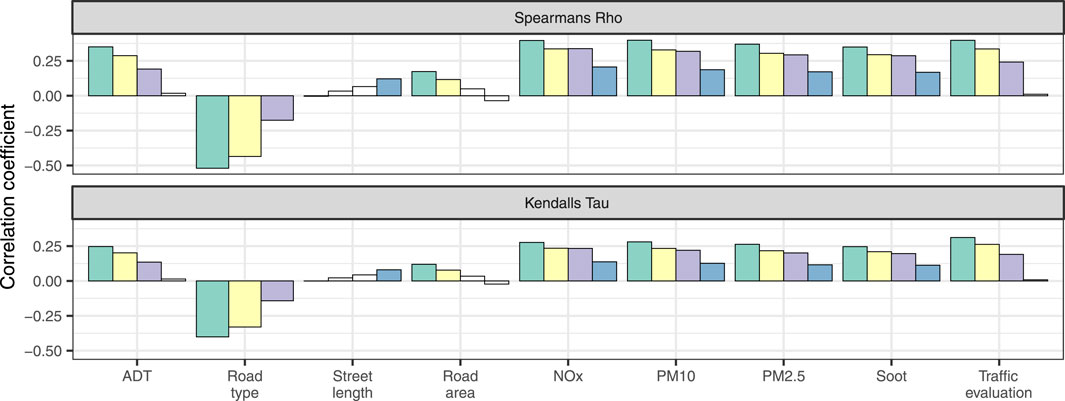
FIGURE 4. Rank correlations of PNCtotal/
Road traffic emissions show a moderate positive correlation with the PNC, which decreases with increasing area coverage. The correlation coefficients of the rank correlation according to Kendall are somewhat lower values than those according to Spearman. However, the main results do not differ. The largest calculated radius of 500 m shows a considerably smaller relationship than the smaller zones. The differences between the 100 and 250 m buffers are small. All pollutants show the same correlation pattern as they are based on the same ADT.
Both road type and traffic evaluation are the best measures to represent road traffic. Since the traffic evaluation combines information on vehicle fleet, speed limit, tendency for congestion and ADT, it is used as the defining parameter in the following. Hence, we classify 2,123 track points as exposed to heavy traffic and 8,807 as affected by light traffic.
There is a highly significant correlation between road traffic and PNC (Table 3). Areas with high traffic emissions and an average PNC of 28,300 cm−3 are characterized by both higher overall concentration and a greater spread of values than those with average and low traffic emissions (mean PNC: 22,500 cm−3). Areas with above-average traffic emissions are associated with above-average PNC in 93% of the runs. Concentrations are about 20% higher near busy roads than the average along the measuring routes.
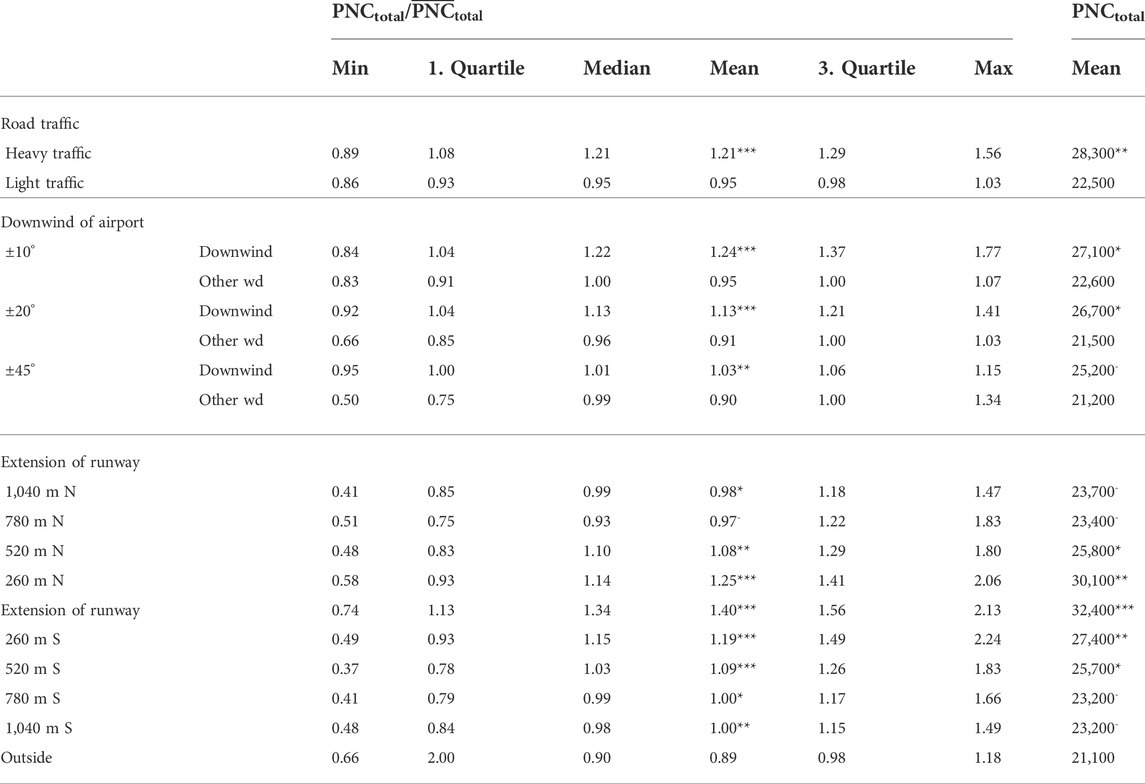
TABLE 3. Comparison of the impact of road traffic and airport variables on PNCtotal/
3.3 Impact of the airport
To determine the impact of the airport on the PNC, the concentrations are compared according to 1) their distance from the airport, 2) whether the point is located downwind of the airport according to the prevailing wind direction during the measurement run, and 3) with regard to the location of the track points in relation to the approach corridor in the east of the airport.
All track points are located at a distance of 1,870–7,500 m from the airport. The distance from the airport 1) is inversely correlated with both the normalized and the absolute PNC (Table 4). With an R2 of 0.02***, the correlation only marginally explains the spatial variability of the PNC. Categorizing the distance to the airport per measurement transect perpendicular to the extension of the runways (purple zone in Figure 1), resulting in an R2 of 0.07*** for the correlation with the normalized and 0.04** for the absolute PNC. Categorized instead of uncategorized distance to the airport only slightly improves the explanatory power of the parameter. The correlation becomes insignificant when only the intersecting areas of the purple and gray zones are included in the analysis. The correlation of PNC with the distance to the airport thus depends strongly on the overall size of the study area and is also spatially anisotropic.
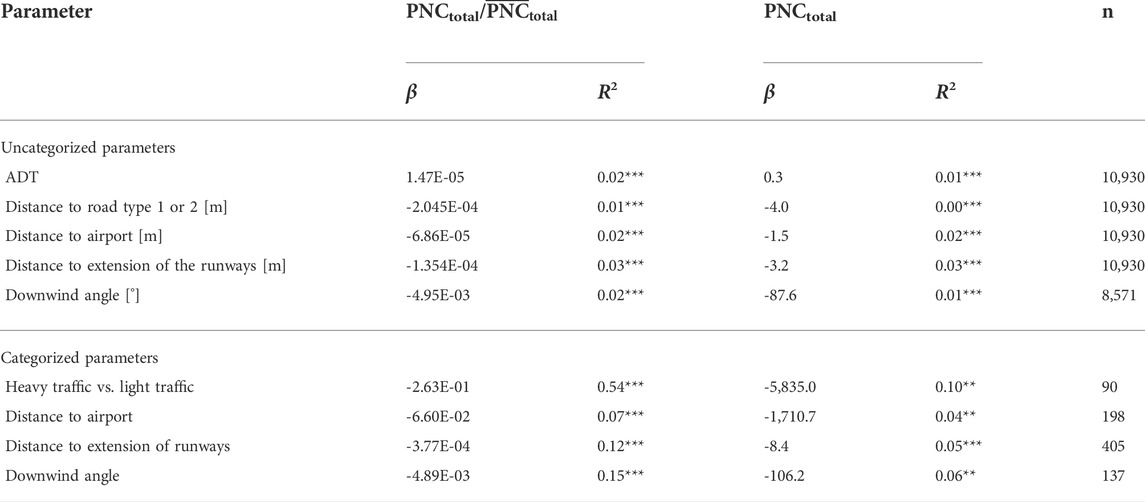
TABLE 4. Correlations for PNCtotal/
Track points in the lee of the airport (2) have a higher PNC than those outside this area (Table 3). This is the case for all three defined zones, with an average PNCtotal of 27,100 cm−3 at ±10°, 26,700 cm−3 at ±20°, and 25,200 cm−3 at ±45° downwind of the prevailing wind direction compared to the mean PNCtotal of 21,200–22 ,600 cm−3 outside the downwind sector. The difference between the concentrations downwind and beyond decreases in a wider range. In the zone of ±10° downwind there is a large variability of the PNC. This is contrary for the largest defined leeward range. The observed concentrations in the lee of the airport are above the mean of the whole route for all three opening angles, while the concentrations outside are below.
Higher PNC and a larger interquartile range (IQR) occur in the direct extension of the flight path (gray area in Figure 1) and in the area up to 520 m north and south of it (3) than at a greater distance from the central line of the flight path (Table 3). Points outside the defined area of the approach corridor have lower concentrations and less variation. The mean PNC is up to more than 10,000 cm−3 higher in the area of the flight path with 32,400 cm−3 in the extension of the runways than in the area outside (mean PNC: 21,100 cm−3). The variation inside and outside the flight path is comparable.
We then combine the two analyses on the relationship between air pollution and wind direction and the effect of proximity to the flight path. Wind directions are divided into downwind, non-downwind, and upwind conditions.
In downwind conditions (Figure 5), the PNC within the whole flight path is significantly higher than outside only for the area of ±45°. Omitting the northernmost and southernmost areas of the approach corridor (780 m N, 780 m S and 1,040 m N, 1,040 m S), correlations show higher pollution inside the flight path than outside for the more limited areas of ±10° or ±20° downwind. The mean PNC in the area up to 520 m north and south of the extension of the runways is higher than average for all three zones.
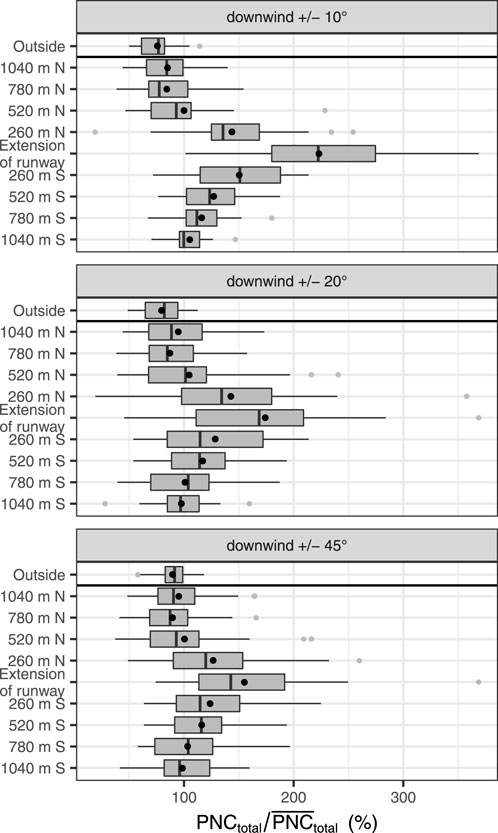
FIGURE 5. Comparison of PNCtotal/
Even for conditions where the track points are not downwind of the airport (outside the green zone in Figure 1), higher than average PNC occur near the extension of the runway (Supplementary Figure S1). For all zones (gray rectangles), PNC along the flight path are higher than outside.
For upwind conditions (Supplementary Figure S1), slightly above-average PNC still occur near the flight path. However, the results for upwind situations in this study are of limited value, as only two runs were made in weather conditions with wind directions 70° to 90° (α ± 10°), three of the 45 runs can be included in the analysis for the wider range of wind directions 60°–100° (α ±20°), and six runs for wind directions 35°–125° (α ±45°).
Combining the location of the measuring points within the flight path (from north to south) and the distance to the airport (from east to west) results in no clear decline of the PNC with growing distance from the airport (Figure 6). The observed PNC along the first transect closest to the airport is lower than the slightly more distant concentrations along the second transect. From there on, there is a slight trend of a decreasing PNC with growing distance. Also, at the fourth transect at about 6 km from the airfield, the PNC is often higher than that of the previous transect.
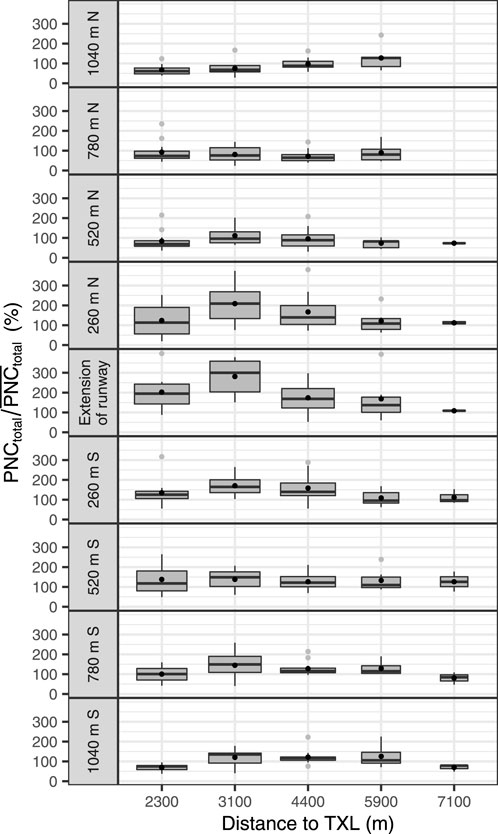
FIGURE 6. Comparison of PNCtotal/
3.4 Relative impact of road traffic and airport operation
Within the defined flight path, the PNC is higher than the mean of the corresponding run in 78% of the runs regardless of wind direction. In comparison, the PNC is above-average in areas beyond the flight path in only 39% of the runs (Figure 7). Comparable results are recorded for road traffic: In 76% of the runs, PNC is above-average near a busy road. In areas with light-traffic roads this is the case only in 40% of the runs. When both factors are combined, the differences become even more pronounced. An above-average PNC occurs inside the flight path near busy roads in 89% of the runs. Higher than average pollutant values are also found equally often both in the flight path with light traffic (67%) and outside the flight path close to heavy traffic (64%). In contrast, in only 13% of the runs, PNC is higher than average for the combination of areas outside the flight path and light road traffic.
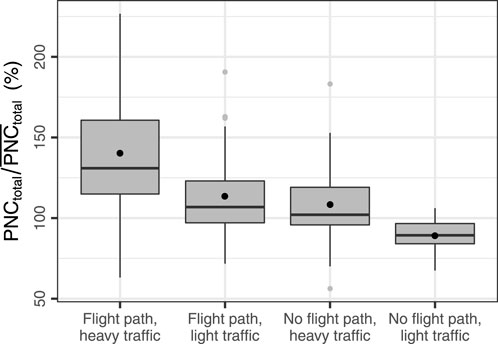
FIGURE 7. PNCtotal/
To differentiate between the effects of road and air traffic, we also investigated the differences between downwind and non-downwind situations (Figure 8). The most heavily polluted areas are in the flight path along highly frequented roads, especially with track points located downwind of the airport. Predictably, the least polluted areas with the most homogeneous value ranges are located outside the flight path in areas with little road traffic and wind coming from directions other than the airport. More than 90% of the PNC values are higher than average in downwind areas, with track points in the flight corridor near heavy road traffic (±10°: 94%, ±20°: 96%, and ±45°: 90%). In comparison, the percentage of areas downwind of the airport with above-average pollution outside the flight path close to busy roads is slightly lower (±10°: 83%, ±20°: 73%, and ±45°: 63%).
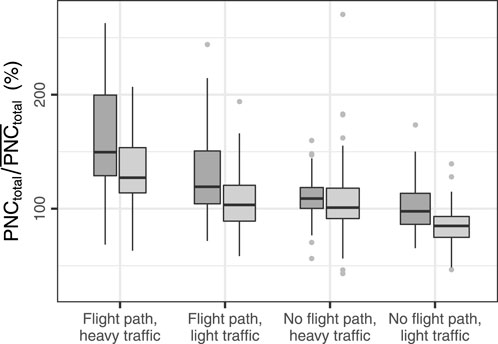
FIGURE 8. Comparison of track points located downwind (dark gray boxes) and those not downwind (light gray boxes) of the runway. PNCtotal/
Under downwind conditions, the variability within the data is generally greater inside the flight path than outside. Measurements outside the leeward areas are not only more homogeneous but also show similar ranges of IQR. In the lee of the airport, even with light-traffic roads in the flight path, both the mean values are higher and the IQR is larger than outside the flight path with heavy-traffic roads nearby. These differences are not evident with wind from directions other than the airport. When the airport is not upwind of the measurements, both the mean PNC as well as the IQR of these two combinations are at a similar level. Outside the flight path, the differences between downwind and non-downwind areas are negligible, both in terms of arithmetic mean and IQR. In all three situations where the airport is not upwind of the measurements, concentrations are higher in the approach corridor than outside. These increases are of approximately the same magnitude regardless of whether there is heavy or light traffic.
Table 4 shows the result of a linear regression of the road traffic and airport operation parameters. All correlations have a high significance level, most with p-values of
Using the normalized instead of absolute PNC as a response variable leads to a higher explained variance by the predictors and to lower p-values, since temporal variability is already reduced. Averaging the PNC by parameter classes results in a smaller sample size and lower within-sample variance. This has to be taken into account when comparing R-squares between uncategorized and categorized parameters.
4 Discussion
This study shows a clear but spatially limited impact of TXL on residential areas east of the airport. Significantly above-average PNC is associated with the prevailing wind directions west and southwest. The observed higher PNC in the area downwind of the airport is in line with expectations. However, the extent of increased air pollution in our study is considerably lower than that in other studies. While we find concentrations increased by a factor of about 1.2–2 in the lee of the runway, Hudda et al. (2014) show higher concentration differences of the order of four times or more at greater distances downwind of Los Angeles International Airport (LAX) compared to the surrounding area. The magnitude of the difference is most likely due to the four times higher aircraft movements per year at LAX compared to TXL. Keuken et al. (2015) found a three-fold increased PNC as far away as 7 km downwind of Schiphol Airport. Schiphol Airport carries about three times as many passengers as TXL. Therefore, a greater impact can be expected there. In addition, at a location like LAX with an ocean upwind of the airport, generally lower background concentration can be expected than at our suburban location in Berlin. The additional pollution from the airport is therefore likely to be more pronounced in the case of LAX.
We find a highly significant correlation between traffic and PNC. Places with higher traffic emissions also display increased levels of PNC. Unlike with Hudda et al. (2014) or Shirmohammadi et al. (2017), road traffic shows a significant impact on PNC in the vicinity of busy roads. Like Hsu et al. (2012), we find lower PNC with increasing distance to road types that are associated with a lot of traffic. However, the uncategorized road traffic parameters explain only very little spatial variability of PNC.
While Hsu et al. (2012) can estimate the contribution of take-off and landing activities near a mid-sized airport in the United States, this is not possible for TXL airport due to the high and continuous flight volume. Like Hudda et al. (2014), we find an inverse relationship between PNC and distance to the airport. Whether this correlation can be observed depends on the size of the area included in the analysis. The impact of the airport can be seen up to 520 m north and south of the area, representing the extension of the runways. This area is much smaller than the range of several kilometers recorded in the studies by Hudda et al. (2014) in Los Angeles or Hudda et al. (2018) in the greater Boston metropolitan area. In the case of Berlin-Tegel, road traffic in the vicinity of the airport leads to considerable PNC variations, which supersedes the impact of the airport on the PNC. The limited explained variability regarding the distance from the airport on PNC could therefore be due to differences in the traffic volume on the roads along the measurement route. The impact of road traffic is also evident in areas where the effect of airport emissions is discernible. We find that in the area of 520 m north and south of the runway extension, the airport contributes about as much to PNC as busy roads. This is consistent with the results of Tremper et al. (2022), who found a similarly high PNC near Gatwick Airport as in close proximity to heavily trafficked roads. The large impact of road traffic on PNC found in our study may also be due in part to a larger proportion of diesel vehicles in the fleet compared to study areas in the United States such as those of Hudda et al. (2014) or Shirmohammadi et al. (2017).
In accordance with previous studies, concentrations are particularly high with winds from the direction of the airport compared to situations with other wind directions (Keuken et al., 2015; Hudda et al., 2018). Emissions from road vehicles on the airfield, taxiing aircraft, and aircraft taking off and landing are then carried toward the study site. According to Lorentz et al. (2019) and Makridis and Lazaridis (2019), ground-based operations contribute considerably to sub-micron particle emissions. The smaller the opening angle and the corresponding area downwind of the airport are specified, the more pronounced the effect is. But an above-average PNC is also found in our study for all other wind directions, presumably because aircraft still take off and land in the direction of the runways. However, significantly lower pollutant levels are observed under such conditions. For the ±10° zone downwind, the mean PNC is about 1.5 times higher than for other wind directions. Again, our study shows a lower impact of an area being downwind in comparison to other studies. Hudda et al. (2018) calculate 1.6 to 3 times higher median concentrations for downwind conditions compared to all other wind directions. Since their study was situated in the vicinity of General Edward Lawrence Logan International Airport close to Boston in the United States, higher values can be expected due to twice the number of flights.
Under upwind conditions, a similar PNC and variability of PNC occur for those areas within the flight path near roads with a low traffic volume and those outside the flight path close to busy roads. This indicates that emissions of low altitude air traffic mix downward over the flight path near the airport and contribute a similar amount of PNC as high traffic areas. We assume that differences in pollutant concentrations between downwind and non-downwind situations are mainly due to ground-level emissions at the airport caused by aircraft movement on the tarmac, take-offs and landings, and road traffic on the airfield.
Using the ratio of PNCtotal to
By using the traffic evaluation as the main parameter for road traffic, we use a variable that categorized road traffic as higher or lower regardless of specific vehicle numbers or times of the day. We suppose that generally busier roads also have a higher traffic volume during rush hour and less busy roads generally carry less traffic regardless of the time of day or the day of the week. For an analysis that focuses on spatial and not temporal variability, the choice of this variable has been confirmed by the results, where the correlation of the normalized PNC with ADT or the distance to the closest type 1 or 2 road shows an R2 of 0.02 or 0.01 in comparison to an R2 of 0.54, when using only the two categories heavy vs. light traffic. The use of readily available data, even on the basis of an older database, thus nevertheless indicates spatial differences very well. The evaluation of the emission quantities data set provided by the Senate of Berlin is also based on a broader data basis, which includes not only the traffic volume but also the composition of the vehicle fleet, vehicle speed, the tendency for congestion for the road segments, and vehicle fleet specific emissions.
Due to the use of mobile measurements, we can draw conclusions on spatial differences at the study site. Since we only collected data between 8:00 and 18:00 and mainly with southwesterly and westerly wind direction, we have a robust data set with 45 measurement rounds. Therefore, no conclusions can be drawn from this study about air quality under other meteorological conditions. We chose these limitations to obtain the largest possible data set for a time of day when residents near the airport may be exposed to PNC during outdoor activities. A further study with stationary measurements upwind and downwind of the airfield and in the immediate vicinity of the airfield could cover differences in diurnal variation, track individual aircraft movements, and cover a wider range of meteorological conditions. However, such stationary measurements do not account for spatial differences in the PNC away from the few measurement locations. Moreover, a large number of traffic conditions cannot be covered with only a few stations. Instead, mobile measurements have proven to be the most useful for explaining spatial differences and in covering areas affected differently by both road traffic and airport operations.
We limit the study to the analysis of the two emitters, road traffic and airport operations. While studies like Sun et al. (2020) include a variety of predictors to analyze their contribution to air pollution, our approach shows that by focusing on these two PNC sources alone, both the contribution of each source and their combined impact can be well attributed. Ungeheuer et al. (2021) include a chemical analysis of collected particles for jet oil additives to prove the origin of particles from aircraft engines, which is an alternative way to specifically identify aircraft emissions. Austin et al. (2021) include the particle size as an additional observation to determine airport-derived particles, as aircraft emissions have been found to emit smaller particles with a peak PNC at ≤ 25 nm (Zhu et al., 2011; Keuken et al., 2012) in comparison to road traffic emissions that are mostly in the size range of 25–100 nm (Keuken et al., 2012). Both Sun et al. (2020) and Keuken et al. (2012) include black carbon (BC) in their analysis of the contribution of different traffic parameters. While these approaches include more explanatory factors (Austin et al., 2021) or more comprehensive methods (Hsu et al., 2012), the advantage of our study is the limitation to the two sources road traffic and airport operations. For both, a wide range of possible contributory variables is included in the study. We have shown significant correlations between PNC and uncategorized and categorized parameters. The averaged normalized PNC per category explains both the spatial differences and the distinction of areas likely to be either impacted by airport operations or not most effectively. The differences can thus be attributed to road traffic, airport operations, or a combination of both.
5 Conclusion
This study shows a clear but spatially limited impact of Berlin-Tegel Airport on residential areas east of the airport. Significantly above-average PNC downwind of the airport are associated with the prevailing wind directions west and southwest. This indicates a main particle contribution from ground-based activities on the airfield. However, road traffic also leads to a considerably elevated PNC. When comparing these two sources, the combination of both, that is, high traffic volume and approach corridor downwind of the airport, leads to the highest observed PNC, as expected. The lowest concentrations occur in areas with low traffic volume outside the airport’s approach corridor. What is particularly prominent in our study, however, is that increased traffic volume outside the airport impact area is comparable to the airport’s effect in the area of the approach corridor, both in the mean of the concentrations and in the variability of PNC. The operation of the airport thus leads to an increase in the PNC, which is roughly comparable to the impact of busy roads in the neighborhood. Clearly, the closure of TXL at the end of 2020 will have considerably improved air quality in the urban residential areas in the immediate vicinity of the airport.
Data availability statement
The raw data supporting the conclusion of this article will be made available by the authors, without undue reservation.
Author contributions
SF developed the conception, design and methodology of the study, performed the statistical analysis, and wrote the first draft of the manuscript. FG and RS carried out the measurements and performed the quality control of the acquired data. CS provided resources, supervised the study, helped with the conception of the study, and acquired funding. All authors contributed to manuscript revision, read, and approved the submitted version.
Funding
This study was supported by the German Federal Ministry of Education and Research (BMBF) under grant FKZ 01LP1912B (Urban Climate under Change, Phase II, Module 3DO + M). The article processing charge was funded by the Deutsche Forschungsgemeinschaft (DFG, German Research Foundation) — 491192747 and the Open Access Publication Fund of Humboldt-Universität zu Berlin.
Acknowledgments
The authors acknowledge the Environmental Atlas Berlin for the provision of the spatial data on urban structure, land use, and traffic volumes used in this publication. We would also like to thank the German Weather Service (DWD) for providing meteorological data. Statistical analysis was conducted using R, version 3.6.1 (R CORE TEAM, 2018) and the R package system tidyverse (WICKHAM, 2017) including dplyr 0.8.3 and ggplot2 3.2.1 unless otherwise indicated. The package circular 0.4–93 was used for wind direction averages. Wind roses and pollutant roses were extracted using openair 2.6–6 (Carslaw and Ropkins, 2012). Geoinformation data were processed with ArcMap version 10.5.
Conflict of interest
The authors declare that the research was conducted in the absence of any commercial or financial relationships that could be construed as a potential conflict of interest.
Publisher’s note
All claims expressed in this article are solely those of the authors and do not necessarily represent those of their affiliated organizations, or those of the publisher, the editors, and the reviewers. Any product that may be evaluated in this article, or claim that may be made by its manufacturer, is not guaranteed or endorsed by the publisher.
Supplementary material
The Supplementary Material for this article can be found online at: https://www.frontiersin.org/articles/10.3389/fenvs.2022.887493/full#supplementary-material
References
Agostinelli, C., and Lund, U. (2017). R package ’circular’: Circular Statistics. Available at: https://r-forge.r-project.org/projects/circular/.
Austin, E., Xiang, J., Gould, T. R., Shirai, J. H., Yun, S., Yost, M. G., et al. (2021). Distinct ultrafine particle profiles associated with aircraft and roadway traffic. Environ. Sci. Technol. 55, 2847–2858. doi:10.1021/acs.est.0c05933
Bendtsen, K. M., Bengtsen, E., Saber, A. T., and Vogel, U. (2021). A review of health effects associated with exposure to jet engine emissions in and around airports. Environ. Health 20, 10. doi:10.1186/s12940-020-00690-y
Bonn, B., von Schneidemesser, E., Andrich, D., Quedenau, J., Gerwig, H., Lüdecke, A., et al. (2016). Baerlin2014 – The influence of land surface types on and the horizontal heterogeneity of air pollutant levels in berlin. Atmos. Chem. Phys. 16, 7785–7811. doi:10.5194/acp-16-7785-2016
Carslaw, D. C., and Ropkins, K. (2012). Openair — an R package for air quality data analysis. Environ. Model. Softw. 27-28, 52–61. doi:10.1016/j.envsoft.2011.09.008
Correia, A. W., Peters, J. L., Levy, J. I., Melly, S., and Dominici, F. (2013). Residential exposure to aircraft noise and hospital admissions for cardiovascular diseases: Multi-airport retrospective study. BMJ Clin. Res. ed.) 347, f5561. doi:10.1136/bmj.f5561
[Dataset] DWD Climate Data Center (2021). Historical hourly station observations of wind speed and wind direction for Germany: Station 00430. Berlin-Tegel (Offenbach, Germany: DWD Climate Data Center (CDC)).
Flughafen Berlin Brandenburg GmbH (2020). Annual report 2019 (Berlin: Flughafen Berlin Brandenburg GmbH).
GRIMM Aerosol Technik GmbH (2013). Edm 465 UFPC: Ultra fine particle counter (Ainring, Germany: GRIMM Aerosol Technik GmbH & Co. KG).
Hankey, S., and Marshall, J. D. (2015). On-bicycle exposure to particulate air pollution: Particle number, black carbon, PM 2.5 , and particle size. Atmos. Environ. 122, 65–73. doi:10.1016/j.atmosenv.2015.09.025
Hansell, A. L., Blangiardo, M., Fortunato, L., Floud, S., de Hoogh, K., Fecht, D., et al. (2013). Aircraft noise and cardiovascular disease near heathrow airport in london: Small area study. BMJ Clin. Res. ed.) 347, f5432. doi:10.1136/bmj.f5432
He, R.-W., Gerlofs-Nijland, M. E., Boere, J., Fokkens, P., Leseman, D., Janssen, N. A. H., et al. (2020). Comparative toxicity of ultrafine particles around a major airport in human bronchial epithelial (calu-3) cell model at the air-liquid interface. Toxicol. Vitro 68, 104950. doi:10.1016/j.tiv.2020.104950
HEI Review Panel on Ultrafine Particles (2013). Understanding the health effects of ambient ultrafine particles (Boston, MA: Health Effects Institute).
Hsu, H.-H., Adamkiewicz, G., Andres Houseman, E., Vallarino, J., Melly, S. J., Wayson, R. L., et al. (2012). The relationship between aviation activities and ultrafine particulate matter concentrations near a mid-sized airport. Atmos. Environ. 50, 328–337. doi:10.1016/j.atmosenv.2011.12.002
Hudda, N., Gould, T., Hartin, K., Larson, T. V., and Fruin, S. A. (2014). Emissions from an international airport increase particle number concentrations 4-fold at 10 km downwind. Environ. Sci. Technol. 48, 6628–6635. doi:10.1021/es5001566
Hudda, N., Simon, M. C., Zamore, W., and Durant, J. L. (2018). Aviation-related impacts on ultrafine particle number concentrations outside and inside residences near an airport. Environ. Sci. Technol. 52, 1765–1772. doi:10.1021/acs.est.7b05593
Keuken, M. P., Henzing, J. S., Zandveld, P., van den Elshout, S., and Karl, M. (2012). Dispersion of particle numbers and elemental carbon from road traffic, a harbour and an airstrip in The Netherlands. Atmos. Environ. 54, 320–327. doi:10.1016/j.atmosenv.2012.01.012
Keuken, M. P., Moerman, M., Zandveld, P., Henzing, J. S., and Hoek, G. (2015). Total and size-resolved particle number and black carbon concentrations in urban areas near Schiphol airport (The Netherlands). Atmos. Environ. 104, 132–142. doi:10.1016/j.atmosenv.2015.01.015
Kukkonen, J., Karl, M., Keuken, M. P., van der Denier Gon, H. A. C., Denby, B. R., Singh, V., et al. (2016). Modelling the dispersion of particle numbers in five European cities. Geosci. Model Dev. 9, 451–478. doi:10.5194/gmd-9-451-2016
Kumar, P., Morawska, L., Birmili, W., Paasonen, P., Hu, M., Kulmala, M., et al. (2014). Ultrafine particles in cities. Environ. Int. 66, 1–10. doi:10.1016/j.envint.2014.01.013
Lammers, A., Janssen, N. A. H., Boere, A. J. F., Berger, M., Longo, C., Vijverberg, S. J. H., et al. (2020). Effects of short-term exposures to ultrafine particles near an airport in healthy subjects. Environ. Int. 141, 105779. doi:10.1016/j.envint.2020.105779
Lenschow, P., Abraham, H.-J., Kutzner, K., Lutz, M., Preuß, J.-D., and Reichenbächer, W. (2001). Some ideas about the sources of pm10. Atmos. Environ. 35, 23–33. doi:10.1016/S1352-2310(01)00122-4
Lorentz, H., Schmidt, W., Hellebrandt, P., Ketzel, M., Jakobs, H., and Janicke, U. (2019). Einfluss eines Großflughafens auf zeitliche und räumliche Verteilungen der Außenluftkonzentrationen von Ultrafeinstaub < 100 nm, um die potentielle Belastung in der Nähe zu beschreiben - unter Einbeziehung weiterer Luftschadstoffe (Ruß, Stickoxide und Feinstaub (PM2,5 und PM10)), 14/2021.Umweltbundesamt, Texte.
Makridis, M., and Lazaridis, M. (2019). Dispersion modeling of gaseous and particulate matter emissions from aircraft activity at Chania Airport, Greece. Air Qual. Atmos. Health 12, 933–943. doi:10.1007/s11869-019-00710-y
Pope, C. A., and Dockery, D. W. (2006). Health effects of fine particulate air pollution: Lines that connect. J. Air & Waste Manag. Assoc. 6, 709–742. doi:10.1080/10473289.2006.10464485
Rahman, M. M., Mazaheri, M., Clifford, S., and Morawska, L. (2017). Estimate of main local sources to ambient ultrafine particle number concentrations in an urban area. Atmos. Res. 194, 178–189. doi:10.1016/j.atmosres.2017.04.036
[Dataset] SenStadtUm (2017). Berlin environmental Atlas, 07.01 traffic volumes (Berlin: Senate Department for Urban Development and the Environment).
[Dataset] SenStadtWohn (2015). Berlin environmental Atlas (Berlin: Senate Department for Urban Development and the Environment).
[Dataset] SenStadtWohn (2017). Berlin environmental Atlas, 03.11.1 traffic-related emissions. Edition 2017 (Berlin: Senate Department for Urban Development and the Environment).
[Dataset] SenUVK (2017). Berlin environmental Atlas (Berlin: Senate Department for Urban Development and the Environment).
Shirmohammadi, F., Sowlat, M. H., Hasheminassab, S., Saffari, A., Ban-Weiss, G., and Sioutas, C. (2017). Emission rates of particle number, mass and black carbon by the Los Angeles International Airport (LAX) and its impact on air quality in Los Angeles. Atmos. Environ. 151, 82–93. doi:10.1016/j.atmosenv.2016.12.005
Stafoggia, M., Cattani, G., Forastiere, F., Di Menno Bucchianico, A., Gaeta, A., and Ancona, C. (2016). Particle number concentrations near the Rome-Ciampino city airport. Atmos. Environ. 147, 264–273. doi:10.1016/j.atmosenv.2016.09.062
Sun, H., Hu, L., Geng, Y., and Yang, G. (2020). Uncovering impact factors of carbon emissions from transportation sector: Evidence from China’s yangtze river delta area. Mitig. Adapt. Strateg. Glob. Chang. 25, 1423–1437. doi:10.1007/s11027-020-09934-1
Tremper, A. H., Jephcote, C., Gulliver, J., Hibbs, L., Green, D. C., Font, A., et al. (2022). Sources of particle number concentration and noise near London gatwick airport. Environ. Int. 161, 107092. doi:10.1016/j.envint.2022.107092
TSI Incorporated (2012). Hand-held condensation particle counter model 3007 (Minnesota, USA: TSI Incorporated).
Ungeheuer, F., van Pinxteren, D., and Vogel, A. L. (2021). Identification and source attribution of organic compounds in ultrafine particles near frankfurt international airport. Atmos. Chem. Phys. 21, 3763–3775. doi:10.5194/acp-21-3763-2021
van Poppel, M., Peters, J., and Bleux, N. (2013). Methodology for setup and data processing of mobile air quality measurements to assess the spatial variability of concentrations in urban environments. Environ. Pollut. 183, 224–233. doi:10.1016/j.envpol.2013.02.020
Westerdahl, D., Fruin, S., Sax, T., Fine, P. M., and Sioutas, C. (2005). Mobile platform measurements of ultrafine particles and associated pollutant concentrations on freeways and residential streets in Los Angeles. Atmos. Environ. 39, 3597–3610. doi:10.1016/j.atmosenv.2005.02.034
WHO (2013). Review of evidence on health aspects of air pollution - REVIHAAP Project: Technical Report (Copenhagen, Denmark: World Health Organization, Regional Office for Europe).
WHO (2019). Noncommunicable diseases and air pollution: WHO European high-level conference on noncommunicable diseases (Copenhagen, Denmark: World Health Organization, Regional Office for Europe).
Keywords: UFP measurement, particle number concentration (PNC), impact of aircraft, impact of traffic, spatial variability analysis, mobile measurement, air quality, ultrafine particles
Citation: Fritz S, Grusdat F, Sharkey R and Schneider C (2022) Impact of airport operations and road traffic on the particle number concentration in the vicinity of a suburban airport. Front. Environ. Sci. 10:887493. doi: 10.3389/fenvs.2022.887493
Received: 01 March 2022; Accepted: 15 August 2022;
Published: 03 October 2022.
Edited by:
Joginder Singh, Lovely Professional University, IndiaCopyright © 2022 Fritz, Grusdat , Sharkey and Schneider . This is an open-access article distributed under the terms of the Creative Commons Attribution License (CC BY). The use, distribution or reproduction in other forums is permitted, provided the original author(s) and the copyright owner(s) are credited and that the original publication in this journal is cited, in accordance with accepted academic practice. No use, distribution or reproduction is permitted which does not comply with these terms.
*Correspondence: Sabine Fritz, c2FiaW5lLmZyaXR6QGdlby5odS1iZXJsaW4uZGU=