Abstract
Construction with freeboard—vertical height of a structure above the minimum required—is commonly accepted as a sound investment for flood hazard mitigation. However, determining the optimal height of freeboard poses a major decision problem. This research introduces a life-cycle benefit-cost analysis (LCBCA) approach for optimizing freeboard height for a new, single-family residence, while incorporating uncertainty, and, in the case of insured homes, considering the costs from losses, insurance, and freeboard (if any) to the homeowner and National Flood Insurance Program (NFIP) separately. Using a hypothetical, case study home in Metairie, Louisiana and U.S. Army Corps of Engineers design depth-damage functions for generic inland flooding, results show that adding 2 ft of freeboard at the time of construction might be considered the optimal option given that it yields the highest net benefit, but the highest net benefit-cost ratio occurs for the 1 ft freeboard. Even if flood loss reduction is not considered when adding freeboard, the savings in annual insurance premiums alone are sufficient to recover the construction costs paid by the homeowner if at least one foot of freeboard is included at construction. Collectively, these results based on conservative assumptions suggest that at the time of construction, even a small amount of freeboard provides a huge savings for the homeowner and (especially) for the financially-strapped National Flood Insurance Program. For community planners, the results suggest that wise planning with reasonable expectations on the front end makes for a more sustainable community.
1 Introduction
Although adding freeboard—vertical height of a structure above the minimum required—as a flood mitigation measure represents a sound investment (Multihazard Mitigation Council, 2017), determining the optimal height of freeboard poses a significant decision problem (Zarekarizi et al., 2020). Whereas recent work (Paleo-Torres et al., 2021) developed probabilistic cost and benefit analysis to enhance vulnerability functions that quantify the impact of mitigation measures for coastal residential buildings, the lack of robust benefit-cost analysis (BCA) that quantifies costs and benefits of freeboard at the micro-(i.e., individual building) scale discourages investment in flood mitigation (de Ruig et al., 2019), including the freeboard decision. Moreover, as flooding is a low-probability but high-impact event, it is prudent to evaluate flood loss, with and without retrofit actions, across a long time frame, such as over the building’s useful lifespan (Dong and Frangopol, 2017; Taghi Nezhad Bilandi, 2018). Thus, the development of a comprehensive methodology that determines the optimal freeboard height at the micro-scale level through a life-cycle BCA (LCBCA; i.e., across the entire useful lifespan of the building) is valuable in flood risk assessment, by quantifying the cost effectiveness of mitigation measures (De Risi et al., 2018).
LCBCA (e.g., Kappos & Dimitrakopoulos, 2008; Orooji et al., 2022) involves weighing the total expected benefits against the total expected costs over the home’s useful life. It builds on a well-established principles of economic analysis to evaluate the life-cycle efficiency between mitigation scenarios. For example, Santos and Ferreira (2013) and Satvati et al. (2021) used LCBCA to enhance decision-making regarding pavement solutions and granular aggregate materials on highways, respectively.
Although LCBCA has been conducted in numerous studies, only a few focus on its use for establishing the economically optimal elevation for single-family residences. Xian et al. (2017) calculated economically optimal elevation levels through LCBCA by substituting the expected annual loss (EAL) with risk-based annual insurance premium based on the National Flood Insurance Program (NFIP) manual, even while integrating climate change effects. The analysis of Xian et al. (2017) was helpful, but their estimation of optimal home elevation was based only on freeboard cost and savings on NFIP flood premiums, without also considering EAL.
More recently, Zarekarizi et al. (2020) analyzed the home elevation decision by identifying important sources of uncertainties and characterizing trade-offs between decision objectives such as minimizing the total costs and maximizing the benefit-cost ratio (BCR). Zarekarizi et al. (2020) provided a substantial step forward but the approach considers only flood reduction in its decision criteria, ignoring the premium savings. The inclusion of flood premium reduction as a function of elevation increase allows for a more effective evaluation of freeboard benefits (FEMA, 2008).
Another research gap in the use of LCBCA for optimizing freeboard height for a new, single-family residence is the disaggregation of costs between the affected parties. The freeboard cost and flood premiums are considered owner costs, but the expected average annual loss (AAL) should be assessed by allocating appropriate portions to the owner and the NFIP (Rahim et al., 2021), as insured homeowners are liable only for the deductible and losses exceeding the coverage amount and NFIP covers the outstanding costs less the deductible. Disaggregation of the costs is important not only for identifying expenses to the affected parties but also to ensure more accuracy for the decision-making process (Sayers, 2013). Thus, although these studies provide useful analyses, further improvement is needed.
This paper presents a methodology for determining the economically optimal elevation of single-family residences using stochastic LCBCA based on the net benefit (NB) and net benefit-cost ratio (NBCR), by freeboard scenario. NBs are the differences in costs between “with” and “without elevation increase” scenarios. The “cost” consists of the sum of the expected AALs, annual insurance premiums, and (in the “with” scenario) freeboard costs, discounted to the present value (DPV) and accumulated over the home’s 30-years mortgage period. The economically optimal elevation as a mitigation measure is defined here as the elevation that maximizes the accumulated life-cycle NB. In the “with” scenario above, the NBs are divided by the freeboard cost, either as an “upfront” cost at the time of construction or amortized into an assumed 30-years mortgage, to compute the NBCRs. NB and NBCR are disaggregated as owner benefit and NFIP benefit.
To calculate AAL, a Gumbel extreme value distribution (e.g., Waylen and Woo 1982; Nadarajah and Kotz 2004) is fit to the flood hazard data, in combination with Monte Carlo simulation (MCS) for incorporating randomness associated with flood annual occurrence, at the individual building level. The Gumbel distribution is widely accepted for such analyses (Kumar and Bhardwaj, 2015; Singh et al., 2018; Malakar, 2020; Patel, 2020). As severe flood events are not limited to the 100-years or 500-years floods, this probabilistic model extends the available data to a longer time-range of interest. MCS has been commonly used in flood risk analysis (e.g., Rahman et al., 2002; Qi et al., 2013; Yu et al., 2013; Hennequin et al., 2018). The building-level approach allows a high level of spatial detail and accuracy in flood risk analysis (Bubeck et al., 2011; Lorente, 2019). Estimating life-cycle benefits at the building scale also supports more accurate upscaling to broader spatial levels.
A hypothetical one-story, single-family residence in Metairie, Louisiana, is used to demonstrate the methodology. A sensitivity analysis is conducted over a range of discount rates to assess the impact of the discount rate selected. The aim of this work is to support delivery of actionable recommendations to aid the decision-making process with the goal of enhancing long-term flood resilience.
2 Methodology
Freeboard is evaluated over a 30-years useful life of a mitigation project, as suggested by FEMA (2009) guidance. LCBCA is performed for each 0.5-ft increment above the base flood elevation (BFE), representative of the 100-years flood event elevation—up to four feet, at construction. The analysis covers only direct economic losses (building and its contents), with an assumption that no annual cost is needed to maintain the freeboard.
Life-cycle performance of each freeboard scenario is evaluated in terms of its benefit from flood loss reduction and premium savings as compared to its cost, using LCBCA. The outcome is the NBCR, which is derived from the mitigation scenario’s total NB divided by its total cost. NBCR is a numerical expression of the life-cycle benefit per dollar spent (Daigneault et al., 2016), in contrast to NB, which measures the overall benefit.
If the NB and NBCR exceed zero, the mitigation scenario is considered cost effective. The scenario with the highest NB represents the economically optimal option. NBCR is used as a deciding factor when multiple alternatives have equal NBs. The methodology consists of 1) determining the cost of freeboard construction, 2) calculating NFIP premiums, 3) calculating AAL and allocating to owner or NFIP, and 4) conducting the BCA.
2.1 Expected costs
The financial benefit of adding freeboard is evaluated by considering construction cost, flood insurance premiums, and AAL. Costs are divided into one-time “upfront” cost and recurring costs built into the mortgage, flood premium, and the expected AAL. All recurring costs are estimated on annualized bases. While cost of freeboard construction and flood premiums are considered owner’s costs, the expected AAL is assessed to determine the proportions allocated to the owner and the NFIP.
2.1.1 Cost of freeboard construction
The cost of additional elevation increase is calculated and applied to the LCBCA. FEMA (2008) reports the cost of each freeboard increment as a range of percentage estimates of total construction cost; however, this study conservatively uses the upper limit for each freeboard increment (Table 1). Costs at half-foot increments are determined as the average of the adjacent whole-foot costs.
TABLE 1
| Freeboard (ft) | A-zone | Coastal A-Zone | V-zone |
|---|---|---|---|
| BFE +1 | 2.3 | 3.9 | 1.8 |
| BFE +2 | 4.5 | 4.8 | 3.6 |
| BFE +3 | 6.8 | 6.1 | 5.4 |
| BFE +4 | 9.1 | 8.1 | 7.2 |
Upper limit of mean cost of construction increase (%), by FEMA flood zone and freeboard (FEMA 2008).
Upfront freeboard cost depends only on the building’s construction replacement cost and is expressed as a percentage of the building value (BV; i.e., building’s construction replacement cost). To obtain the upfront construction cost of each freeboard scenario , the percentage of increase in construction cost associated with each freeboard scenario provided in Table 1 is multiplied by the building’s value at BFE , or
To calculate freeboard construction cost as a recurring cost, 30-years fixed-rate mortgage is applied. The standard loan amortization formula is used to calculate the amortized base monthly amount for each freeboard scenario such thatwhere is the interest rate, is the number of payments per year, and, is the loan term in years.
The resulting amortized base monthly amount is added to the monthly loan fees to obtain total monthly loan payment for the freeboard .
The freeboard monthly loan payment is multiplied by the number of payments per year to obtain the annual amount .
2.1.2 NFIP premiums
For homes located in special flood hazard areas (SFHA), insurance purchase is mandatory (Senate, 2011). The higher the elevation compared to BFE, the less likely the home is to flood and the lower the premium. For each flood zone, the BFE is obtained from the Flood Insurance Rate Map (FIRM) and rates are estimated by comparing the building’s elevation to BFE. Premiums are calculated here using Appendix J (Rate Tables) of the NFIP (2021) post-firm construction rates for a single-family residence, for multiple elevations. Basic rates for a building and its contents are applied to every $100 of the basic building and content coverage limits, and separate additional rates for building and contents are used for every $100 of additional coverage. For single-family homes, $60,000 is the basic building coverage and $25,000 is the basic content coverage, with maximum limits of $250,000 for building and $100,000 for content (NFIP 2021). NFIP requires a minimum deductible of $1,250 for both building and contents if the coverage exceeds $100,000 (NFIP, 2021); therefore, $1,250 was chosen as a conservative value.
2.1.3 Average annual loss
This study addresses the randomness of flood occurrence by applying a probabilistic approach. To estimate the expected flood loss, AAL is calculated by integrating the flood loss function (loss-exceedance probability curve) over all probabilities, such thatwhere represents economic loss as a function of flood exceedance probability.
This methodology derives flood depths for multiple return periods using an inverse cumulative distribution function (CDF), which is then transformed to loss as a function of flood depth using a depth-damage function (DDF). Losses associated with each return period expressed as a percentage of the BV are then integrated to estimate total AAL. The two-parameter Gumbel extreme value probability distribution is used to estimate flood occurrence, or
The CDF of the distribution is equal to the exceedance probability, P:
Solving for E yields the Gumbel inverse CDF, where flood elevation E is obtained as a function of flood probability and Gumbel parameters:
In Eqs 6, 7, 8, is the Gumbel PDF, is the CDF, is the inverse CDF, and u and α are the calculated (Mostafiz et al., 2021a) site-specific location parameter and scale parameter, respectively.
The relationship between flood depth and loss is determined using the U.S. Army Corps of Engineers (USACE, 2000) DDFs for a one-story home with no basement. Although the USACE (2000) DDFs begin at ‒2 ft depth to account for structures built below FFE, in this work building losses are calculated beginning at ‒1 ft, to avoid overestimating building losses. However, content losses at negative flood depths (i.e., below the building’s first floor) are considered to have no losses. These functions are termed DDFs here, as the dependent variable is relative loss corresponding to building and contents values, respectively. Although updated USACE (2006) offers more precise DDFs, they require input on flood duration (i.e., short or long) and foundation type (i.e., pier, slab, or mobile home) for both freshwater and saltwater flooding. Likewise, USACE (2015) offers other advantages, but because it was designed for the North Atlantic Coast, its DDFs are developed considering inundation, waves, and erosion mechanisms for different building prototypes. Thus, the more generic DDFs in USACE (2000) for inland flooding are selected here, and sensitivity to the issue of selection of DDF is not included in this analysis, but it could affect the outcome of results substantially (Mostafiz et al., 2021b).
To further represent the stochastic nature of the flood hazard, AAL for each freeboard scenario is estimated using MCS, which integrates the loss function with flood elevations. The MCS process can reproduce characteristics of observed floods (e.g., frequency distributions) with relative accuracy across a broad range of frequencies, while circumventing linearity assumptions (Rahman et al., 2002). The MCS generates scenarios based on the fitted Gumbel inverse CDF for annual occurrences of events having right-skewed return periods, such as floods. For each simulation, an annual probability of exceedance is generated and used as input in the inverse CDF () to calculate the corresponding flood elevation (Eq. 9).
The freeboard scenario is subtracted from the resulting simulated flood elevations to obtain the depths and flood loss for building and contents using the appropriate DDFs, where and is the relative building and content loss, respectively, as a function of flood depth within the building. For each simulation within freeboard scenario , the building loss () and content loss () are determined using the BV
The building and content losses to the homeowner and/or NFIP in a given year is determined. Flood insurance deductibles are represented within total loss, as homeowners are liable for the deductible, specified for building and contents, in the case of a flood regardless of the location or home characteristics, while NFIP covers the outstanding costs. Therefore, total loss for each simulation () is apportioned as either owner loss and/or NFIP loss , depending on whether the policy deductible Wo has been exceeded (Eqs. 12–16). is a function of the building loss, content loss, and depth in the simulation.
In the case of a total loss exceeding the total insurance coverage , the owner is responsible for plus the loss amount exceeding the insurance coverage, such that
and the NFIP loss is the total insurance coverage less the deductible, or
The expected losses of all simulated events with different probabilities for building and contents are averaged to estimate the total , that for the owner , and that for the NFIP , such that
2.2 Benefit-cost analysis
Although the calculated annual costs can be used for benefit comparison, they neglect the life-cycle element of the mitigation scenarios. To determine whether a mitigation scenario actually results in life-cycle economic benefit, all costs are DPV, and BCA is conducted.
BCR and NBCR are used for comparing multiple alternatives, but they fail to provide a sense of economic magnitude since they do not indicate the absolute size of the NB. In contrast, NB yields the overall magnitude of the benefit without conveying the relationship between benefits and costs (Cooper et al., 2016). Thus, combining NB with BCR or NBCR, informs the decision-making process. This is one of the advantages of NBCR since NB is a part of its formula, as opposed to BCR, which neglects NB.
Although BCR and NBCR are used for similar rule of alternatives prioritization, the traditional BCR method is not an ideal, as BCR compares benefits to costs directly, while NBCR evaluates options based on returns on investment. NBCR is used here as an alternative to the traditional BCR since it has the advantage of communicating clear results to homeowners and decision-makers in their language, and BCA is evaluated through consideration of the DPV, NB, and NBCR.
NB is used for mutually exclusive alternative selection, where the decision is independent and expected for only one option. By contrast, NBCR is a metric of alternative prioritization for multiple scenarios competing for limited resources, where funds are allocated based on NBCR rankings to enable several projects to be finished. An elevation increase for a single residence is considered a mutually exclusive project, where only one alternative is considered. Thus, it was decided that for this topic (single-family residence) the scenario with the highest NB represents the economically optimal option.
2.2.1 Discounted present value
Since costs and benefits of a project accrue over time, the BCA is conducted on a DPV basis, which is the discounted value of all expected future costs and benefits. DPV enables the comparison of current mitigation costs with the expected future benefits resulting from avoided losses (Tate et al., 2016). It transforms benefits and costs occurring in different times to present-value terms (Frank, 2000).
As future costs are being in DPV, the choice of a proper discount rate is a vital decision (Kshirsagar et al., 2010). Discount rates may include the effect of inflation, depending on whether nominal or real discount rate is used. A nominal discount rate incorporates an inflation component. By contrast, the real discount rate is adjusted (i.e., inflation removed from its figure) to eliminate the impact of expected inflation (Office of Management and Budget, 1992).
Real discount rate is selected here, for several reasons. Because LCBCA often covers extended periods, the real discount rate avoids the need for forecasting future inflation (Hudson et al., 1997; Moges et al., 2017). This use of the real discount rate is consistent with the recommendation of the Office of Management and Budget 1992) to avoid an inflation assumption whenever possible in LCBCA. (Fuller and Petersen, 1996; van den Boomen et al., 2017). As a result, the estimations are less affected by uncertainty and subjective influences (Zimmerman et al., 2000). In addition, netting out inflation to a constant rate while applying multiple nominal discount rates can result in inconsistency since the proportion of the inflation component within different nominal discount rates varies. These considerations, together with the fact that both types of the discount rates yield similar DPV when applied properly (Fuller and Petersen, 1996; Babusiaux and Pierru, 2005), support the decision to use real discount rates.
DPV of a general annual expense () returns the annualized expense over a time horizon T using the discount rate (Eq. 21). This general equation is used to calculate the DPV of insurance premiums, AAL, and annual loan payments, which are used to calculate total DPV and owner costs in Eqs. 22, 27.
Benefits of freeboard are the future costs reduced or prevented by the mitigation measure and are calculated as the difference in DPV of annual costs over the useful life of the home with versus without freeboard. The total DPV at BFE “no action” scenario is calculated as the sum of life-cycle cumulative DPVs of annual insurance premium and the total , such that is the sum of AAL DPVs allocated to owner and NFIP . The owner DPV at BFE “no action” scenario is calculated as the sum of life-cycle cumulative DPVs of annual insurance premium and the owner DPV , such that
Because loan-based freeboard cost accumulates over the life of the loan, it is assessed on an annualized DPV basis. By contrast, upfront freeboard cost is a one-time cost expressed as a percentage of the total BV only. The total DPV of each freeboard scenario with upfront freeboard cost is calculated as the upfront cost of freeboard plus the sum of life-cycle cumulative of the and the .
The owner DPV of each freeboard scenario with upfront freeboard cost is calculated as the upfront cost of freeboard plus the sum of life-cycle cumulative of the and the .
The total DPV of each freeboard scenario with loan-based cost is calculated as the sum of the life-cycle cumulative of the loan annual freeboard payment discounted to the present value , the , and the .
The owner DPV of each freeboard scenario with loan-based cost is calculated as the sum of the life-cycle cumulative of the loan annual freeboard payment discounted to the present value (), the , and the .
2.2.2 The net benefit
The NB of mitigation is the difference in life-cycle cost between the current and mitigated scenarios (Orooji and Friedland, 2017). The benefits of freeboard mitigation scenarios are the future reduced or prevented losses by the elevation increase. The NB of adding freeboard is determined by subtracting the life-cycle cumulative DPV of the freeboard scenario (represented generally in Eq. 28 as ) from the life-cycle cumulative DPV of “at BFE no action” scenario .
A positive value of indicates that the mitigated scenario is more cost beneficial than “the scenario under consideration.”
2.2.3 Net benefit-cost ratio
The cost effectiveness of adding freeboard (i.e., benefit per dollar spent) is quantified using NBCR. Calculating the NBCR provides a single value showing the relationship between NB and cost. is represented generally as the total NB of the freeboard scenario divided by its total cost , or
3 Sensitivity analysis
BCA is a useful method of appraising projects and examining their long-term financial efficiency. However, the uncertainty caused by key variables often acts as an impediment to its successful application (Maravas and Pantouvakis, 2018). The importance of the discount rate in LCBCA has been widely acknowledged (Emmerling et al., 2019). The choice of discount rate has an important role when determining the present value of benefits (Shreve and Kelman, 2014; Tate et al., 2016). However, a growing body of literature argues that the use of a particular discount rate for long-term projects has only limited justification (Tóth, 2000; Frederick et al., 2002; Ermolieva et al., 2012). In Fiscal Year 2018, USACE recommended a 2.875% discount rate for its projects; this is a substantial decline from a peak of 8.875% in 1990 (Fischbach et al., 2019). Cline (1999) and Ermolieva et al. (2012) argued for discount rate fluctuation during the years and that failing to consider such fluctuations may increase vulnerability and losses. Furthermore, U.S. Office of Management and Budget 1992) recommended using a variation of discount rates to assess the sensitivity of the results to the discount rate choice.
To address this problem, this LCBCA is evaluated over a range of discount rates. This will serve as a sensitivity analysis, which is a widely used approach in economic impact studies to test the effect of changing variable values for which there is uncertainty (Ruegg and Jordan, 2011). Using a range ensures more transparency in the interpretation of benefits involved and also enhances the awareness by highlighting the sensitivity of the results to the discount rate choice (Kozack, 2005). In this study, real discount rates are formed in a range that marks the upper and lower bounds. The range is bounded at the lower end by the highest NB that occurs at the point when the discount rate is zero (undiscounted case) where all future benefits are at their total value. For the upper end, real discount rates of 4, 8, and 12 percent are used in financial formulas to investigate the best investment alternative (Chizmar et al., 2019). Internationally, real discount rates of 3, 7, and 10 percent are suggested for the BCA sensitive analysis (Australian Office of Best Practice Regulation, 2020). Note that the use of a 7% real discount rate as a baseline with a 3% real discount rate to test the sensitivity of results is consistent with the requirements of U.S. Office of Management and Budget 1992) for BCA analyses. Thus, a 7% real discount rate is adopted as the baseline here, with real discount rates of 0, 3, 10, and 12% to test the sensitivity of results to the baseline rate.
4 Case study
A case study was conducted for Metairie, Louisiana, to demonstrate the methodology presented here, considering freeboard in half-foot increments. The building is a one-story, single-family residence with 2,500 ft2 of living area (Figure 1). The site is located in the metropolitan New Orleans area within Jefferson Parish (County) at coordinates 29°59′39.8″N, 90°10′05.7″W (Figure 2). The ground elevation at the location is −7.0 ft (NAVD88). The site is located on NFIP Map Panel 22051C0185F within flood zone AE −4, indicating that the required BFE of the building is −4 ft (NAVD 88). In addition, Jefferson Parish requires an additional 0.5 ft of freeboard to ensure a “code compliant” FFE of ‒3.5 ft (NAVD88).
FIGURE 1
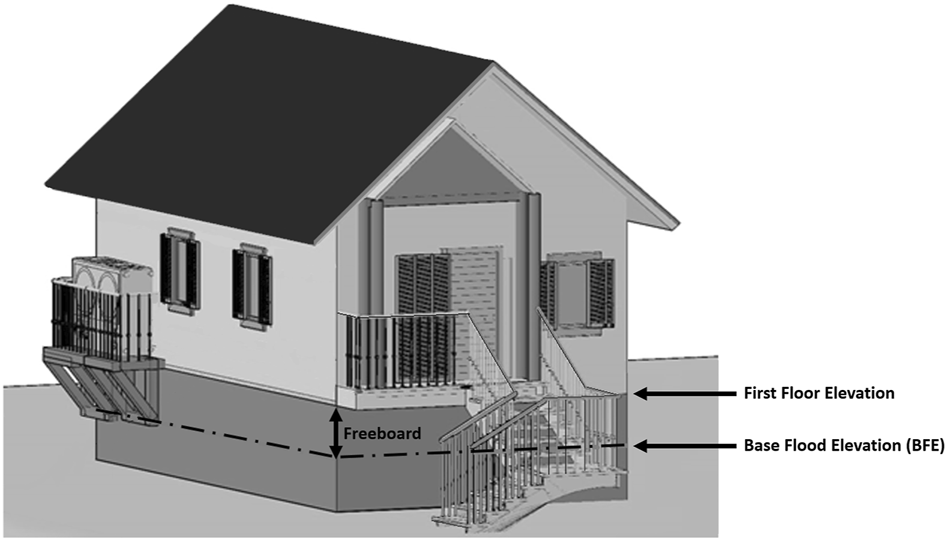
Proposed model of the single housing structure (Modified from Taghi Nezhad Bilandi, 2018).
FIGURE 2
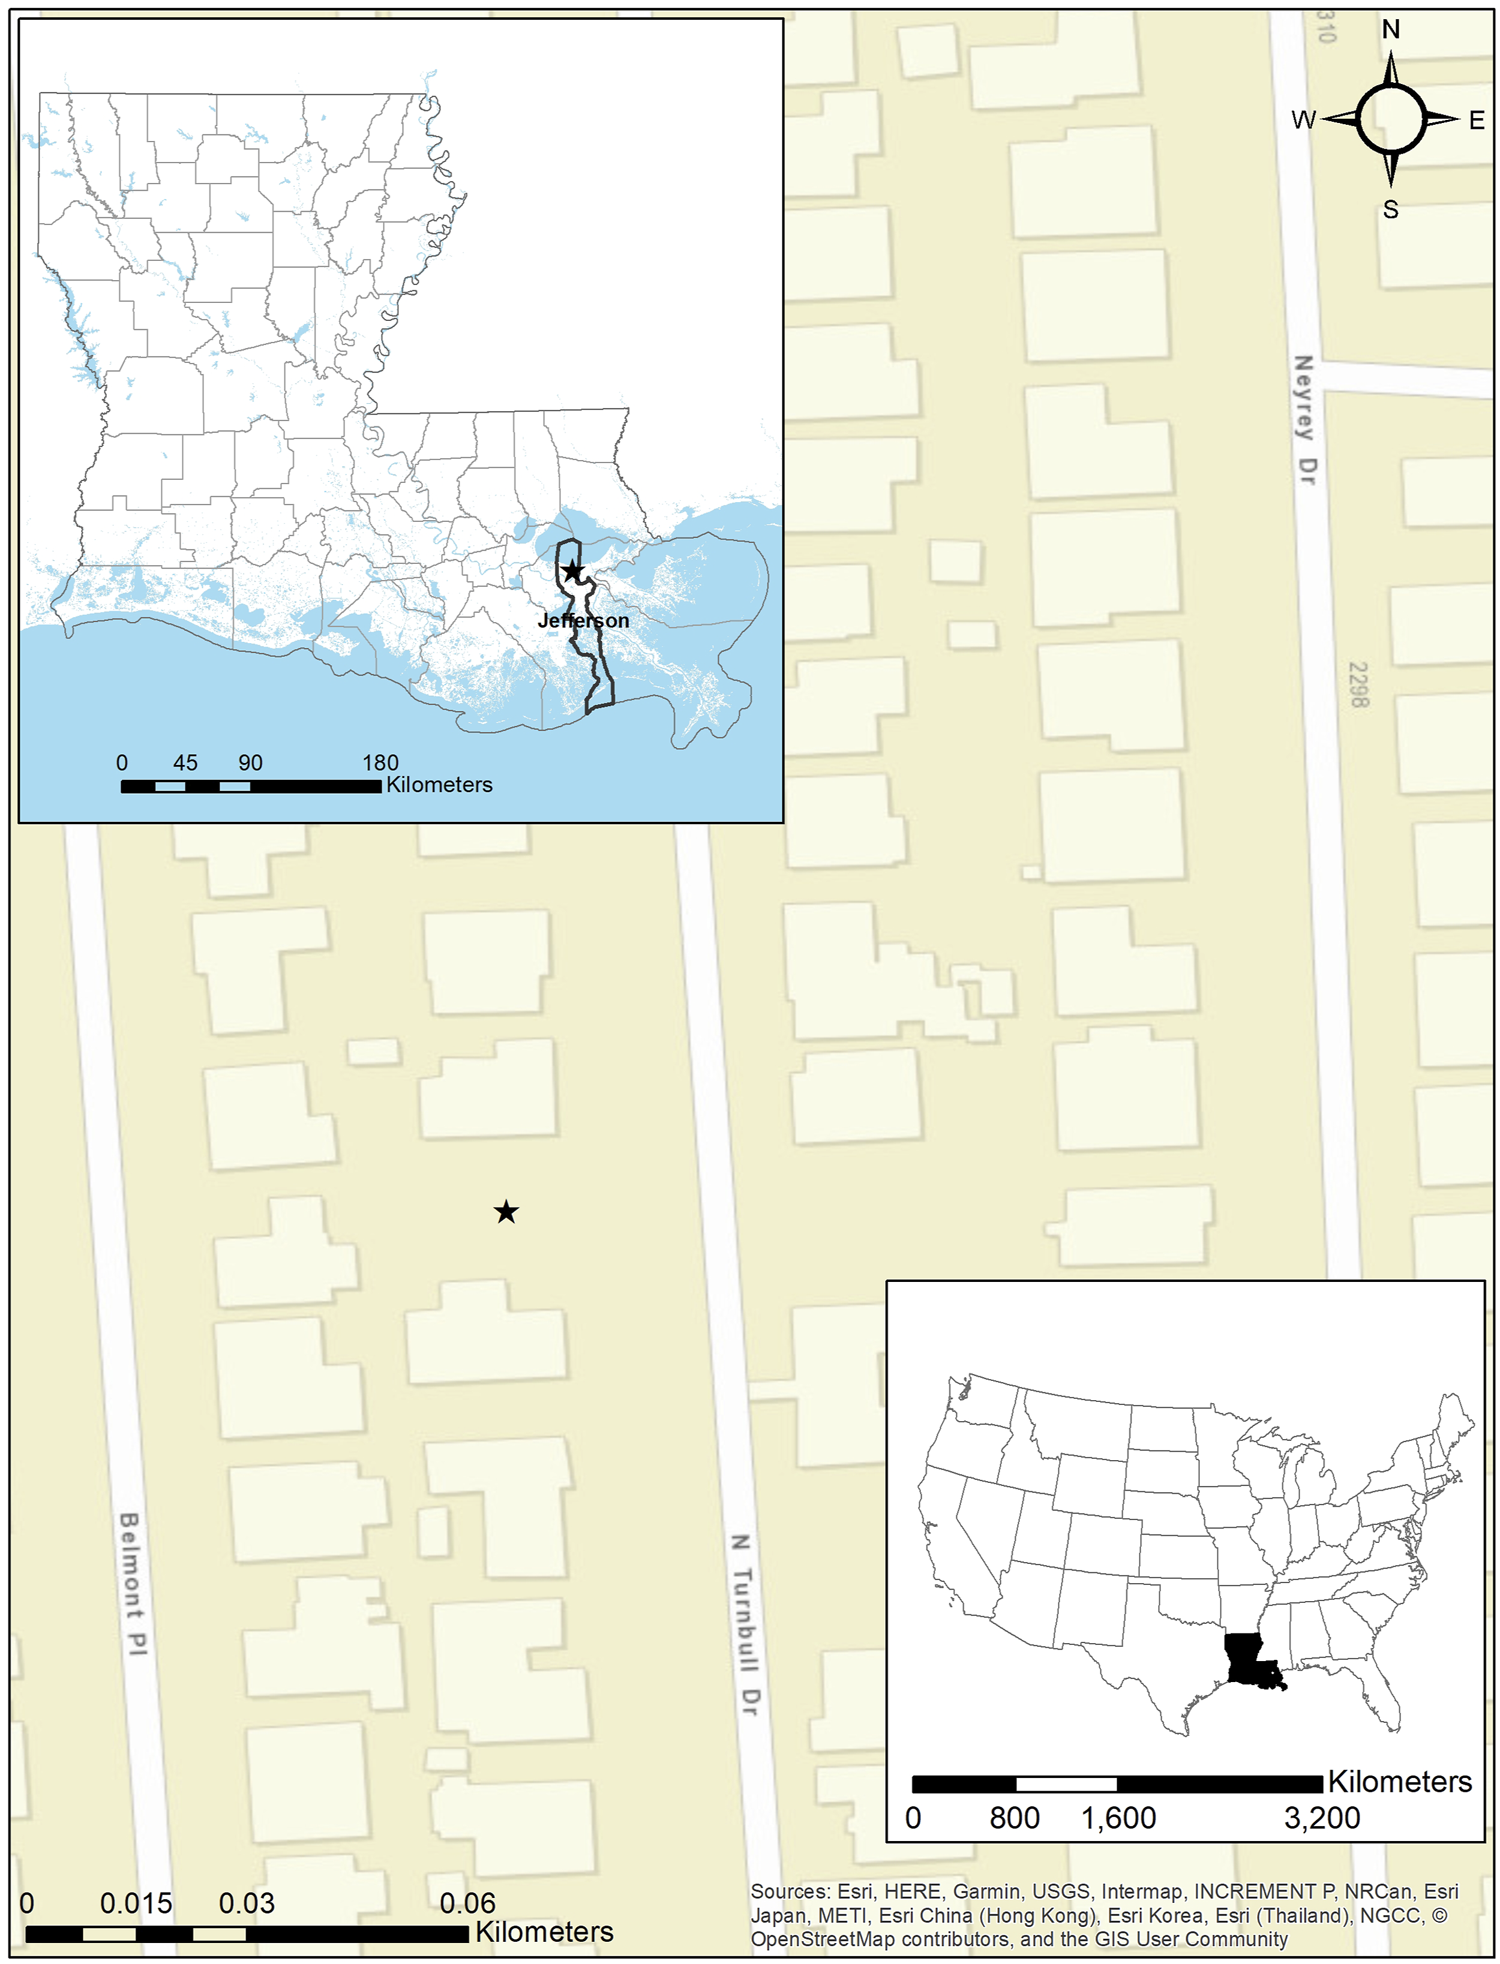
Metairie, Jefferson Parish, Louisiana, with star representing proposed building location.
The average construction cost of a single-family residence in the New Orleans area is $92.47 per square foot for a 2,500 ft2 residence (Moselle, 2019). Also, 2,500 ft2 is the average size for a single-family home in the southern U.S. (U.S. U.S. Census Bureau, 2020). The total estimated construction cost is $231,175. To calculate cost of construction at the half-foot increments not provided in Table 1, an interpolated value was used. The insurance coverage for structure and content is selected as $231,175 and $100,000, respectively. A minimum deductible of $1,250 for both structure and contents is required. Therefore, $1,250 was chosen as a conservative value.
Using the multi-frequency depth grids provided by Federal Emergency Management Agency’s Risk Mapping, Assessment and Planning (RiskMAP) project, the site’s flood elevations for the 10, 2, 1, and 0.2% annual chance flood events are −4.7, −4.2, −3.9, and −3.4 ft, respectively. The corresponding above ground flood depths are 2.3, 2.8, 3.1, and 3.6 feet.
5 Results and discussion
Results are presented in two steps: 1) determine the expected costs at BFE versus costs of each freeboard scenario, 2) conduct the BCA, where NBs and NBCRs are obtained for various combinations of freeboard, their cost options, benefit allocations, and discount rates. LCBCA of freeboard insurance savings is performed separately.
5.1 Expected costs
The benefit of adding freeboard is evaluated through consideration of construction cost, flood insurance premiums, and AAL.
5.1.1 Cost of freeboard construction
Construction cost for each freeboard increment is calculated as an upfront cost and as a loan (Table 2). For upfront option, the freeboard cost is calculated as a direct percentage of the total BV. In the loan option, freeboard cost is calculated as a part of a 30-years mortgage with fixed rate of 3.375 and 7% payment-related fees (current rates used by Federal National Mortgage Association (FAnnie Mae)).
TABLE 2
| Freeboard (ft) | First-floor elevation (ft) | Freeboard cost (upfront) | Freeboard cost (loan—Yearly) | Freeboard cost (loan—Total) |
|---|---|---|---|---|
| 0.0 | −4.0 | $0 | $0 | $0 |
| 0.5 | −3.5 | $2,659 | $158 | $4,743 |
| 1.0 | −3.0 | $5,317 | $316 | $9,485 |
| 1.5 | −2.5 | $7,860 | $467 | $14,022 |
| 2.0 | −2.0 | $10,403 | $619 | $18,558 |
| 2.5 | −1.5 | $13,061 | $777 | $23,300 |
| 3.0 | −1.0 | $15,720 | $935 | $28,043 |
| 3.5 | −0.5 | $18,378 | $1,093 | $32,786 |
| 4.0 | 0.0 | $21,037 | $1,251 | $37,528 |
Freeboard cost for upfront and loan options.
5.1.2 NFIP premiums
Calculated premiums include the NFIP Community Rating System (CRS) discount of 25% (rating of 5), $6 Increased Cost of Compliance (ICC) premium, reserve fund fee, $25 Homeowner Flood Insurance Affordability Act (HFIAA) surcharge, and $50 federal policy fee. Table 3 shows the calculated flood premiums, with annual premiums decreasing with each additional one-foot increment above BFE.
TABLE 3
| Freeboard (ft) | First-floor elevation (ft) | Premium | CRS discount | Reserve fund fee | Total annual premium |
|---|---|---|---|---|---|
| 0.0 | −4.0 | $2,117 | $529 | $287 | $1,954 |
| 0.5 | −3.5 | $2,117 | $529 | $287 | $1,954 |
| 1.0 | −3.0 | $1,070 | $268 | $146 | $1,027 |
| 1.5 | −2.5 | $1,070 | $268 | $146 | $1,027 |
| 2.0 | −2.0 | $665 | $166 | $91 | $669 |
| 2.5 | −1.5 | $665 | $166 | $91 | $669 |
| 3.0 | −1.0 | $538 | $135 | $74 | $556 |
| 3.5 | −0.5 | $538 | $135 | $74 | $556 |
| 4.0 | 0.0 | $514 | $129 | $70 | $535 |
Annual flood insurance total annual premium (including $6 for increased cost of compliance (ICC) premium, $25 homeowner flood insurance affordability Act (HFIAA) surcharge, and $50 federal policy fee) by freeboard height.
5.1.3 Average annual loss
AALs are computed for each 0.5-ft increment of additional freeboard above the BFE up to 4.0 ft, apportioned to the owner and NFIP. Results suggest that AAL is reduced with each additional freeboard increment, with higher reduction occurring on the smaller increments of freeboard and decreasing reduction as elevation increases (Table 4).
TABLE 4
| Freeboard (ft) | First-floor elevation (ft) | Building AAL | Content AAL | Owner building AAL | Owner content AAL | NFIP building AAL | NFIP content AAL | Total AAL | Avoided loss |
|---|---|---|---|---|---|---|---|---|---|
| 0.0 | −4.0 | $1,006 | $137 | $56 | $13 | $950 | $124 | $1,143 | $0 |
| 0.5 | −3.5 | $432 | $66 | $25 | $6 | $407 | $59 | $498 | $645 |
| 1.0 | −3.0 | $234 | $26 | $13 | $2 | $220 | $24 | $260 | $882 |
| 1.5 | −2.5 | $96 | $13 | $5 | $1 | $91 | $12 | $109 | $1,034 |
| 2.0 | −2.0 | $63 | $8 | $3 | $1 | $60 | $7 | $71 | $1,072 |
| 2.5 | −1.5 | $25 | $3 | $1 | $0 | $24 | $3 | $28 | $1,115 |
| 3.0 | −1.0 | $12 | $1 | $1 | $0 | $11 | $1 | $13 | $1,130 |
| 3.5 | −0.5 | $6 | $1 | $0 | $0 | $6 | $1 | $7 | $1,136 |
| 4.0 | 0.0 | $2 | $0 | $0 | $0 | $2 | $0 | $2 | $1,141 |
AAL results for each freeboard height scenario.
5.2 Benefit-cost analysis and sensitivity analysis
Tables 5, 6 show the BCA results presented as life-cycle NB and NBCR for various real discount rates, calculated for each freeboard scenario, as an upfront construction cost and as built into a mortgage, respectively.
TABLE 5
| Freeboard (ft) | 0% | 3% | 7% | 10% | 12% | |
|---|---|---|---|---|---|---|
| 0.5 | NB | $16,691 | $9,984 | $5,345 | $3,422 | $2,537 |
| NBCR | 6.3 | 3.8 | 2.0 | 1.3 | 1.0 | |
| 1.0 | NB | $48,983 | $30,160 | $17,143 | $11,746 | $9,263 |
| NBCR | 9.2 | 5.7 | 3.2 | 2.2 | 1.7 | |
| 1.5 | NB | $50,970 | $30,577 | $16,474 | $10,626 | $7,936 |
| NBCR | 6.5 | 3.9 | 2.1 | 1.4 | 1.0 | |
| 2.0 | NB | $60,307 | $35,795 | $18,845 | $11,816 | $8,583 |
| NBCR | 5.8 | 3.4 | 1.8 | 1.1 | 0.8 | |
| 2.5 | NB | $59,779 | $34,528 | $17,068 | $9,827 | $6,497 |
| NBCR | 4.6 | 2.6 | 1.3 | 0.8 | 0.5 | |
| 3.0 | NB | $60,510 | $34,085 | $15,811 | $8,234 | $4,748 |
| NBCR | 3.8 | 2.2 | 1.0 | 0.5 | 0.3 | |
| 3.5 | NB | $57,852 | $31,426 | $13,153 | $5,575 | $2,090 |
| NBCR | 3.1 | 1.7 | 0.7 | 0.3 | 0.1 | |
| 4.0 | NB | $55,823 | $29,179 | $10,755 | $3,115 | −$400 |
| NBCR | 2.7 | 1.4 | 0.5 | 0.1 | 0.0 |
Results of life-cycle benefit-cost analysis as shown by net benefit (NB) and net benefit-cost ratio (NBCR) calculated as an upfront construction cost, by freeboard scenario and real discount rate.
TABLE 6
| Freeboard (ft) | 0% | 3% | 7% | 10% | 12% | |
|---|---|---|---|---|---|---|
| 0.5 | NB | $14,607 | $9,544 | $6,042 | $4,590 | $3,922 |
| NBCR | 3.1 | 3.1 | 3.1 | 3.1 | 3.1 | |
| 1.0 | NB | $44,815 | $29,280 | $18,537 | $14,082 | $12,033 |
| NBCR | 4.7 | 4.7 | 4.7 | 4.7 | 4.7 | |
| 1.5 | NB | $44,808 | $29,276 | $18,534 | $14,080 | $12,031 |
| NBCR | 3.2 | 3.2 | 3.2 | 3.2 | 3.2 | |
| 2.0 | NB | $52,152 | $34,073 | $21,572 | $16,388 | $14,003 |
| NBCR | 2.8 | 2.8 | 2.8 | 2.8 | 2.8 | |
| 2.5 | NB | $49,540 | $32,367 | $20,491 | $15,567 | $13,302 |
| NBCR | 2.1 | 2.1 | 2.1 | 2.1 | 2.1 | |
| 3.0 | NB | $48,187 | $31,483 | $19,932 | $15,142 | $12,938 |
| NBCR | 1.7 | 1.7 | 1.7 | 1.7 | 1.7 | |
| 3.5 | NB | $43,444 | $28,384 | $17,970 | $13,652 | $11,665 |
| NBCR | 1.3 | 1.3 | 1.3 | 1.3 | 1.3 | |
| 4.0 | NB | $39,332 | $25,697 | $16,269 | $12,359 | $10,561 |
| NBCR | 1.0 | 1.0 | 1.0 | 1.0 | 1.0 |
As in Table 5, but calculated into a mortgage.
All freeboard scenarios outperform the BFE “no action” scenario (Tables 5, 6). For the upfront option using the baseline real discount rate of 7%, adding freeboard results in NBs ranging from $5,345 to $18,845, with NBCRs ranging from 0.5 to 3.2. The corresponding NBs for the loan option are slightly higher, ranging from $6,042 to $21,572 with considerably higher NBCRs ranging between 1.0 and 4.7.
With the lower 3% real discount rate, the NBs increase substantially. In the upfront option, the range becomes $9,984 and $35,795 with NBCRs ranging from 1.4 to 5.7, an increase of approximately 90% from the baseline real discount rate estimates. These numbers are slightly higher than the loan option, which ranges between $9,544 and $34,073 with unchanged NBCRs. Note that NBCRs for the loan option remain unchanged when applying various discount rates, because both variables of the ratio (benefits and costs) are discounted using the same discount rates. By contrast, for the upfront option only the benefits are discounted, while the costs are provided as initial one-time payments.
When benefits are not discounted (i.e., at 0% discount rate), all future benefits are at their total value, resulting in the highest NBs and NBCRs, especially in the upfront opinion. At a higher discount rate of 10%, the NBs and NBCRs decrease compared to the baseline estimates, with the upfront option offering more decrease than the loan option. However, when the discount rate is increased to 12%, the NBs decrease substantially, ranging from −$400 to $9,263 with NBCRs ranging from 0 to 1.7. For the mortgage option, NBs drop to a range of $3,922 to $14,003.
As can be observed from the NB results, the upfront option performs better with lower discount rates of 0 and 3%, while the loan option performs better with the higher rates of 7, 10, and 12%. This result is due to the inverse relationship between the loan’s interest rate for the freeboard cost and the discount rate. The PV of the freeboard cost is lower than its current value when the real discount rate used exceeds the loan’s interest rate. Conversely, when the loan’s interest rate exceeds the discount rate, the PV of the freeboard cost exceeds its current value, resulting in lower NBs.
The NB continues to increase with every additional half-foot of elevation increase, reaching the highest level at 2 ft of freeboard and then shows an incremental decline. Beyond 2 ft of freeboard, AAL values are too low and the estimations depend only on flood premium savings and the cost of elevation, with construction costs outweighing flood premium savings, leading to decreased NB. With no premium savings for half-foot increments, the estimations consider only the reduction in flood loss and the cost of elevation, resulting in low NBs and NBCRs. Greater NB increases are occurring for smaller freeboard and gradually decrease with greater freeboard. NBs decrease as real discount rates increase, with the slope of the curves for larger freeboard being steeper than smaller ones, meaning that the NB results for larger freeboard are more sensitive to discount rate changes. Additionally, as the real discount rate increases, the NB differences between freeboard increments are reduced.
These results demonstrate the utility of using NB to identify the most beneficial scenario. If NBCR had been chosen as the optimization metric, the best alternative (i.e., in this case, 2 ft) would be ranked below the other loan scenarios (i.e., 0.5, 1.0, and 1.5 ft). The higher NBCRs of these scenarios (i.e., 0.5, 1.0, and 1.5 ft) indicate that as freeboard increases, its value decreases with respect to the aggregated benefits (i.e., less benefit per dollar of cost). This result is expected since the largest portion of flood losses occurs at lower flood elevations. For the homeowner, these results suggest that even a modest freeboard provides substantial savings, The message for community planners is that wise planning with reasonable expectations on the front end enhances community sustainability.
5.3 Benefits allocation to owner
Among other results, the lifetime benefit for each freeboard is differentiated by the beneficiary, where it is apportioned as a homeowner and/or NFIP benefit. While freeboard cost and flood premium savings are considered in estimating owner benefit, the reduction in AAL benefit is assessed to determine the proportions allocated to the owner and the NFIP. Table 7 presents the owner-apportioned NB and NBCR, for various real discount rates, calculated for each freeboard scenario, both upfront and as a loan.
TABLE 7
| Freeboard (ft) | Owner/Upfront | Owner/Loan | |||||||||
|---|---|---|---|---|---|---|---|---|---|---|---|
| 0% | 3% | 7% | 10% | 12% | 0% | 3% | 7% | 10% | 12% | ||
| 0.5 | NB | −$1,519 | −$1,914 | −$2,187 | −$2,300 | −$2,352 | −$3,603 | −$2,354 | −$1,490 | −$1,132 | −$967 |
| NBCR | −0.6 | −0.7 | −0.8 | −0.9 | −0.9 | −0.8 | −0.8 | −0.8 | −0.8 | −0.8 | |
| 1.0 | NB | $24,143 | $13,931 | $6,869 | $3,940 | $2,593 | $19,975 | $13,051 | $8,262 | $6,277 | $5,363 |
| NBCR | 4.5 | 2.6 | 1.3 | 0.7 | 0.5 | 2.1 | 2.1 | 2.1 | 2.1 | 2.1 | |
| 1.5 | NB | $22,020 | $11,662 | $4,499 | $1,529 | $163 | $15,858 | $10,361 | $6,560 | $4,983 | $4,258 |
| NBCR | 2.8 | 1.5 | 0.6 | 0.2 | 0.0 | 1.1 | 1.1 | 1.1 | 1.1 | 1.1 | |
| 2.0 | NB | $30,217 | $16,136 | $6,399 | $2,361 | $504 | $22,062 | $14,414 | $9,126 | $6,933 | $5,924 |
| NBCR | 2.9 | 1.6 | 0.6 | 0.2 | 0.0 | 1.2 | 1.2 | 1.2 | 1.2 | 1.2 | |
| 2.5 | NB | $27,559 | $13,478 | $3,740 | −$297 | −$2,155 | $17,320 | $11,316 | $7,164 | $5,442 | $4,650 |
| NBCR | 2.1 | 1.0 | 0.3 | 0.0 | −0.2 | 0.7 | 0.7 | 0.7 | 0.7 | 0.7 | |
| 3.0 | NB | $28,290 | $13,034 | $2,484 | −$1,891 | −$3,903 | $15,967 | $10,432 | $6,604 | $5,017 | $4,287 |
| NBCR | 1.8 | 0.8 | 0.2 | −0.1 | −0.2 | 0.6 | 0.6 | 0.6 | 0.6 | 0.6 | |
| 3.5 | NB | $25,632 | $10,375 | −$174 | −$4,549 | −$6,561 | $11,224 | $7,333 | $4,643 | $3,527 | $3,014 |
| NBCR | 1.4 | 0.6 | 0.0 | −0.2 | −0.4 | 0.3 | 0.3 | 0.3 | 0.3 | 0.3 | |
| 4.0 | NB | $23,603 | $8,129 | −$2,572 | −$7,010 | −$9,051 | $7,112 | $4,646 | $2,942 | $2,235 | $1,910 |
| NBCR | 1.1 | 0.4 | −0.1 | −0.3 | −0.4 | 0.2 | 0.2 | 0.2 | 0.2 | 0.2 | |
Apportioned net benefit (NB) and net benefit-cost ratio (NBCR) by freeboard scenario and discount rate: Owner share.
With no premium savings for half-foot increments, the estimations consider only the flood loss reduction and elevation cost, resulting in negative NBs and NBCRs for the owner (Table 7). However, by elevating a home only 1 ft above BFE at a discount rate of 7%, for example, an owner would experience a lifetime NB of $6,869 for the upfront option and $8,262 for the mortgage option (Tables 7). However, as freeboard cost is a part of the NBCR estimations, the owner NBCR result is higher with the lower discount rates for the upfront option, while the loan option results remain unchanged when applying various discount rates.
The NB for the owner continues to rise up to 2 ft and gradually declines beyond 2 ft as AALs are minimal and the estimations start to depend only on premium and the freeboard cost.
5.4 BCA of freeboard insurance savings only
As flood occurrence is uncertain, if flood loss reduction is not considered when adding freeboard, the savings in annual insurance premiums alone are sufficient to recover the construction costs paid by the homeowner, for at least 1 ft of freeboard. Table 8 shows the life-cycle NB from annual flood premium savings, with, for example, a range of $11,503 to $17,608 when using a 7% real discount rate. At the same discount rate, the NBCRs range from 0.8 to 2.2. Premium NB results are unaffected by the loan; thus, the upfront and loan options are the same. For the first half-ft increment, there are no premium savings.
TABLE 8
| Freeboard (ft) | Upfront | |||||
|---|---|---|---|---|---|---|
| 0% | 3% | 7% | 10% | 12% | ||
| 0.5 | NB | $0 | $0 | $0 | $0 | $0 |
| NBCR | 0.0 | 0.0 | 0.0 | 0.0 | 0.0 | |
| 1.0 | NB | $27,810 | $18,170 | $11,503 | $8,739 | $7,467 |
| NBCR | 5.2 | 3.4 | 2.2 | 1.6 | 1.4 | |
| 1.5 | NB | $27,810 | $18,170 | $11,503 | $8,739 | $7,467 |
| NBCR | 3.5 | 2.3 | 1.5 | 1.1 | 1.0 | |
| 2.0 | NB | $38,550 | $25,187 | $15,946 | $12,114 | $10,351 |
| NBCR | 3.7 | 2.4 | 1.5 | 1.2 | 1.0 | |
| 2.5 | NB | $38,550 | $25,187 | $15,946 | $12,114 | $10,351 |
| NBCR | 3.0 | 1.9 | 1.2 | 0.9 | 0.8 | |
| 3.0 | NB | $41,940 | $27,401 | $17,348 | $13,179 | $11,261 |
| NBCR | 2.7 | 1.7 | 1.1 | 0.8 | 0.7 | |
| 3.5 | NB | $41,940 | $27,401 | $17,348 | $13,179 | $11,261 |
| NBCR | 2.3 | 1.5 | 0.9 | 0.7 | 0.6 | |
| 4.0 | NB | $42,570 | $27,813 | $17,608 | $13,377 | $11,430 |
| NBCR | 2.0 | 1.3 | 0.8 | 0.6 | 0.5 | |
| Loan/Mortgage | ||||||
|---|---|---|---|---|---|---|
| 0.5 | NB | $0 | $0 | $0 | $0 | $0 |
| NBCR | 0.0 | 0.0 | 0.0 | 0.0 | 0.0 | |
| 1.0 | NB | $27,810 | $18,170 | $11,503 | $8,739 | $7,467 |
| NBCR | 2.9 | 2.9 | 2.9 | 2.9 | 2.9 | |
| 1.5 | NB | $27,810 | $18,170 | $11,503 | $8,739 | $7,467 |
| NBCR | 2.0 | 2.0 | 2.0 | 2.0 | 2.0 | |
| 2.0 | NB | $38,550 | $25,187 | $15,946 | $12,114 | $10,351 |
| NBCR | 2.1 | 2.1 | 2.1 | 2.1 | 2.1 | |
| 2.5 | NB | $38,550 | $25,187 | $15,946 | $12,114 | $10,351 |
| NBCR | 1.7 | 1.7 | 1.7 | 1.7 | 1.7 | |
| 3.0 | NB | $41,940 | $27,401 | $17,348 | $13,179 | $11,261 |
| NBCR | 1.5 | 1.5 | 1.5 | 1.5 | 1.5 | |
| 3.5 | NB | $41,940 | $27,401 | $17,348 | $13,179 | $11,261 |
| NBCR | 1.3 | 1.3 | 1.3 | 1.3 | 1.3 | |
| 4.0 | NB | $42,570 | $27,813 | $17,608 | $13,377 | $11,430 |
| NBCR | 1.1 | 1.1 | 1.1 | 1.1 | 1.1 | |
BCA Results of Flood Premiums by Discount Rate, Freeboard Scenario, and Upfront vs. Mortgage Option.
6 Assumptions and limitations
Several assumptions and limitations of this work must be noted. First, the DDFs are assumed to be comprehensive of all loss experienced, and USACE (2000) is based on inland flooding. For coastal flooding applications, USACE (2006) or USACE (2015) may be preferable. Wing et al. (2020) evaluated the sensitivity of flood loss avoidance to DDFs. This remains an area of future research needed to enhance the accuracy of results. Second, the allocation of owner and NFIP benefit implicitly assumes that flood insurance provides replacement value for damaged items. While this is true for NFIP building coverage, NFIP contents coverage only compensates actual cash value (Kousky, 2018), resulting in an unquantified burden upon the homeowner. This issue has not been addressed robustly in flood loss reduction research and merits further attention. More generalized understanding is needed to know how insurance affects owner loss (i.e., building and content). Third, FEMA (2008) values for construction cost estimates used in the calculation should ideally be replaced by more robust cost estimates that consider varying foundation types. More research in this area is encouraged. Fourth, while a sensitivity analysis here evaluates the robustness of the calculations under varying real discount rates, the NB and NBCR are sensitive to these rates, indicating that more research using representative scenarios is needed. Fifth, LCBCA is impacted by high uncertainty since it relies on uncertain loss variables related to the unanticipated nature of flood occurrence. Sixth, other lifetime benefits aside from flood risk reduction and insurance premium savings are not considered here. These include the reduction of inconvenience, health impacts, and suffering, reduced loss of items of sentimental value and other intangible losses such as the environmental and social costs, faster recovery time for the individual and community, and increased curb appeal and therefore property values. Seventh, neglect of the possible future effects of climate change (Aerts and Wouter Botzen, 2011) and increase in asset values also make the estimated benefits considerably conservative. The savings at the community level are also substantial, as communities can receive further insurance premium reductions from CRS, as elevation increase is one condition for reduced premiums. Yet despite these potential benefits, many homeowners and communities do not take mitigation into account, suggesting that the benefits are not communicated effectively and are underutilized. Despite these assumptions and limitations, the methodology proposed here advances knowledge for economically optimizing elevation of single-family residences.
7 Summary and conclusion
A probabilistic LCBCA is performed to identify the economically optimal elevation of single-family residences at the time of construction by evaluating the performance of various freeboard scenarios. Life-cycle NB is disaggregated into owner and NFIP benefit, and the decision criteria consider both flood AALs and annual premiums. The aim is to support effective decision making framework that improves the quantification, provides actionable information, and communicates clear results.
More generally, results suggest that adding a reasonable amount of freeboard at the time of construction is a wise investment for the individual, community, and NFIP. A case study analysis of a 2,500 ft2 home in Metairie, Louisiana, shows that adding two feet of freeboard at an investment cost of $10,403, or 4.5% of the at-BFE construction cost, optimizes the total life-cycle NB at $21,572, with a 2.8 NBCR in the loan option, assuming the baseline real discount rate of 7%. The corresponding NB from annual flood premium savings alone is $15,536 with a 2.1 NBCR.
This optimal two feet of freeboard would add only $52 to the monthly payment of the 30-years mortgage with a fixed rate of 3.375%, while reducing NFIP premium by $107 monthly. Even if the value of flood loss reduction is neglected, NFIP premium savings alone offset the increased initial construction cost. This benefit increases after mortgage payments are complete.
Significant future work remains to refine the individual elements of the LCBCA calculation. The LCBCA should include a range of real discount rates to reveal sensitivity to discount rate. Upscaling the LCBCA methodology beyond the single-building level is an important next step, while making use of the life-cycle NB results at the building scale. Future research should also consider the impacts of climate change, following Xian et al. (2017), and its economic costs. Additional, more focused risk assessments could be performed in the future using this same methodology for short-or long-term duration events based on foundation type. Understanding the changes in results derived from the use of these more specific DDFs would provide valuable information for community planning and foundation recommendations for developers. Regardless, the research provides a strong first step in ensuring greater financial and community resilience to the flood hazard.
Statements
Data availability statement
The original contributions presented in the study are included in the article/Supplementary Material, further inquiries can be directed to the corresponding author.
Author contributions
EG developed the methodology, collected and analyzed the data, interpreted the findings, and drafted the manuscript. CF conceptualized the research idea, helped refine the methodology, and reviewed and edited the manuscript. RM selected the study area, prepared the base flood data, organized the paper, edited the manuscript, and addressed reviewers comments. MR improved the method, verified the results, edited the Monte Carlo simulation, and edited the manuscript. TG coded the Monte Carlo simulation and helped in the calculations. AT provided advice and contributed to the literature review. RR reviewed and edited earlier versions of the manuscript.
Funding
This research was funded by the U.S. Department of Homeland Security (Award Number: 2015-ST-061-ND0001- 01), the Louisiana Sea Grant College Program (Omnibus cycle 2020–2022; Award Number: NA18OAR4170098; Project Number: R/CH-03), the Gulf Research Program of the National Academies of Sciences, Engineering, and Medicine (Grant Agreement number: 200010880, “The New First Line of Defense: Building Community Resilience through Residential Risk Disclosure”), and the U.S. Department of Housing and Urban Development (HUD; 2019–2022; Award No. H21679CA, Subaward No. S01227-1). Any opinions, findings, conclusions, and recommendations expressed in this manuscript are those of the author and do not necessarily reflect the official policy or position of the funders. The publication of this article is subsidized by the LSU Libraries Open Access Author Fund.
Conflict of interest
The authors declare that the research was conducted in the absence of any commercial or financial relationships that could be construed as a potential conflict of interest.
Publisher’s note
All claims expressed in this article are solely those of the authors and do not necessarily represent those of their affiliated organizations, or those of the publisher, the editors and the reviewers. Any product that may be evaluated in this article, or claim that may be made by its manufacturer, is not guaranteed or endorsed by the publisher.
Supplementary material
The Supplementary Material for this article can be found online at: https://www.frontiersin.org/articles/10.3389/fenvs.2022.889239/full#supplementary-material
References
1
AertsJ. C.Wouter BotzenW. (2011). Flood‐resilient waterfront development in New York City: Bridging flood insurance, building codes, and flood zoning. Ann. N. Y. Acad. Sci.1227 (1), 1–82. 10.1111/j.1749-6632.2011.06074.xPubMed Abstract | CrossRef Full Text | Google Scholar
2
Australian Office of Best Practice Regulation (2020). Cost-benefit analysis guidance note. Canberra, ACT: Office of Best Practice Regulation. Available at: https://www.pmc.gov.au/sites/default/files/publications/cost-benefit-analysis_0.pdf. Google Scholar
3
BabusiauxD.PierruA. (2005). Corporate investment decisions and economic analysis: Exercises and case studies. Paris: Editions Technip. Google Scholar
4
BubeckP.De MoelH.BouwerL. M.AertsJ. C. J. H. (2011). How reliable are projections of future flood damage?Nat. Hazards Earth Syst. Sci.11 (12), 3293–3306. 10.5194/nhess-11-3293-2011CrossRef Full Text | Google Scholar
5
ChizmarS.CubbageF.CastilloM.SillsE.AbtR.ParajuliR. (2019). An economic assesment of silvopasture systems in the coastal plain of North Carolina. International Society of Forest Resource Economics 2018 Annual Meeting. Gatlinburg, Tennessee, USA: 19-21 March 2018. Forest Resource Economics in Transition, 51. Google Scholar
6
ClineW. R. (1999). Discounting for the very long term. Discount. Intergenerational Equity, 131–140. Google Scholar
7
CooperW.GarciaF.PapeD.RyderD.WitherellB. (2016). Climate change adaptation case study: Benefit-cost analysis of coastal flooding hazard mitigation. J. Ocean Coast. Econ.3 (2), 3. 10.15351/2373-8456.1059CrossRef Full Text | Google Scholar
8
DaigneaultA.BrownP.GawithD. (2016). Dredging versus hedging: Comparing hard infrastructure to ecosystem-based adaptation to flooding. Ecol. Econ.122, 25–35. 10.1016/j.ecolecon.2015.11.023CrossRef Full Text | Google Scholar
9
De RisiR.De PaolaF.TurpieJ.KroegerT. (2018). Life cycle cost and return on investment as complementary decision variables for urban flood risk management in developing countries. Int. J. Disaster Risk Reduct.28, 88–106. 10.1016/j.ijdrr.2018.02.026CrossRef Full Text | Google Scholar
10
de RuigL. T.HaerT.de MoelH.BotzenW. W.AertsJ. C. (2019). A micro-scale cost-benefit analysis of building-level flood risk adaptation measures in Los Angeles. Water Resour. Econ.32, 100147. Art. No. 100147. 10.1016/j.wre.2019.100147CrossRef Full Text | Google Scholar
11
DongY.FrangopolD. M. (2017). Probabilistic life-cycle cost-benefit analysis of portfolios of buildings under flood hazard. Eng. Struct.142, 290–299. 10.1016/j.engstruct.2017.03.063CrossRef Full Text | Google Scholar
12
EmmerlingJ.DrouetL.van der WijstK. I.van VuurenD.BosettiV.TavoniM.et al (201910400). The role of the discount rate for emission pathways and negative emissions. Environ. Res. Lett.14 (10). 10.1088/1748-9326/ab3cc9CrossRef Full Text | Google Scholar
13
ErmolievaT.ErmolievY.FischerG.MakowskiM.ObersteinerM. (2012). Discounting and catastrophic risk management. Risk Assessment and Management, 61–72. Retrieved from http://www.global-iq.eu/sites/default/files/17_-_ermolieva_et_al_2012_acpub_17_-_discountingandcatariskmanagement.pdfwebGoogle Scholar
14
FEMA. (2008). 2008 supplement to the 2006 evaluation of the national flood insurance program’s building standards. Retrieved from https://www.wbdg.org/ffc/dhs/criteria/fema-2008-supp-2006-eval-nfip-stand.Google Scholar
15
FEMA. (2009). BCA reference guide. Retrieved from https://www.fema.gov/sites/default/files/2020-04/fema_bca_reference-guide.pdf.Google Scholar
16
FischbachJ. R.JohnsonD. R.GrovesD. G. (2019). Flood damage reduction benefits and costs in Louisiana’s 2017 Coastal Master Plan. Environ. Res. Commun.1 (11), 111001. Art. No. 111001. 10.1088/2515-7620/ab4b25CrossRef Full Text | Google Scholar
17
FrankR. H. (2000). Why is cost-benefit analysis so controversial?J. Leg. Stud.29 (S2), 913–930. 10.1086/468099CrossRef Full Text | Google Scholar
18
FrederickS.LoewensteinG.O'DonoghueT. (2002). Time discounting and time preference: A critical review. J. Econ. Literature40 (2), 351–401. 10.1257/jel.40.2.351CrossRef Full Text | Google Scholar
19
FullerS.PetersenS. (1996). Life-cycle costing manual for the federal energy management program, NIST Handbook 135. Edition. Gaithersburg, MD: National Institute of Standards and Technology, 1995. Handbook (NIST HB)Available at: https://tsapps.nist.gov/publication/get_pdf.cfm?pub_id=907459. Google Scholar
20
HennequinT.SørupH. J. D.DongY.Arnbjerg-NielsenK. (2018). A framework for performing comparative LCA between repairing flooded houses and construction of dikes in non-stationary climate with changing risk of flooding. Sci. Total Environ.642, 473–484. 10.1016/j.scitotenv.2018.05.404PubMed Abstract | CrossRef Full Text | Google Scholar
21
HudsonW. R.HaasR.UddinW. (1997). Infrastructure management: Integrating design, construction, maintenance, rehabilitation and renovation. New York: McGraw-Hill. Google Scholar
22
KapposA. J.DimitrakopoulosE. G. (2008). Feasibility of pre-earthquake strengthening of buildings based on cost-benefit and life-cycle cost analysis, with the aid of fragility curves. Nat. Hazards (Dordr).45 (1), 33–54. 10.1007/s11069-007-9155-9CrossRef Full Text | Google Scholar
23
KouskyC. (2018). Financing flood losses: A discussion of the national flood insurance program. Risk Manag. Insur. Rev.21 (1), 11–32. 10.1111/rmir.12090CrossRef Full Text | Google Scholar
24
KozackJ. (2005). Considerations in the choice of the appropriate discount rate for evaluating sovereign debt restructurings. New Hampshire, United States: International Monetary Fund. Google Scholar
25
KshirsagarA. S.El‐GafyM. A.Sami AbdelhamidT. (2010). Suitability of life cycle cost analysis (LCCA) as asset management tools for institutional buildings. J. Facil. Manag.8 (3), 162–178. 10.1108/14725961011058811CrossRef Full Text | Google Scholar
26
KumarR.BhardwajA. (2015). Probability analysis of return period of daily maximum rainfall in annual data set of Ludhiana, Punjab. Indian J. Agric. Res.49 (2), 160. 10.5958/0976-058X.2015.00023.2CrossRef Full Text | Google Scholar
27
LorenteP. (2019). A spatial analytical approach for evaluating flood risk and property damages: Methodological improvements to modelling. J. Flood Risk Manag.12 (4), e12483. 10.1111/jfr3.12483CrossRef Full Text | Google Scholar
28
MalakarK. D. (2020). Flood frequency analysis using gumbel’s method: A case study of lower godavari river division, India. J. Sci. Comput.2 (9), 33–51. Available at: http://jscglobal.org/gallery/4-feb-1525.pdfGoogle Scholar
29
MaravasA.PantouvakisJ.-P. (2018). A new approach to studying net present value and the internal rate of return of engineering projects under uncertainty with three-dimensional graphs. Adv. Civ. Eng.2018, 1–9. Art. No. 6108680. 10.1155/2018/6108680CrossRef Full Text | Google Scholar
30
MogesM.AyedA.VieciliG.Abd El HalimA. (2017). “Review and recommendations for Canadian LCCA guidelines,” in TAC 2017: Investing in Transportation: Building Canada's Economy, 2017 Conference and Exhibition of the Transportation Association of Canada, Canada, May 3 2018. Retrieved from https://www.tac-atc.ca/sites/default/files/conf_papers/ayed.a-a_review_and_recommendations_for_canadian_lcca_guidelines.pdf. Google Scholar
31
MoselleB. (2019). National building cost ManualCraftsman book company. Carlsbad, California, United States: craftsman book company, 2019. Retrieved from https://www.craftsman-book.com/media/static/previews/2019_NBC_book_preview.pdf. Google Scholar
32
MostafizR. B.FriedlandC. J.RahmanM. A.RohliR. V.TateE.BushraN.et al (2021b). Comparison of neighborhood-scale, residential property flood-loss assessment methodologies. Front. Environ. Sci.9, 734294. 10.3389/fenvs.2021.734294CrossRef Full Text | Google Scholar
33
MostafizR. B.FriedlandC.RahimM. A.RohliR. V.BushraN. (2021a). “A data-driven, probabilistic, multiple return period method of flood depth estimation,” in AGU Fall Meeting 2021, Moscone Center, 9 Dec 2019 – 13 Dec 2019. Available at: https://www.essoar.org/doi/abs/10.1002/essoar.10509337.1. Google Scholar
34
Multihazard Mitigation Council (Mmc) (2017). Natural hazard mitigation saves: 2017 interim report. Washington, DC: National Institute of Building Sciences. Available at: https://www.fema.gov/sites/default/files/2020-07/fema_ms2_interim_report_2017.pdf. Google Scholar
35
NadarajahS.KotzS. (2004). The beta Gumbel distribution. Math. Problems Eng.2004 (4), 323–332. 10.1155/s1024123x04403068CrossRef Full Text | Google Scholar
36
NFIP (2021). NFIP flood insurance manual. Appendix J: Rate Tables. Washington, DC: Federal Emergency Management Agency (FEMA). Retrieved from https://www.fema.gov/sites/default/files/documents/fema_nfip-all-flood-insurance-manual-apr-2021.pdf. Google Scholar
37
Office of Management and Budget. (1992). Guidelines and discount rates for benefit-cost analysis of federal programs. Circular No. A-94. Retrieved from https://www.whitehouse.gov/sites/whitehouse.gov/files/omb/circulars/A94/a094.pdf. Google Scholar
38
OroojiF.FriedlandC. J. (2017). Cost-benefit framework to generate wind hazard mitigation recommendations for homeowners. J. Archit. Eng.23 (4). 04017019. 10.1061/(ASCE)AE.1943-5568.0000269CrossRef Full Text | Google Scholar
39
OroojiF.FriedlandC. J.SavioR. D.TaghinezhadA.MassarraC. C.BushraN.et al (2022). Generalized cost-effectiveness of residential wind mitigation strategies for wood-frame, single family house in the USA. Front. Built Environ.7, 745914. 10.3389/fbuil.2021.745914CrossRef Full Text | Google Scholar
40
Paleo-TorresA.ZhaoM.GurleyK.PinelliJ. P.BaradaranshorakaM. (2021). Modeling the influence of flood mitigation measures on the vulnerability of coastal residential construction. Nat. Hazards Rev.22 (4), 04021040. 10.1061/(ASCE)NH.1527-6996.0000507CrossRef Full Text | Google Scholar
41
PatelM. B. (2020). Flood frequency analysis using Gumbel distribution method at garudeshwar weir, narmada basin. Int. J. Trend Res. Dev.1 (7), 36–38. http://www.ijtrd.com/papers/IJTRD21899.pdfGoogle Scholar
42
QiH.QiP.AltinakarM. S. (2013). GIS-based spatial Monte Carlo analysis for integrated flood management with two dimensional flood simulation. Water Resour. manage.27 (10), 3631–3645. 10.1007/s11269-013-0370-8CrossRef Full Text | Google Scholar
43
RahimM. A.FreidlandC.RohliR. V.BushraN.MostafizR. B. (2021). “A data-intensive approach to allocating owner vs. NFIP portion of average annual flood losses,” in AGU Fall Meeting 2021, Moscone Center, 9 Dec 2019 – 13 Dec 2019. Available at: https://www.essoar.org/doi/abs/10.1002/essoar.10509337.1. Google Scholar
44
RahmanA.WeinmannP. E.HoangT. M. T.LaurensonE. M. (2002). Monte Carlo simulation of flood frequency curves from rainfall. J. Hydrology256 (3–4), 196–210. 10.1016/S0022-1694(01)00533-9CrossRef Full Text | Google Scholar
45
RueggR.JordanG. B. (2011). Guide for conducting benefit-cost evaluation of realized impacts of public R&D programs. Retrieved from https://www.nist.gov/system/files/documents/2017/04/28/Guide-for-Conducting-Benefit-Cost-Evaluation-of-Realized-Impacts-of-Public-R-D-Programs-2011.pdf. Google Scholar
46
SantosJ.FerreiraA. (2013). Life-cycle cost analysis system for pavement management at project level. Int. J. Pavement Eng.14 (1), 71–84. 10.1080/10298436.2011.618535CrossRef Full Text | Google Scholar
47
SatvatiS.NahviA.CetinB.AshlockJ. C.JahrenC. T.CeylanH.et al (2021). Performance-based economic analysis to find the sustainable aggregate option for a granular roadway. Transp. Geotech.26, 100410. 10.1016/j.trgeo.2020.100410CrossRef Full Text | Google Scholar
48
SayersP. (2013). The effectiveness of flood management: A case study of england. Watlington, UK: World Meteorological Organization. Retrieved from https://library.wmo.int/index.php?lvl=notice_display&id=15637#.YhbvZ-iIZPY. Google Scholar
49
Senate. (2011). Flood insurance reform and modernization act of 2011. Retrieved from https://www.congress.gov/bill/112th-congress/senate-bill/1940. Google Scholar
50
ShreveC. M.KelmanI. (2014). Does mitigation save? Reviewing cost-benefit analyses of disaster risk reduction. Int. J. Disaster Risk Reduct.10A, 213–235. 10.1016/j.ijdrr.2014.08.004CrossRef Full Text | Google Scholar
51
SinghP.SinhaV. S. P.VijhaniA.PahujaN. (20182018). Vulnerability assessment of urban road network from urban flood. Int. J. Disaster Risk Reduct.28, 237–250. 10.1016/j.ijdrr.2018.03.017CrossRef Full Text | Google Scholar
52
Taghi Nezhad BilandiA. (2018). “Costs and benefits of flood mitigation in Louisiana,”. Doctoral dissertation (Baton Rouge, LA: Louisiana State University). Retrieved from https://digitalcommons.lsu.edu/gradschool_dissertations/4787. Google Scholar
53
TateE.StrongA.KrausT.XiongH. (2016). Flood recovery and property acquisition in Cedar Rapids, Iowa. Nat. Hazards (Dordr).80 (3), 2055–2079. 10.1007/s11069-015-2060-8CrossRef Full Text | Google Scholar
54
TóthF. L. (2000). Intergenerational equity and discounting. Integr. Assess.1 (2), 127–136. 10.1023/a:1019123630345CrossRef Full Text | Google Scholar
55
U.S. Census Bureau (2020). New privately owned housing units completed in the south by purpose and design. Retrieved from https://www.census.gov/construction/nrc/pdf/quarterly_starts_completions.pdf.Google Scholar
56
USACE (2006). “Depth-damage relationships for structures, contents, and vehicles and content-to-structure value ratios (CSVR) in support of the donaldsville to the Gulf,” in Louisiana, feasibility study (Washington, DC: US Army Corps of Engineers). Available at: https://www.mvn.usace.army.mil/Portals/56/docs/PD/Donaldsv-Gulf.pdf. Google Scholar
57
USACE (2000). “Economic guidance memorandum (EGM) 01-03, generic depth damage relationships. 1–3,” in Memorandum from USACE (Washington, DC: United States Army Corps of Engineers). Google Scholar
58
USACE (2015). North Atlantic Coast comprehensive study: Resilient adaptation to increasing risk. Washington, DC: US Army Corps of Engineers. Available at: https://www.nad.usace.army.mil/Portals/40/docs/NACCS/10A_PhysicalDepthDmgFxSummary_26Jan2015.pdf. Google Scholar
59
van den BoomenM.SchoenmakerR.VerlaanJ. G.WolfertA. R. M. (2017). “Common misunderstandings in life cycle costing analyses and how to avoid them,” in Life-Cycle of engineering systems: Emphasis on sustainable civil infrastructure: Proceedings of the 5thinternational Symposium on life-cycle engineering. Editors BakkerJ.FrangopolD. M.van BreugelK. (Delft, Netherlands: Taylor & Francis), 1729–1735. 10.1201/9781315375175-251CrossRef Full Text | Google Scholar
60
WaylenP.WooM. -K. (1982). Prediction of annual floods generated by mixed processes. Water Resour. Res.18 (4), 1283–1286. 10.1029/wr018i004p01283CrossRef Full Text | Google Scholar
61
WingO. E.PinterN.BatesP. D.KouskyC. (2020). New insights into US flood vulnerability revealed from flood insurance big data. Nat. Commun.11 (1), 1444. 10.1038/s41467-020-15264-2PubMed Abstract | CrossRef Full Text | Google Scholar
62
XianS.LinN.KunreutherH. (20172017). Optimal house elevation for reducing flood-related losses. J. Hydrology548, 63–74. 10.1016/j.jhydrol.2017.02.057CrossRef Full Text | Google Scholar
63
YuJ. J.QinX. S.LarsenO. (2013). Joint Monte Carlo and possibilistic simulation for flood damage assessment. Stoch. Environ. Res. Risk Assess.27 (3), 725–735. 10.1007/s00477-012-0635-4CrossRef Full Text | Google Scholar
64
ZarekariziM.SrikrishnanV.KellerK. (2020). Neglecting uncertainties biases house-elevation decisions to manage riverine flood risks. Nat. Commun.11 (1), 5361. 10.1038/s41467-020-19188-9PubMed Abstract | CrossRef Full Text | Google Scholar
65
ZimmermanK. A.SmithK. D.GroggM. G. (2000). Applying economic concepts from life-cycle cost analysis to pavement management analysis. Transp. Res. Rec.1699 (1), 58–65. 10.3141/1699-08CrossRef Full Text | Google Scholar
Summary
Keywords
net benefit (NB), life-cycle benefit-cost analysis (LCBCA), benefit-cost analysis (BCA), expected annual loss (EAL), average annual loss (AAL), discounted present value, Monte Carlo simulation, Gumbel extreme value distribution
Citation
Gnan E, Friedland CJ, Mostafiz RB, Rahim MA, Gentimis T, Taghinezhad A and Rohli RV (2022) Economically optimizing elevation of new, single-family residences for flood mitigation via life-cycle benefit-cost analysis. Front. Environ. Sci. 10:889239. doi: 10.3389/fenvs.2022.889239
Received
04 March 2022
Accepted
30 June 2022
Published
24 August 2022
Volume
10 - 2022
Edited by
Martin Siegert, Imperial College London, United Kingdom
Reviewed by
Kurtis Robert Gurley, University of Florida, United States
Munshi Rahman, Georgia Southern University, United States
Updates
Copyright
© 2022 Gnan, Friedland, Mostafiz, Rahim, Gentimis, Taghinezhad and Rohli.
This is an open-access article distributed under the terms of the Creative Commons Attribution License (CC BY). The use, distribution or reproduction in other forums is permitted, provided the original author(s) and the copyright owner(s) are credited and that the original publication in this journal is cited, in accordance with accepted academic practice. No use, distribution or reproduction is permitted which does not comply with these terms.
*Correspondence: Rubayet Bin Mostafiz, rbinmo1@lsu.edu
This article was submitted to Water and Wastewater Management, a section of the journal Frontiers in Environmental Science
Disclaimer
All claims expressed in this article are solely those of the authors and do not necessarily represent those of their affiliated organizations, or those of the publisher, the editors and the reviewers. Any product that may be evaluated in this article or claim that may be made by its manufacturer is not guaranteed or endorsed by the publisher.