Uncommon Electromagnetic Radiations Related to Extra-High Voltage/Ultra-High Voltage Power Projects in China
- 1School of Automation Science and Electrical Engineering, Beihang University, Beijing, China
- 2China Electric Power Research Institute, Beijing, China
Based on the high-resolution electromagnetic field intensity observed by the DEMETER satellite, the harmonic electromagnetic radiations in the ionosphere closely above the extra-high voltage and ultra-high voltage power projects in the Chinese power grid have been detected. In the time-frequency spectrograms, these radiations are characterized by parallel spectral lines with spacings of 50, 100, 150, or 600 Hz. The highest frequency can reach approximately 8,850 Hz. The radiations are probably attributed to the nonlinear devices such as converters or geomagnetic disturbance. The harmonic radiations over alternating current-to-direct current (AC-to-DC) substations of power system are generally more diverse and stronger than those over AC-to-AC substations. The measurements on the ground demonstrate that the weak magnetic radiations at several kilohertz with an intensity in the order of nT do exist around substations. A simple physical model is established to understand the characteristics of harmonic radiations propagating from the Earth’s surface to the ionosphere.
1 Introduction
It is usually believed that the electromagnetic radiations from the power grid are confined to the Earth’s surface, and they could interfere with the measurement of the geomagnetic field, the safe operation of oil or gas pipelines, the navigation of ships, and geophysical explorations. However, in the 1960s, observations at two pairs of geomagnetic conjugate stations—Siple in Antarctica and Roberval in Quebec, Canada, and Halley Bay in Antarctica and St. Anthony in Newfoundland, Canada—showed that power line harmonic radiation (PLHR) can propagate between the geomagnetic conjugate points in a whistler mode (Helliwell et al., 1975; Park and Chang, 1978; Park and Helliwell, 1978; Park et al., 1983). In the time-frequency spectrogram of the electromagnetic field intensity, PLHR is characterized by a cluster of parallel spectral lines spaced by almost exactly 50/100 Hz or 60/120 Hz and without any drift over time, and their intensity is (5–40) dB stronger than the natural background noise.
The existence of PLHR and its associated triggered nonlinear emissions have been demonstrated by multiple satellites, such as Ariel III (the in-orbit duration is 1967–1978 and with an altitude of 497 km), Ariel IV (1971–1978, 497–590 km), OGO-4 (1967–1970, 409–895 km), ISEE-1 (1977–1987, 280–140,162 km), AUREOL-3 (1981–1986, 408–2000 km), OHZORA (1984–1989, 350–850 km), DEMETER (2004–2010, 660 km), and Chibis-M (2012–2014, 484–504 km) (Bullough et al., 1976; Luette et al., 1979; Bell et al., 1982; Tomizawa and Yoshino, 1985; Parrot, 1994; Němec et al., 2007). The occurrence rate of PLHR is high between local times of 06:00 A. M and 03:00 P. M, and its intensity is weaker on Sundays, consistent with the local power consumption (Park and Miller, 1979); thus, they have been thought to be related closely with the power grid. The suggested sources include the Čerenkov-like radiation generated by an electron beam traversing a dielectric interface when coronal discharge occurs along high-voltage transmission lines, but their frequency is generally more than MHz (Kikuchi, 1983); the unbalanced harmonic currents flow through three-phase long transmission lines, but their radiation power was measured to be far lower than the threshold power of PLHR propagating into the near-Earth space obtained from the experiments at geomagnetically conjugated stations (Park and Chang, 1978; Yearby et al., 1983); the harmonic radiations are generated by nonlinear 12-pulse converters, but the measurements on the ground indicate that these radiations mainly contain linear and left-handed polarization components, which does not support that PLHR is right-handed polarization and propagates along the geomagnetic field in a whistler mode (Yearby and Smith, 1994; Manninen, 2005). To date, a consensus has been reached that PLHR in the near-Earth space is related to the local power grid on the ground, however, its exact source is still uncertain. It is noteworthy that the power line emission (PLE) at 50/60 Hz still exists in the near-Earth space (Park and Helliwell, 1981; Rodger et al., 1995; Dudkin et al., 2015; Wu et al., 2019). The frequency of PLE depends on the local power system and could be largely recorded at night (Pilipenko et al., 2021). PLHR usually occurs with PLE, but PLE does not necessarily occur with PLHR.
The electromagnetic radiations from the power grid including PLHR and PLE have been recognized as a kind of pollutant to the near-Earth space (Parrot and Zaslavski, 1996). They undoubtedly interfere with ionospheric and magnetospheric studies based on ground and satellite experiments. They can even affect the lifetime of energetic electrons in the radiation belt through wave-particle cyclotron resonance and may lead to frequent thunderstorms (Bullough et al., 1976; Yearby and Smith, 1994). With the increase of global power consumption, PLHR will become more serious (Parrot and Zaslavski, 1996). The large changes in the Chinese power grid during the in-orbit operation of the DEMETER satellite create an opportunity to further understand the mechanism of PLHR. In this study, some uncommon power harmonic radiations observed by DEMETER related to the large-capacity ±500 kV DC, and 500 and 1,000 kV AC power projects in the Chinese power grid are illustrated, and a simple physical model was established to analyse some characteristics of these radiation waves.
2 Materials and Methods
2.1 The DEMETER Satellite
The DEMETER satellite adopted a near sun-synchronous orbit and operated at an altitude of 660 km from 29 June 2004, to 9 December 2010. Its daytime orbit (from the Northern Hemisphere to the Southern Hemisphere) passed over a specific zone at 10:30 LT, while its night-time orbit (from the Southern Hemisphere to the Northern Hemisphere) passed over the same zone at 22:30 LT. DEMETER has two operating modes: survey and burst. The burst mode was turned on for several minutes or tens of minutes when the satellite flew over some specific zones and provided observation data with a higher sampling frequency.
DEMETER measured the data in the burst mode of electric field E and magnetic field density B in the band of 0–20 kHz using an electric field detector (ICE) and an inductive magnetic field detector (IMSC) with a sampling frequency of 40 kHz. Rather than B which was easily interfered by natural noise, E was analyzed using a short-time Fourier transform with a Hanning window to obtain spectrograms with frequency resolution of 1 Hz and time resolution of 0.8192s, sufficient to detect PLHR. Plasma electron density Ne measured by the Langmuir probe (ISL) with a time resolution of 1s was used to check the variation of the ionospheric state when PLHR occurred.
2.2 The Magnetic Field Measurement
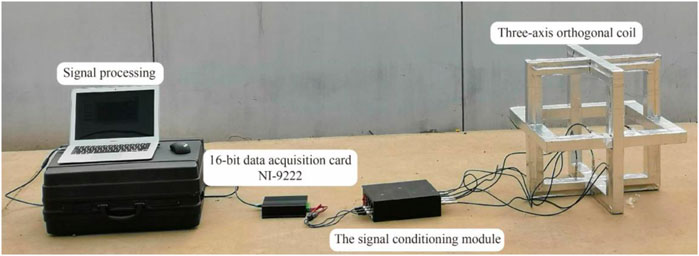
In order to detect the weak magnetic field, a three-axis orthogonal coil with an electric field shielding layer is designed (Li et al., 2021) which is shown in Figure 1. The size of the coil can make its thermal noise level much lower than the natural background noise in the atmosphere (ITU-R P. 372-10). The signal conditioning module uses a two-stage amplification. The signal of the coil induction voltage is acquired by a 16-bit data acquisition card NI-9222, and the maximum sampling frequency is 500 kHz. The sensor can measure a weak magnetic field of 0.15 pT. In the frequency band of 10 Hz–20 kHz, the noise level is lower than
3 Radiations Related to Extra-High Voltage/Ultra-High Voltage AC and DC Substations
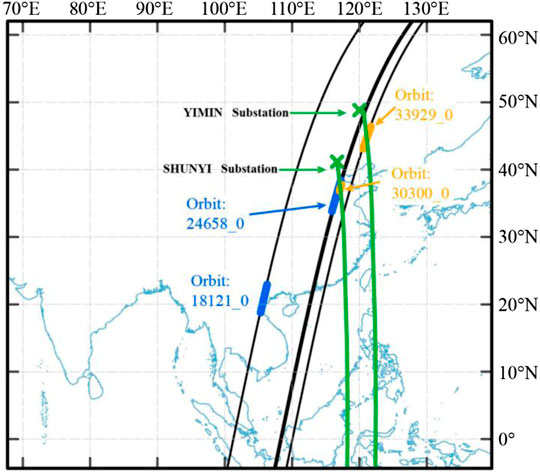
Figure 2 shows the geographical projections of four daytime orbits with PLHR on the Earth’s surface, where thin black lines represent the satellite orbits and the blue and orange segments are respectively the locations of common PLHR events containing at least three parallel spectral lines spaced by 50 Hz/100 Hz in the band of 1–5 kHz, and uncommon PLHR events newly detected. Lines in green show geomagnetic field lines across PLHR segments which obtained from the geomagnetic dipole model (Walt, 1994). Assume that PLHR propagates along the geomagnetic field in whistler mode, and the northern footprints of green geomagnetic field lines across the centres of orange PLHR segments are respectively close to the ±500 kV Yimin AC-to-DC substation in which the low AC voltage is converted to the high DC voltage before realizing high voltage DC transmission and the 500 kV AC-to-AC Shunyi substation in which the low AC voltage is converted to the high AC voltage before realizing high voltage AC transmission. The location of substation is marked by green cross.
3.1 Common PLHR Events
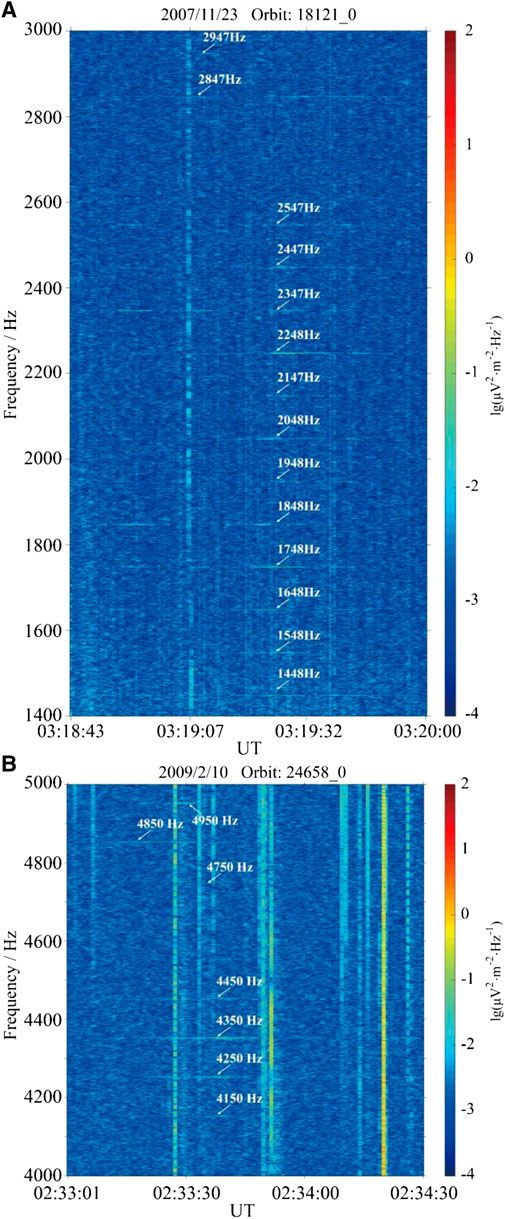
Until now, all reported PLHR events are in the band of 1–5 kHz and with the frequency spacings of 50/100 Hz or 60/120 Hz, which are called as common events. From the spectrogram along orbit 18,121_0 on 23 November 2007 in Figure 3A, there are some obvious spectral lines at 1,448/1548/1,648/1748/1848/1948/2048/2147/2,248/2347/2,447/2547/2,847/2,947 Hz with the peak intensity of 0.183 μV/m. Similarly, from the spectrogram along orbit 24,658_0 on 10 February 2009 in Figure 3B, some obvious spectral lines occur at 4,150/4250/4,350/4450/4,750/4,850/4,950 Hz with the peak intensity of 0.252 μV/m. The similar common PLHR events were often detected when DEMETER flew over China. Their dependence on the power consumption, season, and geomagnetic activity has been systematically studied in Wu et al. (2017).
3.2 Uncommon PLHR Events
3.2.1 Events Related to the 500 kV AC-To-AC Substation
Figure 4A shows the spectrogram of the electric field intensity along orbit 30,300_0 on 1 March 2010. Some obvious lines at 2,350/2,450 Hz, 4,151/4251/4,351/4,451 Hz, and 8,351/8452/8,551/8651/8,751/8,851 Hz are detected, which have far exceeded the frequency band of common PLHR events. Particularly, the harmonic spectral lines in the bands of (2,350–2,450) Hz, (4,150–4,450) Hz and (8,350–8,850) Hz are not simultaneously observed. The distances between their centres are approximately 9.97 km (0.08°) and 18.7 km (0.15°) at the satellite altitude. From Figure 2, these PLHRs seem to be related to the 500 kV Shunyi substation at (40.24°N, 116.74°E) with a capacity of (2 × 750 + 2 × 1,250) MVA. It is the load-centre substation in 500 kV Fengzhen-Wanquan-Shunyi power project. From Figure 4B, the smallest and greatest intensities of PLHR lines are 0.087 μV/m at 8,651 Hz and 0.228 μV/m at 4,251 Hz, which are 3.88 and 11.81 dB higher than the average background noise, respectively. Three days before PLHR occur, the maximum SYM-H index is only 18 nT and during its occurrence the SML and SMU index shown in Figure 4C have a very small disturbance. Cross-covariance analysis of PLHR between (4–4.5) kHz and (8–9) kHz was performed, and the correlation coefficient is less than 0.2, which indicate that the radiations in the two bands are more likely to be independent, and there are no wave-wave coupling between them (Němec et al., 2017).
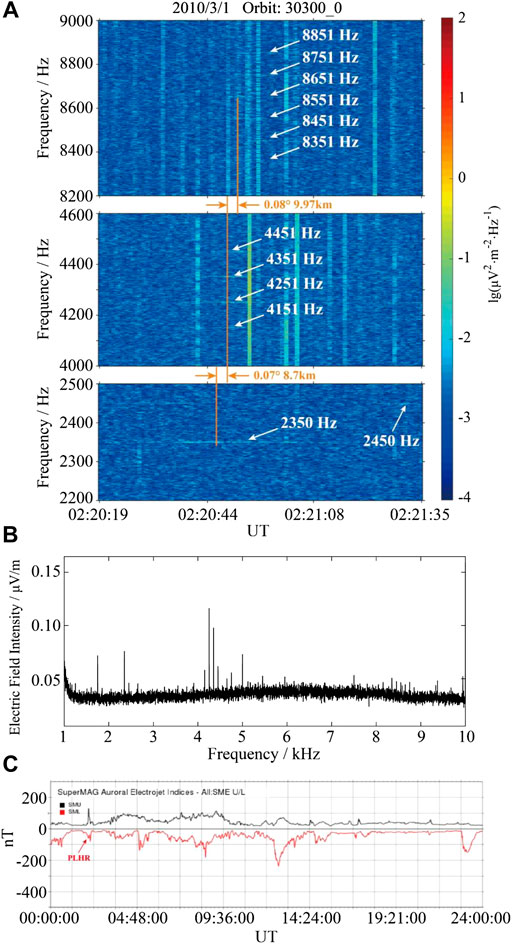
FIGURE 4. Uncommon PLHR occurrences over the 500 kV Shunyi AC-to-AC substation. (A) Time-frequency spectrogram of the electric field intensity along orbit 30,300_0. (B) Amplitude-frequency characteristics of the electric field intensity. (C) Fluctuation of the geomagnetic indices SMU/SML.
The magnetic field around the Shunyi substation was measured in April 2020. Figures 5A,B shows the harmonic ratio at 50 m away from the substation and along the transmission line (280 m away from the substation). The greatest intensities of the harmonic radiations are respectively 0.68 nT in the band of (1,500–2,200) Hz, 0.93 nT in the band of (3,900–4,000) Hz and 0.23 nT in the band of (7,600–8,000) Hz. It is noted that the harmonic radiation frequencies in Figures 4B, 5A are not exactly same. Their difference may be due to the big change of the substation structure from 2010 to 2020, the doppler frequency shift, or the nonlinear effect of ionosphere. Particularly, the radiations at several kHz are gradually attenuated according to Figure 5C and it is difficult to detect them at distances beyond 500 m from the substation. Therefore, the source of PLHR is inferred to be in the substation.
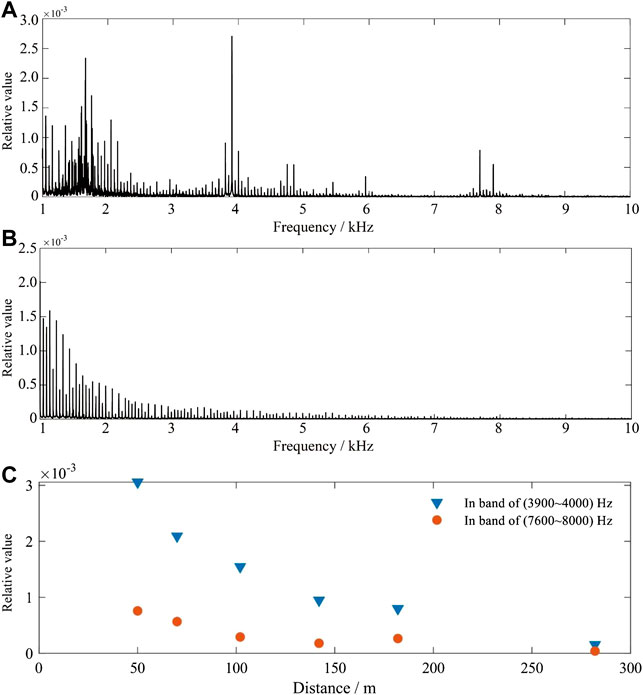
FIGURE 5. Measurement results of the magnetic field near the Shunyi AC-to-AC substation. Normalized values of the magnetic field density at 50 m (A) and 280 m (B) away from the substation. Panel (C) show variations of the maximum magnetic field density in bands of 3,900–4,000 Hz and 7,600–8,000 Hz with distance away from the substation.
3.2.1 Events Related to the ±500 kV AC-To-DC Substation
The ±500 kV Hulunbeier-Liaoning power project was the first EHV DC interregional interconnection project in the northeast power grid of China. The ±500 kV Yimin substation with the capacity of (1,000 + 2×600) MVA located at (48.65°N, 119.79°E) is the starting point of the project and is approximately 5 km away from the Yimin power plant. There has been no PLHR detected until this substation was put into operation on 28 September 2010. Figure 6A shows the time-frequency spectrogram of the electric field intensity along orbit 33,929_0 on 3 November 2010. During 02:03:02–02:04:00 universal time (UT), in the band of (2.3–4.5) kHz, besides those common radiations at frequencies 2,350 Hz, 2,401 Hz, 2,449 Hz and 2,551 Hz with the interval of ≈50 Hz and frequencies 2,851 Hz and 2,949 Hz with the interval of ≈100 Hz, there are some particular radiations at frequencies 2,551 Hz, 2,701 Hz and 2,851 Hz with the interval of ≈150 Hz and at frequencies 3,549/3,649 Hz and 4,149/4,249 Hz with the interval of ≈600 Hz. From the amplitude-frequency characteristic in Figure 6B, the smallest and greatest intensities of PLHR are 0.62 μV/m at 2,851 Hz and 1.39 μV/m at 3,549 Hz, and they are 11.42 and 27.30 dB higher than the average background noise, respectively.
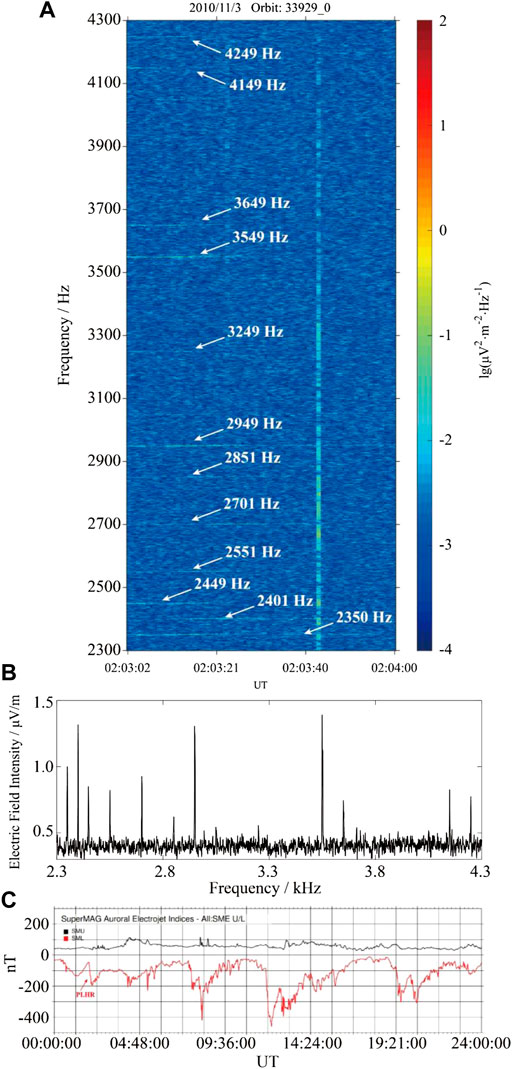
FIGURE 6. Uncommon PLHR occurrences over the ±500 kV Yimin AC-to-DC substation. (A) Time-frequency spectrogram of the electric field intensity along orbit 33,929_0. (B) Amplitude-frequency characteristics of the electric field intensity. (C) Fluctuation of the geomagnetic indices SMU/SML.
Three days before PLHR occur, the maximum SYM-H index is only 16 nT, but in Figure 6C during its occurrence the SML index decreases rapidly by more than 100 nT and the SMU index is larger than 30 nT. The geomagnetic disturbance became a little stronger than that in Figure 4C, which can promote the generation of the geomagnetic-induced currents (GICs). GICs can make the converting transformers DC-biased and result in harmonic voltage at frequencies f = 3fN where fN is the nominal frequency, so it is speculated that GICs may be the origin of radiations spaced by 150 Hz. Additionally, due to the characteristic harmonic frequencies of the 12-pulse AC/DC converter are
The event shown in Figure 6 is a good example to illustrate the dependence of PLHR on the harmonic source in the power grid and its propagation characteristics in the ionosphere can be studied by a quasi-linear model. Compared with results in (Yearby and Smith, 1994; Manninen, 2005), this event shows that the radiations of converters do not have to be left-handed polarised, or their polarization direction will be changed during the propagation into the near-Earth space.
4 Propagation Characteristics of PLHR
The ionosphere is a coupling system between the atmosphere and magnetosphere, so DEMETER can capture the energetic particles precipitated from the radiation belt. During the propagation of PLHR wave along the geomagnetic field line, it can interact resonantly with the charged particles in cyclotron motion along the geomagnetic field line in which the wave intensity will be amplified by energy exchange between PLHR waves and energetic electrons (Bruce and Gurbax, 1997). Due to the complexity of the space environment and the limitation of satellite-based observation technology, now it is quite difficult to solve rigorously and scientifically the propagation mechanism of PLHR and their effects. This section attempts to explain some characteristics of PLHR through a simple linear model.
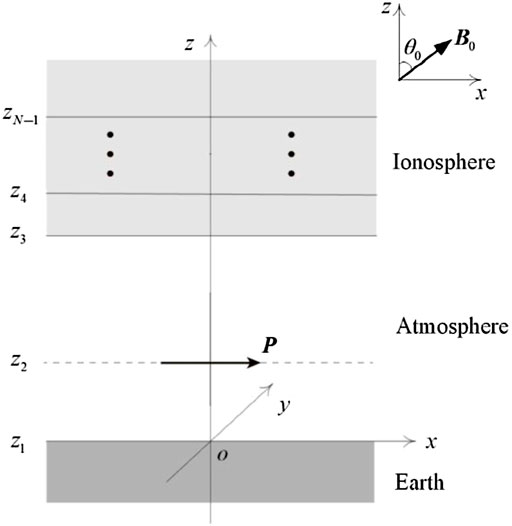
Considering that the dimensions of the substation on the Earth’s surface are far less than the Earth’s radius, a horizontal stratified model is established in Figure 7 to study the propagation characteristics of PLHR. The first layer (
where j is the imaginary unit;
where c is the light speed in the vacuum and
Assuming
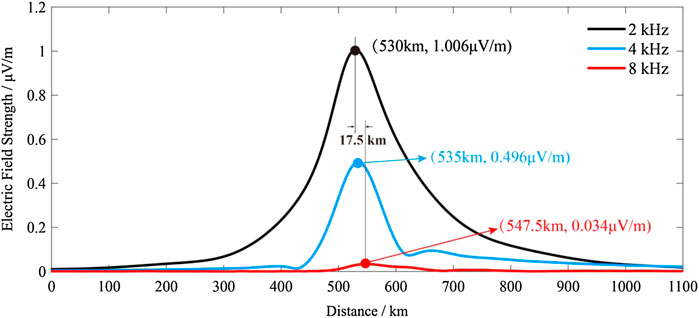
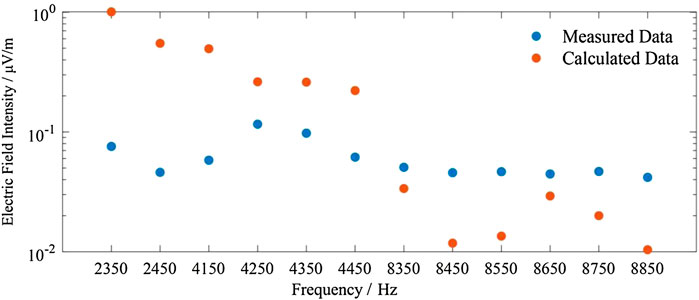
FIGURE 9. Variation in the electric field intensity at the satellite altitude calculated by the FWM.
In addition, if the electromagnetic wave in the range of (2–9) kHz generated by the Shunyi substation at 40.24°N is supposed to be guided by the geomagnetic field and propagate into the space plasma, then the wave is located at approximately 35.9°N when it reaches the altitude 660 km. The horizontal distance between Shunyi substation and PLHR segment is 515 km and their latitude derivation is 4.2° in Figure 2, which is in agreement with the horizontal distance 530–547.5 km and the latitude derivation 4.3°–4.5° between the dipole source and the peak electric field intensity in Figure 9.
5 Discussion and Conclusion
This paper discussed the electromagnetic environment issue due to power projects from the perspective of near-Earth space. Based on the observation data of DEMETER, many uncommon PLHR events have been detected after some EHV/UHV substations put into the Chinese power grid. Compared with those common events in the band of 1–5 kHz and spaced by 50/100 Hz, the frequency band of newly identified events is extended to approximately 8,850 Hz and spaced by 50/100/150/600 Hz, which further demonstrated PLHR is closely related to the local power grid.
Since PLHR was identified (Helliwell et al., 1975), its source has been focused on the power lines. However, the measurements on the ground show the harmonic radiation around the EHV/UHV substation is stronger than that around the power line, and it contains more abundant harmonic components. Although the frequencies of the harmonic radiation components observed by satellite in 2010 and measured around the substations in 2020 are not exactly identical, they are similar. As an important part of power grid, the substation contains not only high-voltage systems composed of buses, transformers, breakers, inductors, and grounding electrodes to implement power collection, distribution, and transformation but also weak electronic systems to implement the functions of protection, control, and communication. They are easier to generate steady-state radiations due to three-phase unbalanced current, GIC and corona current and transient radiations due to lightning strikes, faults, and switch operations. Under the excitation of specific source, the substation is more likely to act as an artificial transmitter than the power line, generate high-order harmonic radiation and transmit them to the near-Earth space. Compared with the AC-to-AC substations, the AC-to-DC substations have an extra 12-pulse converter, and their harmonic radiation is more diverse and stronger, which have been verified by our satellite-based PLHR events. However, the harmonic current along the long-distance power line will be affected by the distribution parameters and has an attenuation tendency, and their radiation can also be weakened by the demagnetization of overhead ground wire. The EHV/UHV substation is more likely to be a source of PLHR.
To date, a common consensus is that PLHR will become more and more severe, and its triggered emissions increase the background VLF noise level in the near-Earth space. These additional noise makes the experiment design for magnetospheric study more complicated, degrades VLF communication links, and interferes with ground-based experiments. With the development of modern power grid, its effects on the ionospheric state which is closely related to human activities, such as radio communication, broadcasting, radio navigation, radar positioning and so on, should arouse attention and be evaluated seriously. Our work has only promoted the solution of the corresponding source of PLHR on the ground. How the radiation in the substation is generated still needs to be systematically demonstrated in future. Moreover, the propagation characteristics of PLHR between the hemispheres, and its impacts on the dynamics of energetic electrons in the Earth’s radiation belt also need the support of a large amount of satellite-based observation events and thoroughly theoretical analysis.
Data Availability Statement
The raw data supporting the conclusions of this article will be made available by the authors, without undue reservation.
Author Contributions
JW led the study, supervised the project development and contributed significantly to explain the results. JZ contributed to the satellite-based and ground-based data analysis. JW, JZ and LX contributed to the measurements on the ground and the original draft. All authors approved the final manuscript.
Funding
The study was supported by the National Natural Science Foundation of China under Grant 51,777,006. Beijing Natural Science Foundation under Grant 8222063.
Conflict of Interest
The authors declare that the research was conducted in the absence of any commercial or financial relationships that could be construed as a potential conflict of interest.
Publisher’s Note
All claims expressed in this article are solely those of the authors and do not necessarily represent those of their affiliated organizations, or those of the publisher, the editors and the reviewers. Any product that may be evaluated in this article, or claim that may be made by its manufacturer, is not guaranteed or endorsed by the publisher.
References
Bell, T. F., Luette, J. P., and Inan, U. S. (1982). ISEE 1 Observations of VLF Line Radiation in the Earth's Magnetosphere. J. Geophys. Res. 87 (A5), 3530–3536. doi:10.1029/JA087iA05p03530
Bullough, K., Tatnall, A. R. L., and Denby, M. (1976). Man-made e.l.f./v.l.f. emissions and the radiation belts. Nature 260 (5550), 401–403. doi:10.1038/260401a0
Dudkin, F., Korepanov, V., Dudkin, D., Pilipenko, V., Pronenko, V., and Klimov, S. (2015). Electric Field of the Power Terrestrial Sources Observed by Microsatellite Chibis-M in the Earth's Ionosphere in Frequency Range 1-60 Hz. Geophys. Res. Lett. 42 (14), 5686–5693. doi:10.1002/2015GL064595
Fedorov, E., Mazur, N., Pilipenko, V., and Baddeley, L. (2016). Modeling the High-Latitude Ground Response to the Excitation of the Ionospheric MHD Modes by Atmospheric Electric Discharge. J. Geophys. Res. Space Phys. 121 (11), 11282–11301. doi:10.1002/2016JA023354
Helliwell, R. A., Katsufrakis, J. P., Bell, T. F., and Raghuram, R. (1975). VLF Line Radiation in the Earth's Magnetosphere and its Association with Power System Radiation. J. Geophys. Res. 80 (31), 4249–4258. doi:10.1029/JA080i031p04249
Kikuchi, H. (1983). Power Line Transmission and Radiation. Space Sci. Rev. 35 (1), 59–80. doi:10.1007/bf00173693
Li, X. L., Wu, J., Jin, H. B., and Li, Y. M. (2021). Development of Low-Frequency Three-Dimensional Magnetic Field Measurement System. J. Astronaut. Metrol. Meas. 41 (1), 33–39. doi:10.1109/TMI.2008.2007361
Luette, J. P., Park, C. G., and Helliwell, R. A. (1979). The Control of the Magnetosphere by Power Line Radiation. J. Geophys. Res. 84 (A6), 2657–2660. doi:10.1029/JA084iA06p02657
Manninen, J. (2005). Some Aspects of ELF-VLF Emissions in Geophysical Research. Oulu: University of Oulu. [dissertation].
Němec, F., Čížek, K., Parrot, M., Santolík, O., and Záhlava, J. (2017). Line Radiation Events Induced by Very Low Frequency Transmitters Observed by the DEMETER Spacecraft. J. Geophys. Res. Space Phys. 122, 7226–7239. doi:10.1002/2017JA024007
Němec, F., Santolík, O., Parrot, M., and Berthelier, J. J. (2007). Power Line Harmonic Radiation: A Systematic Study Using DEMETER Spacecraft. Adv. Space Res. 40 (3), 398–403. doi:10.1016/j.asr.2007.01.074
Park, C. G., and Chang, D. C. D. (1978). Transmitter Simulation of Power Line Radiation Effects in the Magnetosphere. Geophys. Res. Lett. 5 (10), 861–864. doi:10.1029/gl005i010p00861
Park, C. G., Helliwell, R. A., and Lefeuvre, F. (1983). Ground Observations of Power Line Radiation Coupled to the Ionosphere and Magnetosphere. Space Sci. Rev. 35 (2), 131–137. doi:10.1007/978-94-009-7063-2_11
Park, C. G., and Helliwell, R. A. (1978). Magnetospheric Effects of Power Line Radiation. Science 200 (4343), 727–730. doi:10.1126/science.200.4343.727
Park, C. G., and Helliwell, R. A. (1981). Power Line Radiation in the Magnetosphere. Adv. Space Res. 1 (2), 423–437. doi:10.1016/0273-1177(81)90317-3
Park, C. G., and Miller, T. R. (1979). Sunday Decreases in Magnetospheric VLF Wave Activity. J. Geophys. Res. 84 (A3), 943–950. doi:10.1029/JA084iA03p00943
Parrot, M. (1994). Observations of Power Line Harmonic Radiation by the Low-Altitude AUREOL 3 Satellite. J. Geophys. Res. 99 (A3), 3961–3969. doi:10.1029/93JA02544
Parrot, M., and Zaslavski, Y. (1996). Physical Mechanisms of Man-Made Influences on the Magnetosphere. Surv. Geophys. 17 (1), 67–100. doi:10.1007/BF01904475
Pilipenko, V., Fedorov, E., Mazur, N., and Klimov, S. (2021). Electromagnetic Pollution of Near-Earth Space by Power Line Emission. Solar-Terrestrial Phys. 7 (3), 105–113. doi:10.12737/stp-73202107
Rodger, C. J., Thomson, N. R., and Dowden, R. L. (1995). VLF Line Radiation Observed by Satellite. J. Geophys. Res. 100 (A4), 5681–5689. doi:10.1029/94JA02865
Tomizawa, I., and Yoshino, T. (1985). Power Line Radiation Observed by the Satellite "OHZORA". J. Geomagn. geoelec 37 (3), 309–327. doi:10.5636/jgg.37.309
Tsurutani, B. T., and Lakhina, G. S. (1997). Some Basic Concepts of Wave-Particle Interactions in Collisionless Plasmas. Rev. Geophys. 35 (4), 491–501. doi:10.1029/97RG02200
Walt, M. (1994). Introduction to Geomagnetically Trapped Radiation. Cambridge: Cambridge University Press.
Ward, S. H., and Hohmann, G. W. (1987). Electromagnetic Methods in Applied Geophysics. Tulsa: Society of Exploration Geophysicists.
Wu, J., Guo, Q., Yue, C., Xie, L., and Zhang, C. (2020). Special Electromagnetic Interference in the Ionosphere Directly Correlated with Power System. IEEE Trans. Electromagn. Compat. 62 (3), 947–954. doi:10.1109/TEMC.2019.2918280
Wu, J., Zhang, C., Zeng, L., and Ma, Q. (2017). Systematic Investigation of Power Line Harmonic Radiation in near‐Earth Space above China Based on Observed Satellite Data. J. Geophys. Res. Space Phys. 122 (3), 3448–3458. doi:10.1002/2016JA023131
Yearby, K. H., Smith, A. J., Kaiser, T. R., and Bullough, K. (1983). Power Line Harmonic Radiation in Newfoundland. J. Atmos. Terr. Phys. 45 (6), 409–419. doi:10.1016/S0021-9169(83)81100-3
Keywords: near-Earth electromagnetic environment, artificial ELF/VLF waves, satellite-based observation, interference in the top ionosphere, EHV/UHV power lines
Citation: Wu J, Zhang J and Xie L (2022) Uncommon Electromagnetic Radiations Related to Extra-High Voltage/Ultra-High Voltage Power Projects in China. Front. Environ. Sci. 10:902508. doi: 10.3389/fenvs.2022.902508
Received: 23 March 2022; Accepted: 21 April 2022;
Published: 05 May 2022.
Edited by:
Zeren Zhima, Ministry of Emergency Management, ChinaReviewed by:
Michel Parrot, UMR7328 Laboratoire de physique et chimie de l’environnement et de l’Espace (LPC2E), FranceVyacheslav Pilipenko, Institute of Physics of the Earth, Russia
Copyright © 2022 Wu, Zhang and Xie. This is an open-access article distributed under the terms of the Creative Commons Attribution License (CC BY). The use, distribution or reproduction in other forums is permitted, provided the original author(s) and the copyright owner(s) are credited and that the original publication in this journal is cited, in accordance with accepted academic practice. No use, distribution or reproduction is permitted which does not comply with these terms.
*Correspondence: Jing Wu, wujing06@buaa.edu.cn
 Jing Wu1*
  Jingwen Zhang