 Viktor Gabyshev
 Sophia Barinova
 Anna Ivanova
 Olga Gabysheva
 Angela Curtean-Bănăduc
- 1Institute for Biological Problems of Cryolithozone, Siberian Branch of the Russian Academy of Sciences (RAS), Yakutsk, Russia
- 2Institute of Evolution, University of Haifa, Haifa, Israel
- 3Applied Ecology Research Center, Lucian Blaga University of Sibiu, Sibiu, Romania
The Lena River forms a delta, one of the largest in the world. The entire territory of the delta is part of the Ust-Lensky State Natural Reserve. The delta is located beyond the Arctic Circle in a continuous permafrost zone. The delta is crossed by numerous channels and has lakes, streams, hollows, and swamps. In the Russian Arctic sector, ambitious plans for the development of the oil industries are being implemented. This study goal was to determine the species composition of algae in the Lena River delta and to use their properties as indicators of organic water pollution as evidence of water ecosystem stress. The results of the study revealed 700 species from 10 phyla. Statistical analysis indicate that hydrological conditions are the main factor, which can be a stressor too regulating the spatial structure of the species composition of algal communities in the Lena River delta. The distribution of groups of indicators of organic pollution, trophic state, and type of nutrition of algal cells along the main water channels suggests that now a possible source of organic pollution may be the effect of mixing river and saline waters during high tide. It is evidenced by an increase in the number of mixotrophic organisms and indicators of increased trophic state. Therefore, the integral bioindication as a method that reveals hidden connections in the ecosystem can be useful for monitoring in the period of the accentuated development of the oil industries in this Arctic region.
Introduction
Large-river deltas are important interfaces between continents and the oceans for material fluxes that have a global impact on marine biogeochemistry, their high number of habitats and biocoenosis diversity, being primarily the result of sea level fluctuations and the seasonal dynamics of the rivers and their deltas (Bănăduc et al., 2016). These systems are recorders of natural and anthropogenic environmental change. The processes in the deltas can influence flux-dissolved materials from the continents to the global ocean that can have profound impact on issues such as coastal eutrophication and the development of hypoxic zones. Deltas also record in their rapidly accumulating sediments the environmental changes such as continental-scale trends in climate and sea level change (Bianchi and Allison, 2009). In delta is where increased sedimentation, burial, organic matter deposition and their transformation that study of delta processes are important in the context of global change as recorders of it.
Objectives defined by the WFD relate to both the state and the impact, since, standards from other European water quality objective legislation relate to the concentration of pollutants in the water body (i.e., its state), while the biological elements of the WFD clearly indicate impacts (Common Implementation Strategy for the Water Framework Directive (2000/60/EC), 2003). Therefore, study of the large river catchments processes and their biota are important in the context of global change. Especial interest in this case represent the dynamic of organic matter from the river itself to the sea near the mouth across the river delta.
The Lena River, one of the largest rivers in the world, forms a delta in the mouth (about 30 thousand km2), which is the first in Russia and the third in the world in terms of area. The biodiversity of the territory of the Lena River delta and the coastal areas of the Laptev Sea are protected by the Ust’-Lena Nature Reserve and the largest Russian biosphere reserve Lena-Delta with an area of more than 60 thousand km2 (Bol’shiyanov et al., 2013). The area is rich in swamps and lakes typical of the arctic tundra. Ephemeral reservoirs (streams, hollows) are widespread, since the region is located in a zone of continuous occurrence of permafrost soils, which when thaw in the global climate changes induce a high ecological risk (Hjort et al., 2018), where there is no drainage. In the lower reaches of the Lena River, so-called marginal zones can form, where large areas of mixing of fresh and salty waters are formed, as in the lower reaches of other large Arctic rivers. In recent years, there has been an active industrial development of the region. The Rosneft’s company has been conducting seismic surveys on the shelf of the Laptev Sea since 2017 that leads to an increase in anthropogenic load. Under these conditions, the urgency of studying and maintaining the biodiversity of aquatic ecosystems in the region increases, especially in the marginal zone, where the role of ecotones is very significant, as proven by a number of researchers (Smith et al., 1997; Schilthuizen, 2000).
Data on algae in water bodies of the estuary of the Lena River were published in a number of works: the deposited manuscript of Vasil’eva and Remigailo (1986), reports of the Tiksi territorial administration for hydrometeorology and environmental monitoring (Pavlyukova, 1993a; Pavlyukova, 1993b). In these works, plankton and moss pomace were studied. Some data were also taken from works on algae in the Laptev Sea (Okolodkov, 1992; Gogorev, 1994; Okolodkov, 1998; Timofeev, 1998; Zernova et al., 2000; Druzhkova and Makarevich, 2013; Sukhanova et al., 2017). The available data were summarized with an analysis of the taxonomic composition and its spatial structure of algal communities in the lower Lena (Gabyshev et al., 2019a), a species list of algae was published also (Gabyshev et al., 2019b).
Despite the available algological studies, there is no generalization and analysis of the accumulated data. We have just begun to analyze the dynamics of salinity of waters passing through the delta (Barinova et al., 2021) using algae bioindication and statistics, especially in the global climate changes conditions in which the prognosed planet oceans and sea levels rise (Krassilov and Barinova, 2013) will affect the freshwater balance of the deltas due to salt water expected penetration. In conditions of difficult access to the study area, for example, the Lena River Delta and insufficient chemical analyses, bioindication methods, widely used to assess organic pollution (Common Implementation Strategy for the Water Framework Directive (2000/60/EC), 2003; Barinova, 2017a), can help identify impacts. Methods for indicating organic pollution and eutrophication are widely used (Sládeček, 1973; Dokulil, 2003) and especially developed for diatoms (Sládeček, 1986; Sumita, 1986). We hypothesize that bioindication of organic pollution and trophic status of waters passing through the delta can reveal factors influencing the dynamics of indicators and mechanisms of interaction of the environment on algal communities, which at this stage cannot be detected by other methods.
The aim of the work was assessing the degree of organic pollution and the trophic state of the waters of the Lena River Delta using the indicator properties of algae to identify the influence of river waters on the coastal marine areas of the Laptev Sea in permafrost stress condition.
Materials and Methods
The research is based on materials collected in September 2009 in the Lena River (region of Tit-Ary Island); in August-September 2014 in the Tiksi Bay, and the Neelovo Bay of the Laptev Sea, as well as in the lakes of the Tiksi Bay coast, the Neelovo Bay and in the Olenekskaya delta channel.
Hydrobiological material in the volume of 100 samples was taken with an Apstein plankton net (SEFAR NITEX gas, mesh size 30 μm) in the littoral and pelagic areas of water bodies from the surface water layer (0–0.3 m). The permanent diatom slides (70) preparations were made using synthetic resin BIO MOUNT by calcining their valves. The study of algological material was carried out according to generally accepted methods using microscopes “Laboval” and “Olympus BH-2”.
Water chemical analyses followed the methods set out in (Alekin et al., 1973; Semenov, 1977). Easy-to-oxidize organic substances (from biological oxygen demand, BOD) evaluated by Winkler’s method (iodometry). Data on some physicochemical parameters of lakes in the lower reaches of the Lena are given in the works of Trofimova (2013a); Trofimova (2013b).
The materials sampled in the studied area are combined into five areas in accordance with their mutual location, as well as hydrological and morphometric features of water bodies (Figure 1). The pre-delta site (Lower Lena River) includes the Lena River on a stretch from the Chekurovka village to the Stolb Island. The delta area (Lena Delta) combines observations made on the main channels: distributary channels (Olenyokskaya, Bol’shaya Trofimovskaya, Saardakhskaya, Arangastakhskaya, Bykovskaya, and Gusinka), as well as the river itself near Tyllakh River estuary and near Chay-Tumus. The coastal areas of the Laptev Sea—Neelovo Bay, Tiksi Bay, Buor-Khaya Bay (Neelova Gulf, Tiksi Bay, Buor-Khaya Gulf) and the freshened part adjacent to the delta constitute the near-shore zone. Samples from pomace of moss, tundra swamps, mountain streams, hollows in the vicinity of Tiksi Bay, Kosistyy Cape, Bykov peninsula, spurs of the Kharaulakh Range, Tit-Ary islands, Hardang-Ary Sise (Hardang-Sise), Danube (Danube Island), Arga-Muora-Sise (Erge-Muora-Sise), united in a group called “swampy areas”. We choose for current analysis data from points placed on the Lena River main stream and the mutual location on the delta itself but exclude points on the peninsula and sea area (Table 1). The length of each waterways are represented in Table 2.
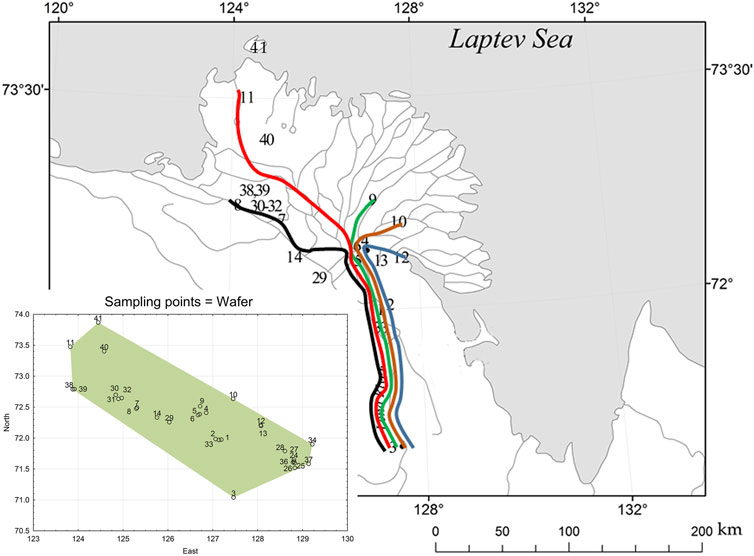
FIGURE 1. Location of study sites on the Lena River delta. Waterways marked with colored lines from west to east: Olenyokskaya (black); Arangastakskaya (red); Bol’shaya Trofimovskaya (green); Saadakhskaya (brown); Bykovskaya (blue). Full sampling points are shown on the statistical map below in coordinates.
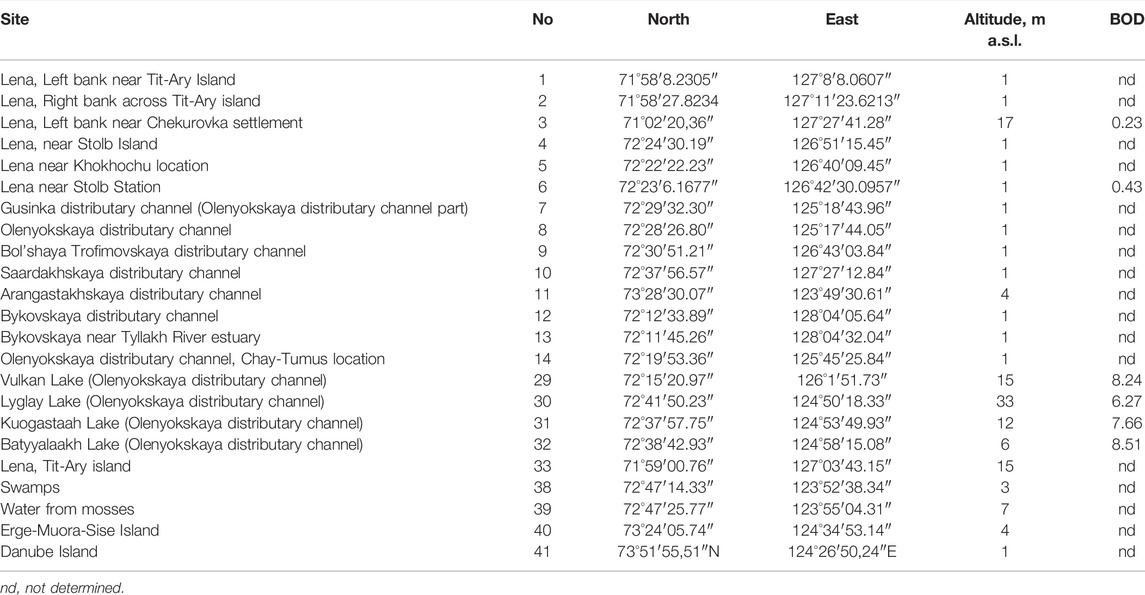
TABLE 1. Stations of sampling on the Lena River delta with their number, GPS coordinates altitude and Biological Oxygen Demand (BOD) concentration.
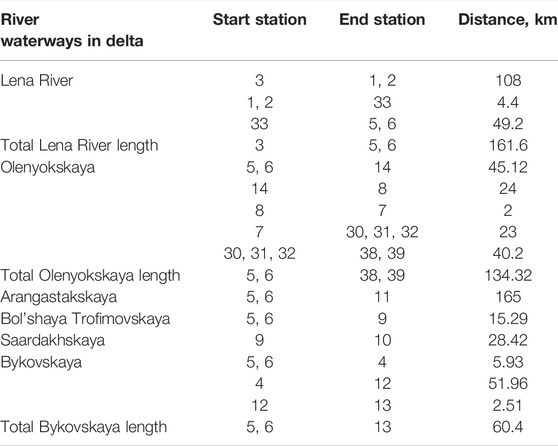
TABLE 2. The waterways length between sampling stations on the Lena River delta.
The ecological preferences of the identified species were determined using a database of indicator algae compiled and published at the Institute of Evolution, University of Haifa (Barinova et al., 2006; Barinova et al., 2019).
The statistical mapping (Barinova, 2017b), as a method recommended for use in EU countries (Dedić et al., 2020), was carried out in the Statistica 12.0 program according to each site’s parameter values and geographic coordinates. Correlation analysis was doing as the network plot in JASP (significant only) on the botnet package in R Statistica package of (Love et al., 2019). A similarity tree was constructed with the help of BioDiversity Pro 9.0 program.
Results
Chemical Variables
To analyze the dynamics of organic pollution in the delta, we have chosen two environmental parameters: the altitude of sampling points and Biological Oxygen Demand (BOD) (Table 1). As can be seen, the river delta is a flat area with an elevation gradient ranging from 1 to 33 m (Figure 2A). Several waterways for the outflow of the Lena River are laid inside the delta. Of these, five were the main ones on which samples were taken. The BOD value was not determined at every station, but it can be seen that its values ranged from 0.23 mgO2 L−1 on the main river channel to 8.51 mgO2 L−1 in the Batyyalaakh Lake (Figure 2B). We have no more data about BOD but these six stations are distributed over the all delta. From other hand, we used statistical analysis of this parameter distribution that visualized on the map and can be compared to other variables distribution maps. In general, the waters of the river itself were cleaner in organic pollution than the waters of the lakes along the Olenekskaya channel. However, it is not possible to reveal the whole view of organic pollution dynamic from Table 1 data. In this regard, we have attracted a bioindication method by algal communities.
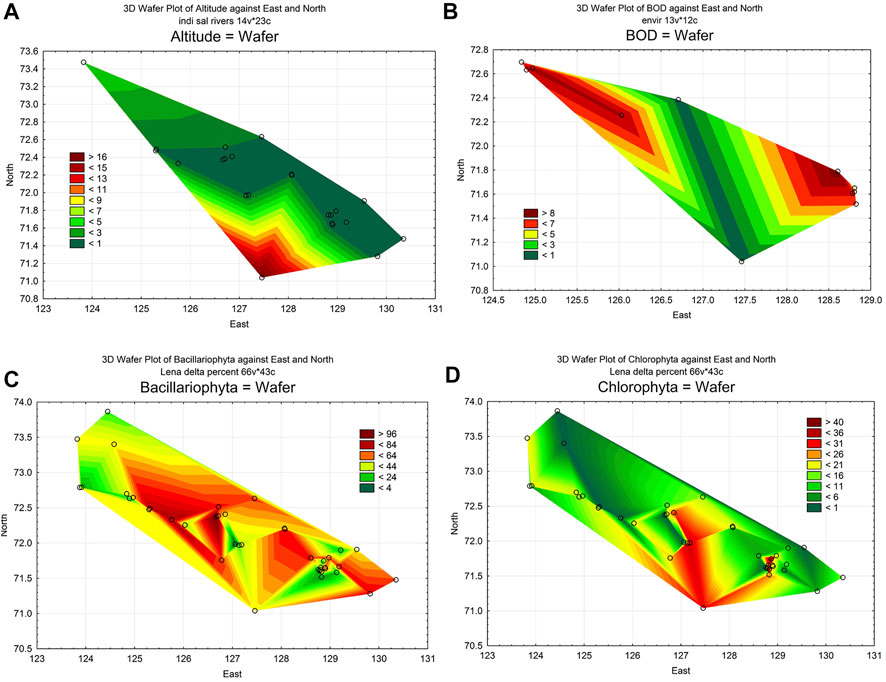
FIGURE 2. Statistical maps of the distribution of environmental variables and species number in algae communities over the area of the Lena delta. (A), distribution of station altitude for watercourses in the delta only; (B), distribution of BOD; (C), distribution of diatom species number; (D), distribution of Chlorophyta species number.
Biological Variables
Seven hundred species and varieties of microalgae belonging to 10 taxonomic phyla were identified as a results of our research for the period 2009–2014 at 22 stations and the reference data. Can be seen that number of species is very diverse on the sampling stations (Figure 3). Species richness was fluctuated in wide range and was maximal on the station 6 with 210 species. The taxonomic content of the channels communities was similar but in lakes on stations 29–32 and the swamps (33–40) was different. Bacillariophyta prevail with followed Chlorophyta species. Figures 2C,D demonstrate their distribution over the delta habitats. Both of them is related to the current of the river water across the delta but diatoms content in communities increased whereas green algae species decrease in communities close the sea.
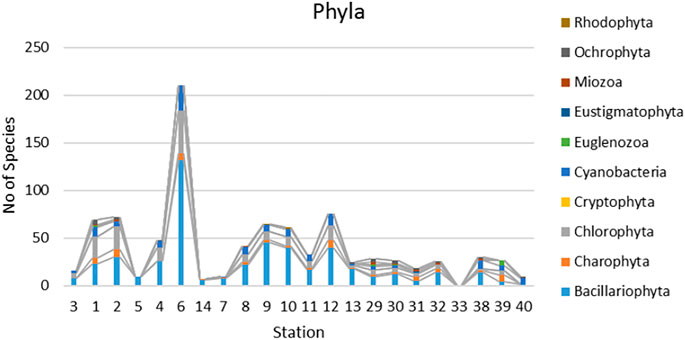
FIGURE 3. Distribution of species richness in taxonomic phyla over sampling stations on the Lena River delta. Stations stay in order of the water flow according Table 2 in the main river channel (3–6), channels that continue the main course of the river (14–13), lakes (29–32), swamps (33–40).
We carried out a comparative analysis of the species composition of the communities at the stations in order to identify the environmental variables affecting the algae communities of the delta. It turned out (Figure 4) that the communities were divided into three clusters, the first of which united the communities of the running waters of rivers and channels, and the second included communities of lakes and third of swamps. That is, hydrology can be the main factor regulating the composition of the delta algae communities.
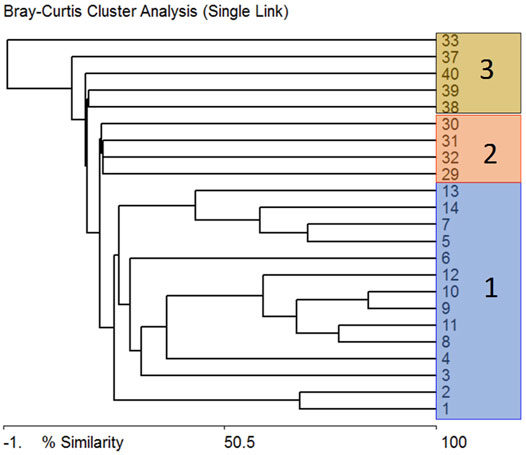
FIGURE 4. Tree of similarity of the composition of species-indicators according to Bray-Curtis at the stations of the Lena delta. Cluster 1 (blue) marked stations with flowing waters; Cluster 2 (red) marked stations with lakes; Cluster 3 (brown) marked stations with swamps.
In order to clarify the influence of external factors on the distribution of indicator species of algae, an additional correlation analysis was carried out. Three clusters were revealed (Figure 5). The first cluster includes communities of the Bol’shaya Trofimovskaya, Saardakhskaya, Arangastakhskaya, Bykovskaya, and Olenyokskaya channels (stations 8–12), which clarifies the clustering shown in Figure 4. Cluster 2 unites lakes along the Olenyokskaya channel. Cluster three includes the rest of the communities of the river itself and various habitats along it and its channels. Thus, the species composition reacts to the factor of water mobility and immobility, on the one hand, and to the constancy of the hydrological regime (true lakes), on the other.
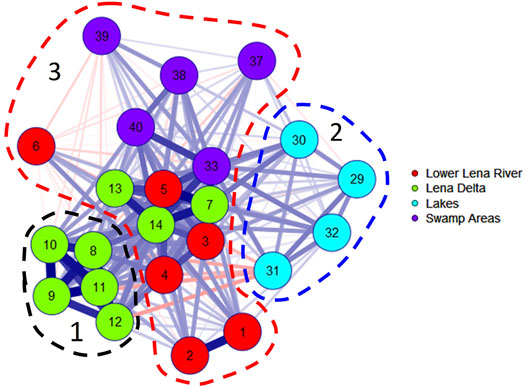
FIGURE 5. Correlation Graph of JASP for the species composition of communities on the stations of the Lena delta. Hydrologically homogeneous stations of four groups marked by a different color in the legend. The line thickness is proportionally to correlation, blue lines is positive, red lines is negative correlation. Clusters outlined by colored dashed line.
Bioindication
All revealed species were indicators of five environmental variables related to organic pollution and trophic state. Figure 6 represents of species number in each indicator group distribution over sampling stations. Can be seen prevailing of planktonic-benthic and benthic inhabitants, species number of which was higher in the flowing waters of main river and distributary channels (stations 1–14). The lakes indicators on stations 29–32 has similar distribution to the channels but the swamps (33–40) were different.
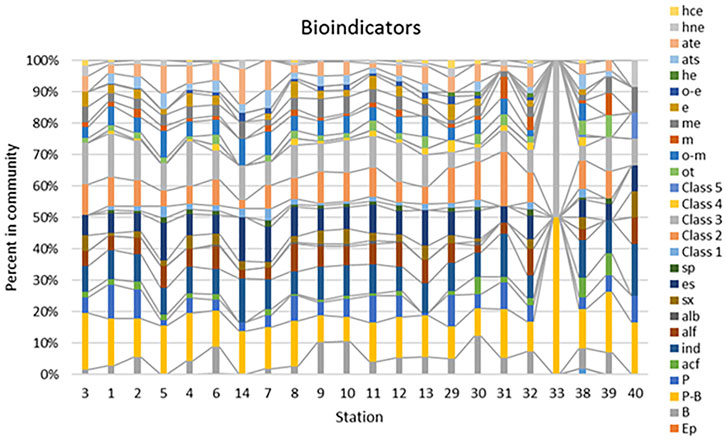
FIGURE 6. Distribution of species-indicators of substrate preferences, water pH, saprobity according Watanabe, Class of Water Quality on the base of species-specific saprobity index S, trophic state and type of nutrition in ecological groups over stations on the Lena River delta. Stations stay in order of the water flow according Table 2 in the main river channel (3–6), channels that continue the main course of the river (14–13), lakes (29–32), swamps (33–40). Abbreviation for ecological groups: Habitat preferences: B, benthic; P-B, planktonic-benthic; P, planktonic; Ep, epiphytes; S, soil. Water pH: acf, acidophilic species; ind, indifferent; alf, alkaliphilic species; alb, alkalibiontes. Organic pollution, Watanabe: sx, saproxenes, es, eurysaprobes; sp, saprophiles. Organic pollution indicators of Class 1–5 of Water Quality according of species-specific index saprobity. Trophic state: ot, oligotraphentic; o-m, oligo-mesotraphentic; m, mesotraphentic; me, meso-eutraphentic; e, eutraphentic; o-e, oligo-to eutraphentic; he, hypertraphentic. Nutrition type as Nitrogen uptake metabolism: ats, nitrogen-autotrophic taxa, tolerating very small concentrations of organically bound nitrogen; ate, nitrogen-autotrophic taxa, tolerating elevated concentrations of organically bound nitrogen; hne, facultative nitrogen-heterotrophic taxa, needing periodically elevated concentrations of organically bound nitrogen; hce, nitrogen-heterotrophic taxa, needing elevated concentrations of organically bound nitrogen.
Statistical maps of the distribution of the main bioindicator groups are shown in Figure 7. Thus, plankton-benthic species (P-B), which represent the majority in the identified communities, are distributed in accordance with water flows, decreasing their percentage in the communities in the direction from the main river channel to the sea (Figure 7A). Alkaline water indicators (alf) also reduce their participation in communities along the main streams, most clearly showing the influence of water flow through the canals (Figure 7B). Indicators of the type of nutrition, among which autotrophs predominate, withstanding the constant presence of nitrates in the water (ats), are distributed along the channels, increasing towards the sea (Figure 7C). Indicators of the predominant trophicity group—eutraphents (e), on the contrary, decrease their participation in communities. However, they also follow the channels of water flows (Figure 7D). Thus, in the distribution of indicators related to trophicity, the role of hydrology in their distribution is visible, but the direction of intensification of the influence of factors is opposite.
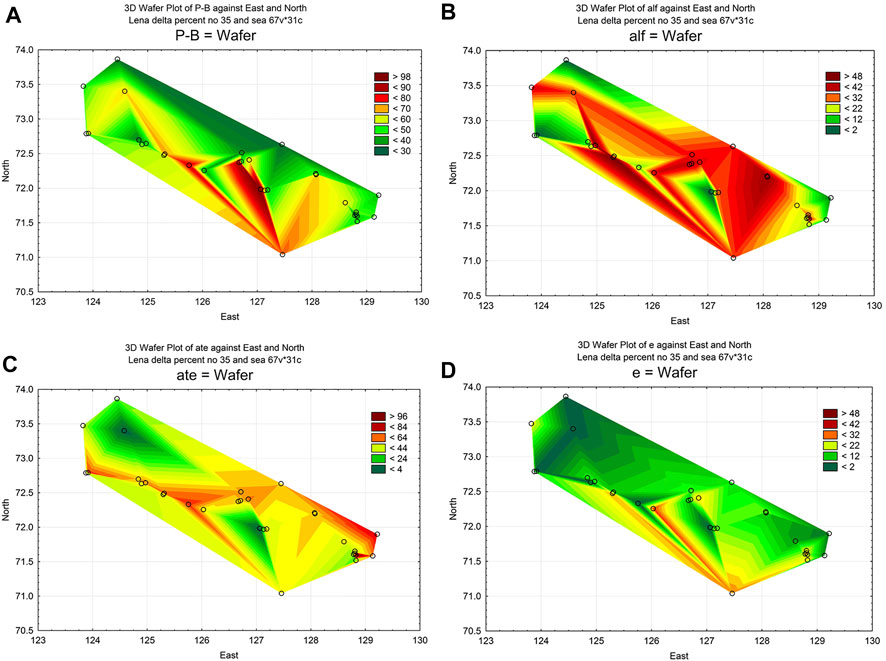
FIGURE 7. Statistical maps of the distribution of indicator species in algae communities over the area of the Lena delta. (A), Planktonic-Benthic (P-B); (B), alkaliphilic (alf); (C), autotrophic nutrition type indicators (ate); (D), eutrophic state indicators (e).
To clarify the dynamics of organic pollution in water bodies of the delta, we identified species with a species-specific saprobity index. These values have been grouped according to Water Quality Classes. Their distribution over the aquatic habitats of the delta is shown on statistical maps (Figures 8A,B). It can be seen that indicators of the Class 2 of water quality are distributed along the channels of water flows, increasing their percentage towards the coast of the delta (Figure 8A). At the same time, indicators of the 3rd class of water quality, although they follow the main waterways, but increase their presence in communities closer to the coast.
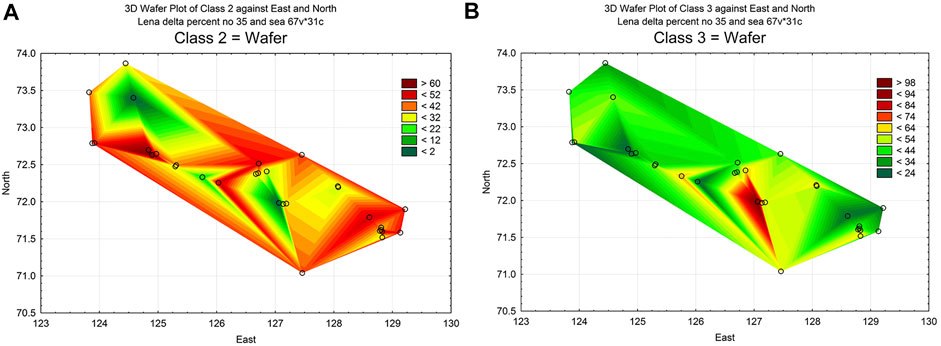
FIGURE 8. Statistical maps of the distribution of Class of water quality indicators in algae communities over the area of the Lena River delta. (A), Class 2 indicators; (B), Class 3 indicators.
In order to capture the finer dynamics of the environmental variability by indicators of water properties, histograms were constructed for water flows of the delta (Figure 1; Table 2) in relation to four groups of indicators (Figure 9). Thus, water pH species-indicators showed an increase in the proportion of alkaliphiles towards the sea on each of the five waterways. Nutrition type indicators showed an increase in the presence of autotrophs (ats and ate), while the presence of facultative heterotrophs (hne and hce) markedly decreases towards the sea on all waterways.
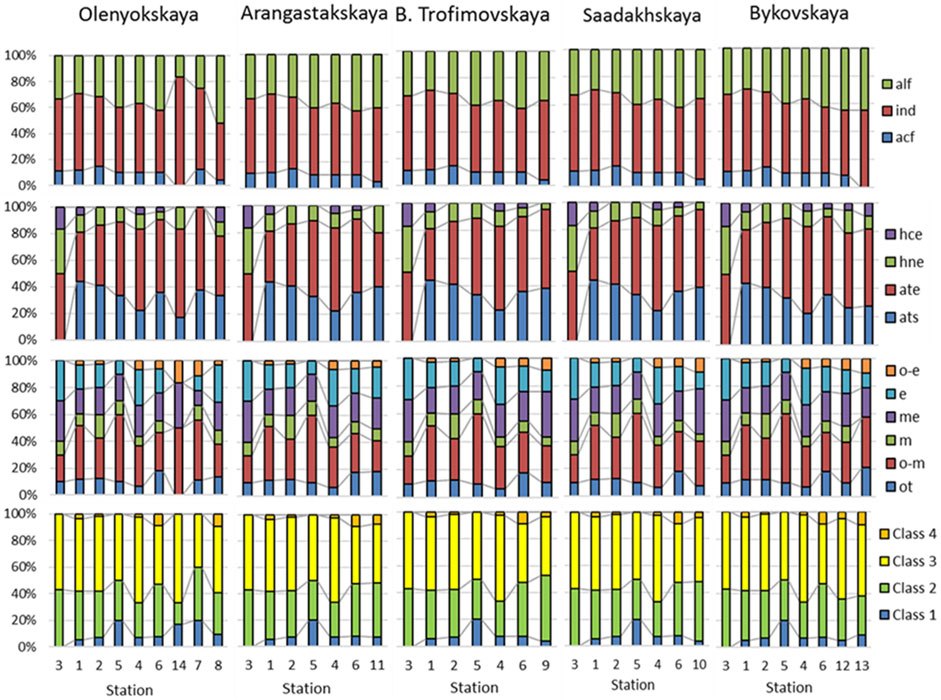
FIGURE 9. Histograms of the percentage distribution of indicator species along the waterways of the Lena delta. The waterways placed from west to east. Abbreviation of ecological groups: First row, Indicators of water pH, alf, alkaliphiles; ind, pH-indifferents; acf, acidophiles. Second row, Indicators of nutrition type as Nitrogen uptake metabolism: ats, nitrogen-autotrophic taxa, tolerating very small concentrations of organically bound nitrogen; ate, nitrogen-autotrophic taxa, tolerating elevated concentrations of organically bound nitrogen; hne, facultative nitrogen-heterotrophic taxa, needing periodically elevated concentrations of organically bound nitrogen; hce, nitrogen-heterotrophic taxa, needing elevated concentrations of organically bound nitrogen. Third row: Indicators of trophic state, ot, oligotraphentic; o-m, oligo-mesotraphentic; m, mesotraphentic; me, meso-eutraphentic; e, eutraphentic; o-e, oligo-to eutraphentic. Fourth row: Class 1–4 of organic pollution indicators according to species-specific index saprobity.
Trophic state indicators show the redistribution of the percentage of species in indicator groups on each of the waterways with distance from the main river channel. Despite the complex composition of the indicator groups, which distinguishes one channel from another, general trends can be observed. That is, as the distance from the main channel of the river, where groups of indicators of oligotrophic (ot) and mesotrophic (o-m and m) waters prevail, can be seen more and more species-indicators of higher trophicity: meso-eutrapents (me), eutrapents (e) and oligo-to eutrapents (o-e). This is most clearly seen in the example of the dynamics of indicator groups in the communities of the Arangastakskaya, Bol’shaya Trofimovskaya and Saadakhskaya waterways. It should be noted that it is these channels that are located most closely to the axis of direction of the main river flow.
The water quality class, established by the species-specific indices of saprobity, on the histograms shows an increase in the presence of indicators of the Class 4 towards the seacoast in each waterway, while the general picture of the dynamics remains quite stable along each channel.
Discussion
The study of aquatic ecosystems in the polar Arctic is associated with relative inaccessibility of habitats, as well as with a short growing season. Most often, only part of the environmental indicators can be determined during field observations, since the transportation of samples in this region also presents considerable difficulties. In this regard, the collection of biological samples and the fixation of material are of great importance. Thus, the analysis of the species composition of the collected algae can be used to assess the state of ecosystems using bioindication methods and statistics. In this case, it turns out to be possible to reveal such parameters as the trophic state and organic pollution of waters, which is very difficult to do by other methods under the prevailing conditions.
In this regards, we studied environmental variables and algae species composition in the Lena River delta during 2009–2014. Revealed diversity is high in contrast to studied delta communities in European Arctic (Barinova and Stenina, 2013). It can be result of large area of The Lena River delta (Bol’shiyanov et al., 2013). Comparison with algae diversity in the deltas of large subtropical rivers like Nile delta (Snigirova et al., 2021) demonstrated sufficient higher diversity in Arctic delta. It can be as a result not only as the largest sampled area in Lena delta but also as largest number of diatom taxa with high species richness than in Nile delta where green algae and cyanobacteria play the major role in communities. The species richness, as a result, influenced the number of indicators in each ecological group. So, we have more representative indicator base for the organic pollution dynamic conclusion for the Lena delta that for the Nile delta.
The different degrees of floristic study, which reveals the maximum number of species on the sites most accessible for research, was the problem for calculation. There severe climatic conditions and undeveloped landscape, lack of infrastructure affects the number of indicator taxa. We tried to remove this influence by calculating the percentage of participation of different groups’ indicators for each community. It turned out that, despite the differences in the total number of species, the indicators show an increase in the proportion of groups of increased organic pollution as the river approaches the coast in each waterway, as has been revealed for the Nile River delta waterways in respect of species richness and salinity (Snigirova et al., 2021). The most studied Bykovskaya channel and its surroundings have rich species list in their communities since we continued the line of stations towards the sea and therefore can show most representative results.
A statistical analysis of the similarities revealed hydrology as a regulating factor for the composition of algae communities in the Lena River delta’s studied habitats. The species composition of algae in the main channel of the Lena River has a high degree of similarity with the composition of the communities of the lower river delta and the coastal area of the sea into which the river flows. This result is understandable since, along with the river runoff, the river phytoplankton is also carried to the coastal sea area, which significantly influences the formation of microalgae communities.
The identified Figure 2B low BOD section of the delta is a continuation of the river’s main channel. It can be assumed that the organically low polluted outflow shows the paleo-channel of the river since the sea level fluctuation in this area reaches 1.5 m, and the elevation gradient on the delta is 0–4 m. It reflect also water salinity, which was higher in the west and northwest (10–14‰ and 8–10‰, respectively) (Bol’shiyanov et al., 2013).
Even though the BOD in delta waters have a gradient at the lowest level, practically at the boundary of determination, this gradient is existing (Figure 2B). It suggests that, together with the altitude gradient (Figure 2A), it may indicate the direction of river water outflow.
The statistical mapping, as a method tested on communities of continental and coastal marine ecosystems (Barinova, 2017b; Snigirova et al., 2021) and used in EU countries (Dedić et al., 2020), allows revealing hidden trends by the dynamics of the mapped indicators. Maps can reveal otherwise undetectable connections in ecosystems. In our case, statistical maps of the distribution of organic pollution indicator groups in the Lena delta allowed us to identify the next trends. The communities of flowing waters react to approaching the coast by increasing the proportion of indicators of increased of pH, autotrophic type of nutrition, high trophic state indicator groups and organic pollution indicators of Class 4 (Barinova, 2017a; Barinova, 2017c). Our previous study of algal biodiversity and productive variables study in the Arctic riverine communities show changing of species richness and abundance and biomass in climate gradients of altitude and latitude (Barinova et al., 2014; Barinova et al., 2015). The riverine deltas communities in different regions of planet are yet studied not enough in respect of species richness dynamic such as Nile delta (Salem et al., 2017; Elshobary et al., 2020), nevertheless the delta ecosystems are very important habitats for natural conservation where not only species conserve but also can be formed a new taxa (Bianchi and Allison, 2009; Popa et al., 2016). The influence of climatic parameters on the distribution of algae is studied mainly in critical habitats such as high latitudes and high altitude habitats (Yoshimura et al., 1997; Uetake et al., 2010). Our research is the first experience in the Arctic region to assess the organic pollution sources with help of algal bioindicatiors of organic pollution. Therefore, indicators distribution shows increasing of organic pollution down the watercourses but in the same time reflects high percentage of autotrophic species in communities. The sensitivity of various species to high latitude habitats also plays a role in the distribution of microalgae communities, where green algae prevail over cyanobacteria (Carson and Brown, 1976; Novakovskaya et al., 2022). In our case, the distribution of species composition confirms this conclusion, where at station 6, river and seawaters are found, but here it is also seen that the stress of the influence of seawaters leads to a sharp increase in the number of diatoms.
With increasing latitude, algae have to cope with abiotic conditions specific to such critical parameters as fluctuations in UV radiation levels, permafrost, rain and snow precipitation, extreme diurnal temperature fluctuations, and chronic nutrient deficiency (Stewart et al., 2021). Under these conditions, our study shows a significant role of diatoms, well riverine water quality indicators (Lavoie et al., 2008). They indicated an increasing in organic pollution in the zone of contact between river and seawaters by increasing of Class 4 indicators, number of mixotrophic organisms, and high eutraphentes, which is possible as a results of the change of communities and the elimination of sensitive species (Barinova et al., 2014). This reflects that the source of organic pollution may be the effect of mixing of sea and fresh waters at the delta boundary during high tide, during which the ecosystem is restructured with the elimination of some species and the prosperity of others. In this case, the organic matter of dying species is oxidized, which can be seen on the BOD statistical map (Figure 2B), because it is higher on the border areas of delta. From the other hand, this study demonstrated the self-purification capacity of the studied ecosystem in present time. However, the activity of maritime transport in the zone of stations 4–13 of the Bykovskaya distributary channel, the main port hub of Tiksi, can be a source of organic pollution also. Despite the fact that in recent years a decrease in the removal of nitrates in the Laptev Sea (Gibson et al., 2020) has been revealed, the risk of an increase in organic pollution remains relevant not only as a result of climate warming, but also as a result of the active development of newly discovered oil fields on the shelf.
Conclusion
The study showed that hydrology and as a result, salinity change is a factor regulating the species composition of microalgae communities in the Lena River delta. The stress of the influence of seawaters leads to a sharp increase in the number of diatoms in the Arctic riverine communities. The distribution of groups of organic pollution indicators along waterways shows the effect of water pollution near the sea and suggests possible sources of this effect, which could be the influence of tides. Large proportion of autotrophic species in communities reflects high ability to water self-purification in the watercourses of the delta. A mechanism for tracking the dynamics of organic pollution by distributing algal indicators has become a sensitive method that detects even small changes in environmental variables. Therefore, as an integral method, it can be useful in further monitoring the risk of pollution during the increase in oil production in Arctic region in the future.
Data Availability Statement
The raw data supporting the conclusion of this article will be made available by the authors, without undue reservation.
Author Contributions
Conceptualization, SB and VG; methodology, SB and VG; software, SB; validation, SB, VG, OG, and AI; formal analysis, SB and VG; investigation, VG, OG, and AI; resources, VG; data curation, SB, VG, and AC-B; writing—original draft preparation, SB and VG; writing—review and editing, SB and VG; visualization, SB; supervision, SB; project administration, SB; funding acquisition, SB. All authors have read and agreed to the published version of the manuscript.
Funding
The study was performed within the framework of state assignments “Vegetation of the permafrost taiga zone of Yakutia: biodiversity, environment-forming functions, protection and rational use” (No. 0297-2021-0023, Registration No. АААА-А21-121012190038-0). This work partly supported by the Israeli Ministry of Aliyah and Integration. The publication of this paper was partly supported by Ecotur Sibiu, Romania. The work was performed using the equipment of the Shared core facilities of the Federal Research Center “Yakutsk Science Center SB RAS” (grant no. 13.SCF.21.0016).
Conflict of Interest
The authors declare that the research was conducted in the absence of any commercial or financial relationships that could be construed as a potential conflict of interest.
Publisher’s Note
All claims expressed in this article are solely those of the authors and do not necessarily represent those of their affiliated organizations, or those of the publisher, the editors and the reviewers. Any product that may be evaluated in this article, or claim that may be made by its manufacturer, is not guaranteed or endorsed by the publisher.
References
Alekin, O. A., Semenov, A. D., and Skopintsev, B. A. (1973). Rukovodstvo Po Khimicheskomu Analizu Poverkhnostnykh Vod Sushy (Manual on Chemical Analysis of Land Surface Waters). Leningrad, RussiaLeningrad, Russia: Gidrometeoizdat, 269. (In Russian).
Bănăduc, D., Rey, S., Trichkova, T., Lenhardt, M., and Curtean-Bănăduc, A. (2016). The Lower Danube River-Danube Delta-North West Black Sea: A Pivotal Area of Major Interest for the Past, Present and Future of its Fish Fauna--A Short Review. Sci. Total Environ. 545-546, 137–151. doi:10.1016/j.scitotenv.2015.12.058
Barinova, S., ilous, O., and Tsarenko, P. M. (2019). Algoindikaziya Vodnykh Objektov Ukrainy: Metody I Perspectivy (Algoindication of Water Bodies in Ukraine: Methods and Perspectives). UkraineHaifa, Kiev, Israel, Ukraine: Haifa University Publishing House, 367. (in Russian).
Barinova, S. (2017a). Essential and Practical Bioindication Methods and Systems for the Water Quality Assessment. Int. J. Environ. Sci. Nat. Resour. 2 (3), 1–11. doi:10.19080/ijesnr.2017.02.555588
Barinova, S. (2017b). Ecological Mapping in Application to Aquatic Ecosystems BioIndication: Problems and Methods. Int. J. Environ. Sci. Nat. Resour. 3 (2), 1–7. doi:10.19080/ijesnr.2017.03.555608
Barinova, S. (2017c). On the Classification of Water Quality from an Ecological Point of View. Int. J. Environ. Sci. Nat. Resour. 2 (2), 1–8. doi:10.19080/ijesnr.2017.02.555581
Barinova, S., Gabyshev, V., Boboev, M., Kukhaleishvili, L., and Bilous, O. (2015). Algal Indication of Climatic Gradients. Am. J. Environ. Prot. Spec. Issue Appl. Ecol. Probl. Innov. 4 (3-1), 72–77. doi:10.11648/j.ajep.s.2015040301.22
Barinova, S., Gabyshev, V., and Gabysheva, O. (2014). Climate Impact of Freshwater Biodiversity: General Patterns in Extreme Environments of North-Eastern Siberia (Russia). Br. J. Environ. Clim. Change. 4 (4), 423–443. doi:10.9734/bjecc/2014/9530
Barinova, S. S., Gabyshev, V. A., Ivanova, A. P., and Gabysheva, O. I. (2021). Bioindication of the Water Salinity Dynamics by the Microalgae Communities in the Lena River Delta, Laptev Sea, Russian Arctic. Mar. Biol. J. 6 (3), 15–28. doi:10.21072/mbj.2021.06.3.02
Barinova, S. S., Medvedeva, L. A., and Anisimova, O. V. (2006). Bioraznoobrazie Vodoroslei-Indikatorov Okruzhayushchei Sredy (Diversity of Algal Indicators in the Environmental assessmentBiodiversity of Environmental Indicator algae).; Tel Aviv, Israel: Pilies Studio. Tel Aviv-Yafo: Tel Aviv, Israel, 498. (in Russian).
Barinova, S., and Stenina, A. (2013). Diatom Diversity and Ecological Variables in the Arctic Lakes of the Kostyanoi Nos Cape (Nenetsky Natural Reserve, Russian North). Plant Biosyst. - Int. J. Deal. all Aspects Plant Biol. 147 (2), 397–410. doi:10.1080/11263504.2012.749956
Bianchi, T. S., and Allison, M. A. (2009). Large-river Delta-Front Estuaries as Natural "recorders" of Global Environmental Change. Proc. Natl. Acad. Sci. U.S.A. 106 (20), 8085–8092. doi:10.1073/pnas.0812878106
Bol'shiyanov, D., Makarov, A. S., Shnaider, V., and Shtof, G. (2013). Proiskhozhdenie i razvitie del'ty reki Leny (The origin and development of the Lena river delta). Saint Petersburg, Russia: AANII. (in Russian).
Carson, J. L., and Brown, R. M. (1976). The Correlation of Soil Algae, Airborne Algae, and Fern Spores with Meteorological Conditions on the Island of Hawaii. Pac. Sci. 30 (2), 197–205.
Common Implementation Strategy for the Water Framework Directive (2000/60/Ec) (2003). Guidance Document No 3. Analysis of Pressures and Impacts Produced by Working Group 2.1. Luxembourg: Impress, Office for Official Publications of the European Communities, 14.
Dedić, A., Gerhardt, A., Kelly, M. G., Stanić-Koštroman, S., Šiljeg, M., Kalamujić Stroil, B., et al. (2020). Innovative Methods and Approaches for WFD: Ideas to Fill Knowledge Gaps in Science and Policy. Water Solutions 3, 30–42.
Dokulil, M. T. (2003). Chapter 9 Algae as Ecological Bio-Indicators. Trace Met. Other Contam. Environ. 6, 285–327. doi:10.1016/s0927-5215(03)80139-x
Druzhkova, E. I., and Makarevich, P. R. (2013). Issledovaniya Fitoplakntona Morya Laptevykh: Istoriya I Sovremennost' (Research of Phytoplaknthon in the Laptev Sea: History and Modernity). Trans. Kola Sci. Centre RAS 114, 71. (in Russian).
Elshobary, M. E., Essa, D. I., Attiah, A. M., Salem, Z. E., and Qi, X. (2020). Algal Community and Pollution Indicators for the Assessment of Water Quality of Ismailia Canal, Egypt. Stoch. Environ. Res. Risk Assess. 34, 1089–1103. doi:10.1007/s00477-020-01809-w
Gabyshev, V. A., Tsarenko, P. M., and Ivanova, A. P. (2019a). Diversity and Features of the Spatial Structure of Algal Communities of Water Bodies and Watercourses in the Lena River Estuary. Inland Water Biol. 12, 1S1–9. doi:10.1134/S1995082919050067
Gabyshev, V. A., Tsarenko, P. M., and Ivanova, A. P. (2019b). “Vodorosli Ust'evoi Oblasti Reki Lena. In Bioresursy Ust'-Lenskogo Zapovednika: Griby, Vodorosli, Rastitel'nost', Ryby, Ptitsy, Ovtsebyki (Algae of Mouth Area of Lena River,” in The Biological Resources of the Ust-Lensky Nature Reserve: Fungi, Algae, Vegetation, Fishes, Birds, Muskoxen). Editor E. G. Nikolin (Novosibirsk, Russia: Nauka), 14–35. (in Russian).
Gibson, G., Weijer, W., Jeffery, N., and Wang, S. (2020). Relative Impact of Sea Ice and Temperature Changes on Arctic Marine Production. J. Geophys. Res. Biogeosciences 125, e2019JG005343. doi:10.1029/2019jg005343
Gogorev, R. M. (1994). “Nekotorye Osobennosti Gorizontal'nogo Raspredeleniya Fitoplanktona V More Laptevykh (Avgust–sentyabr' 1993 g.),” in Nauchnye Rezul'taty Ekspeditsii LAPEKS-93 (Some Features of the Horizontal Distribution of Phytoplankton in the Laptev Sea (August – September 1993) (Saint Petersburg, Russia: Gidrometeoizdat), 337–352. Scientific results of the LAPEX-93 expedition)(in Russian).
Hjort, J., Karjalainen, O., Aalto, J., Westermann, S., Romanovsky, V. E., Nelson, F. E., et al. (2018). Degrading Permafrost Puts Arctic Infrastructure at Risk by Mid-century. Nat. Commun. 9, 5147. doi:10.1038/s41467-018-07557-4
Krassilov, V., and Barinova, S. (2013). Sea Level − Geomagnetic Polarity Correlation as Consequence of Rotation Geodynamics. Earth 2, 1. doi:10.11648/j.earth.20130201.11
Lavoie, I., Campeau, S., Darchambeau, F., Cabana, G., and Dillon, P. J. (2008). Are Diatoms Good Integrators of Temporal Variability in Stream Water Quality? Freshw. Biol. 53, 827–841. doi:10.1111/j.1365-2427.2007.01935.x
Love, J., Selker, R., Marsman, M., Jamil, T., Dropmann, D., Verhagen, A. J., et al. (2019). JASP: Graphical Statistical Software for Common Statistical Designs. J. Statistic Softw. 88 (2), 1–17. doi:10.18637/jss.v088.i02
Novakovskaya, I. V., Patova, E. N., Dubrovskiy, Y. A., Novakovskiy, A. B., and Kulyugina, E. E. (2022). Distribution of Algae and Cyanobacteria of Biological Soil Crusts along the Elevation Gradient in Mountain Plant Communities at the Northern Urals (Russian European Northeast). J. Mt. Sci. 19 (3), 637–646. doi:10.1007/s11629-021-6952-7
Okolodkov, Y. B. (1998). A Checklist of Dinoflagellates Recorded from the Russian Arctic Seas. Sarsia 83 (4), 267–292. doi:10.1080/00364827.1998.10413687
Okolodkov, Yu. B. (1992). Vodorosli L'dov Morya Laptevykh (Algae of the Ice of the Laptev Sea). Nov. Sist. Nizshikh Rastenii. 28, 29–34. (in Russian).
Pavlyukova, T. I. (1993a). Fitoplankton. Ezhegodnik Kachestva Poverkhnostnykh Vod Po Gidrobiologicheskim Pokazatelyam Na Territorii Deyatel'nosti Tiksinskogo UGMS Za 1992 G. (Yearbook of Surface Water Quality in Terms of Hydrobiological Indicators in the Territory of the Tiksi’s HMD for 1992.), 7–9. Tiksi, Russia: Tiksi’s HMD, 23–31. (in Russian).
Pavlyukova, T. I. (1993b). Fitoplankton. Obzor Sostoyaniya Zagryazneniya Morskoi Sredy V Zone Deyatel'nosti Tiksinskogo UGMS Po Gidrobiologicheskim Pokazatelyam Za 1992 G. (Review of the State of Pollution of the Marine Environment in the Area of Activity of the Tiksi’s HMD by Hydrobiological Indicators for 1992). Tiksi, Russ. Tiksi’s HMD. 23, 56–68. (in Russian).
Popa, G.-O., Curtean-Bănăduc, A., Bănăduc, D., Florescu, I. E., Burcea, A., Dudu, A., et al. (2016). Molecular Markers Reveal Reduced Genetic Diversity in Romanian Populations of Brown Trout, Salmo trutta L., 1758 (Salmonidae). Acta Zool. Bulg. 68 (3), 399–406.
Salem, Z., Ghobara, M., and El Nahrawy, A. A. (2017). Spatio-temporal Evaluation of the Surface Water Quality in the Middle Nile Delta Using Palmer's Algal Pollution Index. Egypt. J. Basic Appl. Sci. 4 (3), 219–226. doi:10.1016/j.ejbas.2017.05.003
Schilthuizen, M. (2000). Ecotone: Speciation-Prone. Trends Ecol. Evol. 15 (4), 130–131. doi:10.1016/S0169-5347(00)01839-5
Semenov, A. D. (1977). Rukovodstvo Po Khimicheskomu Analizu Poverkhnostnykh Vod Sushi (Manual on Chemical Analysis of Land Surface Waters). Leningrad, Russia: GidrometeoizdatGidrometeoizdat, 540. (In Russian).
Sládeček, V. (1973). System of Water Quality from the Biological Point of View. Arch. Für Hydrobiol. – Beih. Ergeb. Der Limnol. 7, 218.
Sládeček, V. (1986). Diatoms as Indicators of Organic Pollution. Acta hydroch. Hydrobiol. 14, 555–566.
Smith, T. B., Wayne, R. K., Girman, D. J., and Bruford, M. W. (1997). A Role for Ecotones in Generating Rainforest Biodiversity. Science 276, 1855–1857. doi:10.1126/science.276.5320.1855
Snigirova, A., Bogatova, Y., and Barinova, S. (2021). Assessment of River-Sea Interaction in the Danube Nearshore Area (Ukraine) by Bioindicators and Statistical Mapping. Land 10 (3), 310. doi:10.3390/land10030310
Stewart, A., Rioux, D., Boyer, F., Gielly, L., Pompanon, F., Saillard, A., et al. (2021). Altitudinal Zonation of Green Algae Biodiversity in the French Alps. Front. Plant Sci. 12, 679428. doi:10.3389/fpls.2021.679428
Sukhanova, I. N., Flint, M. V., Georgieva, E. Yu., Lange, E. K., Kravchishina, M. D., Demidov, A. B., et al. (2017). Struktura Soobshchestv Fitoplanktona V Vostochnoi Chasti Morya Laptevykh (The Structure of Phytoplankton Communities in the Eastern Part of the Laptev Sea). Okeanologiya 57 (1), 86–102. (in Russian). doi:10.7868/S0030157417010208
Sumita, M. (1986). A Numerical Water Quality Assessment of Rivers in Hokuriku District Using Epilithic Diatom Assemblage in River Bed as a Biological Indicator. (II) the Values of RPID in Surveyed Rivers. Diatom. Jpn. J. Diatomol. 2, 9–18.
Timofeev, S. F. (1998). “Pelagicheskaya Ekosistema Morya Laptevykh. In Biologiya I Okeanografiya Karskogo I Barentsova Morei (Po Trasse Sevmorputi) Pelagic Ecosystem of the Laptev Sea,” in Biology and Oceanography of the Kara and Barents Seas (Along the Northern Sea Route) Apatity, Russia: Izdatelstvo Kol'sk. Nauch. Tsentra RAN, 75–88. (in Russian).
Trofimova, T. P. (2013a). “Ekologo-gidrokhimicheskoe Sostoyanie Ozer Severa Yakutii,” in Ekologiya Rossii: Na Puti K Innovatsiyam: Mezhvuzovskii Sbornik Nauchnykh Trudov (Ecological and Hydrochemical State of the Lakes of the North of Yakutia (Astrakhan, Russia: Ecology of Russia: on the way to innovations: interuniversity collection of scientific papers). Astrakhan, Russia: Izdatelstvo Nizhnevolzhskogo ekotsentra(in Russian).
Trofimova, T. P. (2013b). “Sovremennoe Sostoyanie Ozer Severa Yakutii Po Gidrokhimicheskim Pokazatelyam. Geografiya: Innovatsii V Nauke I Obrazovanii: Materialy Ezhegodnoi Mezhdunar. NPK LXVI Gertsenovskie Chteniya (The Current State of the Lakes of the North of Yakutia in Terms of Hydrochemical Indicators,” in Geography: Innovations in Science and Education: Materials of the Annual Intern. NPK LXVI Herzen Readings) (Asterion: Saint Petersburg, Russia: Asterion.), 200–202. (in Russian).
Uetake, J., Naganuma, T., Hebsgaard, M. B., Kanda, H., and Kohshima, S. (2010). Communities of Algae and Cyanobacteria on Glaciers in West Greenland. Polar Sci. 4 (1), 71–80. doi:10.1016/j.polar.2010.03.002
Vasil'eva, I. I., and Remigailo, P. A. (1986). Flora presnovodnykh vodoroslei Lenskoi del'ty (Flora of freshwater algae in the Lena delta). Russia: Yakutsk. (in Russian).
Yoshimura, Y., Kohshima, S., and Ohtani, S. (1997). A Community of Snow Algae on a Himalayan Glacier: Change of Algal Biomass and Community Structure with Altitude. Arct. Alp. Res. 29 (1), 126–137. doi:10.1080/00040851.1997.12003222
Zernova, V. V., Nyutik, E. M., and Shevchenko, V. P. (2000). Vertikal'nye Potoki Mikrovodoroslei V Severnoi Chasti Morya Laptevykh (Po Dannym Godichnoi Postanovki Sedimentatsionnoi Lovushki) (Vertical Streams of Microalgae in the Northern Part of the Laptev Sea (According to the Data of the Annual Setting of the Sedimentation Trap)). Okeanologiya 40 (6), 850–858. (in Russian).
Keywords: algae, bioindication, organic pollution, statistical mapping, large river delta, Lena River in Russian Arctic
Citation: Gabyshev V, Barinova S, Ivanova A, Gabysheva O and Curtean-Bănăduc A (2022) The Indicator Role of Algae in Assessing the Organic Pollution in the Lena River Delta, the Russian Arctic. Front. Environ. Sci. 10:921819. doi: 10.3389/fenvs.2022.921819
Received: 16 April 2022; Accepted: 01 June 2022;
Published: 20 June 2022.
Edited by:
Qinghua Cai, Institute of Hydrobiology (CAS), ChinaReviewed by:
Yuying Li, Nanyang Normal University, ChinaYaoyang Xu, Institute of Urban Environment (CAS), China
Copyright © 2022 Gabyshev, Barinova, Ivanova, Gabysheva and Curtean-Bănăduc. This is an open-access article distributed under the terms of the Creative Commons Attribution License (CC BY). The use, distribution or reproduction in other forums is permitted, provided the original author(s) and the copyright owner(s) are credited and that the original publication in this journal is cited, in accordance with accepted academic practice. No use, distribution or reproduction is permitted which does not comply with these terms.
*Correspondence: Sophia Barinova, c29waGlhQGV2by5oYWlmYS5hYy5pbA==